Estimated zip code population in 2022: 5,011 Zip code population in 2010: 4,762 Zip code population in 2000: 4,349
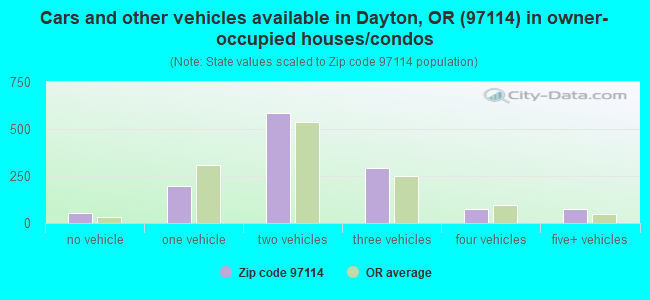
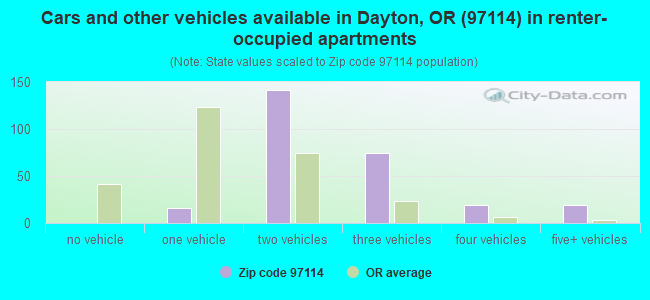
Houses and condos: 1,618 Renter-occupied apartments: 279
% of renters here:
18%
State:
37%
March 2022 cost of living index in zip code 97114: 102.4 (near average, U.S. average is 100)
Land area: 57.3 sq. mi. Water area: 1.1 sq. mi.
Population density: 87 people per square mile
(very low).
OSM Map
General Map
Google Map
MSN Map
OSM Map
General Map
Google Map
MSN Map
OSM Map
General Map
Google Map
MSN Map
OSM Map
General Map
Google Map
MSN Map
Please wait while loading the map...
Real estate property taxes paid for housing units in 2022:
This zip code:
0.7% ($3,181)
Oregon:
0.8% ($3,646)
Median real estate property taxes paid for housing units with mortgages in 2022: $3,201 (0.7%) Median real estate property taxes paid for housing units with no mortgage in 2022: $3,133 (0.7%)
Business Search- 14 Million verified businesses
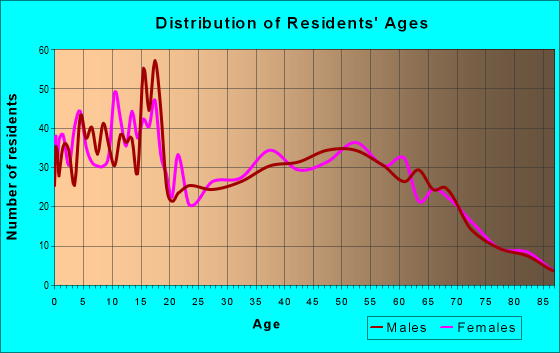
Males: 2,600
(51.9%)
Females: 2,411
(48.1%)
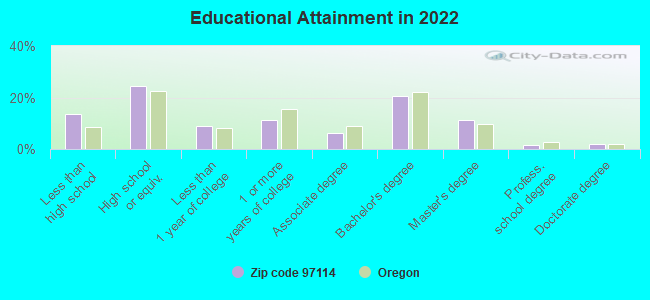
For population 25 years and over in 97114:
High school or higher: 87.5%
Bachelor's degree or higher: 35.9%
Graduate or professional degree: 15.2%
Unemployed: 6.9%
Mean travel time to work (commute): 26.1 minutes
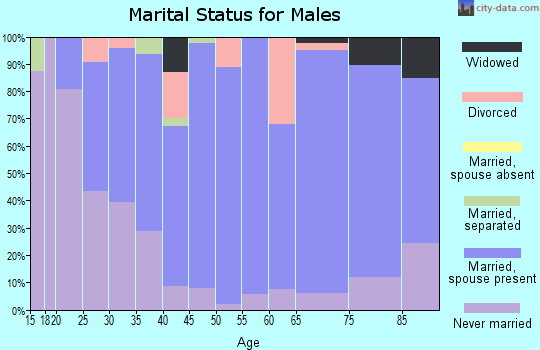
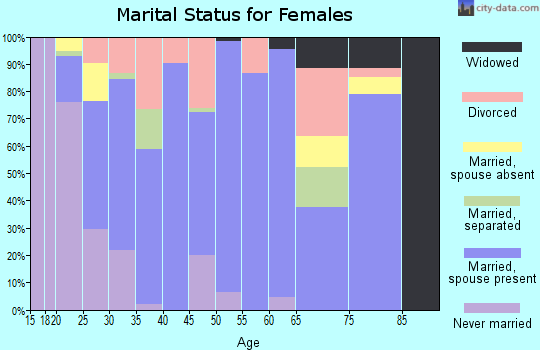
For population 15 years and over in 97114:
Never married: 29.8%
Now married: 55.7%
Separated: 0.9%
Widowed: 7.1%
Divorced: 6.5%
Zip code 97114 compared to state average:
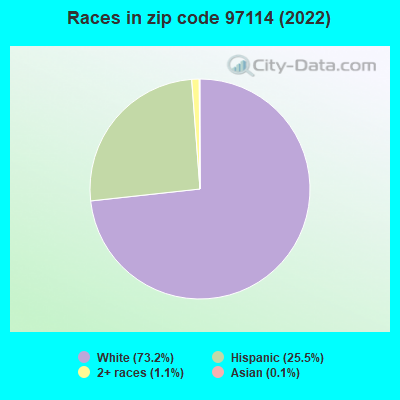
Black race population percentage significantly below state average.
Hispanic race population percentage above state average.
Renting percentage below state average.
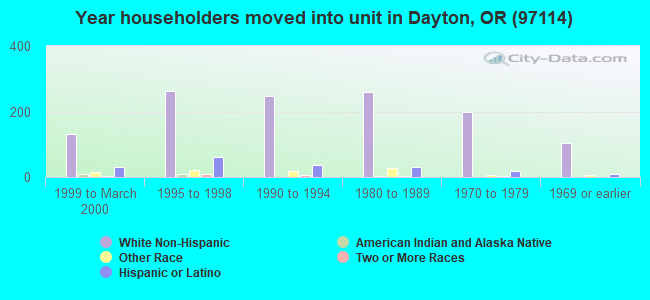
Length of stay since moving in significantly above state average.
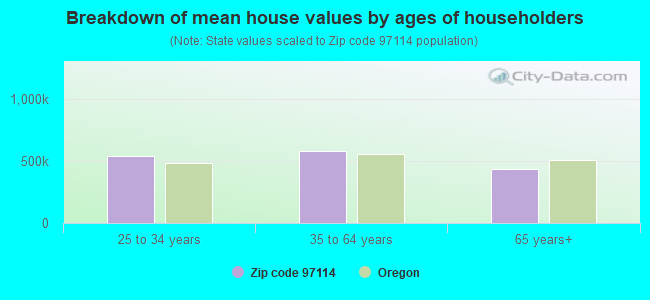
Estimated median house/condo value in 2022: $450,870
97114:
$450,870
Oregon:
$475,600
According to our research of Oregon and other state lists, there was 1 registered sex offender living in 97114 zip code as of April 26, 2024. The ratio of all residents to sex offenders in zip code 97114 is 4,997 to 1. The ratio of registered sex offenders to all residents in this zip code is lower than the state average.
Median resident age:
This zip code:
40.5 years
Oregon median age:
40.5 years
Average household size:
This zip code:
3.2 people
Oregon:
2.4 people
Averages for the 2020 tax year for zip code 97114, filed in 2021:
Average Adjusted Gross Income (AGI) in 2020: $64,545 (Individual Income Tax Returns)
Here:
$64,545
State:
$76,001
Salary/wage: $53,996 (reported on 82.5% of returns)
Here:
$53,996
State:
$61,959
(% of AGI for various income ranges: 1270.4% for AGIs below $25k, 3928.6% for AGIs $25k-50k, 7338.9% for AGIs $50k-75k, 11141.3% for AGIs $75k-100k, 17457.6% for AGIs $100k-200k)
Taxable interest for individuals: $1,505 (reported on 27.4% of returns)
This zip code:
$1,505
Oregon:
$1,628
(% of AGI for various income ranges: 19.8% for AGIs below $25k, 14.8% for AGIs $25k-50k, 25.6% for AGIs $50k-75k, 68.7% for AGIs $75k-100k, 247.6% for AGIs $100k-200k)
Ordinary dividends: $3,313 (reported on 12.8% of returns)
Here:
$3,313
State:
$7,165
(% of AGI for various income ranges: 27.7% for AGIs below $25k, 25.5% for AGIs $25k-50k, 51.9% for AGIs $50k-75k, 75.3% for AGIs $75k-100k, 217.6% for AGIs $100k-200k)
Net capital gain/loss in AGI: +$10,003 (reported on 13.7% of returns)
Here:
+$10,003
State:
+$23,403
(% of AGI for various income ranges: 7.7% for AGIs below $25k, 22.5% for AGIs $25k-50k, 31.5% for AGIs $50k-75k, 140.7% for AGIs $75k-100k, 742.9% for AGIs $100k-200k)
Profit/loss from business: +$12,022 (reported on 13.7% of returns)
Here:
+$12,022
State:
+$16,511
(% of AGI for various income ranges: 69.1% for AGIs below $25k, 136.1% for AGIs $25k-50k, 150.4% for AGIs $50k-75k, 350.0% for AGIs $75k-100k, 1171.8% for AGIs $100k-200k)
Taxable individual retirement arrangement distribution: $19,341 (reported on 9.4% of returns)
97114:
$19,341
Oregon:
$20,730
(% of AGI for various income ranges: 80.4% for AGIs below $25k, 95.0% for AGIs $25k-50k, 311.9% for AGIs $50k-75k, 297.3% for AGIs $75k-100k, 1277.1% for AGIs $100k-200k)
Total itemized deductions: $29,109 (reported on 9.8% of returns)
Here:
$29,109
State:
$31,050
(% of AGI for various income ranges: 230.7% for AGIs $25k-50k, 322.6% for AGIs $50k-75k, 699.3% for AGIs $75k-100k, 1475.9% for AGIs $100k-200k)
Charity contributions: $6,433 (reported on 6.4% of returns)
Here:
$6,433
State:
$8,791
(% of AGI for various income ranges: 44.3% for AGIs $25k-50k, 80.0% for AGIs $75k-100k, 279.4% for AGIs $100k-200k)
Taxes paid: $7,791 (reported on 9.8% of returns)
97114:
$7,791
State:
$8,487
(% of AGI for various income ranges: 43.6% for AGIs $25k-50k, 108.9% for AGIs $50k-75k, 214.0% for AGIs $75k-100k, 423.5% for AGIs $100k-200k)
Earned income credit: $2,132 (reported on 12.0% of returns)
Here:
$2,132
State:
$1,977
(% of AGI for various income ranges: 64.7% for AGIs below $25k, 66.6% for AGIs $25k-50k)
Percentage of individuals using paid preparers for their 2020 taxes: 92.7%
Here:
93%
State:
93%
(% for various income ranges: 91.3% for AGIs below $25k, 91.5% for AGIs $25k-50k, 92.7% for AGIs $50k-75k, 96.0% for AGIs $75k-100k, 96.9% for AGIs $100k-200k, 87.5% for AGIs over 200k)
Averages for the 2012 tax year for zip code 97114, filed in 2013:
Average Adjusted Gross Income (AGI) in 2012: $49,721 (Individual Income Tax Returns)
Here:
$49,721
State:
$57,845
Salary/wage: $40,994 (reported on 85.0% of returns)
Here:
$40,994
State:
$47,723
(% of AGI for various income ranges: 76.1% for AGIs below $25k, 80.4% for AGIs $25k-50k, 77.5% for AGIs $50k-75k, 72.6% for AGIs $75k-100k, 74.2% for AGIs $100k-200k, 32.2% for AGIs over 200k)
Taxable interest for individuals: $1,498 (reported on 24.3% of returns)
This zip code:
$1,498
Oregon:
$1,848
(% of AGI for various income ranges: 1.1% for AGIs below $25k, 0.5% for AGIs $25k-50k, 0.5% for AGIs $50k-75k, 0.9% for AGIs $75k-100k, 1.0% for AGIs $100k-200k, 0.6% for AGIs over 200k)
Ordinary dividends: $2,641 (reported on 14.1% of returns)
Here:
$2,641
State:
$5,987
(% of AGI for various income ranges: 1.5% for AGIs below $25k, 0.6% for AGIs $25k-50k, 0.6% for AGIs $50k-75k, 0.5% for AGIs $75k-100k, 0.5% for AGIs $100k-200k, 1.3% for AGIs over 200k)
Net capital gain/loss in AGI: +$10,008 (reported on 11.7% of returns)
Here:
+$10,008
State:
+$13,095
(% of AGI for various income ranges: 0.2% for AGIs $50k-75k, 1.4% for AGIs $75k-100k, 2.0% for AGIs $100k-200k, 11.8% for AGIs over 200k)
Profit/loss from business: +$9,765 (reported on 12.6% of returns)
Here:
+$9,765
State:
+$13,871
(% of AGI for various income ranges: 4.4% for AGIs below $25k, 1.6% for AGIs $25k-50k, 2.7% for AGIs $50k-75k, 1.6% for AGIs $75k-100k, 4.5% for AGIs $100k-200k)
Taxable individual retirement arrangement distribution: $14,961 (reported on 8.7% of returns)
97114:
$14,961
Oregon:
$16,036
(% of AGI for various income ranges: 2.3% for AGIs below $25k, 2.6% for AGIs $25k-50k, 2.0% for AGIs $50k-75k, 3.8% for AGIs $75k-100k, 4.2% for AGIs $100k-200k)
Total itemized deductions: $21,448 (24% of AGI, reported on 33.5% of returns)
Here:
$21,448
State:
$24,430
Here:
23.7% of AGI
State:
23.2% of AGI
(% of AGI for various income ranges: 11.7% for AGIs below $25k, 10.6% for AGIs $25k-50k, 14.1% for AGIs $50k-75k, 18.1% for AGIs $75k-100k, 18.7% for AGIs $100k-200k, 11.2% for AGIs over 200k)
Charity contributions: $2,982 (reported on 27.2% of returns)
Here:
$2,982
State:
$3,648
(% of AGI for various income ranges: 0.9% for AGIs below $25k, 1.2% for AGIs $25k-50k, 1.8% for AGIs $50k-75k, 1.7% for AGIs $75k-100k, 2.3% for AGIs $100k-200k, 1.5% for AGIs over 200k)
Taxes paid: $8,032 (reported on 33.5% of returns)
97114:
$8,032
State:
$10,269
(% of AGI for various income ranges: 1.6% for AGIs below $25k, 2.7% for AGIs $25k-50k, 4.4% for AGIs $50k-75k, 6.2% for AGIs $75k-100k, 8.1% for AGIs $100k-200k, 8.2% for AGIs over 200k)
Earned income credit: $2,300 (reported on 18.4% of returns)
Here:
$2,300
State:
$2,021
(% of AGI for various income ranges: 5.9% for AGIs below $25k, 1.5% for AGIs $25k-50k)
Percentage of individuals using paid preparers for their 2012 taxes: 51.0%
Here:
51%
State:
47%
(% for various income ranges: 43.0% for AGIs below $25k, 50.0% for AGIs $25k-50k, 53.1% for AGIs $50k-75k, 60.0% for AGIs $75k-100k, 64.7% for AGIs $100k-200k, 100.0% for AGIs over 200k)
Averages for the 2004 tax year for zip code 97114, filed in 2005:
Average Adjusted Gross Income (AGI) in 2004: $48,453 (Individual Income Tax Returns)
Here:
$48,453
State:
$46,788
Salary/wage: $35,956 (reported on 85.1% of returns)
Here:
$35,956
State:
$39,788
(% of AGI for various income ranges: 132.2% for AGIs below $10k, 76.4% for AGIs $10k-25k, 83.9% for AGIs $25k-50k, 80.1% for AGIs $50k-75k, 77.5% for AGIs $75k-100k, 32.3% for AGIs over 100k)
Taxable interest for individuals: $2,930 (reported on 36.8% of returns)
This zip code:
$2,930
Oregon:
$2,126
(% of AGI for various income ranges: 14.4% for AGIs below $10k, 3.3% for AGIs $10k-25k, 1.2% for AGIs $25k-50k, 1.3% for AGIs $50k-75k, 1.2% for AGIs $75k-100k, 3.0% for AGIs over 100k)
Taxable dividends: $2,049 (reported on 17.6% of returns)
Here:
$2,049
State:
$3,427
(% of AGI for various income ranges: 3.8% for AGIs below $10k, 1.2% for AGIs $10k-25k, 0.6% for AGIs $25k-50k, 0.9% for AGIs $50k-75k, 0.5% for AGIs $75k-100k, 0.6% for AGIs over 100k)
Net capital gain/loss: +$27,778 (reported on 15.9% of returns)
Here:
+$27,778
State:
+$12,447
(% of AGI for various income ranges: 10.6% for AGIs below $10k, 0.3% for AGIs $10k-25k, 0.4% for AGIs $25k-50k, 2.0% for AGIs $50k-75k, 3.7% for AGIs $75k-100k, 21.6% for AGIs over 100k)
Profit/loss from business: +$1,406 (reported on 11.6% of returns)
Here:
+$1,406
State:
+$11,682
(% of AGI for various income ranges: 6.1% for AGIs below $10k, 5.8% for AGIs $10k-25k, 1.3% for AGIs $25k-50k, 2.7% for AGIs $50k-75k, -7.8% for AGIs $75k-100k)
IRA payment deduction: $3,583 (reported on 3.2% of returns)
97114:
$3,583
Oregon:
$3,035
Total itemized deductions: $22,321 (24% of AGI, reported on 35.9% of returns)
Here:
$22,321
State:
$20,209
Here:
23.8% of AGI
State:
24.7% of AGI
(% of AGI for various income ranges: 20.6% for AGIs below $10k, 10.4% for AGIs $10k-25k, 14.2% for AGIs $25k-50k, 18.3% for AGIs $50k-75k, 20.2% for AGIs $75k-100k, 16.9% for AGIs over 100k)
Charity contributions deductions: $3,114 (3% of AGI, reported on 28.6% of returns)
Here:
$3,114
State:
$3,145
Here:
3.4% of AGI
State:
3.6% of AGI
(% of AGI for various income ranges: 2.0% for AGIs below $10k, 0.9% for AGIs $10k-25k, 1.7% for AGIs $25k-50k, 2.4% for AGIs $50k-75k, 2.5% for AGIs $75k-100k, 1.6% for AGIs over 100k)
Total tax: $7,098 (reported on 68.6% of returns)
97114:
$7,098
State:
$7,148
(% of AGI for various income ranges: 3.1% for AGIs below $10k, 3.6% for AGIs $10k-25k, 5.2% for AGIs $25k-50k, 7.4% for AGIs $50k-75k, 9.2% for AGIs $75k-100k, 16.2% for AGIs over 100k)
Earned income credit: $1,897 (reported on 16.7% of returns)
Here:
$1,897
State:
$1,605
Percentage of individuals using paid preparers for their 2004 taxes: 55.7%
Here:
56%
State:
53%
(% for various income ranges: 45.2% for AGIs below $10k, 54.7% for AGIs $10k-25k, 56.8% for AGIs $25k-50k, 57.4% for AGIs $50k-75k, 67.6% for AGIs $75k-100k, 71.2% for AGIs over 100k)
Likely homosexual households (counted as self-reported same-sex unmarried-partner households)
Lesbian couples: 0.1% of all households
Gay men: 0.0% of all households
Household received Food Stamps/SNAP in the past 12 months: 302 Household did not receive Food Stamps/SNAP in the past 12 months: 1,264
Women who had a birth in the past 12 months: 139 (81 now married, 57 unmarried) Women who did not have a birth in the past 12 months: 680 (354 now married, 320 unmarried)
Housing units in zip code 97114 with a mortgage: 717 (69 second mortgage, 62 both second mortgage and home equity loan) Houses without a mortgage: 20
Median monthly owner costs for units with a mortgage: $1,899 Median monthly owner costs for units without a mortgage: $674
Residents with income below the poverty level in 2022:
This zip code:
15.3%
Whole state:
12.1%
Residents with income below 50% of the poverty level in 2022:
This zip code:
8.3%
Whole state:
6.2%
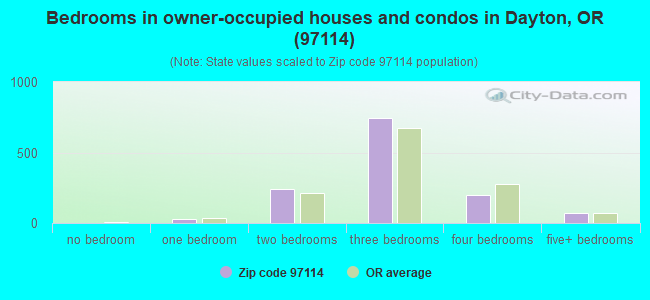
Median number of rooms in houses and condos:
Here:
5.9
State:
6.2
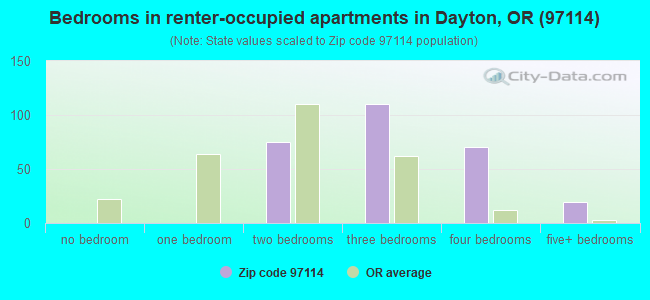
Median number of rooms in apartments:
Here:
5.3
State:
4.0
Notable locations in this zip code not listed on our city pages
Notable locations in zip code 97114: Pine Tree Corner (A), Dayton Water Treatment Plant (B), Dayton Sewage Treatment Lagoons (C), Duke Landing (D), Pleasantdale (E), Weston Landing (F), Whites Landing (G), Woods Landing (H), Grand Island Junction (I), Dayton Station (J), Tompkins Landing (K), Dayton Boat Landing (L), Four Corners (M), Stephens Farm (N), Mary Gilkey City Public Library (O), Dayton City Hall (P), Dayton Fire District (Q), Dayton Public Works (R), Dayton Municipal Courthouse (S), Webfoot Grange Hall (T). Display/hide their locations on the map
Churches in zip code 97114 include: Church of Jesus Christ of Latter Day Saints (A), Pioneer Evangelical Church (B). Display/hide their locations on the map
Cemeteries: Independent Order of Odd Fellows Cemetery (1), Lafayette Pioneer Cemetery (2), O'Dell Cemetery (3), Brookside Cemetery (4). Display/hide their locations on the map
Lakes and reservoirs: Evers Lake (A), Meadowbrook Lake (B), Scottys Pond (C), Aquatic Gardens (D), Curry Lake (E), Stringer Reservoir (F), Keene Reservoir (G), Kunz Reservoir (H). Display/hide their locations on the map
Streams, rivers, and creeks: Palmer Creek (A), Miller Creek (B), Yamhill River (C), Hess Creek (D), Holdridge Creek (E), Lambert Slough (F), Warner Creek (G). Display/hide their locations on the map
Parks in zip code 97114 include: 11th Street Park (1), Alderman Park (2), Courthouse Square Park (3), Dayton Boat Landing (4), Legion Field (5), Lafayette Locks County Park (6), Fort Yamhill State Park (7), Alden Park (8), Dayton Landing County Park (9). Display/hide their locations on the map
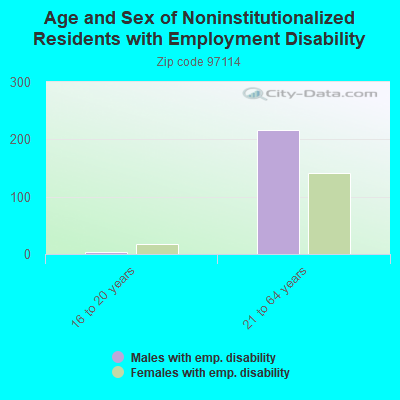
In group quarters: 80 (-1 institutionalized population)
Size of family households: 534 2-persons, 200 3-persons, 286 4-persons, 115 5-persons, 91 6-persons, 24 7-or-more-persons
Size of nonfamily households: 224 1-person, 50 2-persons, 5 3-persons
835 married couples with children.
311 single-parent households (235 men, 76 women).
79.8% of residents of 97114 zip code speak English at home.
19.6% of residents speak Spanish at home (41% very well, 18% well, 6% not well, 36% not at all).
1.1% of residents speak other Indo-European language at home (100% very well).
0.2% of residents speak Asian or Pacific Island language at home (100% very well).
0.7% of residents speak other language at home (100% very well).
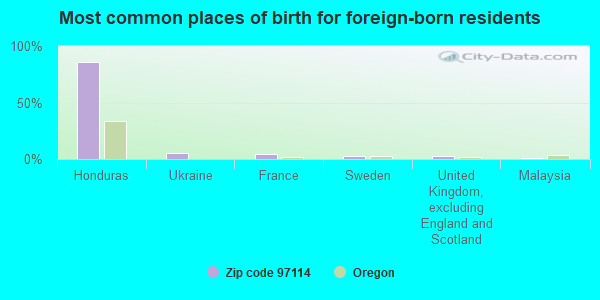
Foreign born population: 561 (11.2%) (32.0% of them are naturalized citizens)
This zip code:
11.2%
Whole state:
9.9%
86%Honduras
6%Ukraine
5%France
3%Sweden
3%United Kingdom, excluding England and Scotland
1%Malaysia
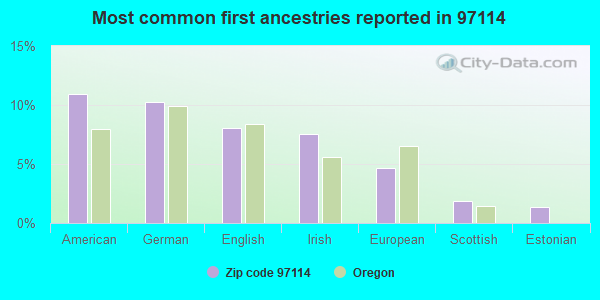
11%American
10%German
8%English
8%Irish
5%European
2%Scottish
1%Estonian
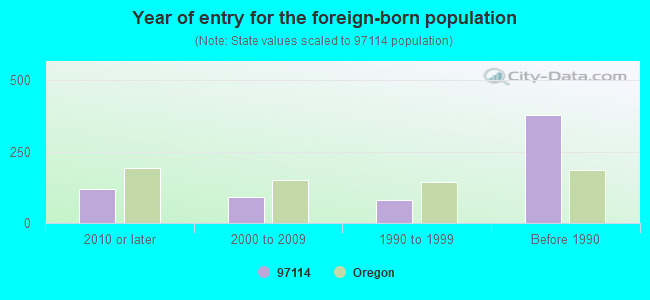
Year of entry for the foreign-born population
1202010 or later
912000 to 2009
811990 to 1999
378Before 1990
Facilities with environmental interests located in this zip code:
DAYTON SAND & GRAVEL CO. (101 E 3RD ST/COFFEE IS BAR OFF DORSEY in DAYTON, OR)
AIR MINOR (AIRS/AFS) STATE MASTER (Oregon inspections and permits database) - OR-SIS-23477-10211, ONSITE WASTEWATER TREATMENT, OR-SIS-23477-10210, NPDES STORMWATER PERMIT STATE MASTER (Oregon inspections and permits database) - OR-ECSI-352, SUPERFUND, ACSIS-362010-, AIR PROGRAM, ACSIS-365330-, STATE MASTER (Oregon inspections and permits database) - OR-ACSIS-365330, AIR PROGRAM STATE MASTER (Oregon inspections and permits database) - OR-ACSIS-362010, AIR PROGRAM Business SIC classification: CONSTRUCTION SAND AND GRAVEL; ASPHALT PAVING MIXTURES AND BLOCKS; MINERALS AND EARTHS, GROUND OR OTHERWISE TREATED; BRICK, STONE, AND RELATED CONSTRUCTION MATERIALS Business NAICS classification: CONSTRUCTION SAND AND GRAVEL MINING.; CONSTRUCTION SAND AND GRAVEL MINING.; CONSTRUCTION SAND AND GRAVEL MINING.; KAOLIN AND BALL CLAY MINING.; KAOLIN AND BALL CLAY MINING.; CLAY AND CERAMIC AND REFRACTORY MINERALS MINING.; CLAY AND CERAMIC AND REFRACTORY MINERALS MINING.; OTHER CHEMICAL AND FERTILIZER MINERAL MINING.; OTHER CHEMICAL AND FERTILIZER MINERAL MINING.; ALL OTHER NONMETALLIC MINERAL MINING.; ALL OTHER NONMETALLIC MINERAL MINING.; ASPHALT PAVING MIXTURE AND BLOCK MANUFACTURING.; ASPHALT PAVING MIXTURE AND BLOCK MANUFACTURING.; GROUND OR TREATED MINERAL AND EARTH MANUFACTURING.; GROUND OR TREATED MINERAL AND EARTH MANUFACTURING. Organizations: DAYTON SAND& GRAVEL CO. (CONTACT/GENERAL)
, BAKER ROCK CRUSHING CO. (CONTACT/GENERAL)
, BAKER ROCK CRUSHING COMPANY (CONTACT/OWNER)
Alternative names: DAYTON SAND GRAVEL CO
DAYTON CITY OF (SOUTHEAST OF DAYTON HIGHWAY BYPASS in DAYTON, OR)
STATE MASTER (Oregon inspections and permits database) - OR-SIS-23458-100895, NPDES NON-MAJOR, OR-SIS-23458-101742, OR-SIS-23458-3552, National Pollutant Discharge Elimination System NON-MAJOR (Tracking pollutant discharge elimination systems) - permit COMMUNITY WATER SYSTEM (SDWIS) - SDWIS-OR4100252 115, WATER TREATMENT PLANT, SDWIS-OR4100252 116, SDWIS-OR4100252 117, SDWIS-OR4100252 1423, Business SIC classification: SEWERAGE SYSTEMS Organizations: CITY OF DAYTON (CONTACT/OWNER)
DAYTON HIGH SCHOOL (801 FERRY STREET in DAYTON, OR)
(National Center for Education Statistics) - STATE ID-1212 STATE MASTER (Oregon inspections and permits database) - OR-LUST-36-00-5170, LEAKING STORAGE TANK Organizations: DAYTON PUBLIC SCHOOL (CONTACT/GENERAL)
, DAYTON SCH DIST 008 (SCHOOL DISTRICT)
DAYTON CITY OF (416 FERRY STREET in DAYTON, OR)
COMPLIANCE ACTIVITY (Tracking inspections of insecticide, fungicide, and rodenticide, and toxic substances) STATE MASTER (Oregon inspections and permits database) - OR-LUST-36-99-4160, LEAKING STORAGE TANK Organizations: CITY OF DAYTON (CONTACT/GENERAL)
Alternative names: DAYTON CY OF
DAYTON GRADE SCHOOL (526 FERRY ST in DAYTON, OR)
(National Center for Education Statistics) - STATE ID-1211 Organizations: DAYTON SCH DIST 008 (SCHOOL DISTRICT)
DAYTON JR HIGH SCHOOL (801 FERRY ST in DAYTON, OR)
(National Center for Education Statistics) - STATE ID-1291 Organizations: DAYTON SCH DIST 008 (SCHOOL DISTRICT)
GREENLIFE (3220 SE DAYTON BYPASS RD in DAYTON, OR)
COMPLIANCE ACTIVITY (Tracking inspections of insecticide, fungicide, and rodenticide, and toxic substances)
DAYTON SD 8 (526 FERRY ST in DAYTON, OR)
COMPLIANCE ACTIVITY (Tracking inspections of insecticide, fungicide, and rodenticide, and toxic substances)
Housing units lacking complete plumbing facilities: 1.8% Housing units lacking complete kitchen facilities: 2.2%
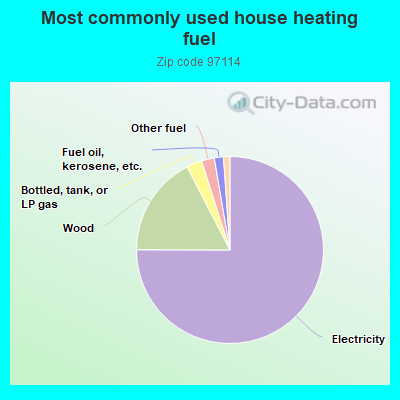
75.2%Electricity
17.4%Wood
2.7%Bottled, tank, or LP gas
2.2%Other fuel
1.6%Fuel oil, kerosene, etc.
1.1%Utility gas
Population in 1990: 3,640. Population change in the 1990s: +709 (+19.5%).
Place of birth for U.S.-born residents:
This state: 2,530
Northeast: 187
Midwest: 235
South: 196
West: 1,167
64% of the 97114 zip code residents lived in the same house 5 years ago. Out of people who lived in different houses, 60% lived in this county. Out of people who lived in different counties, 50% lived in Oregon.
86% of the 97114 zip code residents lived in the same house 1 year ago. Out of people who lived in different houses, 45% moved from this county. Out of people who lived in different houses, 40% moved from different county within same state. Out of people who lived in different houses, 15% moved from different state. Out of people who lived in different houses, 1% moved from abroad.
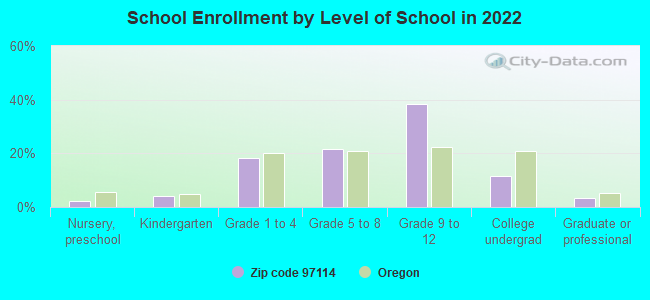
Private vs. public school enrollment:
Students in private schools in grades 1 to 8 (elementary and middle school): 94
Here:
20.2%
Oregon:
13.7%
Students in private schools in grades 9 to 12 (high school):
Here:
0.0%
Oregon:
8.8%
Students in private undergraduate colleges:
Here:
0.0%
Oregon:
17.7%
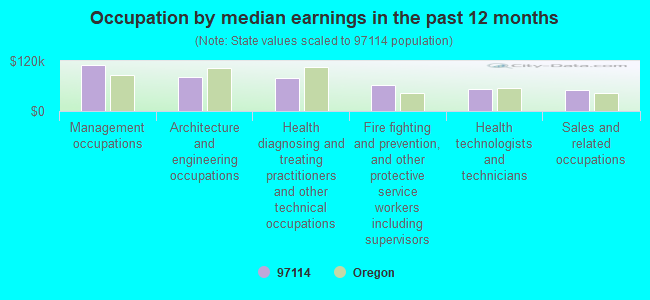
Occupation by median earnings in the past 12 months ($)
109,967Management occupations
80,820Architecture and engineering occupations
78,500Health diagnosing and treating practitioners and other technical occupations
61,565Fire fighting and prevention, and other protective service workers including supervisors
53,340Health technologists and technicians
50,772Sales and related occupations
Top industries in this zip code by the number of employees in 2005:
Administrative and Support and Waste Management and Remediation Services: Temporary Help Services (50-99 employees: 1 establishment)
Administrative and Support and Waste Management and Remediation Services: Landscaping Services (20-49: 1, 10-19: 1, 5-9: 2, 1-4: 3)
Construction: New Single-Family Housing Construction (except Operative Builders) (10-19: 1, 5-9: 2, 1-4: 3)
Wholesale Trade: Meat and Meat Product Merchant Wholesalers (20-49: 1)
Accommodation and Food Services: Full-Service Restaurants (10-19: 1, 5-9: 1)
Construction: Painting and Wall Covering Contractors (5-9: 2, 1-4: 1)
People in group quarters in 2010:
4 people in workers' group living quarters and job corps centers
People in group quarters in 2000:
17 people in agriculture workers' dormitories on farms
Fatal accident statistics in 2010:
Fatal accident count: 1
Vehicles involved in fatal accidents: 3
Fatal accidents caused by drunken drivers: 0
Fatalities: 1
Persons involved in fatal accidents: 4
Pedestrians involved in fatal accidents: 0
Home Mortgage Disclosure Act Aggregated Statistics For Year 2009 (Based on 6 partial tracts)
A) FHA, FSA/RHS & VA Home Purchase Loans
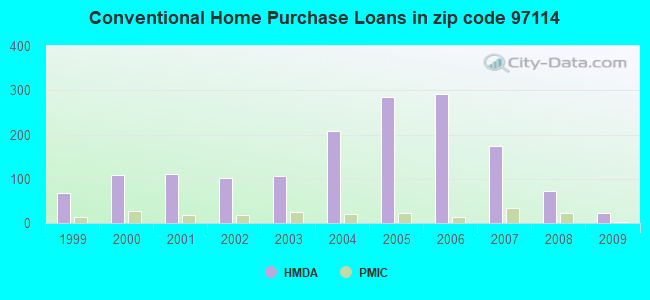
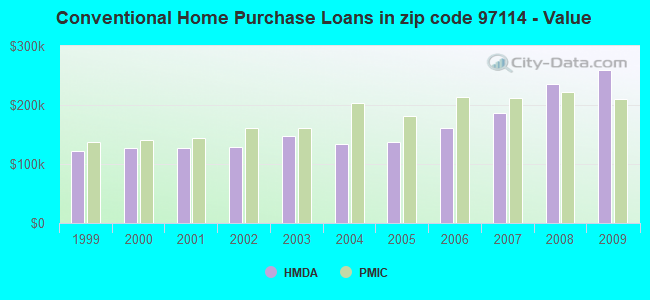
B) Conventional Home Purchase Loans
C) Refinancings
D) Home Improvement Loans
F) Non-occupant Loans on < 5 Family Dwellings (A B C & D)
G) Loans On Manufactured Home Dwelling (A B C & D)
Number
Average Value
Number
Average Value
Number
Average Value
Number
Average Value
Number
Average Value
Number
Average Value
LOANS ORIGINATED
39
$200,171
23
$259,404
298
$217,180
8
$117,636
12
$230,446
15
$209,637
APPLICATIONS APPROVED, NOT ACCEPTED
4
$160,642
6
$184,848
27
$222,219
4
$80,785
1
$70,010
3
$58,597
APPLICATIONS DENIED
20
$192,296
14
$259,972
120
$232,561
13
$132,715
3
$184,817
12
$126,642
APPLICATIONS WITHDRAWN
15
$196,025
7
$198,467
90
$235,922
3
$211,420
6
$140,005
7
$226,147
FILES CLOSED FOR INCOMPLETENESS
2
$69,935
3
$201,703
14
$309,359
2
$230,870
0
$0
1
$169,650
Aggregated Statistics For Year 2008 (Based on 6 partial tracts)
A) FHA, FSA/RHS & VA Home Purchase Loans
B) Conventional Home Purchase Loans
C) Refinancings
D) Home Improvement Loans
F) Non-occupant Loans on < 5 Family Dwellings (A B C & D)
G) Loans On Manufactured Home Dwelling (A B C & D)
Number
Average Value
Number
Average Value
Number
Average Value
Number
Average Value
Number
Average Value
Number
Average Value
LOANS ORIGINATED
43
$211,949
72
$234,956
206
$217,134
7
$214,796
13
$214,088
27
$161,277
APPLICATIONS APPROVED, NOT ACCEPTED
5
$212,844
10
$221,741
47
$232,697
3
$40,183
1
$90,880
3
$258,200
APPLICATIONS DENIED
10
$201,547
23
$214,053
170
$207,379
35
$175,859
3
$229,897
12
$106,326
APPLICATIONS WITHDRAWN
8
$227,594
15
$227,019
65
$234,306
7
$76,079
7
$242,616
7
$164,091
FILES CLOSED FOR INCOMPLETENESS
3
$292,100
7
$337,196
13
$230,754
1
$26,930
2
$89,315
0
$0
Aggregated Statistics For Year 2007 (Based on 6 partial tracts)
A) FHA, FSA/RHS & VA Home Purchase Loans
B) Conventional Home Purchase Loans
C) Refinancings
D) Home Improvement Loans
F) Non-occupant Loans on < 5 Family Dwellings (A B C & D)
G) Loans On Manufactured Home Dwelling (A B C & D)
Number
Average Value
Number
Average Value
Number
Average Value
Number
Average Value
Number
Average Value
Number
Average Value
LOANS ORIGINATED
20
$213,926
174
$185,728
279
$199,556
31
$105,838
36
$179,620
32
$117,680
APPLICATIONS APPROVED, NOT ACCEPTED
1
$87,850
25
$191,831
69
$187,582
3
$39,757
3
$245,097
11
$119,835
APPLICATIONS DENIED
4
$213,035
57
$200,856
144
$188,882
43
$99,215
12
$181,767
28
$118,963
APPLICATIONS WITHDRAWN
3
$157,873
23
$222,751
81
$173,949
5
$153,710
7
$175,227
6
$156,068
FILES CLOSED FOR INCOMPLETENESS
0
$0
3
$213,277
25
$185,332
3
$103,317
0
$0
1
$44,770
Aggregated Statistics For Year 2006 (Based on 6 partial tracts)
A) FHA, FSA/RHS & VA Home Purchase Loans
B) Conventional Home Purchase Loans
C) Refinancings
D) Home Improvement Loans
F) Non-occupant Loans on < 5 Family Dwellings (A B C & D)
G) Loans On Manufactured Home Dwelling (A B C & D)
Number
Average Value
Number
Average Value
Number
Average Value
Number
Average Value
Number
Average Value
Number
Average Value
LOANS ORIGINATED
24
$187,837
291
$160,236
279
$176,651
35
$95,793
28
$182,674
28
$160,552
APPLICATIONS APPROVED, NOT ACCEPTED
3
$269,377
45
$180,171
68
$151,242
5
$139,358
3
$196,573
3
$101,877
APPLICATIONS DENIED
6
$189,393
64
$160,683
149
$151,375
32
$64,330
9
$230,423
13
$127,901
APPLICATIONS WITHDRAWN
1
$221,150
48
$130,532
127
$179,133
9
$72,664
5
$152,892
4
$178,442
FILES CLOSED FOR INCOMPLETENESS
0
$0
2
$223,840
31
$143,755
1
$118,150
0
$0
2
$90,135
Aggregated Statistics For Year 2005 (Based on 6 partial tracts)
A) FHA, FSA/RHS & VA Home Purchase Loans
B) Conventional Home Purchase Loans
C) Refinancings
D) Home Improvement Loans
F) Non-occupant Loans on < 5 Family Dwellings (A B C & D)
G) Loans On Manufactured Home Dwelling (A B C & D)
Number
Average Value
Number
Average Value
Number
Average Value
Number
Average Value
Number
Average Value
Number
Average Value
LOANS ORIGINATED
29
$148,711
284
$137,890
278
$162,183
29
$73,198
30
$141,800
32
$135,592
APPLICATIONS APPROVED, NOT ACCEPTED
3
$322,433
43
$131,255
57
$119,143
1
$24,240
9
$160,319
7
$140,821
APPLICATIONS DENIED
9
$193,530
83
$141,329
204
$157,316
30
$78,539
9
$160,474
28
$97,345
APPLICATIONS WITHDRAWN
5
$171,594
35
$172,466
136
$154,167
13
$150,774
6
$184,632
19
$129,440
FILES CLOSED FOR INCOMPLETENESS
3
$147,173
11
$146,834
36
$175,919
0
$0
2
$194,780
0
$0
Aggregated Statistics For Year 2004 (Based on 6 partial tracts)
A) FHA, FSA/RHS & VA Home Purchase Loans
B) Conventional Home Purchase Loans
C) Refinancings
D) Home Improvement Loans
F) Non-occupant Loans on < 5 Family Dwellings (A B C & D)
G) Loans On Manufactured Home Dwelling (A B C & D)
Number
Average Value
Number
Average Value
Number
Average Value
Number
Average Value
Number
Average Value
Number
Average Value
LOANS ORIGINATED
18
$146,315
209
$133,300
286
$149,693
17
$132,804
26
$116,852
27
$108,936
APPLICATIONS APPROVED, NOT ACCEPTED
4
$151,800
34
$131,920
68
$152,025
4
$107,650
8
$104,448
5
$80,160
APPLICATIONS DENIED
4
$126,215
30
$132,500
160
$142,224
27
$48,483
5
$132,766
36
$104,840
APPLICATIONS WITHDRAWN
7
$149,357
29
$130,545
122
$139,538
5
$76,756
4
$78,935
10
$114,863
FILES CLOSED FOR INCOMPLETENESS
0
$0
6
$169,162
16
$169,629
1
$6,730
2
$90,160
3
$179,193
Aggregated Statistics For Year 2003 (Based on 6 partial tracts)
A) FHA, FSA/RHS & VA Home Purchase Loans
B) Conventional Home Purchase Loans
C) Refinancings
D) Home Improvement Loans
F) Non-occupant Loans on < 5 Family Dwellings (A B C & D)
Number
Average Value
Number
Average Value
Number
Average Value
Number
Average Value
Number
Average Value
LOANS ORIGINATED
39
$140,563
106
$148,083
475
$156,252
16
$25,510
43
$133,169
APPLICATIONS APPROVED, NOT ACCEPTED
0
$0
14
$138,483
104
$130,247
2
$34,840
8
$119,739
APPLICATIONS DENIED
5
$140,260
41
$260,648
216
$146,427
10
$30,565
10
$129,673
APPLICATIONS WITHDRAWN
0
$0
9
$197,949
114
$129,201
4
$28,962
4
$144,805
FILES CLOSED FOR INCOMPLETENESS
1
$174,360
8
$197,676
22
$138,138
4
$22,242
0
$0
Aggregated Statistics For Year 2002 (Based on 6 partial tracts)
A) FHA, FSA/RHS & VA Home Purchase Loans
B) Conventional Home Purchase Loans
C) Refinancings
D) Home Improvement Loans
E) Loans on Dwellings For 5+ Families
F) Non-occupant Loans on < 5 Family Dwellings (A B C & D)
Number
Average Value
Number
Average Value
Number
Average Value
Number
Average Value
Number
Average Value
Number
Average Value
LOANS ORIGINATED
44
$135,006
102
$129,065
383
$138,167
17
$55,041
0
$0
57
$95,518
APPLICATIONS APPROVED, NOT ACCEPTED
1
$210,370
19
$138,550
40
$133,860
3
$17,960
0
$0
2
$60,085
APPLICATIONS DENIED
4
$122,515
21
$116,585
115
$132,368
20
$27,280
0
$0
17
$103,095
APPLICATIONS WITHDRAWN
3
$149,673
9
$129,600
82
$125,947
4
$75,818
2
$800,470
6
$104,863
FILES CLOSED FOR INCOMPLETENESS
2
$141,875
2
$114,105
18
$140,294
0
$0
0
$0
1
$101,320
Aggregated Statistics For Year 2001 (Based on 6 partial tracts)
A) FHA, FSA/RHS & VA Home Purchase Loans
B) Conventional Home Purchase Loans
C) Refinancings
D) Home Improvement Loans
F) Non-occupant Loans on < 5 Family Dwellings (A B C & D)
Number
Average Value
Number
Average Value
Number
Average Value
Number
Average Value
Number
Average Value
LOANS ORIGINATED
34
$128,138
111
$126,975
337
$133,343
25
$64,696
52
$118,002
APPLICATIONS APPROVED, NOT ACCEPTED
0
$0
20
$95,852
34
$141,742
12
$19,372
1
$102,330
APPLICATIONS DENIED
1
$110,400
50
$90,526
115
$128,449
19
$18,561
8
$56,851
APPLICATIONS WITHDRAWN
1
$82,130
9
$201,139
70
$133,874
2
$96,605
1
$135,650
FILES CLOSED FOR INCOMPLETENESS
2
$110,380
1
$266,250
16
$110,091
2
$57,270
0
$0
Aggregated Statistics For Year 2000 (Based on 6 partial tracts)
A) FHA, FSA/RHS & VA Home Purchase Loans
B) Conventional Home Purchase Loans
C) Refinancings
D) Home Improvement Loans
E) Loans on Dwellings For 5+ Families
F) Non-occupant Loans on < 5 Family Dwellings (A B C & D)
Number
Average Value
Number
Average Value
Number
Average Value
Number
Average Value
Number
Average Value
Number
Average Value
LOANS ORIGINATED
23
$122,420
108
$127,604
97
$115,467
36
$21,202
1
$95,260
16
$100,046
APPLICATIONS APPROVED, NOT ACCEPTED
1
$142,050
15
$86,198
37
$86,517
15
$17,695
0
$0
3
$70,843
APPLICATIONS DENIED
1
$61,930
33
$81,259
75
$112,200
22
$29,686
0
$0
5
$81,490
APPLICATIONS WITHDRAWN
2
$104,115
12
$102,681
30
$109,498
3
$36,247
0
$0
2
$76,655
FILES CLOSED FOR INCOMPLETENESS
2
$121,800
2
$170,490
14
$172,496
0
$0
0
$0
0
$0
Aggregated Statistics For Year 1999 (Based on 3 partial tracts)
A) FHA, FSA/RHS & VA Home Purchase Loans
B) Conventional Home Purchase Loans
C) Refinancings
D) Home Improvement Loans
E) Loans on Dwellings For 5+ Families
F) Non-occupant Loans on < 5 Family Dwellings (A B C & D)
Detailed PMIC statistics for the following Tracts:0303.00
, 0309.00
2002 - 2018 National Fire Incident Reporting System (NFIRS) incidents
According to the data from the years 2002 - 2018 the average number of fires per year is 17. The highest number of fires - 28 took place in 2015, and the least - 5 in 2012. The data has a rising trend.
When looking into fire subcategories, the most reports belonged to: Structure Fires (43.8%), and Outside Fires (41.4%).
Fire incident types reported to NFIRS in Zip Code 97114


 Nearest zip codes: 97127, 97115, 97137, 97026, 97111, 97132.
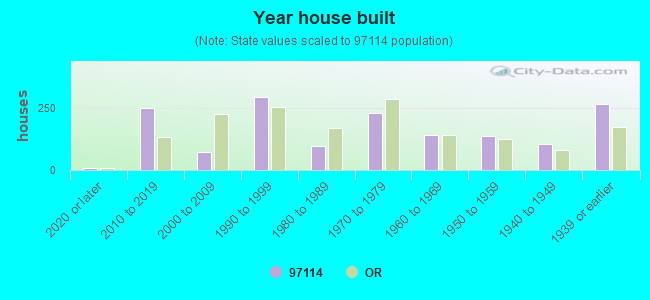


 According to the data from the years 2002 - 2018 the average number of fires per year is 17. The highest number of fires - 28 took place in 2015, and the least - 5 in 2012. The data has a rising trend.
 When looking into fire subcategories, the most reports belonged to: Structure Fires (43.8%), and Outside Fires (41.4%).