Estimated zip code population in 2022: 4,766 Zip code population in 2010: 4,733 Zip code population in 2000: 5,196
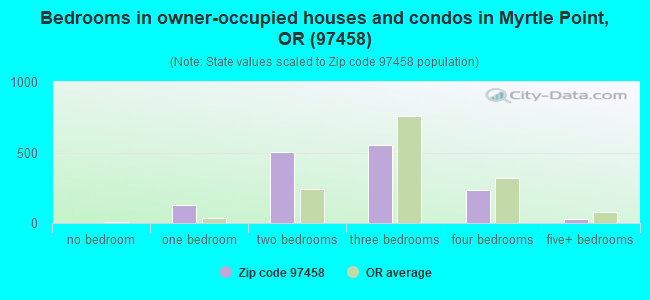
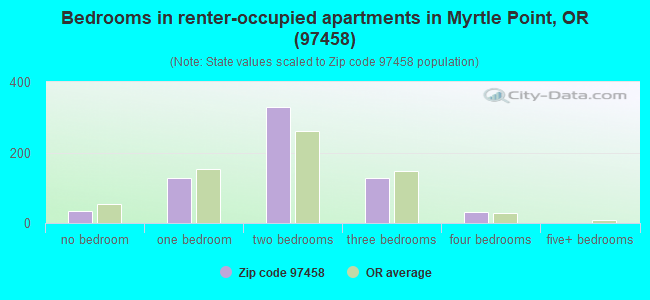
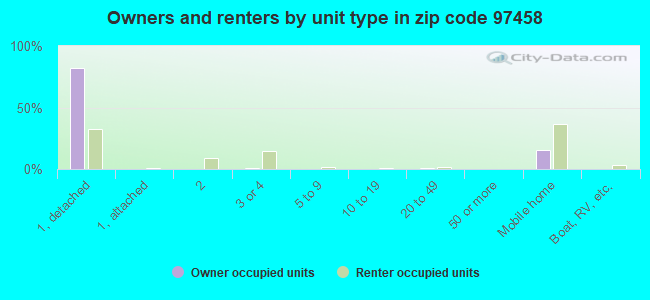
Houses and condos: 2,286 Renter-occupied apartments: 653
% of renters here:
31%
State:
37%
March 2022 cost of living index in zip code 97458: 89.1 (less than average, U.S. average is 100)
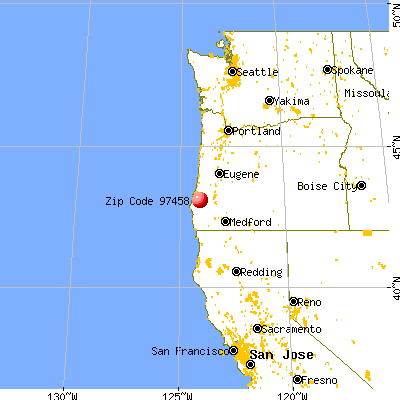
Land area: 380.1 sq. mi. Water area: 1.5 sq. mi.
Population density: 13 people per square mile
(very low).
OSM Map
General Map
Google Map
MSN Map
OSM Map
General Map
Google Map
MSN Map
OSM Map
General Map
Google Map
MSN Map
OSM Map
General Map
Google Map
MSN Map
Please wait while loading the map...
Real estate property taxes paid for housing units in 2022:
This zip code:
0.7% ($1,779)
Oregon:
0.8% ($3,646)
Median real estate property taxes paid for housing units with mortgages in 2022: $1,955 (0.7%) Median real estate property taxes paid for housing units with no mortgage in 2022: $1,542 (0.5%)
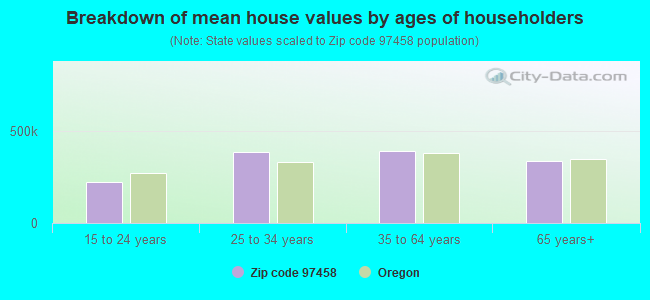
Estimated median house/condo value in 2022: $271,804
97458:
$271,804
Oregon:
$475,600
According to our research of Oregon and other state lists, there were 2 registered sex offenders living in 97458 zip code as of April 27, 2024. The ratio of all residents to sex offenders in zip code 97458 is 2,360 to 1. The ratio of registered sex offenders to all residents in this zip code is near the state average.
Median resident age:
This zip code:
54.1 years
Oregon median age:
40.5 years
Average household size:
This zip code:
2.2 people
Oregon:
2.4 people
Averages for the 2020 tax year for zip code 97458, filed in 2021:
Average Adjusted Gross Income (AGI) in 2020: $50,447 (Individual Income Tax Returns)
Here:
$50,447
State:
$76,001
Salary/wage: $41,557 (reported on 74.5% of returns)
Here:
$41,557
State:
$61,959
(% of AGI for various income ranges: 1210.5% for AGIs below $25k, 3747.6% for AGIs $25k-50k, 6840.0% for AGIs $50k-75k, 9773.0% for AGIs $75k-100k, 20166.7% for AGIs $100k-200k)
Taxable interest for individuals: $2,170 (reported on 28.1% of returns)
This zip code:
$2,170
Oregon:
$1,628
(% of AGI for various income ranges: 36.4% for AGIs below $25k, 50.5% for AGIs $25k-50k, 55.0% for AGIs $50k-75k, 37.0% for AGIs $75k-100k, 765.6% for AGIs $100k-200k)
Ordinary dividends: $3,627 (reported on 13.5% of returns)
Here:
$3,627
State:
$7,165
(% of AGI for various income ranges: 32.3% for AGIs below $25k, 52.7% for AGIs $25k-50k, 83.9% for AGIs $50k-75k, 44.0% for AGIs $75k-100k, 456.7% for AGIs $100k-200k)
Net capital gain/loss in AGI: +$12,678 (reported on 14.1% of returns)
Here:
+$12,678
State:
+$23,403
(% of AGI for various income ranges: 13.9% for AGIs below $25k, 51.6% for AGIs $25k-50k, 183.9% for AGIs $50k-75k, 219.0% for AGIs $75k-100k, 2912.2% for AGIs $100k-200k)
Profit/loss from business: +$10,527 (reported on 11.5% of returns)
Here:
+$10,527
State:
+$16,511
(% of AGI for various income ranges: 87.5% for AGIs below $25k, 157.6% for AGIs $25k-50k, 236.7% for AGIs $50k-75k, 276.0% for AGIs $75k-100k, 717.8% for AGIs $100k-200k)
Taxable individual retirement arrangement distribution: $13,190 (reported on 10.9% of returns)
97458:
$13,190
Oregon:
$20,730
(% of AGI for various income ranges: 108.2% for AGIs below $25k, 125.7% for AGIs $25k-50k, 229.4% for AGIs $50k-75k, 556.0% for AGIs $75k-100k, 955.6% for AGIs $100k-200k)
Total itemized deductions: $24,518 (reported on 5.7% of returns)
Here:
$24,518
State:
$31,050
(% of AGI for various income ranges: 142.3% for AGIs below $25k, 482.8% for AGIs $50k-75k, 1335.6% for AGIs $100k-200k)
Charity contributions: $7,214 (reported on 3.6% of returns)
Here:
$7,214
State:
$8,791
(% of AGI for various income ranges: 46.2% for AGIs $25k-50k, 371.1% for AGIs $100k-200k)
Taxes paid: $6,836 (reported on 5.7% of returns)
97458:
$6,836
State:
$8,487
(% of AGI for various income ranges: 32.7% for AGIs below $25k, 151.1% for AGIs $50k-75k, 373.3% for AGIs $100k-200k)
Earned income credit: $2,069 (reported on 18.2% of returns)
Here:
$2,069
State:
$1,977
(% of AGI for various income ranges: 101.1% for AGIs below $25k, 75.4% for AGIs $25k-50k)
Percentage of individuals using paid preparers for their 2020 taxes: 92.7%
Here:
93%
State:
93%
(% for various income ranges: 91.5% for AGIs below $25k, 94.2% for AGIs $25k-50k, 93.1% for AGIs $50k-75k, 88.9% for AGIs $75k-100k, 95.0% for AGIs $100k-200k, 100.0% for AGIs over 200k)
Averages for the 2012 tax year for zip code 97458, filed in 2013:
Average Adjusted Gross Income (AGI) in 2012: $40,553 (Individual Income Tax Returns)
Here:
$40,553
State:
$57,845
Salary/wage: $33,673 (reported on 74.1% of returns)
Here:
$33,673
State:
$47,723
(% of AGI for various income ranges: 65.2% for AGIs below $25k, 68.8% for AGIs $25k-50k, 63.6% for AGIs $50k-75k, 65.2% for AGIs $75k-100k, 46.5% for AGIs $100k-200k)
Taxable interest for individuals: $2,096 (reported on 29.4% of returns)
This zip code:
$2,096
Oregon:
$1,848
(% of AGI for various income ranges: 2.1% for AGIs below $25k, 2.0% for AGIs $25k-50k, 1.8% for AGIs $50k-75k, 0.7% for AGIs $75k-100k, 1.0% for AGIs $100k-200k)
Ordinary dividends: $3,122 (reported on 15.9% of returns)
Here:
$3,122
State:
$5,987
(% of AGI for various income ranges: 1.6% for AGIs below $25k, 1.2% for AGIs $25k-50k, 1.2% for AGIs $50k-75k, 1.4% for AGIs $75k-100k, 1.0% for AGIs $100k-200k)
Net capital gain/loss in AGI: +$6,065 (reported on 15.3% of returns)
Here:
+$6,065
State:
+$13,095
(% of AGI for various income ranges: 1.4% for AGIs below $25k, 1.9% for AGIs $25k-50k, 2.4% for AGIs $50k-75k, 0.7% for AGIs $75k-100k, 4.3% for AGIs $100k-200k)
Profit/loss from business: +$9,108 (reported on 14.1% of returns)
Here:
+$9,108
State:
+$13,871
(% of AGI for various income ranges: 7.1% for AGIs below $25k, 1.4% for AGIs $25k-50k, 3.9% for AGIs $50k-75k, 4.3% for AGIs $100k-200k)
Taxable individual retirement arrangement distribution: $12,737 (reported on 11.2% of returns)
97458:
$12,737
Oregon:
$16,036
(% of AGI for various income ranges: 3.5% for AGIs below $25k, 2.7% for AGIs $25k-50k, 2.9% for AGIs $50k-75k, 4.6% for AGIs $75k-100k, 4.1% for AGIs $100k-200k)
Total itemized deductions: $18,206 (26% of AGI, reported on 28.8% of returns)
Here:
$18,206
State:
$24,430
Here:
26.4% of AGI
State:
23.2% of AGI
(% of AGI for various income ranges: 9.8% for AGIs below $25k, 11.2% for AGIs $25k-50k, 12.1% for AGIs $50k-75k, 16.9% for AGIs $75k-100k, 14.5% for AGIs $100k-200k)
Charity contributions: $3,219 (reported on 18.2% of returns)
Here:
$3,219
State:
$3,648
(% of AGI for various income ranges: 0.8% for AGIs below $25k, 1.4% for AGIs $25k-50k, 1.2% for AGIs $50k-75k, 2.2% for AGIs $75k-100k, 1.5% for AGIs $100k-200k)
Taxes paid: $5,818 (reported on 28.8% of returns)
97458:
$5,818
State:
$10,269
(% of AGI for various income ranges: 1.6% for AGIs below $25k, 2.6% for AGIs $25k-50k, 3.7% for AGIs $50k-75k, 5.8% for AGIs $75k-100k, 6.5% for AGIs $100k-200k)
Earned income credit: $2,240 (reported on 20.6% of returns)
Here:
$2,240
State:
$2,021
(% of AGI for various income ranges: 6.6% for AGIs below $25k, 1.0% for AGIs $25k-50k)
Percentage of individuals using paid preparers for their 2012 taxes: 51.2%
Here:
51%
State:
47%
(% for various income ranges: 45.3% for AGIs below $25k, 48.9% for AGIs $25k-50k, 61.5% for AGIs $50k-75k, 57.1% for AGIs $75k-100k, 70.0% for AGIs $100k-200k)
Averages for the 2004 tax year for zip code 97458, filed in 2005:
Average Adjusted Gross Income (AGI) in 2004: $32,423 (Individual Income Tax Returns)
Here:
$32,423
State:
$46,788
Salary/wage: $28,504 (reported on 75.8% of returns)
Here:
$28,504
State:
$39,788
(% of AGI for various income ranges: 138.2% for AGIs below $10k, 67.8% for AGIs $10k-25k, 77.8% for AGIs $25k-50k, 71.1% for AGIs $50k-75k, 55.0% for AGIs $75k-100k, 39.2% for AGIs over 100k)
Taxable interest for individuals: $1,933 (reported on 40.8% of returns)
This zip code:
$1,933
Oregon:
$2,126
(% of AGI for various income ranges: 15.5% for AGIs below $10k, 2.8% for AGIs $10k-25k, 1.8% for AGIs $25k-50k, 1.9% for AGIs $50k-75k, 2.0% for AGIs $75k-100k, 3.0% for AGIs over 100k)
Taxable dividends: $1,727 (reported on 20.5% of returns)
Here:
$1,727
State:
$3,427
(% of AGI for various income ranges: 7.5% for AGIs below $10k, 1.7% for AGIs $10k-25k, 0.8% for AGIs $25k-50k, 0.9% for AGIs $50k-75k, 0.9% for AGIs $75k-100k, 0.8% for AGIs over 100k)
Net capital gain/loss: +$12,904 (reported on 21.9% of returns)
Here:
+$12,904
State:
+$12,447
(% of AGI for various income ranges: 12.5% for AGIs below $10k, 4.3% for AGIs $10k-25k, 1.4% for AGIs $25k-50k, 3.5% for AGIs $50k-75k, 10.6% for AGIs $75k-100k, 32.3% for AGIs over 100k)
Profit/loss from business: +$8,872 (reported on 14.7% of returns)
Here:
+$8,872
State:
+$11,682
(% of AGI for various income ranges: 9.0% for AGIs below $10k, 4.5% for AGIs $10k-25k, 2.9% for AGIs $25k-50k, 2.2% for AGIs $50k-75k, 3.7% for AGIs $75k-100k, 8.1% for AGIs over 100k)
IRA payment deduction: $3,463 (reported on 3.7% of returns)
97458:
$3,463
Oregon:
$3,035
Total itemized deductions: $15,124 (27% of AGI, reported on 27.2% of returns)
Here:
$15,124
State:
$20,209
Here:
26.9% of AGI
State:
24.7% of AGI
(% of AGI for various income ranges: 22.7% for AGIs below $10k, 14.6% for AGIs $10k-25k, 11.7% for AGIs $25k-50k, 12.1% for AGIs $50k-75k, 14.1% for AGIs $75k-100k, 11.4% for AGIs over 100k)
Charity contributions deductions: $2,595 (4% of AGI, reported on 18.9% of returns)
Here:
$2,595
State:
$3,145
Here:
4.1% of AGI
State:
3.6% of AGI
(% of AGI for various income ranges: 1.8% for AGIs below $10k, 1.3% for AGIs $10k-25k, 1.0% for AGIs $25k-50k, 1.6% for AGIs $50k-75k, 2.0% for AGIs $75k-100k, 2.1% for AGIs over 100k)
Total tax: $3,894 (reported on 68.3% of returns)
97458:
$3,894
State:
$7,148
(% of AGI for various income ranges: 5.4% for AGIs below $10k, 3.7% for AGIs $10k-25k, 5.9% for AGIs $25k-50k, 8.0% for AGIs $50k-75k, 10.5% for AGIs $75k-100k, 15.4% for AGIs over 100k)
Earned income credit: $1,559 (reported on 17.9% of returns)
Here:
$1,559
State:
$1,605
Percentage of individuals using paid preparers for their 2004 taxes: 60.9%
Here:
61%
State:
53%
(% for various income ranges: 55.0% for AGIs below $10k, 57.5% for AGIs $10k-25k, 65.7% for AGIs $25k-50k, 61.7% for AGIs $50k-75k, 73.4% for AGIs $75k-100k, 76.4% for AGIs over 100k)
Household received Food Stamps/SNAP in the past 12 months: 666 Household did not receive Food Stamps/SNAP in the past 12 months: 1,468
Women who had a birth in the past 12 months: 41 (20 now married, 20 unmarried) Women who did not have a birth in the past 12 months: 720 (292 now married, 427 unmarried)
Housing units in zip code 97458 with a mortgage: 740 (21 second mortgage, 22 both second mortgage and home equity loan) Median monthly owner costs for units with a mortgage: $1,207 Median monthly owner costs for units without a mortgage: $387
Residents with income below the poverty level in 2022:
This zip code:
23.8%
Whole state:
12.1%
Residents with income below 50% of the poverty level in 2022:
This zip code:
10.4%
Whole state:
6.2%
Median number of rooms in houses and condos:
Here:
5.2
State:
6.2
Median number of rooms in apartments:
Here:
3.7
State:
4.0
Notable locations in this zip code not listed on our city pages
Notable locations in zip code 97458: Coos County Fairgrounds Outdoor Stage (A), Myrtlewood Campground (B), Myrtle Point Water Treatment Plant (C), Myrtle Point Sewage Treatment Plant (D), 4H Camp (E), Coos County Youth Camp (F), Camp Tawanka (G), Gaylord Siding (H), Pleasant Hill School (I), Arago County Park Boat Ramp (J), Coquille Myrtle Grove State Park Boat Ramp (K), Beaver Creek Boat Ramp (L), Bryant Boat Ramp (M), Baker Creek Boat Ramp (N), Coos County Fair and Rodeo (O), Myrtle Point Post Office (P), Myrtle Point Fire Department Station 1 (Q), Coquille Fire Department Station 2 (R), Myrtle Point Municipal Court (S), Myrtle Point Fire Department Station 3 (T). Display/hide their locations on the map
Streams, rivers, and creeks: Yellow Creek (A), Indian Creek (B), Cabin Creek (C), Hidden Creek (D), Myrtle Creek (E), Brummit Creek (F), Fetter Creek (G), Brownson Creek (H), Slide Creek (I). Display/hide their locations on the map
Parks in zip code 97458 include: Sandy Creek Covered Bridge (1), Lions Memorial Park (2), Rotary Park (3), Sunset Park (4), Cherry Creek Recreation Site (5), Middle Creek Recreation Site (6), Maria C Jackson State Park (7), Coquille Myrtle Grove State Park (8), Bennett County Park (9). Display/hide their locations on the map
In group quarters: 72 (-1 institutionalized population)
Size of family households: 731 2-persons, 288 3-persons, 135 4-persons, 36 5-persons, 26 6-persons, 46 7-or-more-persons
Size of nonfamily households: 657 1-person, 175 2-persons, 19 3-persons
614 married couples with children.
116 single-parent households (80 men, 36 women).
99.2% of residents of 97458 zip code speak English at home.
0.8% of residents speak Spanish at home (61% very well, 39% well).
0.3% of residents speak other Indo-European language at home (73% very well, 27% well).
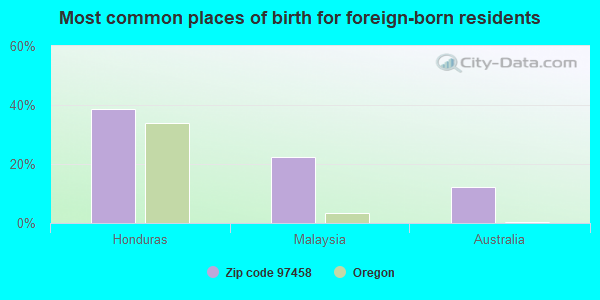
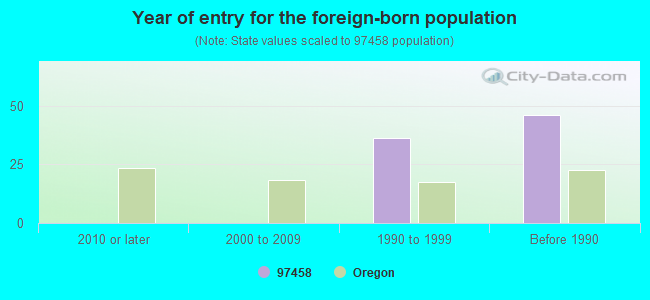
Foreign born population: 49 (1.0%) (56.1% of them are naturalized citizens)
This zip code:
1.0%
Whole state:
9.9%
39%Honduras
22%Malaysia
12%Australia
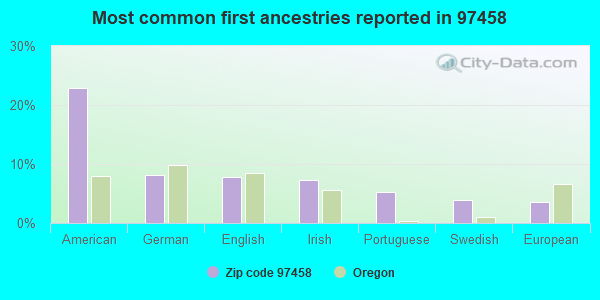
23%American
8%German
8%English
7%Irish
5%Portuguese
4%Swedish
4%European
Year of entry for the foreign-born population
02010 or later
02000 to 2009
361990 to 1999
46Before 1990
Facilities with environmental interests located in this zip code:
HODGE DISTRIBUTOR INC (1893 ROSEBURG RD in MYRTLE POINT, OR)
National Pollutant Discharge Elimination System NON-MAJOR (Tracking pollutant discharge elimination systems) - permit Business SIC classification: PETROLEUM BULK STATIONS AND TERMINALS
Housing units lacking complete plumbing facilities: 1.5% Housing units lacking complete kitchen facilities: 1.9%
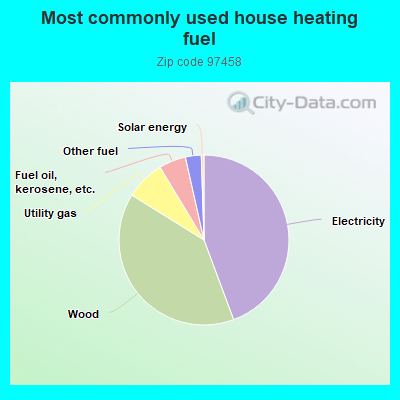
44.2%Electricity
39.4%Wood
7.5%Utility gas
5.1%Fuel oil, kerosene, etc.
3.0%Other fuel
0.5%Solar energy
Population in 1990: 5,246.
Place of birth for U.S.-born residents:
This state: 2,493
Northeast: 142
Midwest: 300
South: 197
West: 1,539
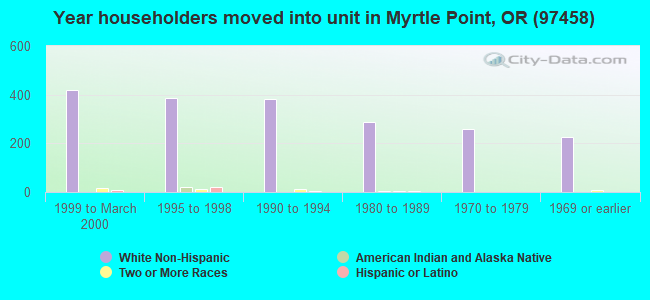
61% of the 97458 zip code residents lived in the same house 5 years ago. Out of people who lived in different houses, 64% lived in this county. Out of people who lived in different counties, 50% lived in Oregon.
88% of the 97458 zip code residents lived in the same house 1 year ago. Out of people who lived in different houses, 57% moved from this county. Out of people who lived in different houses, 9% moved from different county within same state. Out of people who lived in different houses, 32% moved from different state.
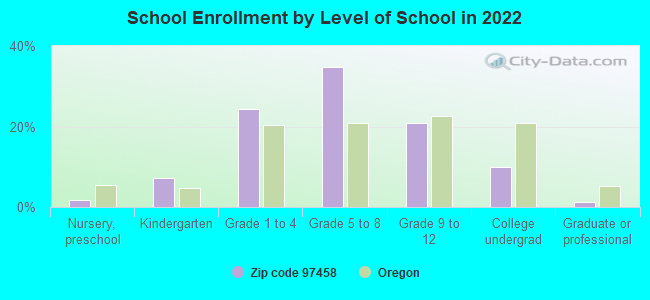
Private vs. public school enrollment:
Students in private schools in grades 1 to 8 (elementary and middle school): 27
Here:
7.5%
Oregon:
13.7%
Students in private schools in grades 9 to 12 (high school): 1
Here:
0.8%
Oregon:
8.8%
Students in private undergraduate colleges: 14
Here:
22.8%
Oregon:
17.7%
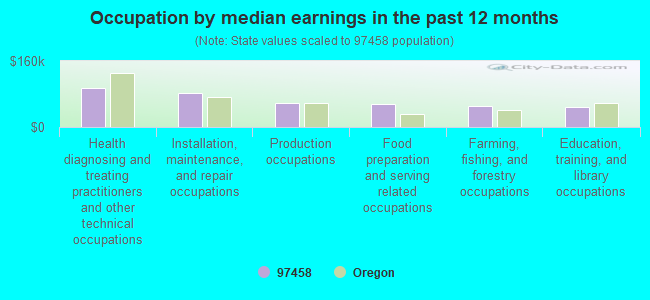
Occupation by median earnings in the past 12 months ($)
95,149Health diagnosing and treating practitioners and other technical occupations
83,003Installation, maintenance, and repair occupations
58,538Production occupations
55,101Food preparation and serving related occupations
51,991Farming, fishing, and forestry occupations
49,607Education, training, and library occupations
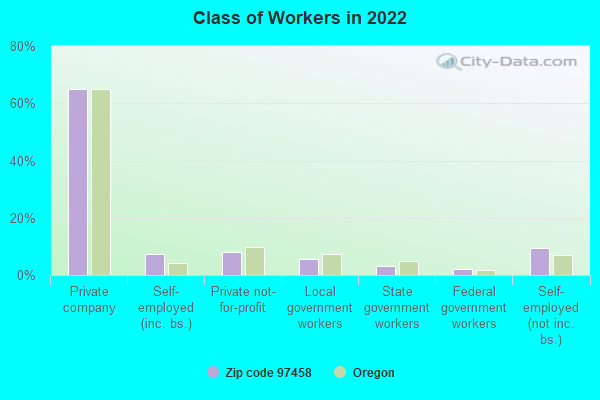
Top industries in this zip code by the number of employees in 2005:
Health Care and Social Assistance: Nursing Care Facilities (20-49: 1)
Accommodation and Food Services: Full-Service Restaurants (10-19: 2, 1-4: 1)
Accommodation and Food Services: Limited-Service Restaurants (10-19: 1, 1-4: 3)
Health Care and Social Assistance: Offices of Physicians (except Mental Health Specialists) (10-19: 1, 1-4: 3)
Construction: Drywall and Insulation Contractors (10-19: 1)
People in group quarters in 2010:
37 people in nursing facilities/skilled-nursing facilities
9 people in group homes intended for adults
3 people in workers' group living quarters and job corps centers
People in group quarters in 2000:
49 people in other group homes
5 people in nursing homes
Fatal accident statistics in 2014:
Fatal accident count: 2
Vehicles involved in fatal accidents: 2
Fatal accidents caused by drunken drivers: 0
Fatalities: 2
Persons involved in fatal accidents: 3
Pedestrians involved in fatal accidents: 0
Fatal accident statistics in 2013:
Fatal accident count: 1
Vehicles involved in fatal accidents: 1
Fatal accidents caused by drunken drivers: 0
Fatalities: 1
Persons involved in fatal accidents: 1
Pedestrians involved in fatal accidents: 0
2002 - 2018 National Fire Incident Reporting System (NFIRS) incidents
According to the data from the years 2002 - 2018 the average number of fire incidents per year is 13. The highest number of reported fires - 21 took place in 2004, and the least - 4 in 2017. The data has a dropping trend.
When looking into fire subcategories, the most reports belonged to: Structure Fires (63.8%), and Outside Fires (17.4%).
Fire incident types reported to NFIRS in Zip Code 97458


 Nearest zip codes: 97414, 97466, 97423, 97416, 97420, 97411.


 According to the data from the years 2002 - 2018 the average number of fire incidents per year is 13. The highest number of reported fires - 21 took place in 2004, and the least - 4 in 2017. The data has a dropping trend.
 When looking into fire subcategories, the most reports belonged to: Structure Fires (63.8%), and Outside Fires (17.4%).