Estimated zip code population in 2022: 38,356 Zip code population in 2010: 31,171 Zip code population in 2000: 22,590
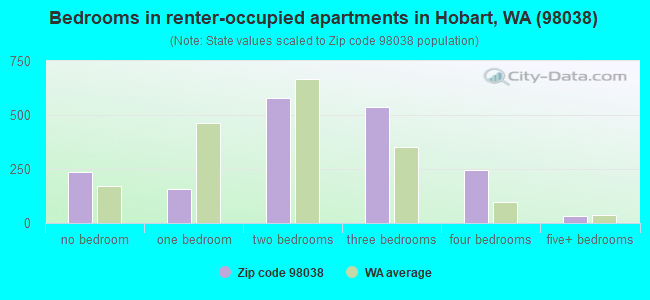
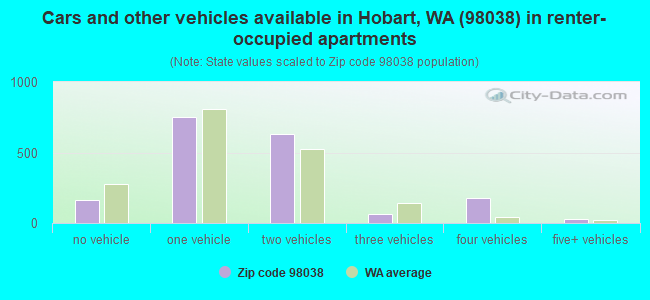
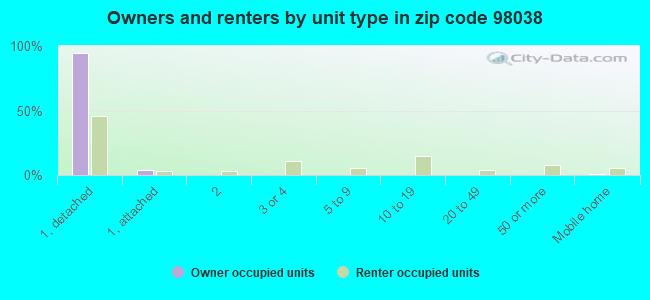
Houses and condos: 13,490 Renter-occupied apartments: 1,815
% of renters here:
14%
State:
36%
March 2022 cost of living index in zip code 98038: 112.4 (more than average, U.S. average is 100)
Land area: 66.5 sq. mi. Water area: 0.4 sq. mi.
Population density: 577 people per square mile
(low).
OSM Map
General Map
Google Map
MSN Map
OSM Map
General Map
Google Map
MSN Map
OSM Map
General Map
Google Map
MSN Map
OSM Map
General Map
Google Map
MSN Map
Please wait while loading the map...
Real estate property taxes paid for housing units in 2022:
This zip code:
0.8% ($6,281)
Washington:
0.8% ($4,283)
Median real estate property taxes paid for housing units with mortgages in 2022: $6,272 (0.8%) Median real estate property taxes paid for housing units with no mortgage in 2022: $6,361 (0.9%)
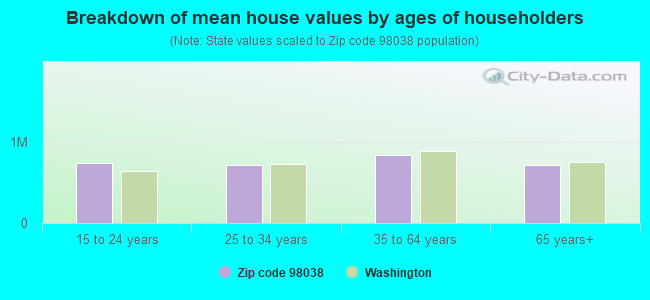
Estimated median house/condo value in 2022: $792,777
98038:
$792,777
Washington:
$569,500
According to our research of Washington and other state lists, there were 8 registered sex offenders living in 98038 zip code as of April 27, 2024. The ratio of all residents to sex offenders in zip code 98038 is 4,429 to 1. The ratio of registered sex offenders to all residents in this zip code is much lower than the state average.
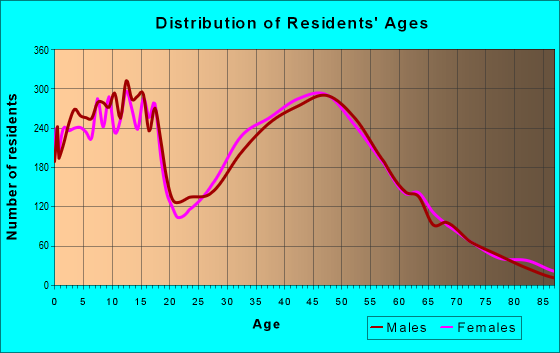
Median resident age:
This zip code:
38.7 years
Washington median age:
38.4 years
Average household size:
This zip code:
2.9 people
Washington:
2.5 people
Averages for the 2020 tax year for zip code 98038, filed in 2021:
Average Adjusted Gross Income (AGI) in 2020: $119,240 (Individual Income Tax Returns)
Here:
$119,240
State:
$99,264
Salary/wage: $106,097 (reported on 84.4% of returns)
Here:
$106,097
State:
$80,347
(% of AGI for various income ranges: 1056.2% for AGIs below $25k, 3298.6% for AGIs $25k-50k, 5899.6% for AGIs $50k-75k, 8997.7% for AGIs $75k-100k, 19333.8% for AGIs $100k-200k, 66531.1% for AGIs over 200k)
Taxable interest for individuals: $1,174 (reported on 43.4% of returns)
This zip code:
$1,174
Washington:
$2,077
(% of AGI for various income ranges: 20.4% for AGIs below $25k, 31.8% for AGIs $25k-50k, 48.6% for AGIs $50k-75k, 62.7% for AGIs $75k-100k, 73.1% for AGIs $100k-200k, 398.8% for AGIs over 200k)
Ordinary dividends: $4,569 (reported on 29.3% of returns)
Here:
$4,569
State:
$10,013
(% of AGI for various income ranges: 40.9% for AGIs below $25k, 64.9% for AGIs $25k-50k, 113.2% for AGIs $50k-75k, 155.6% for AGIs $75k-100k, 209.7% for AGIs $100k-200k, 1096.0% for AGIs over 200k)
Net capital gain/loss in AGI: +$21,017 (reported on 26.9% of returns)
Here:
+$21,017
State:
+$40,092
(% of AGI for various income ranges: 15.8% for AGIs below $25k, 32.9% for AGIs $25k-50k, 112.7% for AGIs $50k-75k, 188.6% for AGIs $75k-100k, 417.7% for AGIs $100k-200k, 8303.7% for AGIs over 200k)
Profit/loss from business: +$18,574 (reported on 13.7% of returns)
Here:
+$18,574
State:
+$18,312
(% of AGI for various income ranges: 85.7% for AGIs below $25k, 141.9% for AGIs $25k-50k, 219.3% for AGIs $50k-75k, 279.4% for AGIs $75k-100k, 434.2% for AGIs $100k-200k, 1909.1% for AGIs over 200k)
Taxable individual retirement arrangement distribution: $24,179 (reported on 9.3% of returns)
98038:
$24,179
Washington:
$24,221
(% of AGI for various income ranges: 57.2% for AGIs below $25k, 115.1% for AGIs $25k-50k, 232.1% for AGIs $50k-75k, 364.6% for AGIs $75k-100k, 503.1% for AGIs $100k-200k, 1131.8% for AGIs over 200k)
Self-employed (Keogh) retirement plans: $18,770 (reported on 0.6% of returns)
98038:
$18,770
Washington:
$24,166
(% of AGI for various income ranges: 20.6% for AGIs $100k-200k, 135.9% for AGIs over 200k)
Total itemized deductions: $32,916 (reported on 20.1% of returns)
Here:
$32,916
State:
$39,068
(% of AGI for various income ranges: 129.3% for AGIs below $25k, 253.1% for AGIs $25k-50k, 518.7% for AGIs $50k-75k, 743.4% for AGIs $75k-100k, 1355.1% for AGIs $100k-200k, 4771.1% for AGIs over 200k)
Charity contributions: $8,100 (reported on 15.2% of returns)
Here:
$8,100
State:
$15,331
(% of AGI for various income ranges: 3.8% for AGIs below $25k, 22.3% for AGIs $25k-50k, 41.5% for AGIs $50k-75k, 83.1% for AGIs $75k-100k, 227.4% for AGIs $100k-200k, 1229.2% for AGIs over 200k)
Taxes paid: $7,889 (reported on 20.0% of returns)
98038:
$7,889
State:
$7,774
(% of AGI for various income ranges: 19.7% for AGIs below $25k, 49.9% for AGIs $25k-50k, 143.1% for AGIs $50k-75k, 183.4% for AGIs $75k-100k, 338.9% for AGIs $100k-200k, 1099.8% for AGIs over 200k)
Earned income credit: $1,956 (reported on 5.1% of returns)
Here:
$1,956
State:
$2,020
(% of AGI for various income ranges: 43.3% for AGIs below $25k, 37.6% for AGIs $25k-50k)
Percentage of individuals using paid preparers for their 2020 taxes: 93.7%
Here:
94%
State:
93%
(% for various income ranges: 92.1% for AGIs below $25k, 93.3% for AGIs $25k-50k, 93.0% for AGIs $50k-75k, 93.2% for AGIs $75k-100k, 94.4% for AGIs $100k-200k, 95.5% for AGIs over 200k)
Averages for the 2012 tax year for zip code 98038, filed in 2013:
Average Adjusted Gross Income (AGI) in 2012: $87,535 (Individual Income Tax Returns)
Here:
$87,535
State:
$69,533
Salary/wage: $78,118 (reported on 87.0% of returns)
Here:
$78,118
State:
$57,267
(% of AGI for various income ranges: 74.8% for AGIs below $25k, 75.7% for AGIs $25k-50k, 78.2% for AGIs $50k-75k, 83.1% for AGIs $75k-100k, 86.7% for AGIs $100k-200k, 60.3% for AGIs over 200k)
Taxable interest for individuals: $801 (reported on 49.9% of returns)
This zip code:
$801
Washington:
$1,816
(% of AGI for various income ranges: 1.7% for AGIs below $25k, 1.0% for AGIs $25k-50k, 0.6% for AGIs $50k-75k, 0.3% for AGIs $75k-100k, 0.3% for AGIs $100k-200k, 0.4% for AGIs over 200k)
Ordinary dividends: $3,217 (reported on 26.9% of returns)
Here:
$3,217
State:
$8,163
(% of AGI for various income ranges: 1.9% for AGIs below $25k, 1.1% for AGIs $25k-50k, 1.0% for AGIs $50k-75k, 0.7% for AGIs $75k-100k, 0.8% for AGIs $100k-200k, 1.2% for AGIs over 200k)
Net capital gain/loss in AGI: +$6,589 (reported on 20.3% of returns)
Here:
+$6,589
State:
+$21,568
(% of AGI for various income ranges: 0.1% for AGIs $50k-75k, 0.5% for AGIs $75k-100k, 0.8% for AGIs $100k-200k, 4.5% for AGIs over 200k)
Profit/loss from business: +$16,221 (reported on 13.3% of returns)
Here:
+$16,221
State:
+$16,521
(% of AGI for various income ranges: 5.1% for AGIs below $25k, 3.4% for AGIs $25k-50k, 2.2% for AGIs $50k-75k, 1.9% for AGIs $75k-100k, 2.2% for AGIs $100k-200k, 2.7% for AGIs over 200k)
Taxable individual retirement arrangement distribution: $16,714 (reported on 10.8% of returns)
98038:
$16,714
Washington:
$18,648
(% of AGI for various income ranges: 3.4% for AGIs below $25k, 3.5% for AGIs $25k-50k, 2.9% for AGIs $50k-75k, 2.9% for AGIs $75k-100k, 1.8% for AGIs $100k-200k, 1.1% for AGIs over 200k)
Self-employment retirement plans: $17,250 (reported on 0.4% of returns)
98038:
$17,250
Washington:
$20,087
Total itemized deductions: $23,692 (19% of AGI, reported on 54.2% of returns)
Here:
$23,692
State:
$23,872
Here:
18.8% of AGI
State:
18.2% of AGI
(% of AGI for various income ranges: 17.2% for AGIs below $25k, 15.6% for AGIs $25k-50k, 17.2% for AGIs $50k-75k, 17.3% for AGIs $75k-100k, 16.0% for AGIs $100k-200k, 9.3% for AGIs over 200k)
Charity contributions: $3,556 (reported on 44.8% of returns)
Here:
$3,556
State:
$4,465
(% of AGI for various income ranges: 1.1% for AGIs below $25k, 1.3% for AGIs $25k-50k, 1.5% for AGIs $50k-75k, 1.8% for AGIs $75k-100k, 2.0% for AGIs $100k-200k, 1.9% for AGIs over 200k)
Taxes paid: $6,745 (reported on 53.8% of returns)
98038:
$6,745
State:
$6,400
(% of AGI for various income ranges: 4.0% for AGIs below $25k, 4.2% for AGIs $25k-50k, 4.7% for AGIs $50k-75k, 5.0% for AGIs $75k-100k, 4.5% for AGIs $100k-200k, 2.9% for AGIs over 200k)
Earned income credit: $1,882 (reported on 6.7% of returns)
Here:
$1,882
State:
$2,073
(% of AGI for various income ranges: 3.3% for AGIs below $25k, 0.7% for AGIs $25k-50k)
Percentage of individuals using paid preparers for their 2012 taxes: 39.6%
Here:
40%
State:
43%
(% for various income ranges: 31.9% for AGIs below $25k, 39.0% for AGIs $25k-50k, 41.9% for AGIs $50k-75k, 41.6% for AGIs $75k-100k, 41.5% for AGIs $100k-200k, 53.2% for AGIs over 200k)
Averages for the 2004 tax year for zip code 98038, filed in 2005:
Average Adjusted Gross Income (AGI) in 2004: $66,077 (Individual Income Tax Returns)
Here:
$66,077
State:
$54,331
Salary/wage: $60,149 (reported on 88.0% of returns)
Here:
$60,149
State:
$45,761
(% of AGI for various income ranges: 138.0% for AGIs below $10k, 71.4% for AGIs $10k-25k, 79.5% for AGIs $25k-50k, 84.4% for AGIs $50k-75k, 88.5% for AGIs $75k-100k, 74.5% for AGIs over 100k)
Taxable interest for individuals: $1,243 (reported on 54.4% of returns)
This zip code:
$1,243
Washington:
$2,110
(% of AGI for various income ranges: 7.3% for AGIs below $10k, 3.0% for AGIs $10k-25k, 1.5% for AGIs $25k-50k, 0.8% for AGIs $50k-75k, 0.7% for AGIs $75k-100k, 0.9% for AGIs over 100k)
Taxable dividends: $2,180 (reported on 33.3% of returns)
Here:
$2,180
State:
$5,879
(% of AGI for various income ranges: 6.3% for AGIs below $10k, 2.1% for AGIs $10k-25k, 1.1% for AGIs $25k-50k, 0.9% for AGIs $50k-75k, 0.8% for AGIs $75k-100k, 1.2% for AGIs over 100k)
Net capital gain/loss: +$8,085 (reported on 26.3% of returns)
Here:
+$8,085
State:
+$15,835
(% of AGI for various income ranges: -0.4% for AGIs below $10k, 0.8% for AGIs $10k-25k, 0.4% for AGIs $25k-50k, 0.6% for AGIs $50k-75k, 0.8% for AGIs $75k-100k, 6.3% for AGIs over 100k)
Profit/loss from business: +$13,698 (reported on 14.2% of returns)
Here:
+$13,698
State:
+$13,994
(% of AGI for various income ranges: 7.8% for AGIs below $10k, 5.2% for AGIs $10k-25k, 3.6% for AGIs $25k-50k, 2.5% for AGIs $50k-75k, 1.5% for AGIs $75k-100k, 3.4% for AGIs over 100k)
IRA payment deduction: $2,990 (reported on 2.7% of returns)
98038:
$2,990
Washington:
$3,001
(% of AGI for various income ranges: 0.3% for AGIs $10k-25k, 0.2% for AGIs $25k-50k, 0.2% for AGIs $50k-75k, 0.1% for AGIs $75k-100k, 0.1% for AGIs over 100k)
Self-employed pension: $14,289 (reported on 0.8% of returns)
Here:
$14,289
Washington:
$14,244
(% of AGI for various income ranges: 0.1% for AGIs $50k-75k, 0.0% for AGIs $75k-100k, 0.3% for AGIs over 100k)
Total itemized deductions: $20,193 (22% of AGI, reported on 58.4% of returns)
Here:
$20,193
State:
$19,669
Here:
22.4% of AGI
State:
20.7% of AGI
(% of AGI for various income ranges: 28.3% for AGIs below $10k, 20.7% for AGIs $10k-25k, 19.6% for AGIs $25k-50k, 21.6% for AGIs $50k-75k, 20.2% for AGIs $75k-100k, 14.5% for AGIs over 100k)
Charity contributions deductions: $2,763 (3% of AGI, reported on 51.5% of returns)
Here:
$2,763
State:
$3,569
Here:
3.0% of AGI
State:
3.5% of AGI
(% of AGI for various income ranges: 1.2% for AGIs below $10k, 1.3% for AGIs $10k-25k, 1.7% for AGIs $25k-50k, 1.9% for AGIs $50k-75k, 2.2% for AGIs $75k-100k, 2.4% for AGIs over 100k)
Total tax: $9,449 (reported on 84.7% of returns)
98038:
$9,449
State:
$9,065
(% of AGI for various income ranges: 4.0% for AGIs below $10k, 4.7% for AGIs $10k-25k, 7.0% for AGIs $25k-50k, 8.1% for AGIs $50k-75k, 9.2% for AGIs $75k-100k, 16.9% for AGIs over 100k)
Earned income credit: $1,452 (reported on 5.7% of returns)
Here:
$1,452
State:
$1,607
Percentage of individuals using paid preparers for their 2004 taxes: 45.2%
Here:
45%
State:
49%
(% for various income ranges: 31.4% for AGIs below $10k, 42.8% for AGIs $10k-25k, 50.7% for AGIs $25k-50k, 46.1% for AGIs $50k-75k, 45.5% for AGIs $75k-100k, 50.4% for AGIs over 100k)
Likely homosexual households (counted as self-reported same-sex unmarried-partner households)
Lesbian couples: 0.1% of all households
Gay men: 0.0% of all households
Household received Food Stamps/SNAP in the past 12 months: 527 Household did not receive Food Stamps/SNAP in the past 12 months: 12,693
Women who had a birth in the past 12 months: 421 (333 now married, 88 unmarried) Women who did not have a birth in the past 12 months: 8,208 (4,959 now married, 3,211 unmarried)
Housing units in zip code 98038 with a mortgage: 8,813 (1,185 second mortgage, 35 home equity loan, 1,100 both second mortgage and home equity loan) Houses without a mortgage: 96
Median monthly owner costs for units with a mortgage: $2,800 Median monthly owner costs for units without a mortgage: $880
Residents with income below the poverty level in 2022:
This zip code:
5.0%
Whole state:
10.0%
Residents with income below 50% of the poverty level in 2022:
This zip code:
1.5%
Whole state:
4.6%
Median number of rooms in houses and condos:
Here:
7.1
State:
6.5
Median number of rooms in apartments:
Here:
4.7
State:
3.9
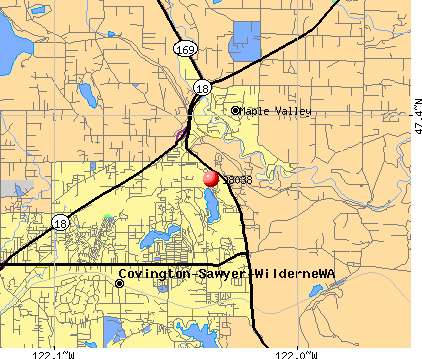
Notable locations in this zip code not listed on our city pages
Notable locations in zip code 98038: Taylor (A), Seattle Water Supply Intake (B), Walsh Lake Nursery (C), Cedar Point Lookout (D), Shingle Mill (E), Links at Olson Mansion (F), Lake Wilderness Golf Course (G), Elk Run Golf Course (H), Four Corner Square (I), Hemlock (J), Lake Wilderness Resort (K), King County Fire Protection District 43 Maple Valley Fire and Life Safety Station 80 (L), King County Fire Protection District 43 Maple Valley Fire and Life Safety Station 85 (M), King County Fire Protection District 43 Maple Valley Fire and Life Safety Station 81 (N), King County Fire Protection District 43 Maple Valley Fire and Life Safety Station 83 (O). Display/hide their locations on the map
Churches in zip code 98038 include: The Church of Jesus Christ of Latter Day Saints (A), Saint Georges Episcopal Church (B), Maple Valley Church of the Nazarene (C), Common Ground Church (D), Hope Fellowship Church (E), Maranatha Assembly of God Church (F), Maple Valley Presbyterian Church (G), Sanatan Dharma Temple and Cultural Center (H), Shepherd of the Valley Lutheran Church (I). Display/hide their locations on the map
Streams, rivers, and creeks: Canyon Creek (A), Hotel Creek (B), Lions Run (C), Steele Creek (D), Webster Creek (E), Williams Creek (F), Rock Creek (G). Display/hide their locations on the map
Parks in zip code 98038 include: Levdansky County Park (1), Lake Francis Park (2), Lake Wilderness Park (3), Fernwood Park (4). Display/hide their locations on the map
In group quarters: 22 (-1 institutionalized population)
Size of family households: 3,762 2-persons, 2,301 3-persons, 2,742 4-persons, 1,252 5-persons, 298 6-persons, 216 7-or-more-persons
Size of nonfamily households: 2,021 1-person, 453 2-persons, 25 3-persons
8,378 married couples with children.
2,012 single-parent households (435 men, 1,577 women).
87.3% of residents of 98038 zip code speak English at home.
1.2% of residents speak Spanish at home (91% very well, 1% well, 8% not well).
4.0% of residents speak other Indo-European language at home (79% very well, 13% well, 5% not well, 2% not at all).
6.5% of residents speak Asian or Pacific Island language at home (75% very well, 19% well, 6% not well).
0.4% of residents speak other language at home (97% very well, 3% well).
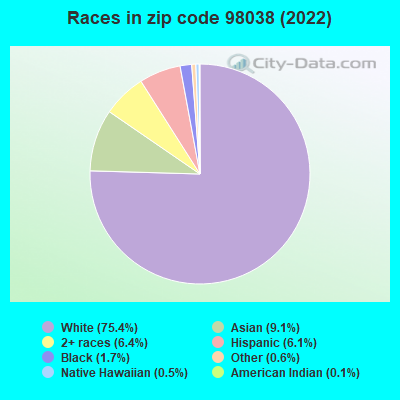
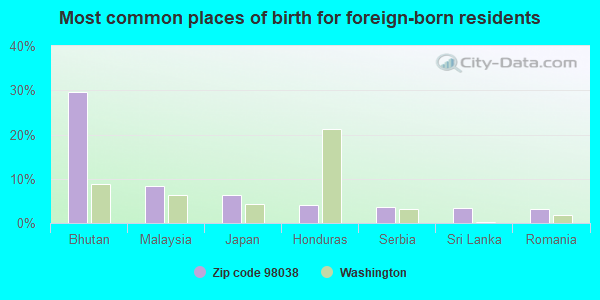
Foreign born population: 4,295 (11.2%) (53.6% of them are naturalized citizens)
This zip code:
11.2%
Whole state:
15.3%
30%Bhutan
8%Malaysia
6%Japan
4%Honduras
4%Serbia
3%Sri Lanka
3%Romania
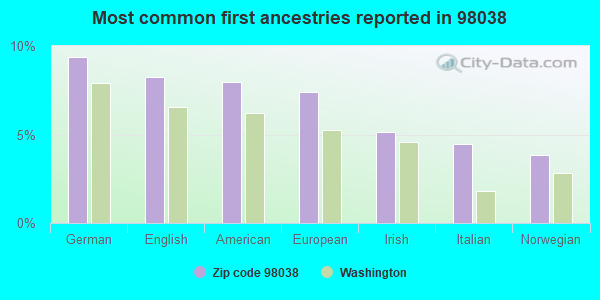
9%German
8%English
8%American
7%European
5%Irish
4%Italian
4%Norwegian
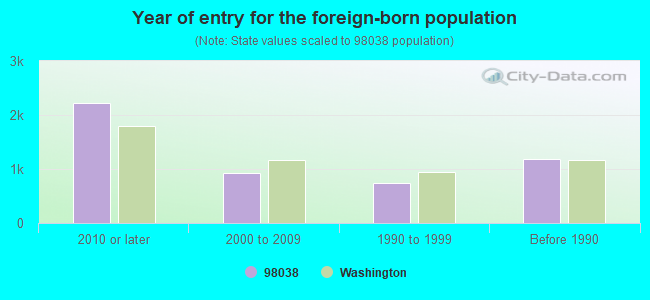
Year of entry for the foreign-born population
2,2222010 or later
9342000 to 2009
7451990 to 1999
1,178Before 1990
Facilities with environmental interests located in this zip code:
CEDAR GROVE COMPOSTING INC (17825 CEDAR GROVE RD SE in MAPLE VALLEY, WA)
(Integrated Compliance Information System) - ICIS-10-1999-0091, FORMAL ENFORCEMENT ACTION, ICIS-10-1994-0087, ICIS-10-1999-0096, ICIS-10-1999-0090, ICIS-10-1999-0092, ICIS-10-1988-0004, ICIS-10-1994-0218, National Pollutant Discharge Elimination System NON-MAJOR (Tracking pollutant discharge elimination systems) - permit Small Quantity Generators, between 100 kg and 1000 kg of hazardous waste/month (Resource Conservation and Recovery Act (tracking hazardous waste)) STATE MASTER (Washington State Department of Ecology's Facility/Site identification system) - HAZWASTE-CRK000050430, EPCRA, WATQUAL-SO3002487, NPDES STORMWATER PERMIT, HAZWASTE-WAR000009670, SQG Business SIC classification: FERTILIZERS, MIXING ONLY; PESTICIDES AND AGRICULTURAL CHEMICALS; REFUSE SYSTEMS Business NAICS classification: OTHER NONHAZARDOUS WASTE TREATMENT AND DISPOSAL.; OTHER NONHAZARDOUS WASTE TREATMENT AND DISPOSAL. Alternative names: CEDAR GROVE COMPOSTING MAPLE V
BOEING COMPANY MAPLE VALLEY SITE (T22 R6 S24 BOEING in MAPLE VALLEY, WA) . Federal Facility. UNDETERMINED OR UNKNOWN AGENCY AFFILIATION
(Resource Conservation and Recovery Act (tracking hazardous waste)) Large Quantity Generators, more that 1000 kg of hazardous waste/month (Resource Conservation and Recovery Act (tracking hazardous waste)) STATE MASTER (Washington State Department of Ecology's Facility/Site identification system) - HAZWASTE-WAR000009886, LQG Business SIC classification: NONCLASSIFIABLE ESTABLISHMENTS Organizations: US EPA (CONTACT/OPERATOR)
, DAVID KOLAN (CONTACT/OPERATOR)
, JULIA SISHCO (CONTACT/OWNER)
Alternative names: BOEING CO MAPLE VALLEY SITE, US EPA LEHMAN MILLARD SITE
BOEING CO THE JONES ROAD SITE (T23N R6E S19 SE1/4 NE1/4 W 752 in MAPLE VALLEY, WA)
(Resource Conservation and Recovery Act (tracking hazardous waste)) STATE MASTER (Washington State Department of Ecology's Facility/Site identification system) - HAZWASTE-WAD988474292, HAZARDOUS WASTE PROGRAM Business SIC classification: NONCLASSIFIABLE ESTABLISHMENTS Organizations: THE BOEING COMPANY (CONTACT/ HAZARDOUS WASTE)
BOEING QUEEN CITY FARMS (22715 SOUTHEAST 168TH WAY in MAPLE VALLEY, WA)
(Resource Conservation and Recovery Act (tracking hazardous waste)) STATE MASTER (Washington State Department of Ecology's Facility/Site identification system) - HAZWASTE-WAR000004960, HAZARDOUS WASTE PROGRAM Business SIC classification: HEAVY CONSTRUCTION Organizations: THE BOEING COMPANY (CONTACT/OPERATOR)
, BOEING CO (CONTACT/OWNER)
Alternative names: BOEING CO QUEEN CITY FARMS, BOEING CO QUEEN CITY FARMS, BOEING QUEEN CITY FARMS CERCLA SITE
CLEAN SERVICE CO INC 233RD PL (27018 SE 233RD PL in MAPLE VALLEY, WA)
Conditionally Exempt Small Quantity Generators, less than 100 kg/month of hazardous waste (Resource Conservation and Recovery Act (tracking hazardous waste)) STATE MASTER (Washington State Department of Ecology's Facility/Site identification system) - HAZWASTE-WA0000630509, CESQG Business SIC classification: REPAIR SHOPS AND RELATED SERVICES Business NAICS classification: SEPTIC TANK AND RELATED SERVICES. Organizations: PAUL KEMP (CONTACT/OPERATOR)
, JOHN BAHLENHORST (CONTACT/OWNER)
CEDAR SHORES PIT (21010 CEDAR GROVE RD SE in MAPLE VALLEY, WA)
National Pollutant Discharge Elimination System NON-MAJOR (Tracking pollutant discharge elimination systems) - permit STATE MASTER (Washington State Department of Ecology's Facility/Site identification system) - TOXICS-4796, UNDERGROUND STORAGE TANK PROGRAM, WATQUAL-WAG503070, National Pollutant Discharge Elimination System Permit Business SIC classification: CRUSHED AND BROKEN LIMESTONE; READY-MIXED CONCRETE Organizations: STONEWAY CONCRETE (CONTACT/OPERATOR)
Alternative names: CEDAR SHORES PLANT, STONEWAY CONCRETE CO, STONEWAY CONCRETE CEDAR SHORES
ACE CLEANERS (26921 MAPLE VALLEY BLACK DIAMO in MAPLE VALLEY, WA)
Conditionally Exempt Small Quantity Generators, less than 100 kg/month of hazardous waste (Resource Conservation and Recovery Act (tracking hazardous waste)) - notification STATE MASTER (Washington State Department of Ecology's Facility/Site identification system) - HAZWASTE-WAD988507661, CESQG Business SIC classification: DRYCLEANING PLANTS, EXCEPT RUG CLEANING Organizations: MICHAEL YU (CONTACT/OPERATOR)
BP SERVICE STATION 03144 (26821 MAPLE VALLEY HIGHWAY in MAPLE VALLEY, WA)
Conditionally Exempt Small Quantity Generators, less than 100 kg/month of hazardous waste (Resource Conservation and Recovery Act (tracking hazardous waste)) STATE MASTER (Washington State Department of Ecology's Facility/Site identification system) - TOXICS-9555, LEAKING STORAGE TANK, UNDERGROUND STORAGE TANK PROGRAM, HAZWASTE-WAD988489829, EPCRA, HAZARDOUS WASTE PROGRAM, TOXICS-, REMEDIAL ACTION PLAN MONITORING Business SIC classification: GASOLINE SERVICE STATIONS Organizations: GHRMAI ABRAHA (CONTACT/OPERATOR)
, CONOCOPHILLIPS COMPANY (CONTACT/OWNER)
Alternative names: BP SERVICE STATION MAPLE VALLEY
CEDAR RIVER MIDDLE SCHOOL (22615 SWEENEY RD SE in MAPLE VALLEY, WA)
(National Center for Education Statistics) - STATE ID-3937 Organizations: TAHOMA SCH DIST 409 (SCHOOL DISTRICT)
CEDAR RECYCLING CENTER (18409 MAPLE VALLEY HWY in MAPLE VALLEY, WA)
(Resource Conservation and Recovery Act (tracking hazardous waste))
ALLPRIDE INC (26217 MAPLE VALLEY HWY SE in MAPLE VALLEY, WA)
(Resource Conservation and Recovery Act (tracking hazardous waste)) Organizations: PAUL KEMP (CONTACT/OPERATOR)
, ALL PRIDE PARKING LOT SERVICES INC (CONTACT/OWNER)
CLEAN SERVICE CO INC 246TH ST (21803 SE 246TH ST in MAPLE VALLEY, WA)
(Resource Conservation and Recovery Act (tracking hazardous waste))
Housing units lacking complete plumbing facilities: 0.3% Housing units lacking complete kitchen facilities: 1.8%
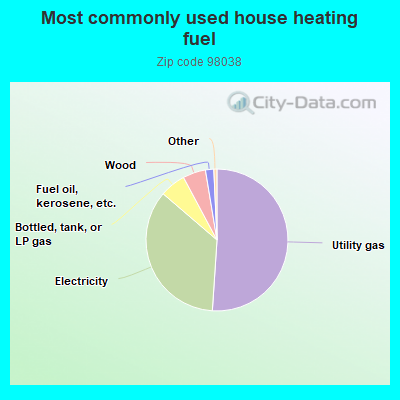
51.0%Utility gas
35.2%Electricity
5.9%Bottled, tank, or LP gas
5.2%Wood
1.9%Fuel oil, kerosene, etc.
Population in 1990: 13,768. Population change in the 1990s: +8,822 (+64.1%).
Place of birth for U.S.-born residents:
This state: 18,870
Northeast: 1,447
Midwest: 3,195
South: 1,844
West: 7,957
59% of the 98038 zip code residents lived in the same house 5 years ago. Out of people who lived in different houses, 69% lived in this county. Out of people who lived in different counties, 50% lived in Washington.
89% of the 98038 zip code residents lived in the same house 1 year ago. Out of people who lived in different houses, 72% moved from this county. Out of people who lived in different houses, 7% moved from different county within same state. Out of people who lived in different houses, 14% moved from different state. Out of people who lived in different houses, 7% moved from abroad.
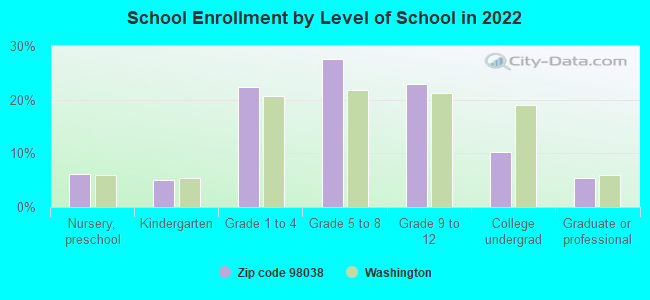
Private vs. public school enrollment:
Students in private schools in grades 1 to 8 (elementary and middle school): 438
Here:
7.8%
Washington:
12.4%
Students in private schools in grades 9 to 12 (high school): 125
Here:
4.9%
Washington:
9.2%
Students in private undergraduate colleges: 295
Here:
25.7%
Washington:
16.5%
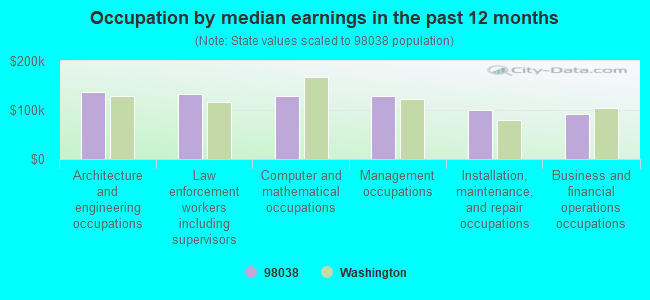
Occupation by median earnings in the past 12 months ($)
136,523Architecture and engineering occupations
132,491Law enforcement workers including supervisors
128,948Computer and mathematical occupations
128,562Management occupations
100,807Installation, maintenance, and repair occupations
92,726Business and financial operations occupations
Top industries in this zip code by the number of employees in 2005:
Professional, Scientific, and Technical Services: Computer Systems Design Services (100-249 employees: 1 establishment, 1-4 employees: 5 establishments)
2002 - 2018 National Fire Incident Reporting System (NFIRS) incidents
According to the data from the years 2002 - 2018 the average number of fires per year is 73. The highest number of fire incidents - 180 took place in 2003, and the least - 7 in 2016. The data has an increasing trend.
When looking into fire subcategories, the most incidents belonged to: Outside Fires (40.7%), and Structure Fires (40.0%).
Fire incident types reported to NFIRS in Zip Code 98038
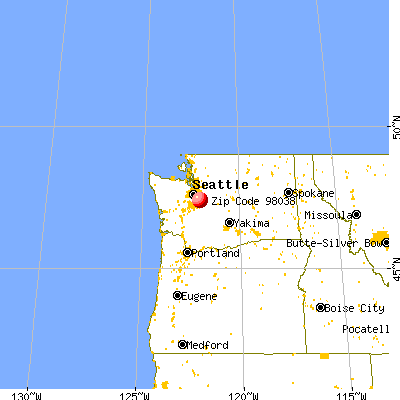


 Nearest zip codes: 98027, 98051, 98010, 98050, 98029, 98024.
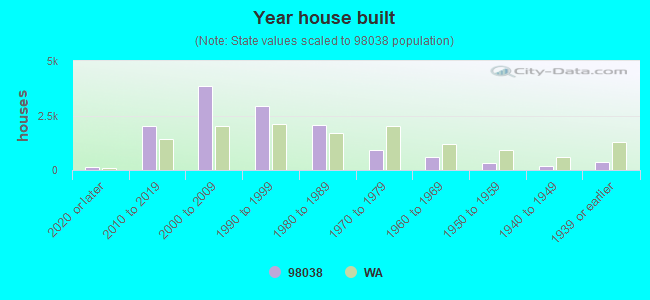


 According to the data from the years 2002 - 2018 the average number of fires per year is 73. The highest number of fire incidents - 180 took place in 2003, and the least - 7 in 2016. The data has an increasing trend.
 When looking into fire subcategories, the most incidents belonged to: Outside Fires (40.7%), and Structure Fires (40.0%).