Kent, Washington
Kent: Kent Station 3 (Kent 98032, WA)
Kent: Kent Station
Kent: Naked Pizza Kent Station. Yum...

Kent: Humanity Salons in Kent
Kent: Kent Station 2 (Kent 98032, WA)
Kent: Earthworks park and view of the valley Kent, Wa
- add
your
Submit your own pictures of this city and show them to the world
- OSM Map
- General Map
- Google Map
- MSN Map
Population change since 2000: +69.0%
 |
| Males: 66,753 | |
| Females: 67,639 |
| Median resident age: | 35.2 years |
| Washington median age: | 38.4 years |
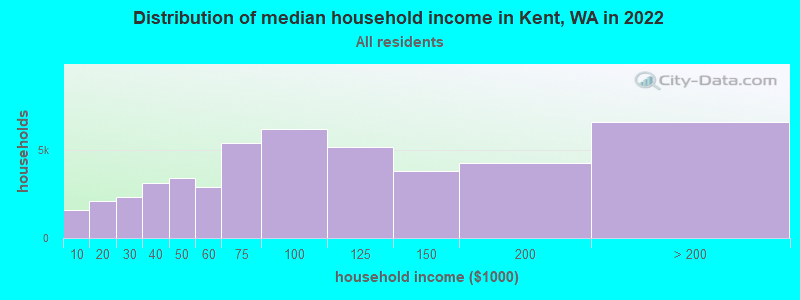
| Kent: | $83,314 |
| WA: | $91,306 |
Estimated per capita income in 2022: $39,238 (it was $21,390 in 2000)
Kent city income, earnings, and wages data
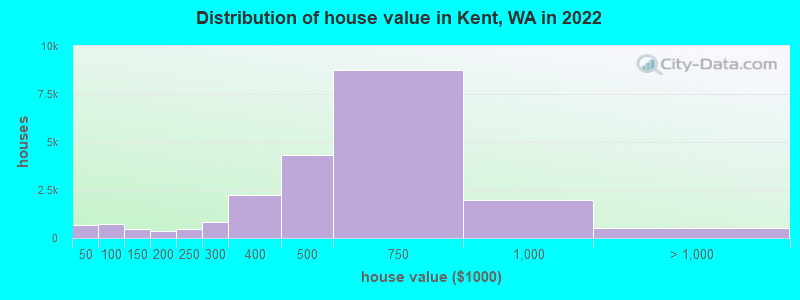
Estimated median house or condo value in 2022: $561,400 (it was $168,100 in 2000)
| Kent: | $561,400 |
| WA: | $569,500 |
Mean prices in 2022: all housing units: $574,488; detached houses: $648,462; townhouses or other attached units: $468,383; in 3-to-4-unit structures: $298,232; in 5-or-more-unit structures: $271,794; mobile homes: $95,088
Median gross rent in 2022: $1,703.
(8.6% for White Non-Hispanic residents, 17.4% for Black residents, 13.2% for Hispanic or Latino residents, 10.5% for American Indian residents, 6.4% for Native Hawaiian and other Pacific Islander residents, 14.7% for other race residents, 17.0% for two or more races residents)
Detailed information about poverty and poor residents in Kent, WA


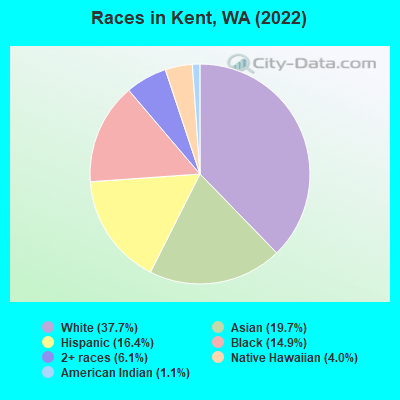
- 50,61637.7%White alone
- 26,44819.7%Asian alone
- 22,10816.4%Hispanic
- 19,99714.9%Black alone
- 8,2446.1%Two or more races
- 5,3914.0%Native Hawaiian and Other
Pacific Islander alone - 1,4831.1%American Indian alone
- 1130.08%Other race alone
Races in Kent detailed stats: ancestries, foreign born residents, place of birth
According to our research of Washington and other state lists, there were 47 registered sex offenders living in Kent, Washington as of April 27, 2024.
The ratio of all residents to sex offenders in Kent is 2,713 to 1.
The ratio of registered sex offenders to all residents in this city is lower than the state average.
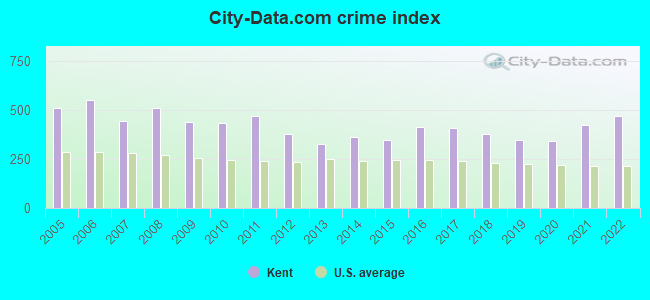
The City-Data.com crime index weighs serious crimes and violent crimes more heavily. Higher means more crime, U.S. average is 246.1. It adjusts for the number of visitors and daily workers commuting into cities.
- means the value is smaller than the state average.- means the value is about the same as the state average.
- means the value is bigger than the state average.
- means the value is much bigger than the state average.
Crime rate in Kent detailed stats: murders, rapes, robberies, assaults, burglaries, thefts, arson
Full-time law enforcement employees in 2021, including police officers: 194 (145 officers - 131 male; 14 female).
| Officers per 1,000 residents here: | 1.10 |
| Washington average: | 1.35 |
 Recent articles from our blog. Our writers, many of them Ph.D. graduates or candidates, create easy-to-read articles on a wide variety of topics.

 | Safest areas to live near/in Kent? (4 replies) |
| My Husband's Job is Moving from Kent to Renton (9 replies) |
| Job in Kent, Good Commute Area Info (13 replies) |
| Where to live in Kent Washington area? Help! (6 replies) |
| Kent was one of the 10 fastest-growing cities in the country in 2020 (1 reply) |
| Job relocation in Kent (4 replies) |
Latest news from Kent, WA collected exclusively by city-data.com from local newspapers, TV, and radio stations
Ancestries: European (5.3%), Somali (4.7%), Ukrainian (3.7%), Afghan (3.6%), English (3.0%), German (2.9%).
Current Local Time: PST time zone
Incorporated in 1890
Elevation: 50 feet
Land area: 28.0 square miles.
Population density: 4,794 people per square mile (average).
45,590 residents are foreign born (17.6% Asia, 6.6% Latin America).
| This city: | 33.5% |
| Washington: | 14.9% |
Median real estate property taxes paid for housing units with mortgages in 2022: $5,115 (0.9%)
Median real estate property taxes paid for housing units with no mortgage in 2022: $5,125 (1.0%)
Nearest city with pop. 200,000+: East Seattle, WA (16.4 miles  , pop. 480,100).
Nearest city with pop. 1,000,000+: Los Angeles, CA (941.3 miles , pop. 3,694,820).
Nearest cities:
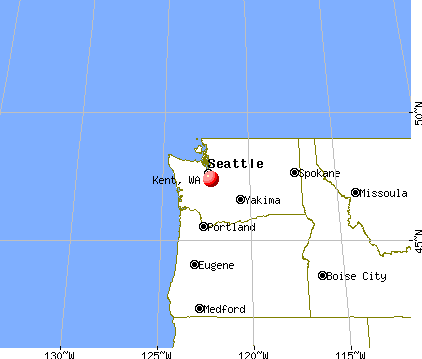
), ), ), )Latitude: 47.38 N, Longitude: 122.23 W
Daytime population change due to commuting: +1,081 (+0.8%)
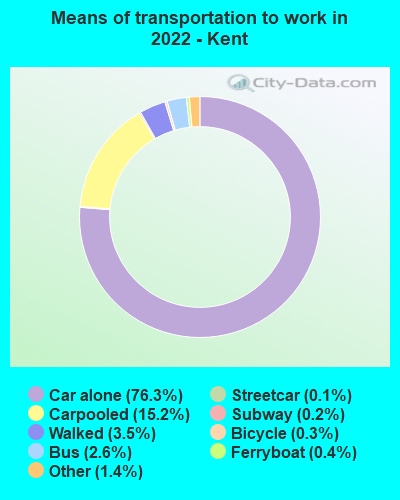
Workers who live and work in this city: 23,838 (34.8%)
Area code: 253
Property values in Kent, WA
Kent, Washington accommodation & food services, waste management - Economy and Business Data
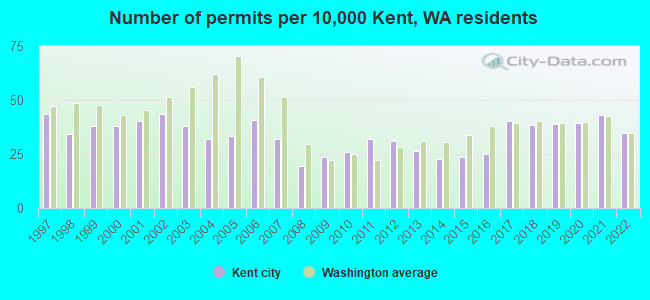
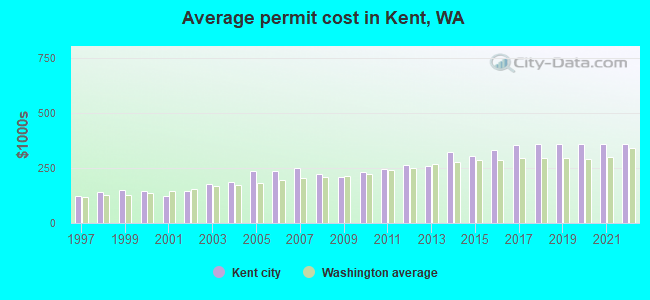
Single-family new house construction building permits:
- 2022: 277 buildings, average cost: $357,600
- 2021: 343 buildings, average cost: $357,600
- 2020: 313 buildings, average cost: $357,600
- 2019: 310 buildings, average cost: $357,500
- 2018: 305 buildings, average cost: $358,100
- 2017: 319 buildings, average cost: $356,600
- 2016: 199 buildings, average cost: $331,800
- 2015: 189 buildings, average cost: $306,000
- 2014: 180 buildings, average cost: $323,600
- 2013: 211 buildings, average cost: $260,000
- 2012: 247 buildings, average cost: $262,500
- 2011: 253 buildings, average cost: $247,000
- 2010: 206 buildings, average cost: $230,200
- 2009: 186 buildings, average cost: $207,900
- 2008: 154 buildings, average cost: $222,300
- 2007: 254 buildings, average cost: $250,300
- 2006: 325 buildings, average cost: $236,900
- 2005: 266 buildings, average cost: $235,600
- 2004: 254 buildings, average cost: $185,600
- 2003: 301 buildings, average cost: $176,800
- 2002: 346 buildings, average cost: $147,300
- 2001: 320 buildings, average cost: $122,500
- 2000: 302 buildings, average cost: $144,400
- 1999: 302 buildings, average cost: $152,300
- 1998: 272 buildings, average cost: $141,300
- 1997: 345 buildings, average cost: $123,700
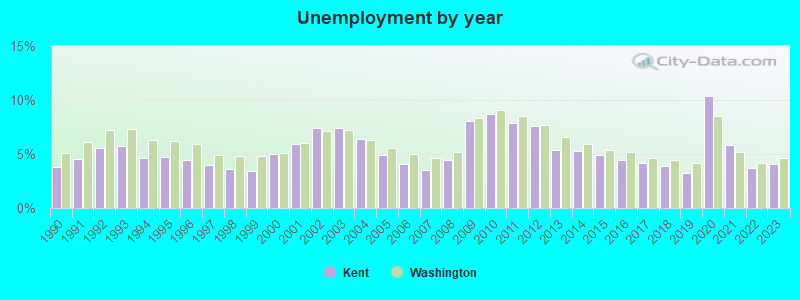
| Here: | 4.1% |
| Washington: | 4.6% |
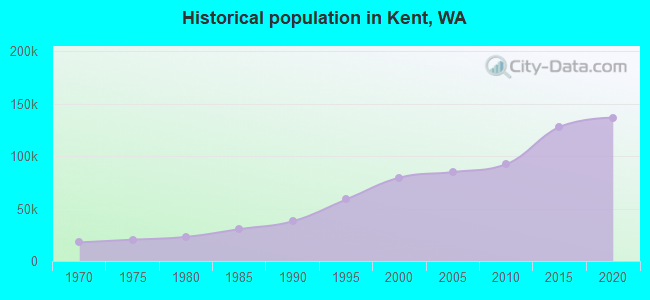
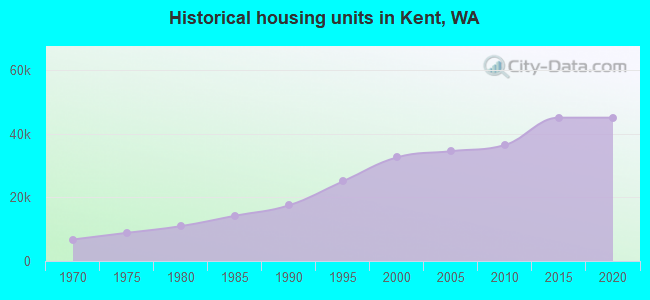
Population change in the 1990s: +17,722 (+28.7%).
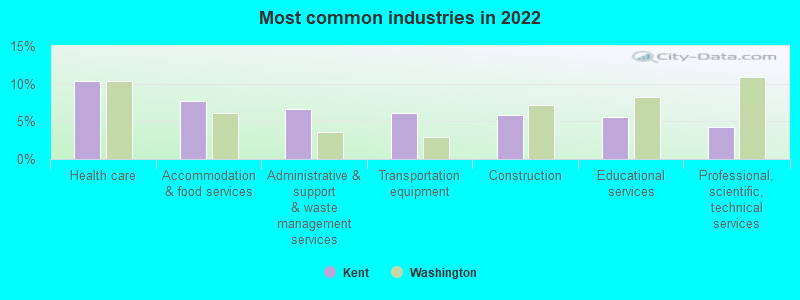
- Health care (10.3%)
- Accommodation & food services (7.6%)
- Administrative & support & waste management services (6.7%)
- Transportation equipment (6.1%)
- Construction (5.8%)
- Educational services (5.5%)
- Professional, scientific, technical services (4.2%)
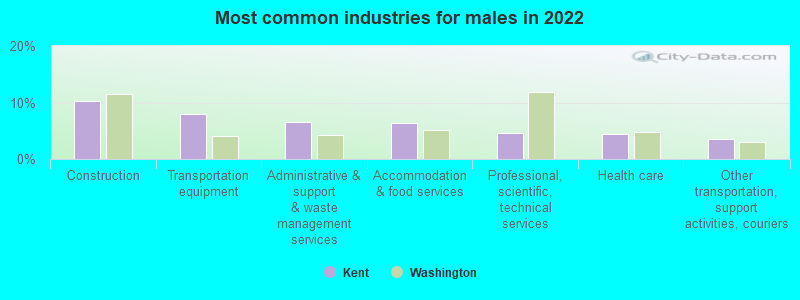
- Construction (10.3%)
- Transportation equipment (8.0%)
- Administrative & support & waste management services (6.6%)
- Accommodation & food services (6.4%)
- Professional, scientific, technical services (4.6%)
- Health care (4.3%)
- Other transportation, support activities, couriers (3.5%)
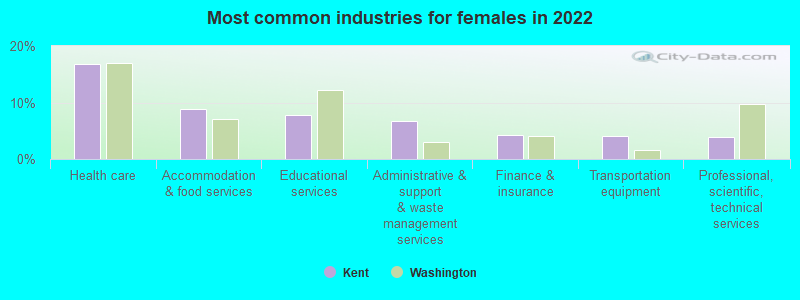
- Health care (16.8%)
- Accommodation & food services (8.9%)
- Educational services (7.7%)
- Administrative & support & waste management services (6.8%)
- Finance & insurance (4.2%)
- Transportation equipment (4.1%)
- Professional, scientific, technical services (3.9%)
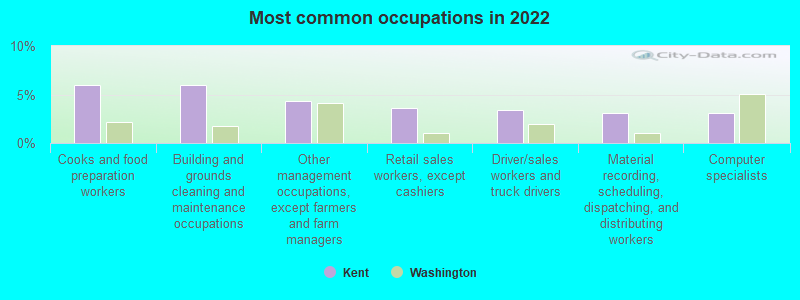
- Cooks and food preparation workers (6.0%)
- Building and grounds cleaning and maintenance occupations (6.0%)
- Other management occupations, except farmers and farm managers (4.3%)
- Retail sales workers, except cashiers (3.6%)
- Driver/sales workers and truck drivers (3.4%)
- Material recording, scheduling, dispatching, and distributing workers (3.1%)
- Computer specialists (3.1%)
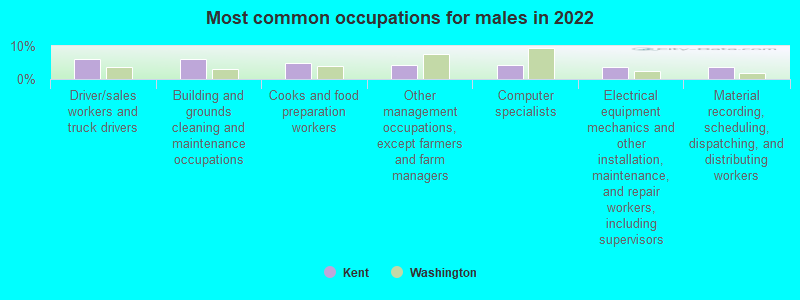
- Driver/sales workers and truck drivers (6.2%)
- Building and grounds cleaning and maintenance occupations (6.1%)
- Cooks and food preparation workers (4.8%)
- Other management occupations, except farmers and farm managers (4.3%)
- Computer specialists (4.1%)
- Electrical equipment mechanics and other installation, maintenance, and repair workers, including supervisors (3.7%)
- Material recording, scheduling, dispatching, and distributing workers (3.6%)
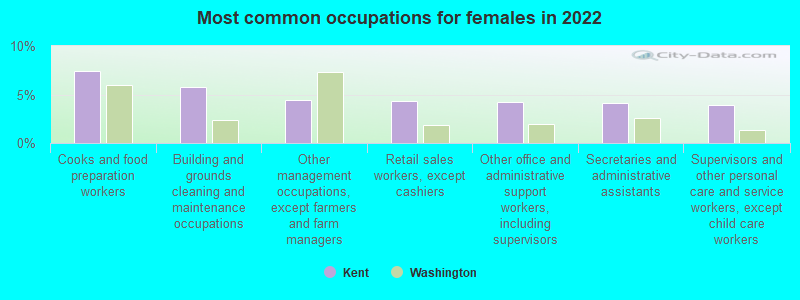
- Cooks and food preparation workers (7.4%)
- Building and grounds cleaning and maintenance occupations (5.8%)
- Other management occupations, except farmers and farm managers (4.4%)
- Retail sales workers, except cashiers (4.3%)
- Other office and administrative support workers, including supervisors (4.3%)
- Secretaries and administrative assistants (4.1%)
- Supervisors and other personal care and service workers, except child care workers (3.9%)
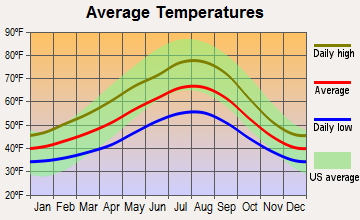
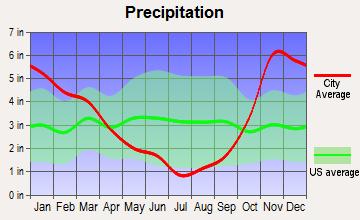
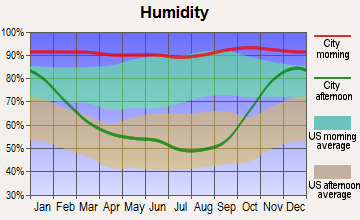
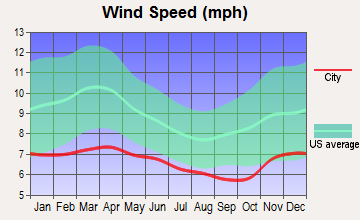
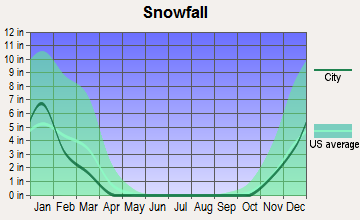
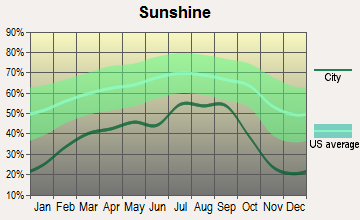
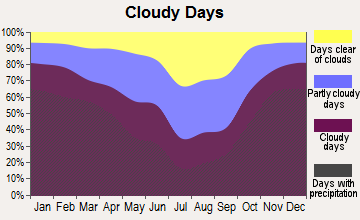
Average climate in Kent, Washington
Based on data reported by over 4,000 weather stations
|
|

(lower is better)
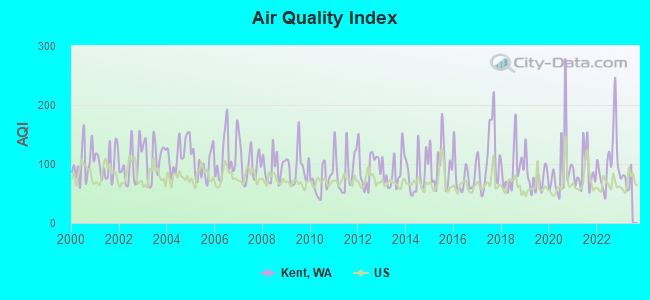
Air Quality Index (AQI) level in 2022 was 107. This is significantly worse than average.
| City: | 107 |
| U.S.: | 73 |
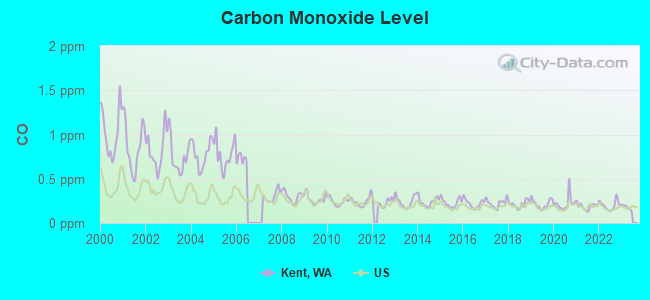
Carbon Monoxide (CO) [ppm] level in 2022 was 0.200. This is better than average. Closest monitor was 12.1 miles away from the city center.
| City: | 0.200 |
| U.S.: | 0.251 |
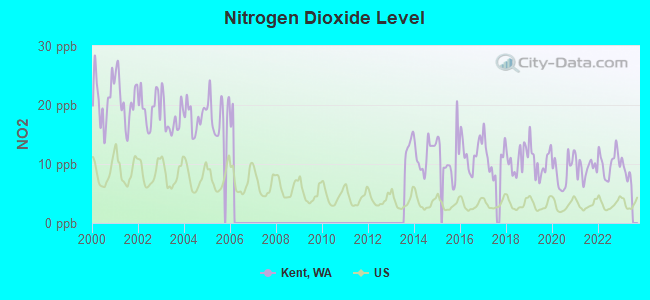
Nitrogen Dioxide (NO2) [ppb] level in 2022 was 10.2. This is significantly worse than average. Closest monitor was 0.9 miles away from the city center.
| City: | 10.2 |
| U.S.: | 5.1 |
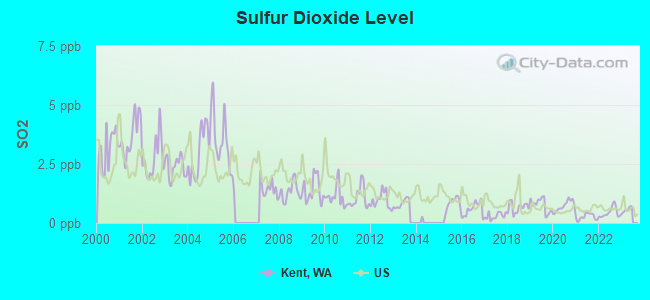
Sulfur Dioxide (SO2) [ppb] level in 2022 was 0.443. This is significantly better than average. Closest monitor was 0.9 miles away from the city center.
| City: | 0.443 |
| U.S.: | 1.515 |
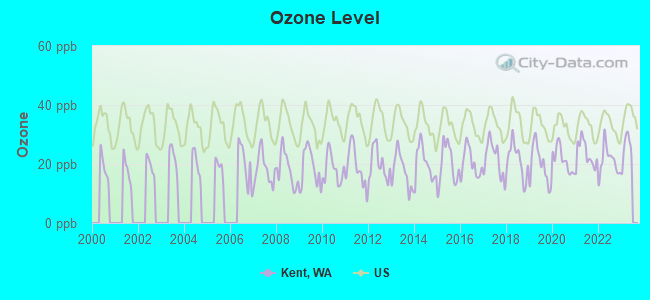
Ozone [ppb] level in 2022 was 21.0. This is significantly better than average. Closest monitor was 0.9 miles away from the city center.
| City: | 21.0 |
| U.S.: | 33.3 |
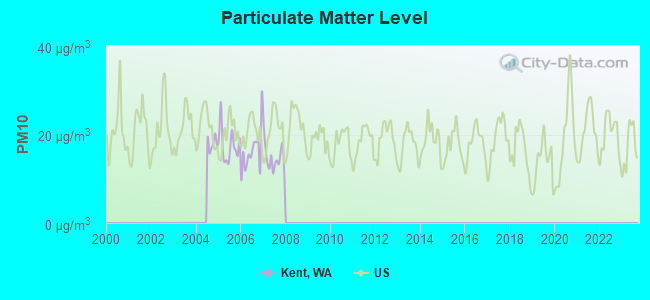
Particulate Matter (PM10) [µg/m3] level in 2007 was 14.7. This is better than average. Closest monitor was 0.3 miles away from the city center.
| City: | 14.7 |
| U.S.: | 19.2 |
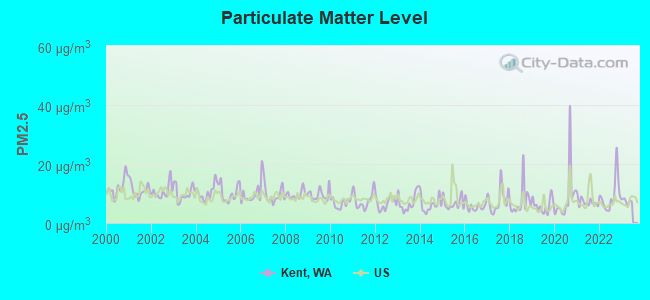
Particulate Matter (PM2.5) [µg/m3] level in 2022 was 9.31. This is about average. Closest monitor was 0.3 miles away from the city center.
| City: | 9.31 |
| U.S.: | 8.11 |
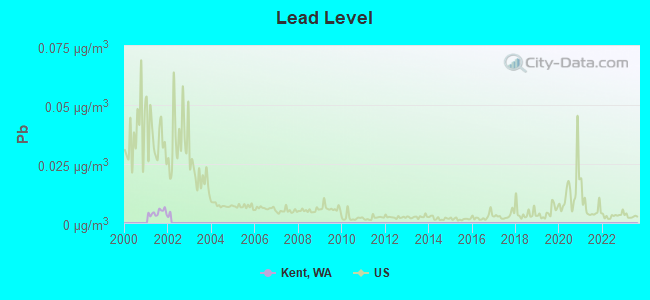
Lead (Pb) [µg/m3] level in 2001 was 0.00445. This is significantly better than average. Closest monitor was 3.6 miles away from the city center.
| City: | 0.00445 |
| U.S.: | 0.00931 |
Earthquake activity:
Kent-area historical earthquake activity is significantly above Washington state average. It is 1354% greater than the overall U.S. average.On 4/13/1949 at 19:55:42, a magnitude 7.0 (7.0 UK, Class: Major, Intensity: VIII - XII) earthquake occurred 15.8 miles away from the city center, causing $80,000,000 total damage
On 2/28/2001 at 18:54:32, a magnitude 6.8 (6.5 MB, 6.6 MS, 6.8 MW, Class: Strong, Intensity: VII - IX) earthquake occurred 26.2 miles away from the city center, causing $2,000,000,000 total damage and $305,000,000 insured losses
On 2/28/2001 at 18:54:32, a magnitude 6.8 (6.8 MD, Depth: 32.2 mi) earthquake occurred 28.5 miles away from the city center
On 4/29/1965 at 15:28:43, a magnitude 6.6 (6.6 UK) earthquake occurred 6.7 miles away from the city center, causing $28,000,000 total damage
On 7/3/1999 at 01:43:54, a magnitude 5.8 (5.4 MB, 5.5 MS, 5.8 MW, 5.3 ME, Depth: 25.2 mi, Class: Moderate, Intensity: VI - VII) earthquake occurred 52.3 miles away from Kent center
On 5/3/1996 at 04:04:22, a magnitude 5.5 (5.2 MB, 5.3 MD, 5.5 ML, Depth: 2.5 mi) earthquake occurred 38.5 miles away from the city center
Magnitude types: body-wave magnitude (MB), duration magnitude (MD), energy magnitude (ME), local magnitude (ML), surface-wave magnitude (MS), moment magnitude (MW)
Natural disasters:
The number of natural disasters in King County (30) is a lot greater than the US average (15).Major Disasters (Presidential) Declared: 27
Emergencies Declared: 1
Causes of natural disasters: Floods: 21, Storms: 16, Mudslides: 11, Landslides: 9, Winter Storms: 7, Earthquakes: 2, Heavy Rains: 2, Winds: 2, Hurricane: 1, Snow: 1, Volcanic Eruption: 1, Other: 1 (Note: some incidents may be assigned to more than one category).
Main business address for: FLOW INTERNATIONAL CORP (GENERAL INDUSTRIAL MACHINERY & EQUIPMENT, NEC).
Hospitals and medical centers in Kent:
Airports and heliports located in Kent:
- Crest Airpark Airport (S36) (Runways: 1, Itinerant Ops: 101,200, Local Ops: 12,650)
- Boeing Kent Heliport (3WA6)
- Kent Benaroya Heliport (3WA7)
Amtrak stations near Kent:
- 14 miles: TACOMA (1001 PUYALLUP AVE.) . Services: ticket office, partially wheelchair accessible, enclosed waiting area, public restrooms, public payphones, full-service food facilities, free short-term parking, free long-term parking, call for taxi service, intercity bus service, public transit connection.
- 16 miles: SEATTLE (303 S. JACKSON ST.) . Services: ticket office, fully wheelchair accessible, enclosed waiting area, public restrooms, public payphones, vending machines, paid short-term parking, paid long-term parking, call for car rental service, taxi stand, intercity bus service, public transit connection.
Colleges/universities with over 2000 students nearest to Kent:
- Highline Community College (about 4 miles; Des Moines, WA; Full-time enrollment: 6,074)
- Green River Community College (about 6 miles; Auburn, WA; FT enrollment: 7,425)
- Renton Technical College (about 8 miles; Renton, WA; FT enrollment: 2,549)
- Seattle Community College-South Campus (about 13 miles; Seattle, WA; FT enrollment: 3,986)
- Bates Technical College (about 14 miles; Tacoma, WA; FT enrollment: 4,929)
- University of Washington-Tacoma Campus (about 14 miles; Tacoma, WA; FT enrollment: 3,788)
- University of Puget Sound (about 15 miles; Tacoma, WA; FT enrollment: 2,788)
Public high schools in Kent:
- TECHNOLOGY ACCESS FOUNDATION ACADEMY (Location: 26720 40TH AVE S, Grades: 6-12)
- DYNAMIC FAMILY SERVICES (Location: 10811 SE KENT KANLGEY RD, Grades: PK-12)
- KENT-MERIDIAN HIGH SCHOOL (Location: 10020 SE 256TH ST, Grades: 9-12)
- KENTRIDGE HIGH SCHOOL (Location: 12430 SE 208TH ST, Grades: 9-12)
- KENTLAKE HIGH SCHOOL (Location: 21401 SE FALCON WAY, Grades: 9-12)
- REGIONAL JUSTICE CENTER (Location: 12033 SE 256TH ST SUITE A-200, Grades: 9-12)
- KENT PHOENIX ACADEMY (Location: 11000 SE 264TH ST, Grades: 9-12)
- IGRAD (Location: 25668 104TH AVE SE, Grades: 9-12)
Private high schools in Kent:
Biggest public elementary/middle schools in Kent:
- STAR LAKE ELEMENTARY SCHOOL (Location: 4014 S 270TH, Grades: PK-5)
- SUNNYCREST ELEMENTARY SCHOOL (Location: 24629 42ND AV S, Grades: PK-5)
- TOTEM MIDDLE SCHOOL (Location: 26630 40TH AVE S, Grades: 6-8)
- CEDAR VALLEY ELEMENTARY SCHOOL (Location: 26500 TIMBERLANE WAY SE, Grades: KG-6)
- EAST HILL ELEMENTARY SCHOOL (Location: 9825 S 240TH ST, Grades: KG-6)
- GRASS LAKE ELEMENTARY SCHOOL (Location: 28700 191ST PLACE SE, Grades: KG-6)
- KENT ELEMENTARY SCHOOL (Location: 24700 64TH AVE S, Grades: KG-6)
- LAKE YOUNGS ELEMENTARY SCHOOL (Location: 19660 142ND AVE SE, Grades: KG-6)
- MERIDIAN ELEMENTARY SCHOOL (Location: 25621 140TH AVE SE, Grades: KG-6)
- MERIDIAN MIDDLE SCHOOL (Location: 23480 120TH AVE SE, Grades: 7-8)
Private elementary/middle school in Kent:
Points of interest:
Notable locations in Kent: Kent-Highlands Landfill (A), Camelot Plaza (B), East Hill Supercenter (C), Benson Center (D), West Hill Plaza (E), Woodmont Place (F), Kinthill Plaza (G), East Hill Center (H), Cottongrove Picnic Area (I), Van Dorens Landing (J), Meridian Valley Golf and Country Club (K), Wieser (L), King County Medic One (M), Tri - Med Ambulance (N), Sunrise Haven (O), Meridian Grange (P), Kent Fire Department Station 75 (Q), Kent Fire Department Station 73 (R), Kent Fire Department Station 72 (S), Kent Fire Department Station 76 (T). Display/hide their locations on the map
Shopping Centers: Lakecrest Shopping Center (1), Kent East Shopping Center (2), Kent Shopping Center (3), Kent-West Mall (4), East Kent Shopping Center (5). Display/hide their locations on the map
Main business address in Kent: FLOW INTERNATIONAL CORP (A). Display/hide its location on the map
Churches in Kent include: Zion Lutheran Church (A), East Hill Baptist Church (B), Faith Baptist Church (C), Trinity Community Church (D), Riverview Community Church (E), Center of Faith Church of God in Christ (F), First Church of Christ Scientist at Kent (G), New Hope Free Will Baptist Church (H), Iglesia Cuadrangular Rey de Reyes (I). Display/hide their locations on the map
Cemeteries: Saar Pioneer Cemetery (1), Suise Creek Cemetery (2). Display/hide their locations on the map
Lakes: Lake Meridian (A), Clark Lake (B), Lake Fenwick (C). Display/hide their locations on the map
Creeks: Cranmar Creek (A), Harrison Creek (B), Little Soos Creek (C). Display/hide their locations on the map
Parks in Kent include: Triangle Park (1), East Hill Park (2), Anderson Park (3), Stoneway Park (4), Riverfront Park (5), Mill Creek Park (6), Russell Road Park (7), Lake Fenwick Park (8), Nelson Park (9). Display/hide their locations on the map
Tourist attractions: Hydroplane & Race Boat Museum (5917 South 196th Street) (1), Federal Way Nudists (Recreation Areas; Post Office Box 4143) (2), C & L Games (Amusement & Theme Parks; 21028 84th Avenue South) (3), TAJ Banquet Hall (Amusement & Theme Parks; 10210 Southeast 260th Street) (4), TLC Family Skate (Amusement & Theme Parks; 10210 Southeast 260th Street) (5), Go Lightly Inc (17128 Southeast Covington Sawyer Road) (6), Kent Valley Ice Centre (Arcades & Amusements; 6015 South 240th Street) (7). Display/hide their approximate locations on the map
Hotels: New Best Inn (23408 30th Avenue South) (1), Holiday Inn Hotel & Suites (22318 84th Ave S) (2), Holiday Inn HTL & Suites (22318 84th Avenue South) (3), Best Western Plaza (24415 Russell Road) (4), Days Inn South Seattle (1711 W Meeker St) (5), Crossland Economy Studios (25104 Pacific Highway South) (6), Days Inn (1711 West Meeker Street) (7), Extended Stayamerica (22520 83rd Avenue South) (8), Golden Kent Motel (22203 84th Avenue South) (9). Display/hide their approximate locations on the map
Courts: Kent City - Court- Probation Services (400 West Gowe Street) (1), Kent City - Kent Municipal Court- Court- Traffic Violations (1220 Central Avenue South) (2), King County - Courts- District Court Divisions- Superior Court Regional Justice Center Informa (401 4th Avenue North) (3), King County - Rjc Jail Department- Aukeen- District Court Divisions- District Courts- Issa (401 4th Avenue North) (4), King County - Courts- District Court Divisions- South Division- Kent Courth (1210 Central Avenue South) (5). Display/hide their approximate locations on the map
Birthplace of: Courtney Vandersloot - Basketball player, Alameda Ta'amu - Football defensive lineman, Billy Crook (American soccer) - Soccer player-coach, John Bronson - 2005 NFL player (Arizona Cardinals, born: Jul 8, 1982), Kenny Mayne - Sports journalist, Cam Weaver - Soccer player, Red Badgro - Football player, Shannon Higgins-Cirovski - Association football player, Brenda Raganot - Bodybuilder, Jackson Douglas - Actor.
Drinking water stations with addresses in Kent and their reported violations in the past:
COVINGTON WATER DISTRICT (Population served: 44,914, Purch surface water):Past health violations:CRESTVIEW WEST WATER SYSTEM (Population served: 147, Groundwater):
- MCL, Monthly (TCR) - In NOV-2006, Contaminant: Coliform
Past health violations:
- MCL, Monthly (TCR) - In NOV-2006, Contaminant: Coliform
- MCL, Acute (TCR) - In JUL-2006, Contaminant: Coliform
| This city: | 2.7 people |
| Washington: | 2.5 people |
| This city: | 64.1% |
| Whole state: | 64.4% |
| This city: | 8.2% |
| Whole state: | 7.7% |
Likely homosexual households (counted as self-reported same-sex unmarried-partner households)
- Lesbian couples: 0.5% of all households
- Gay men: 0.4% of all households
People in group quarters in Kent in 2010:
- 779 people in local jails and other municipal confinement facilities
- 247 people in group homes intended for adults
- 101 people in emergency and transitional shelters (with sleeping facilities) for people experiencing homelessness
- 90 people in other noninstitutional facilities
- 86 people in nursing facilities/skilled-nursing facilities
- 34 people in workers' group living quarters and job corps centers
- 30 people in residential treatment centers for adults
- 11 people in correctional facilities intended for juveniles
- 6 people in group homes for juveniles (non-correctional)
- 6 people in in-patient hospice facilities
People in group quarters in Kent in 2000:
- 272 people in other noninstitutional group quarters
- 155 people in other nonhousehold living situations
- 107 people in local jails and other confinement facilities (including police lockups)
- 106 people in other group homes
- 46 people in nursing homes
- 12 people in unknown juvenile institutions
Banks with most branches in Kent (2011 data):
- KeyBank National Association: Kent Branch, Covington Branch, Midway Branch, Kent East Village Hill Branch, Panther Lake Branch. Info updated 2008/03/03: Bank assets: $86,198.8 mil, Deposits: $64,214.8 mil, headquarters in Cleveland, OH, positive income, Commercial Lending Specialization, 1067 total offices, Holding Company: Keycorp
- JPMorgan Chase Bank, National Association: Kent, Benson Center, Covington Branch, Kent Kangley & 132nd Banking Center. Info updated 2011/11/10: Bank assets: $1,811,678.0 mil, Deposits: $1,190,738.0 mil, headquarters in Columbus, OH, positive income, International Specialization, 5577 total offices, Holding Company: Jpmorgan Chase & Co.
- Bank of America, National Association: Lake Meridian Branch, Kent Branch, Panther Lake Safeway Branch, Kent-East Branch. Info updated 2009/11/18: Bank assets: $1,451,969.3 mil, Deposits: $1,077,176.8 mil, headquarters in Charlotte, NC, positive income, 5782 total offices, Holding Company: Bank Of America Corporation
- U.S. Bank National Association: Benson Center Branch at 10231 S.E. 240th St, branch established on 1965/08/30; Kent Branch at 305 North Fourth Avenue, branch established on 1969/01/31. Info updated 2012/01/30: Bank assets: $330,470.8 mil, Deposits: $236,091.5 mil, headquarters in Cincinnati, OH, positive income, 3121 total offices, Holding Company: U.S. Bancorp
- Wells Fargo Bank, National Association: Kent East Branch at 10625 Kent-Kangley Road, branch established on 1987/11/19; Kent Branch at 204 West Meeker, branch established on 1937/08/28. Info updated 2011/04/05: Bank assets: $1,161,490.0 mil, Deposits: $905,653.0 mil, headquarters in Sioux Falls, SD, positive income, 6395 total offices, Holding Company: Wells Fargo & Company
- Washington Federal: Kent Branch at 10415 Southeast 240th Street, branch established on 1917/01/01. Info updated 2011/12/19: Bank assets: $13,653.0 mil, Deposits: $8,905.8 mil, headquarters in Seattle, WA, positive income, Mortgage Lending Specialization, 174 total offices
- Umpqua Bank: Kent Branch at 20038 68th Avenue S. - Suite 102, branch established on 2008/04/14. Info updated 2011/09/02: Bank assets: $11,556.7 mil, Deposits: $9,325.3 mil, headquarters in Roseburg, OR, positive income, Commercial Lending Specialization, 193 total offices, Holding Company: Umpqua Holdings Corporation
- Columbia State Bank: Kent Branch at 504 West Meeker Street, branch established on 1993/12/01. Info updated 2011/08/09: Bank assets: $4,785.2 mil, Deposits: $3,892.8 mil, headquarters in Tacoma, WA, positive income, Commercial Lending Specialization, 104 total offices, Holding Company: Columbia Banking System, Inc.
- Cathay Bank: Kent North Branch at 18030 East Valley Highway, branch established on 2000/06/01. Info updated 2010/12/08: Bank assets: $10,628.9 mil, Deposits: $7,249.8 mil, headquarters in Los Angeles, CA, positive income, Commercial Lending Specialization, 52 total offices, Holding Company: Cathay General Bancorp
- 6 other banks with 6 local branches
For population 15 years and over in Kent:
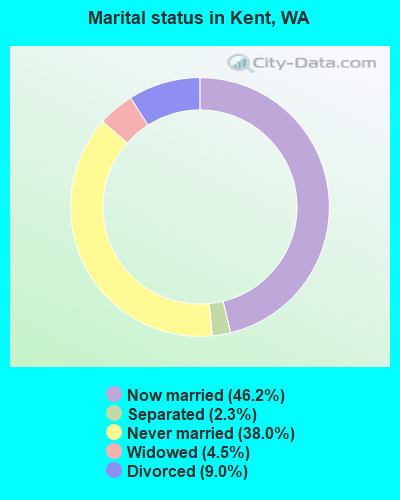
- Never married: 38.0%
- Now married: 46.2%
- Separated: 2.3%
- Widowed: 4.5%
- Divorced: 9.0%
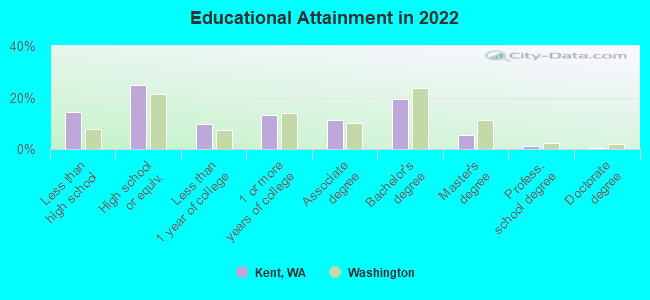
For population 25 years and over in Kent:
- High school or higher: 85.8%
- Bachelor's degree or higher: 26.7%
- Graduate or professional degree: 7.2%
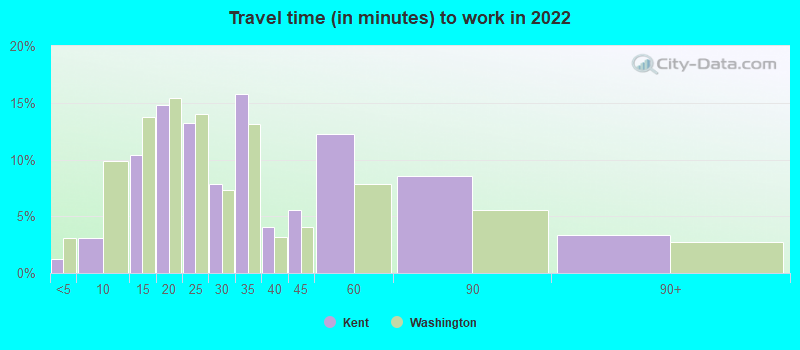
- Unemployed: 5.7%
- Mean travel time to work (commute): 25.4 minutes
| Here: | 13.5 |
| Washington average: | 11.6 |
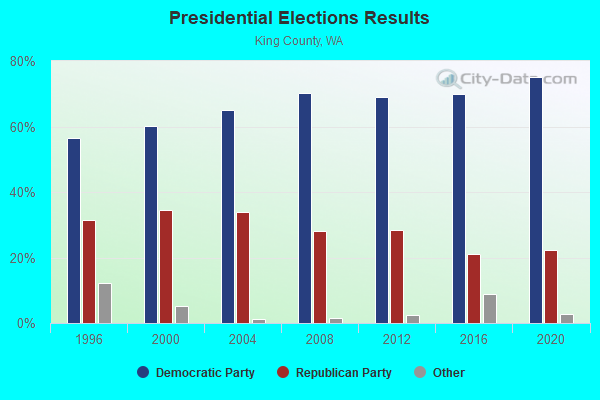
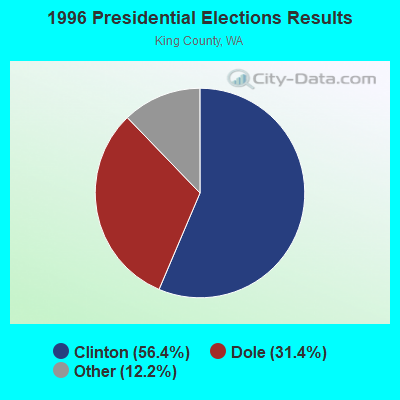
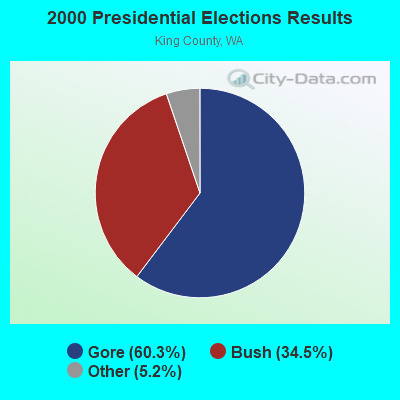
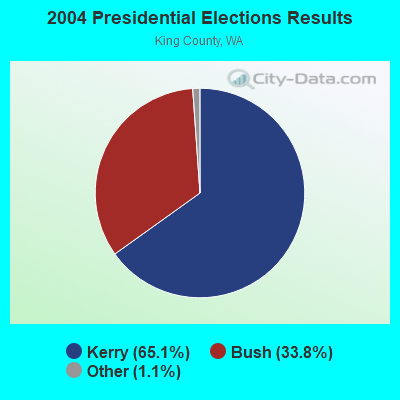
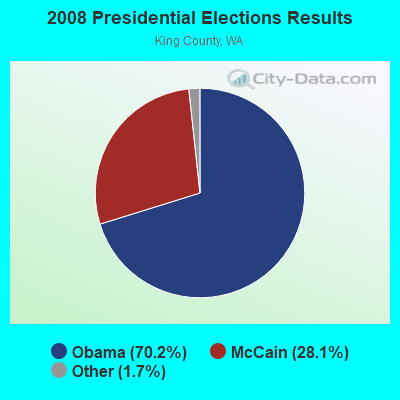
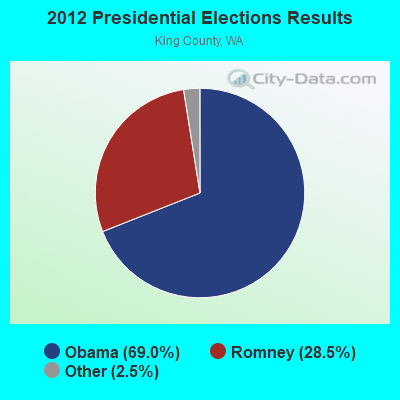
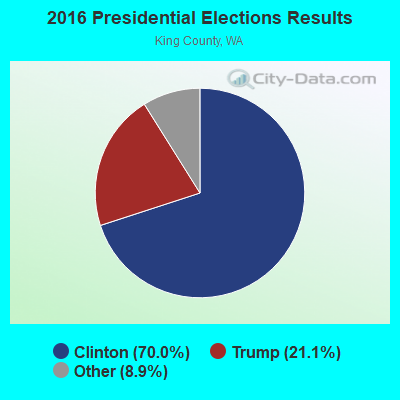
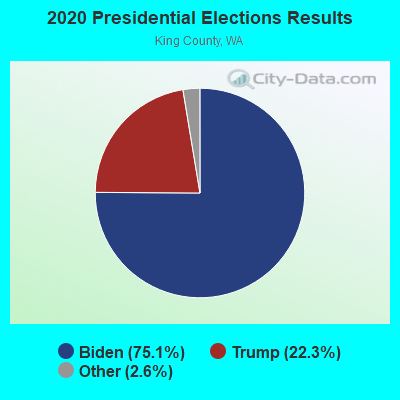
Graphs represent county-level data. Detailed 2008 Election Results
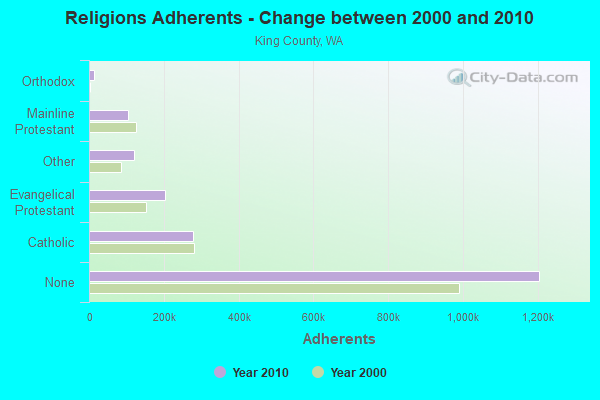
Religion statistics for Kent, WA (based on King County data)
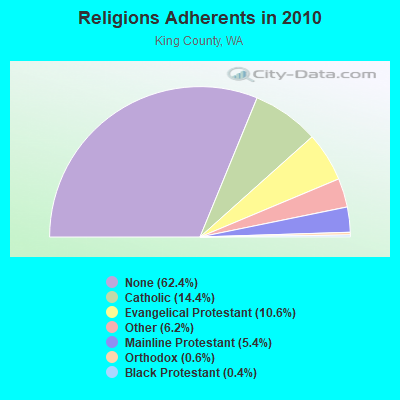
| Religion | Adherents | Congregations |
|---|---|---|
| Catholic | 278,340 | 71 |
| Evangelical Protestant | 204,523 | 711 |
| Other | 119,713 | 329 |
| Mainline Protestant | 104,806 | 304 |
| Orthodox | 12,257 | 20 |
| Black Protestant | 7,030 | 24 |
| None | 1,204,580 | - |
Food Environment Statistics:
| King County: | 2.37 / 10,000 pop. |
| State: | 2.06 / 10,000 pop. |
| This county: | 0.16 / 10,000 pop. |
| Washington: | 0.19 / 10,000 pop. |
| Here: | 1.19 / 10,000 pop. |
| Washington: | 1.18 / 10,000 pop. |
| King County: | 2.16 / 10,000 pop. |
| Washington: | 2.67 / 10,000 pop. |
| Here: | 10.95 / 10,000 pop. |
| Washington: | 8.26 / 10,000 pop. |
| Here: | 6.7% |
| Washington: | 7.7% |
| This county: | 20.5% |
| Washington: | 25.7% |
| King County: | 14.6% |
| State: | 13.9% |
Health and Nutrition:
| Here: | 48.3% |
| Washington: | 49.9% |
| Kent: | 45.3% |
| State: | 47.2% |
| Kent: | 28.3 |
| Washington: | 28.4 |
| This city: | 21.0% |
| Washington: | 20.9% |
| Here: | 11.3% |
| Washington: | 10.5% |
| Here: | 6.8 |
| Washington: | 6.8 |
| Kent: | 31.1% |
| State: | 32.8% |
| Kent: | 56.0% |
| Washington: | 56.8% |
| This city: | 80.5% |
| Washington: | 79.4% |
More about Health and Nutrition of Kent, WA Residents
| Local government employment and payroll (March 2022) | |||||
| Function | Full-time employees | Monthly full-time payroll | Average yearly full-time wage | Part-time employees | Monthly part-time payroll |
|---|---|---|---|---|---|
| Police Protection - Officers | 154 | $1,740,710 | $135,640 | 0 | $0 |
| Parks and Recreation | 74 | $570,944 | $92,586 | 113 | $214,919 |
| Streets and Highways | 73 | $649,198 | $106,717 | 2 | $6,230 |
| Other and Unallocable | 70 | $522,864 | $89,634 | 3 | $6,461 |
| Financial Administration | 64 | $588,894 | $110,418 | 1 | $2,128 |
| Natural Resources | 48 | $362,758 | $90,690 | 8 | $19,846 |
| Sewerage | 38 | $308,216 | $97,331 | 2 | $5,790 |
| Judicial and Legal | 34 | $317,944 | $112,216 | 1 | $2,615 |
| Water Supply | 32 | $237,452 | $89,045 | 3 | $5,052 |
| Correction | 27 | $240,644 | $106,953 | 0 | $0 |
| Other Government Administration | 26 | $249,538 | $115,171 | 13 | $16,322 |
| Police - Other | 19 | $131,074 | $82,784 | 1 | $2,079 |
| Welfare | 7 | $56,084 | $96,144 | 1 | $3,024 |
| Solid Waste Management | 3 | $22,920 | $91,680 | 2 | $5,574 |
| Totals for Government | 669 | $5,999,240 | $107,610 | 150 | $290,040 |
Kent government finances - Expenditure in 2021 (per resident):
- Construction - Regular Highways: $27,421,000 ($204.04)
Natural Resources - Other: $16,983,000 ($126.37)
General - Other: $6,354,000 ($47.28)
Parks and Recreation: $3,509,000 ($26.11)
Central Staff Services: $300,000 ($2.23)
Correctional Institutions: $198,000 ($1.47)
Police Protection: $38,000 ($0.28)
General Public Buildings: $13,000 ($0.10)
- Current Operations - Sewerage: $46,292,000 ($344.46)
Police Protection: $37,728,000 ($280.73)
Water Utilities: $21,565,000 ($160.46)
Parks and Recreation: $16,577,000 ($123.35)
General - Other: $11,587,000 ($86.22)
Regular Highways: $9,337,000 ($69.48)
Central Staff Services: $5,506,000 ($40.97)
Correctional Institutions: $4,977,000 ($37.03)
Judicial and Legal Services: $4,737,000 ($35.25)
Public Welfare - Other: $3,943,000 ($29.34)
Financial Administration: $3,379,000 ($25.14)
Local Fire Protection: $2,640,000 ($19.64)
Housing and Community Development: $2,521,000 ($18.76)
Solid Waste Management: $797,000 ($5.93)
Health - Other: $716,000 ($5.33)
Protective Inspection and Regulation - Other: $550,000 ($4.09)
Parking Facilities: $159,000 ($1.18)
Libraries: $1,000 ($0.01)
- General - Interest on Debt: $3,822,000 ($28.44)
- Intergovernmental to Local - Other - General - Other: $2,472,000 ($18.39)
- Other Capital Outlay - Water Utilities: $6,149,000 ($45.75)
Natural Resources - Other: $3,791,000 ($28.21)
Parks and Recreation: $2,551,000 ($18.98)
Police Protection: $1,015,000 ($7.55)
Sewerage: $556,000 ($4.14)
General - Other: $29,000 ($0.22)
Regular Highways: $25,000 ($0.19)
- Total Salaries and Wages: $68,305,000 ($508.25)
- Water Utilities - Interest on Debt: $1,286,000 ($9.57)
Kent government finances - Revenue in 2021 (per resident):
- Charges - Sewerage: $54,494,000 ($405.49)
Other: $4,480,000 ($33.34)
Parks and Recreation: $2,146,000 ($15.97)
Solid Waste Management: $660,000 ($4.91)
- Federal Intergovernmental - Housing and Community Development: $1,180,000 ($8.78)
Health and Hospitals: $11,000 ($0.08)
- Local Intergovernmental - Other: $10,254,000 ($76.30)
- Miscellaneous - Interest Earnings: $5,244,000 ($39.02)
Fines and Forfeits: $3,817,000 ($28.40)
Sale of Property: $3,445,000 ($25.63)
Special Assessments: $2,759,000 ($20.53)
General Revenue - Other: $1,332,000 ($9.91)
Donations From Private Sources: $1,064,000 ($7.92)
Rents: $739,000 ($5.50)
- Revenue - Water Utilities: $23,286,000 ($173.27)
- State Intergovernmental - Highways: $19,402,000 ($144.37)
Health and Hospitals: $6,046,000 ($44.99)
Other: $3,646,000 ($27.13)
General Local Government Support: $1,897,000 ($14.12)
- Tax - General Sales and Gross Receipts: $32,453,000 ($241.48)
Public Utilities Sales: $32,289,000 ($240.26)
Property: $31,375,000 ($233.46)
Occupation and Business License - Other: $16,551,000 ($123.15)
Documentary and Stock Transfer: $6,621,000 ($49.27)
Other License: $4,103,000 ($30.53)
Amusements Sales: $418,000 ($3.11)
Other Selective Sales: $156,000 ($1.16)
Kent government finances - Debt in 2021 (per resident):
- Long Term Debt - Beginning Outstanding - Unspecified Public Purpose: $178,826,000 ($1330.63)
Outstanding Unspecified Public Purpose: $158,443,000 ($1178.96)
Retired Unspecified Public Purpose: $46,088,000 ($342.94)
Issue, Unspecified Public Purpose: $25,706,000 ($191.28)
Beginning Outstanding - Public Debt for Private Purpose: $746,000 ($5.55)
Retired Nonguaranteed - Public Debt for Private Purpose: $746,000 ($5.55)
6.69% of this county's 2021 resident taxpayers lived in other counties in 2020 ($106,002 average adjusted gross income)
| Here: | 6.69% |
| Washington average: | 7.53% |
0.02% of residents moved from foreign countries ($181 average AGI)
King County: 0.02% Washington average: 0.05%
Top counties from which taxpayers relocated into this county between 2020 and 2021:
| from Snohomish County, WA | |
| from Pierce County, WA | |
| from Los Angeles County, CA |
7.71% of this county's 2020 resident taxpayers moved to other counties in 2021 ($123,052 average adjusted gross income)
| Here: | 7.71% |
| Washington average: | 7.40% |
0.01% of residents moved to foreign countries ($183 average AGI)
King County: 0.01% Washington average: 0.04%
Top counties to which taxpayers relocated from this county between 2020 and 2021:
| to Snohomish County, WA | |
| to Pierce County, WA | |
| to Maricopa County, AZ |
| Businesses in Kent, WA | ||||
| Name | Count | Name | Count | |
|---|---|---|---|---|
| 24 Hour Fitness | 1 | Johnny Rockets | 1 | |
| 7-Eleven | 7 | Jones New York | 2 | |
| AT&T | 3 | Journeys | 1 | |
| Aerosoles | 1 | KFC | 1 | |
| Albertsons | 1 | Kmart | 1 | |
| Ann Taylor | 1 | Kroger | 5 | |
| Applebee's | 2 | LA Fitness | 1 | |
| Arby's | 2 | Lane Furniture | 1 | |
| AutoZone | 1 | Little Caesars Pizza | 3 | |
| Baja Fresh Mexican Grill | 1 | Long John Silver's | 1 | |
| Bally Total Fitness | 1 | Lowe's | 1 | |
| Baskin-Robbins | 3 | Marriott | 1 | |
| Bath & Body Works | 1 | MasterBrand Cabinets | 20 | |
| Best Western | 1 | McDonald's | 4 | |
| Blockbuster | 3 | New Balance | 1 | |
| Budget Car Rental | 1 | Nike | 7 | |
| Burger King | 5 | Office Depot | 1 | |
| Chico's | 1 | Old Country Buffet | 1 | |
| Chipotle | 1 | Pac Sun | 1 | |
| Chuck E. Cheese's | 1 | Panera Bread | 1 | |
| Circle K | 3 | Papa John's Pizza | 2 | |
| Cold Stone Creamery | 1 | Payless | 1 | |
| Coldwater Creek | 1 | Penske | 2 | |
| Comfort Inn | 1 | Pizza Hut | 3 | |
| Crossland Economy Studios | 1 | Quality | 1 | |
| Curves | 1 | Quiznos | 3 | |
| DHL | 2 | RadioShack | 2 | |
| Dairy Queen | 1 | Red Robin | 1 | |
| Days Inn | 2 | Rite Aid | 4 | |
| Decora Cabinetry | 3 | Safeway | 3 | |
| Dennys | 1 | Sears | 2 | |
| Domino's Pizza | 2 | Sprint Nextel | 1 | |
| Extended Stay America | 1 | Staples | 1 | |
| Famous Footwear | 1 | Starbucks | 16 | |
| FedEx | 13 | Subway | 4 | |
| Firestone Complete Auto Care | 2 | T-Mobile | 3 | |
| Ford | 1 | T.J.Maxx | 1 | |
| GNC | 3 | Taco Bell | 3 | |
| GameStop | 2 | Target | 1 | |
| H&R Block | 2 | The Room Place | 1 | |
| Hawthorn | 1 | Toys"R"Us | 1 | |
| Holiday Inn | 1 | U-Haul | 3 | |
| Home Depot | 1 | UPS | 14 | |
| Howard Johnson | 1 | Vans | 2 | |
| J. Jill | 1 | Vons | 3 | |
| Jack In The Box | 5 | Walgreens | 2 | |
| Jamba Juice | 1 | Wendy's | 3 | |
Strongest AM radio stations in Kent:
- KNWX (1210 AM; 28 kW; AUBURN-FEDERAL WAY, WA; Owner: ENTERCOM SEATTLE LICENSE, LLC)
- KTTH (770 AM; 50 kW; SEATTLE, WA; Owner: ENTERCOM SEATTLE LICENSE, LLC)
- KIRO (710 AM; 50 kW; SEATTLE, WA; Owner: ENTERCOM SEATTLE LICENSE, LLC)
- KYCW (1090 AM; 50 kW; SEATTLE, WA; Owner: INFINITY RADIO SUBSIDIARY OPERATIONS INC.)
- KGNW (820 AM; 50 kW; BURIEN-SEATTLE, WA; Owner: INSPIRATION MEDIA, INC.)
- KRIZ (1420 AM; 10 kW; RENTON, WA; Owner: KRIZ BROADCASTING, INC.)
- KOMO (1000 AM; 50 kW; SEATTLE, WA; Owner: FISHER BROADCASTING - SEATTLE RADIO, L.L.C.)
- KYIZ (1620 AM; 10 kW; RENTON, WA; Owner: KRIZ BROADCASTING, INC.)
- KJR (950 AM; 50 kW; SEATTLE, WA)
- KIXI (880 AM; 50 kW; MERCER ISLAND/SEATTL, WA; Owner: BELLEVUE RADIO, INC.)
- KVI (570 AM; 5 kW; SEATTLE, WA; Owner: FISHER BROADCASTING - SEATTLE RADIO, L.L.C.)
- KKOL (1300 AM; 50 kW; SEATTLE, WA; Owner: INSPIRATION MEDIA, INC.)
- KHHO (850 AM; 10 kW; TACOMA, WA; Owner: ACKERLEY MEDIA GROUP, INC.)
Strongest FM radio stations in Kent:
- KBSG-FM (97.3 FM; TACOMA, WA; Owner: ENTERCOM SEATTLE LICENSE, LLC)
- KMTT (103.7 FM; TACOMA, WA; Owner: ENTERCOM SEATTLE LICENSE, LLC)
- KNDD (107.7 FM; SEATTLE, WA; Owner: ENTERCOM SEATTLE LICENSE, LLC)
- KYPT (96.5 FM; SEATTLE, WA; Owner: INFINITY RADIO SUBSIDIARY OPERATIONS INC.)
- KBKS (106.1 FM; TACOMA, WA; Owner: INFINITY RADIO SUBSIDIARY OPERATIONS INC.)
- KING-FM (98.1 FM; SEATTLE, WA; Owner: CLASSIC RADIO, INC.)
- KLSY-FM (92.5 FM; BELLEVUE, WA; Owner: BELLEVUE RADIO INC.)
- KPLU-FM (88.5 FM; TACOMA, WA; Owner: PACIFIC LUTHERAN UNIVERSITY, INC.)
- KWJZ (98.9 FM; SEATTLE, WA; Owner: ORCA RADIO, INC.)
- KZOK-FM (102.5 FM; SEATTLE, WA; Owner: INFINITY RADIO SUBSIDIARY OPERATIONS INC.)
- KMPS-FM (94.1 FM; SEATTLE, WA; Owner: INFINITY RADIO SUBSIDIARY OPERATIONS INC.)
- KQBZ (100.7 FM; SEATTLE, WA; Owner: ENTERCOM SEATTLE LICENSE, LLC)
- KJR-FM (95.7 FM; SEATTLE, WA; Owner: ACKERLEY MEDIA GROUP, INC.)
- KUBE (93.3 FM; SEATTLE, WA; Owner: ACKERLEY MEDIA GROUP, INC.)
- KPLZ-FM (101.5 FM; SEATTLE, WA; Owner: FISHER BROADCASTING - SEATTLE RADIO, L.L.C.)
- KNHC (89.5 FM; SEATTLE, WA; Owner: SEATTLE PUBLIC SCHOOLS)
- KISW (99.9 FM; SEATTLE, WA; Owner: ENTERCOM SEATTLE LICENSE, LLC)
- K201EX (88.1 FM; GREENWATER, WA; Owner: CALVARY CHAPEL OF TWIN FALLS, INC.)
- KRWM (106.9 FM; BREMERTON, WA; Owner: SEASCAPE RADIO, INC.)
- KBTC-FM (91.7 FM; TACOMA, WA; Owner: BATES TECHNICAL COLLEGE)
TV broadcast stations around Kent:
- KSTW (Channel 11; TACOMA, WA; Owner: UPN TELEVISION STATIONS INC.)
- KHCV (Channel 45; SEATTLE, WA; Owner: NORTH PACIFIC INTERNATIONAL TELEVISION, INC.)
- KWPX (Channel 33; BELLEVUE, WA; Owner: PAXSON COMMUNICATIONS LICENSE COMPANY, LLC)
- KING-TV (Channel 5; SEATTLE, WA; Owner: KING BROADCASTING COMPANY)
- K58DP (Channel 58; SEATTLE, WA; Owner: WORD OF GOD FELLOWSHIP, INC.)
- KTWB-TV (Channel 22; SEATTLE, WA; Owner: TRIBUNE TELEVISION HOLDINGS, INC.)
- KOMO-TV (Channel 4; SEATTLE, WA; Owner: FISHER BROADCASTING - SEATTLE TV, L.L.C.)
- KCTS-TV (Channel 9; SEATTLE, WA; Owner: KCTS TELEVISION)
- KWDK (Channel 56; TACOMA, WA; Owner: PUGET SOUND EDUCATIONAL TV, INC.)
- KIRO-TV (Channel 7; SEATTLE, WA; Owner: KIRO-TV HOLDINGS, INC.)
- KBTC-TV (Channel 28; TACOMA, WA; Owner: BATES TECHNICAL COLLEGE)
- K57HB (Channel 57; EUREKA, CA; Owner: MS COMMUNICATIONS, LLC)
- KWOG (Channel 51; BELLEVUE, WA; Owner: AFRICAN-AMERICAN BROADCASTING CO.OF BELLEVUE, INC.)
- KONG-TV (Channel 16; EVERETT, WA; Owner: KONG-TV, INC.)
- KCPQ (Channel 13; TACOMA, WA; Owner: TRIBUNE TELEVISION NORTHWEST, INC.)
- K68DL (Channel 68; SEATTLE, WA; Owner: THREE ANGELS BROADCASTING NETWORK)
- K67GJ (Channel 67; POINT PULLEY, ETC., WA; Owner: KIRO-TV HOLDINGS, INC.)
- National Bridge Inventory (NBI) Statistics
- 66Number of bridges
- 1,243ft / 379mTotal length
- $318,036,000Total costs
- 2,496,311Total average daily traffic
- 220,169Total average daily truck traffic
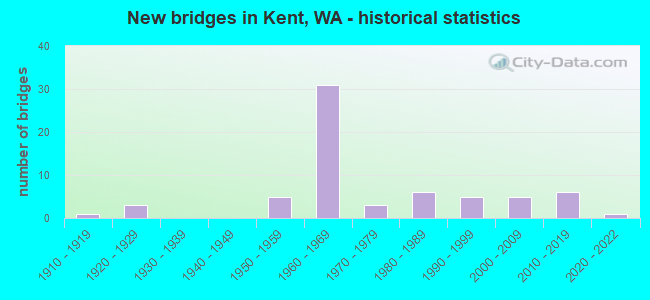
- New bridges - historical statistics
- 11910-1919
- 31920-1929
- 51950-1959
- 311960-1969
- 31970-1979
- 61980-1989
- 51990-1999
- 52000-2009
- 62010-2019
- 12020-2022
FCC Registered Private Land Mobile Towers: 3 (See the full list of FCC Registered Private Land Mobile Towers in Kent, WA)
FCC Registered Broadcast Land Mobile Towers: 99 (See the full list of FCC Registered Broadcast Land Mobile Towers)
FCC Registered Microwave Towers: 59 (See the full list of FCC Registered Microwave Towers in this town)
FCC Registered Paging Towers: 4 (See the full list of FCC Registered Paging Towers)
FCC Registered Maritime Coast & Aviation Ground Towers: 1 (See the full list of FCC Registered Maritime Coast & Aviation Ground Towers)
FCC Registered Amateur Radio Licenses: 946 (See the full list of FCC Registered Amateur Radio Licenses in Kent)
FAA Registered Aircraft Manufacturers and Dealers: 2 (See the full list of FAA Registered Manufacturers and Dealers in Kent)
FAA Registered Aircraft: 198 (See the full list of FAA Registered Aircraft)
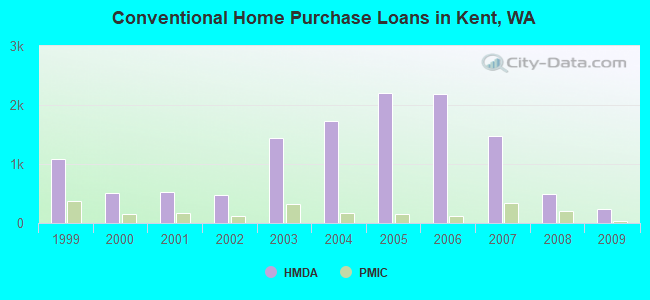
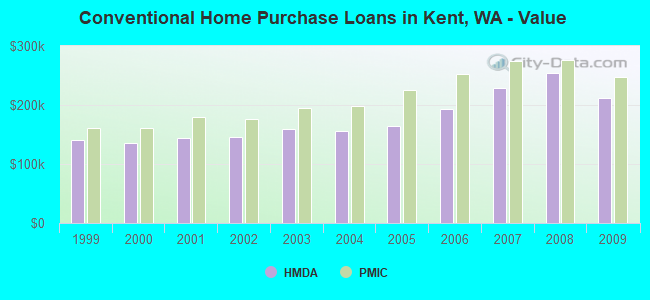
| Home Mortgage Disclosure Act Aggregated Statistics For Year 2009 (Based on 6 full and 16 partial tracts) | ||||||||||||||
| A) FHA, FSA/RHS & VA Home Purchase Loans | B) Conventional Home Purchase Loans | C) Refinancings | D) Home Improvement Loans | E) Loans on Dwellings For 5+ Families | F) Non-occupant Loans on < 5 Family Dwellings (A B C & D) | G) Loans On Manufactured Home Dwelling (A B C & D) | ||||||||
|---|---|---|---|---|---|---|---|---|---|---|---|---|---|---|
| Number | Average Value | Number | Average Value | Number | Average Value | Number | Average Value | Number | Average Value | Number | Average Value | Number | Average Value | |
| LOANS ORIGINATED | 334 | $248,186 | 245 | $212,470 | 1,689 | $221,879 | 42 | $139,063 | 6 | $6,892,602 | 95 | $173,739 | 19 | $136,186 |
| APPLICATIONS APPROVED, NOT ACCEPTED | 21 | $244,191 | 34 | $217,810 | 218 | $236,920 | 9 | $42,557 | 1 | $444,480 | 14 | $209,194 | 6 | $87,583 |
| APPLICATIONS DENIED | 77 | $237,660 | 70 | $226,817 | 664 | $246,392 | 33 | $108,036 | 0 | $0 | 64 | $189,945 | 17 | $111,535 |
| APPLICATIONS WITHDRAWN | 40 | $243,612 | 25 | $184,105 | 432 | $243,356 | 12 | $157,280 | 0 | $0 | 33 | $181,697 | 4 | $139,282 |
| FILES CLOSED FOR INCOMPLETENESS | 5 | $287,420 | 5 | $294,734 | 92 | $256,843 | 8 | $242,102 | 0 | $0 | 3 | $259,343 | 1 | $121,090 |
Detailed mortgage data for all 22 tracts in Kent, WA
| Private Mortgage Insurance Companies Aggregated Statistics For Year 2009 (Based on 6 full and 16 partial tracts) | ||||||
| A) Conventional Home Purchase Loans | B) Refinancings | C) Non-occupant Loans on < 5 Family Dwellings (A & B) | ||||
|---|---|---|---|---|---|---|
| Number | Average Value | Number | Average Value | Number | Average Value | |
| LOANS ORIGINATED | 37 | $246,989 | 46 | $272,240 | 0 | $0 |
| APPLICATIONS APPROVED, NOT ACCEPTED | 16 | $243,664 | 25 | $253,846 | 1 | $193,000 |
| APPLICATIONS DENIED | 5 | $262,986 | 14 | $287,719 | 0 | $0 |
| APPLICATIONS WITHDRAWN | 7 | $188,061 | 4 | $263,145 | 0 | $0 |
| FILES CLOSED FOR INCOMPLETENESS | 3 | $181,393 | 3 | $306,797 | 0 | $0 |
2002 - 2018 National Fire Incident Reporting System (NFIRS) incidents
- Fire incident types reported to NFIRS in Kent, WA
- 4,04040.5%Outside Fires
- 3,86138.7%Structure Fires
- 1,69217.0%Mobile Property/Vehicle Fires
- 3713.7%Other
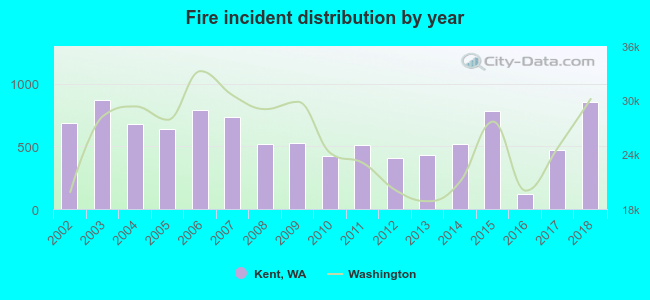 Based on the data from the years 2002 - 2018 the average number of fires per year is 586. The highest number of fire incidents - 869 took place in 2003, and the least - 117 in 2016. The data has a growing trend.
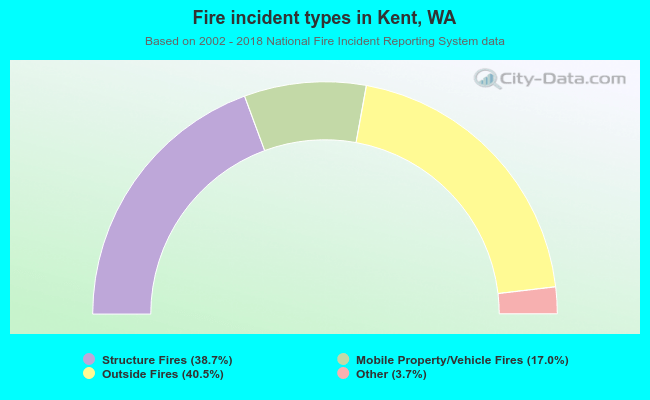 When looking into fire subcategories, the most incidents belonged to: Outside Fires (40.5%), and Structure Fires (38.7%).
Fire-safe hotels and motels in Kent, Washington:
- Days Inn, 22420 84TH Ave S, Kent, Washington 98032 , Phone: (253) 395-5444, Fax: (253) 872-1554
- Holiday Inn Hotel & Suites, 22318 S 84TH Ave, Kent, Washington 98032 , Phone: (253) 395-4300, Fax: (253) 395-0116
- Best Western Plaza By The Green, 24415 Russell Rd, Kent, Washington 98032 , Phone: (253) 854-8767, Fax: (253) 850-7667
- Extended Stay America - Seattle - Kent, 22520 83rd Ave S, Kent, Washington 98032 , Phone: (253) 872-6514, Fax: (253) 872-6906
- Crossland Economy Studios - Seattle - Kent - Des Moines, 25104 Pacific Hwy S, Kent, Washington 98032 , Phone: (253) 946-1744, Fax: (253) 946-1712
- Hawthorn Suites By Wyndham-Seattle South/Kent, 6329 S 212th St, Kent, Washington 98032 , Phone: (253) 395-3800, Fax: (253) 395-4318
- Towneplace Suites Seattle Southcenter, 18123 72nd Ave S, Kent, Washington 98032 , Phone: (253) 796-6000, Fax: (253) 796-6050
- Hampton Inn & Suites, 21109 - 66th Avenue S, Kent, Washington 98032 , Phone: (253) 872-8811
- 5 other hotels and motels
| Most common first names in Kent, WA among deceased individuals | ||
| Name | Count | Lived (average) |
|---|---|---|
| John | 325 | 73.9 years |
| William | 265 | 72.5 years |
| Mary | 251 | 78.5 years |
| Robert | 244 | 69.4 years |
| James | 235 | 69.8 years |
| George | 185 | 76.0 years |
| Charles | 184 | 74.7 years |
| Donald | 154 | 68.9 years |
| Richard | 144 | 66.5 years |
| Dorothy | 137 | 79.4 years |
| Most common last names in Kent, WA among deceased individuals | ||
| Last name | Count | Lived (average) |
|---|---|---|
| Johnson | 172 | 75.9 years |
| Smith | 124 | 73.3 years |
| Anderson | 105 | 77.4 years |
| Williams | 70 | 71.7 years |
| Wilson | 66 | 75.1 years |
| Miller | 62 | 72.7 years |
| Nelson | 60 | 78.6 years |
| Brown | 59 | 74.8 years |
| Thompson | 56 | 72.9 years |
| Jones | 53 | 74.3 years |
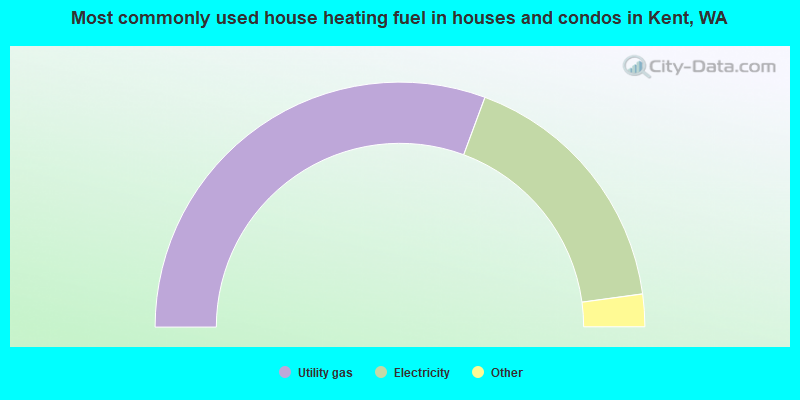
- 61.3%Utility gas
- 34.4%Electricity
- 2.5%Bottled, tank, or LP gas
- 0.7%Fuel oil, kerosene, etc.
- 0.6%Wood
- 0.3%No fuel used
- 0.2%Other fuel
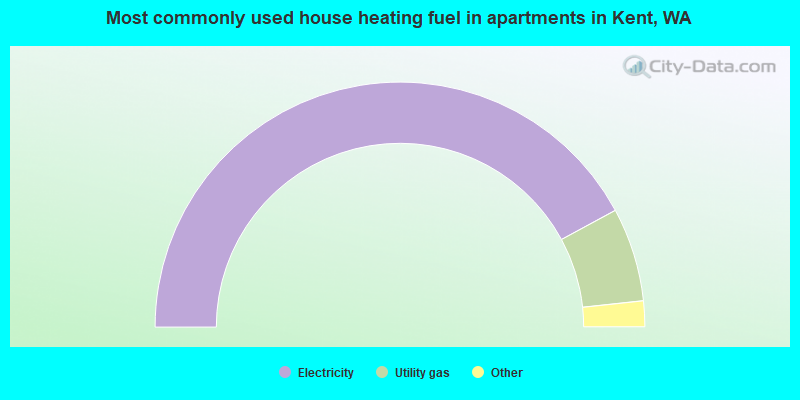
- 84.2%Electricity
- 12.4%Utility gas
- 1.6%No fuel used
- 0.8%Bottled, tank, or LP gas
- 0.6%Wood
- 0.2%Solar energy
- 0.2%Fuel oil, kerosene, etc.
Kent compared to Washington state average:
- Unemployed percentage below state average.
- Black race population percentage significantly above state average.
- Hispanic race population percentage above state average.
- Foreign-born population percentage significantly above state average.
Kent, WA compared to other similar cities:
Kent on our top lists:
- #13 on the list of "Top 101 cities with the lowest minimum monthly sunshine amount (population 50,000+)"
- #13 on the list of "Top 101 cities with the lowest average sunshine amount (population 50,000+)"
- #15 on the list of "Top 101 cities with the lowest maximum monthly sunshine amount (population 50,000+)"
- #17 on the list of "Top 101 cities with the highest average humidity (population 50,000+)"
- #18 on the list of "Top 101 cities with largest percentage of females in industries: wholesale trade (population 50,000+)"
- #18 on the list of "Top 101 cities with the highest maximum monthly morning or afternoon humidity (population 50,000+)"
- #20 on the list of "Top 101 cities with the lowest average wind speeds (population 50,000+)"
- #20 on the list of "Top 101 cities with the largest city-data.com crime index per police officer (population 50,000+)"
- #22 on the list of "Top 101 cities with largest percentage of females in industries: retail trade (population 50,000+)"
- #28 on the list of "Top 101 cities with largest percentage population increases in the 1990s) (population 50,000+)"
- #30 on the list of "Top 101 cities with largest percentage of females in occupations: law enforcement workers including supervisors (population 50,000+)"
- #40 on the list of "Top 101 cities with the highest number of auto thefts per 100,000 residents, excludes tourist destinations and others with a lot of outsiders visiting based on city industries data (population 50,000+)"
- #48 on the list of "Top 101 cities with largest percentage of females in occupations: computer and mathematical occupations (population 50,000+)"
- #49 on the list of "Top 100 high-educated but low-earning cities (pop. 50,000+)"
- #49 on the list of "Top 100 most racially diverse cities (pop. 50,000+)"
- #51 on the list of "Top 101 cities with largest percentage of males in industries: information (population 50,000+)"
- #56 on the list of "Top 101 cities with the highest number of rapes per 100,000 residents, excludes tourist destinations and others with a lot of outsiders visiting based on city industries data (population 50,000+)"
- #58 on the list of "Top 101 cities with the most residents born in Ukraine (population 500+)"
- #61 on the list of "Top 101 cities with the largest percentage population increase from 2000 (population 50,000+)"
- #70 on the list of "Top 101 cities with the most residents born in Other South Central Asia (population 500+)"
- #37 (98188) on the list of "Top 101 zip codes with the most hotels or motels in 2005"
- #5 on the list of "Top 101 counties with the most Mainline Protestant congregations"
- #8 on the list of "Top 101 counties with the lowest Ozone (1-hour) air pollution readings in 2012 (ppm)"
- #9 on the list of "Top 101 counties with the most Other congregations"
- #11 on the list of "Top 101 counties with the most Mainline Protestant adherents"
- #11 on the list of "Top 101 counties with the highest percentage of residents that exercised in the past month"

|
|
Total of 1140 patent applications in 2008-2024.