Estimated zip code population in 2022: 36,572 Zip code population in 2010: 32,489 Zip code population in 2000: 24,261
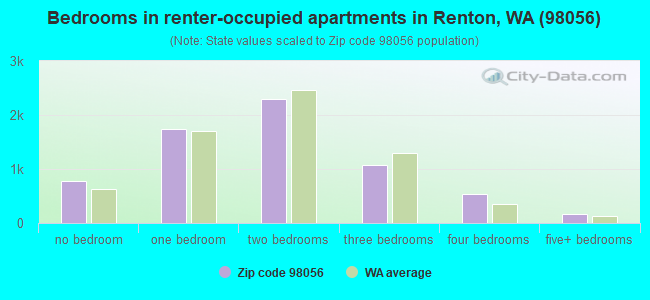
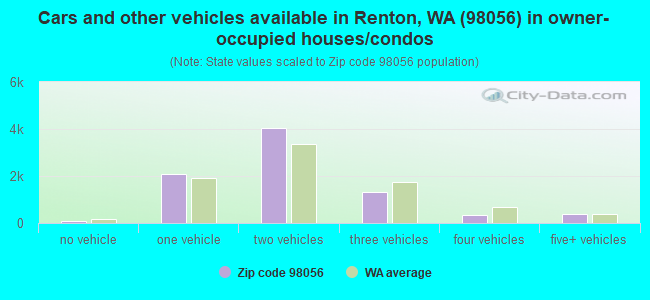
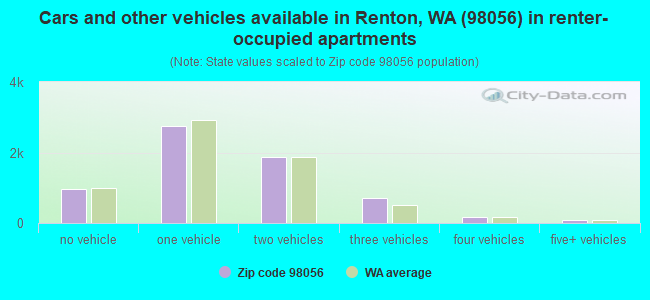
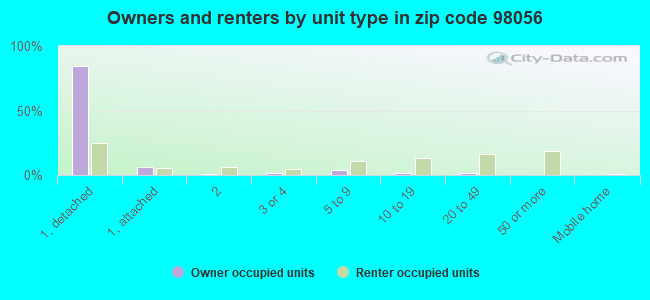
Houses and condos: 15,704 Renter-occupied apartments: 6,568
% of renters here:
44%
State:
36%
March 2022 cost of living index in zip code 98056: 114.5 (more than average, U.S. average is 100)
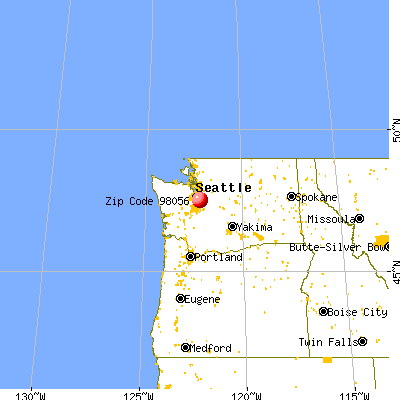
Land area: 7.5 sq. mi. Water area: 1.5 sq. mi.
Population density: 4,854 people per square mile
(average).
OSM Map
General Map
Google Map
MSN Map
OSM Map
General Map
Google Map
MSN Map
OSM Map
General Map
Google Map
MSN Map
OSM Map
General Map
Google Map
MSN Map
Please wait while loading the map...
Real estate property taxes paid for housing units in 2022:
This zip code:
0.8% ($6,624)
Washington:
0.8% ($4,283)
Median real estate property taxes paid for housing units with mortgages in 2022: $6,430 (0.8%) Median real estate property taxes paid for housing units with no mortgage in 2022: $6,937 (0.9%)
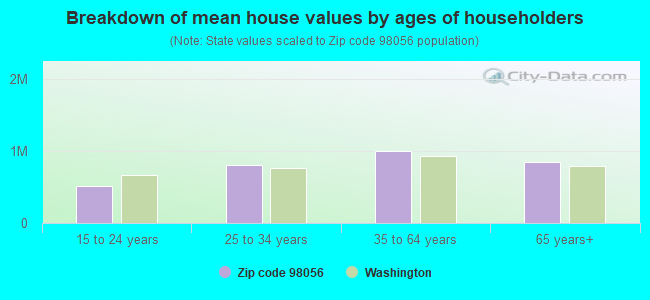
Estimated median house/condo value in 2022: $819,724
98056:
$819,724
Washington:
$569,500
According to our research of Washington and other state lists, there were 9 registered sex offenders living in 98056 zip code as of April 26, 2024. The ratio of all residents to sex offenders in zip code 98056 is 3,960 to 1. The ratio of registered sex offenders to all residents in this zip code is much lower than the state average.
Median resident age:
This zip code:
38.5 years
Washington median age:
38.4 years
Average household size:
This zip code:
2.5 people
Washington:
2.5 people
Averages for the 2020 tax year for zip code 98056, filed in 2021:
Average Adjusted Gross Income (AGI) in 2020: $115,625 (Individual Income Tax Returns)
Here:
$115,625
State:
$99,264
Salary/wage: $92,272 (reported on 85.0% of returns)
Here:
$92,272
State:
$80,347
(% of AGI for various income ranges: 1148.3% for AGIs below $25k, 3735.1% for AGIs $25k-50k, 6718.9% for AGIs $50k-75k, 9925.3% for AGIs $75k-100k, 19311.6% for AGIs $100k-200k, 102969.3% for AGIs over 200k)
Taxable interest for individuals: $1,917 (reported on 36.3% of returns)
This zip code:
$1,917
Washington:
$2,077
(% of AGI for various income ranges: 20.9% for AGIs below $25k, 23.9% for AGIs $25k-50k, 30.2% for AGIs $50k-75k, 49.9% for AGIs $75k-100k, 120.8% for AGIs $100k-200k, 1250.0% for AGIs over 200k)
Ordinary dividends: $6,897 (reported on 27.1% of returns)
Here:
$6,897
State:
$10,013
(% of AGI for various income ranges: 31.8% for AGIs below $25k, 28.4% for AGIs $25k-50k, 82.5% for AGIs $50k-75k, 154.7% for AGIs $75k-100k, 355.3% for AGIs $100k-200k, 3495.4% for AGIs over 200k)
Net capital gain/loss in AGI: +$30,958 (reported on 25.9% of returns)
Here:
+$30,958
State:
+$40,092
(% of AGI for various income ranges: 19.1% for AGIs below $25k, 39.2% for AGIs $25k-50k, 85.1% for AGIs $50k-75k, 205.9% for AGIs $75k-100k, 649.1% for AGIs $100k-200k, 20532.1% for AGIs over 200k)
Profit/loss from business: +$19,660 (reported on 14.7% of returns)
Here:
+$19,660
State:
+$18,312
(% of AGI for various income ranges: 133.6% for AGIs below $25k, 199.9% for AGIs $25k-50k, 251.3% for AGIs $50k-75k, 319.0% for AGIs $75k-100k, 580.8% for AGIs $100k-200k, 3582.5% for AGIs over 200k)
Taxable individual retirement arrangement distribution: $25,593 (reported on 7.0% of returns)
98056:
$25,593
Washington:
$24,221
(% of AGI for various income ranges: 44.2% for AGIs below $25k, 51.1% for AGIs $25k-50k, 135.5% for AGIs $50k-75k, 239.4% for AGIs $75k-100k, 567.1% for AGIs $100k-200k, 2114.8% for AGIs over 200k)
Self-employed (Keogh) retirement plans: $22,462 (reported on 0.9% of returns)
98056:
$22,462
Washington:
$24,166
(% of AGI for various income ranges: 11.9% for AGIs $25k-50k, 27.9% for AGIs $100k-200k, 441.5% for AGIs over 200k)
Total itemized deductions: $33,329 (reported on 15.0% of returns)
Here:
$33,329
State:
$39,068
(% of AGI for various income ranges: 86.6% for AGIs below $25k, 123.6% for AGIs $25k-50k, 348.3% for AGIs $50k-75k, 572.6% for AGIs $75k-100k, 1358.4% for AGIs $100k-200k, 7101.0% for AGIs over 200k)
Charity contributions: $7,537 (reported on 11.2% of returns)
Here:
$7,537
State:
$15,331
(% of AGI for various income ranges: 3.2% for AGIs below $25k, 14.0% for AGIs $25k-50k, 37.9% for AGIs $50k-75k, 71.1% for AGIs $75k-100k, 189.4% for AGIs $100k-200k, 1534.3% for AGIs over 200k)
Taxes paid: $8,295 (reported on 14.9% of returns)
98056:
$8,295
State:
$7,774
(% of AGI for various income ranges: 16.7% for AGIs below $25k, 29.7% for AGIs $25k-50k, 94.5% for AGIs $50k-75k, 157.6% for AGIs $75k-100k, 370.0% for AGIs $100k-200k, 1596.4% for AGIs over 200k)
Earned income credit: $1,813 (reported on 7.5% of returns)
Here:
$1,813
State:
$2,020
(% of AGI for various income ranges: 50.1% for AGIs below $25k, 35.1% for AGIs $25k-50k)
Percentage of individuals using paid preparers for their 2020 taxes: 91.9%
Here:
92%
State:
93%
(% for various income ranges: 89.9% for AGIs below $25k, 91.8% for AGIs $25k-50k, 91.9% for AGIs $50k-75k, 91.8% for AGIs $75k-100k, 92.6% for AGIs $100k-200k, 94.7% for AGIs over 200k)
Averages for the 2012 tax year for zip code 98056, filed in 2013:
Average Adjusted Gross Income (AGI) in 2012: $69,541 (Individual Income Tax Returns)
Here:
$69,541
State:
$69,533
Salary/wage: $62,972 (reported on 86.7% of returns)
Here:
$62,972
State:
$57,267
(% of AGI for various income ranges: 78.2% for AGIs below $25k, 84.9% for AGIs $25k-50k, 82.9% for AGIs $50k-75k, 81.3% for AGIs $75k-100k, 83.2% for AGIs $100k-200k, 65.8% for AGIs over 200k)
Taxable interest for individuals: $1,115 (reported on 40.4% of returns)
This zip code:
$1,115
Washington:
$1,816
(% of AGI for various income ranges: 1.0% for AGIs below $25k, 0.5% for AGIs $25k-50k, 0.6% for AGIs $50k-75k, 0.7% for AGIs $75k-100k, 0.6% for AGIs $100k-200k, 0.7% for AGIs over 200k)
Ordinary dividends: $4,026 (reported on 22.7% of returns)
Here:
$4,026
State:
$8,163
(% of AGI for various income ranges: 1.6% for AGIs below $25k, 0.8% for AGIs $25k-50k, 1.0% for AGIs $50k-75k, 1.0% for AGIs $75k-100k, 1.2% for AGIs $100k-200k, 2.0% for AGIs over 200k)
Net capital gain/loss in AGI: +$11,536 (reported on 17.3% of returns)
Here:
+$11,536
State:
+$21,568
(% of AGI for various income ranges: 0.2% for AGIs $25k-50k, 0.4% for AGIs $50k-75k, 0.6% for AGIs $75k-100k, 1.0% for AGIs $100k-200k, 9.7% for AGIs over 200k)
Profit/loss from business: +$17,387 (reported on 13.3% of returns)
Here:
+$17,387
State:
+$16,521
(% of AGI for various income ranges: 7.3% for AGIs below $25k, 3.1% for AGIs $25k-50k, 3.1% for AGIs $50k-75k, 2.6% for AGIs $75k-100k, 2.8% for AGIs $100k-200k, 3.8% for AGIs over 200k)
Taxable individual retirement arrangement distribution: $18,047 (reported on 8.1% of returns)
98056:
$18,047
Washington:
$18,648
(% of AGI for various income ranges: 2.2% for AGIs below $25k, 1.6% for AGIs $25k-50k, 1.9% for AGIs $50k-75k, 2.8% for AGIs $75k-100k, 2.4% for AGIs $100k-200k, 1.6% for AGIs over 200k)
Self-employment retirement plans: $20,485 (reported on 0.8% of returns)
98056:
$20,485
Washington:
$20,087
(% of AGI for various income ranges: 0.3% for AGIs $50k-75k, 0.3% for AGIs $100k-200k, 0.4% for AGIs over 200k)
Total itemized deductions: $23,471 (19% of AGI, reported on 34.8% of returns)
Here:
$23,471
State:
$23,872
Here:
19.1% of AGI
State:
18.2% of AGI
(% of AGI for various income ranges: 10.0% for AGIs below $25k, 9.5% for AGIs $25k-50k, 12.6% for AGIs $50k-75k, 13.3% for AGIs $75k-100k, 13.5% for AGIs $100k-200k, 9.9% for AGIs over 200k)
Charity contributions: $3,363 (reported on 27.6% of returns)
Here:
$3,363
State:
$4,465
(% of AGI for various income ranges: 0.6% for AGIs below $25k, 0.6% for AGIs $25k-50k, 1.2% for AGIs $50k-75k, 1.3% for AGIs $75k-100k, 1.6% for AGIs $100k-200k, 1.6% for AGIs over 200k)
Taxes paid: $6,507 (reported on 34.3% of returns)
98056:
$6,507
State:
$6,400
(% of AGI for various income ranges: 2.1% for AGIs below $25k, 2.2% for AGIs $25k-50k, 3.2% for AGIs $50k-75k, 3.6% for AGIs $75k-100k, 3.9% for AGIs $100k-200k, 2.8% for AGIs over 200k)
Earned income credit: $1,903 (reported on 11.5% of returns)
Here:
$1,903
State:
$2,073
(% of AGI for various income ranges: 4.2% for AGIs below $25k, 0.7% for AGIs $25k-50k)
Percentage of individuals using paid preparers for their 2012 taxes: 41.8%
Here:
42%
State:
43%
(% for various income ranges: 39.2% for AGIs below $25k, 40.4% for AGIs $25k-50k, 40.5% for AGIs $50k-75k, 43.9% for AGIs $75k-100k, 43.7% for AGIs $100k-200k, 59.7% for AGIs over 200k)
Averages for the 2004 tax year for zip code 98056, filed in 2005:
Average Adjusted Gross Income (AGI) in 2004: $56,049 (Individual Income Tax Returns)
Here:
$56,049
State:
$54,331
Salary/wage: $50,145 (reported on 87.1% of returns)
Here:
$50,145
State:
$45,761
(% of AGI for various income ranges: 119.1% for AGIs below $10k, 78.4% for AGIs $10k-25k, 86.0% for AGIs $25k-50k, 83.7% for AGIs $50k-75k, 84.2% for AGIs $75k-100k, 68.9% for AGIs over 100k)
Taxable interest for individuals: $1,491 (reported on 48.2% of returns)
This zip code:
$1,491
Washington:
$2,110
(% of AGI for various income ranges: 5.5% for AGIs below $10k, 1.9% for AGIs $10k-25k, 1.0% for AGIs $25k-50k, 1.2% for AGIs $50k-75k, 0.9% for AGIs $75k-100k, 1.4% for AGIs over 100k)
Taxable dividends: $3,104 (reported on 28.3% of returns)
Here:
$3,104
State:
$5,879
(% of AGI for various income ranges: 4.9% for AGIs below $10k, 1.2% for AGIs $10k-25k, 1.0% for AGIs $25k-50k, 1.1% for AGIs $50k-75k, 1.2% for AGIs $75k-100k, 2.1% for AGIs over 100k)
Net capital gain/loss: +$10,344 (reported on 24.0% of returns)
Here:
+$10,344
State:
+$15,835
(% of AGI for various income ranges: -1.6% for AGIs below $10k, 0.4% for AGIs $10k-25k, 0.2% for AGIs $25k-50k, 0.7% for AGIs $50k-75k, 1.2% for AGIs $75k-100k, 9.7% for AGIs over 100k)
Profit/loss from business: +$14,104 (reported on 12.7% of returns)
Here:
+$14,104
State:
+$13,994
(% of AGI for various income ranges: 1.3% for AGIs below $10k, 5.5% for AGIs $10k-25k, 1.9% for AGIs $25k-50k, 3.0% for AGIs $50k-75k, 2.5% for AGIs $75k-100k, 3.8% for AGIs over 100k)
IRA payment deduction: $2,976 (reported on 2.7% of returns)
98056:
$2,976
Washington:
$3,001
(% of AGI for various income ranges: 0.4% for AGIs below $10k, 0.2% for AGIs $10k-25k, 0.3% for AGIs $25k-50k, 0.1% for AGIs $50k-75k, 0.2% for AGIs $75k-100k, 0.1% for AGIs over 100k)
Self-employed pension: $13,174 (reported on 1.0% of returns)
Here:
$13,174
Washington:
$14,244
(% of AGI for various income ranges: 0.1% for AGIs $25k-50k, 0.1% for AGIs $50k-75k, 0.2% for AGIs $75k-100k, 0.4% for AGIs over 100k)
Total itemized deductions: $19,049 (21% of AGI, reported on 41.5% of returns)
Here:
$19,049
State:
$19,669
Here:
21.5% of AGI
State:
20.7% of AGI
(% of AGI for various income ranges: 19.9% for AGIs below $10k, 11.7% for AGIs $10k-25k, 13.4% for AGIs $25k-50k, 16.4% for AGIs $50k-75k, 17.3% for AGIs $75k-100k, 12.5% for AGIs over 100k)
Charity contributions deductions: $2,533 (3% of AGI, reported on 35.7% of returns)
Here:
$2,533
State:
$3,569
Here:
2.7% of AGI
State:
3.5% of AGI
(% of AGI for various income ranges: 0.9% for AGIs below $10k, 0.8% for AGIs $10k-25k, 1.2% for AGIs $25k-50k, 1.5% for AGIs $50k-75k, 2.0% for AGIs $75k-100k, 1.8% for AGIs over 100k)
Total tax: $8,502 (reported on 82.2% of returns)
98056:
$8,502
State:
$9,065
(% of AGI for various income ranges: 3.8% for AGIs below $10k, 4.6% for AGIs $10k-25k, 7.6% for AGIs $25k-50k, 10.0% for AGIs $50k-75k, 11.1% for AGIs $75k-100k, 17.5% for AGIs over 100k)
Earned income credit: $1,497 (reported on 9.7% of returns)
Here:
$1,497
State:
$1,607
Percentage of individuals using paid preparers for their 2004 taxes: 46.2%
Here:
46%
State:
49%
(% for various income ranges: 40.8% for AGIs below $10k, 50.1% for AGIs $10k-25k, 45.8% for AGIs $25k-50k, 45.1% for AGIs $50k-75k, 43.6% for AGIs $75k-100k, 49.8% for AGIs over 100k)
Likely homosexual households (counted as self-reported same-sex unmarried-partner households)
Lesbian couples: 0.1% of all households
Gay men: 0.3% of all households
Household received Food Stamps/SNAP in the past 12 months: 1,543 Household did not receive Food Stamps/SNAP in the past 12 months: 13,264
Women who had a birth in the past 12 months: 370 (348 now married, 29 unmarried) Women who did not have a birth in the past 12 months: 8,698 (3,945 now married, 4,751 unmarried)
Housing units in zip code 98056 with a mortgage: 5,461 (483 second mortgage, 24 home equity loan, 402 both second mortgage and home equity loan) Houses without a mortgage: 96
Median monthly owner costs for units with a mortgage: $2,881 Median monthly owner costs for units without a mortgage: $1,025
Residents with income below the poverty level in 2022:
This zip code:
6.4%
Whole state:
10.0%
Residents with income below 50% of the poverty level in 2022:
This zip code:
2.7%
Whole state:
4.6%
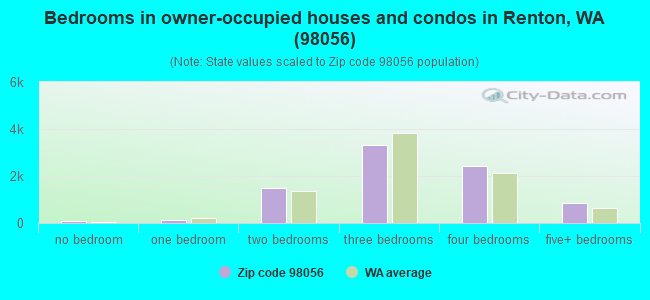
Median number of rooms in houses and condos:
Here:
6.4
State:
6.5
Median number of rooms in apartments:
Here:
3.9
State:
3.9
Notable locations in this zip code not listed on our city pages
Notable locations in zip code 98056: Sunset Square (A), Quendall (B), May Creek (C), King County Medic One (D), Renton Fire Department Station 12 (E). Display/hide their locations on the map
Parks in zip code 98056 include: Gene Coulon Memorial Beach Park (1), Renton Stadium (2), Windsor Hills Park (3), Hazelwood Park (4), May Creek Park (5), Kennydale Lions Park (6). Display/hide their locations on the map
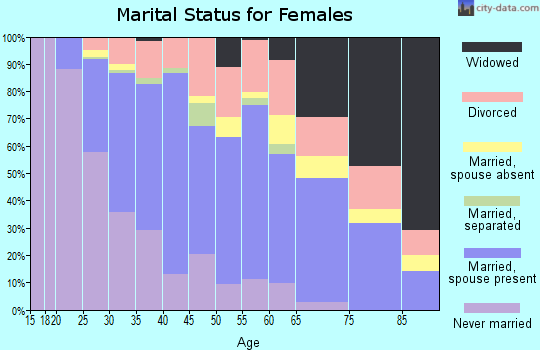
4,376 married couples with children.
1,671 single-parent households (461 men, 1,210 women).
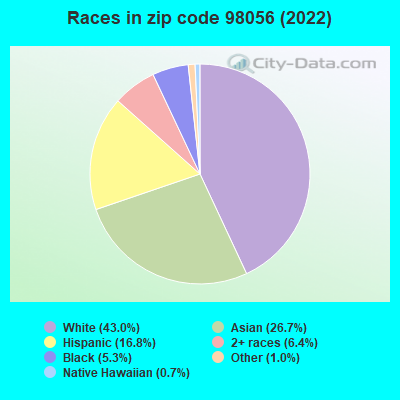
57.9% of residents of 98056 zip code speak English at home.
13.9% of residents speak Spanish at home (53% very well, 16% well, 24% not well, 6% not at all).
7.0% of residents speak other Indo-European language at home (60% very well, 17% well, 18% not well, 5% not at all).
20.4% of residents speak Asian or Pacific Island language at home (45% very well, 29% well, 16% not well, 10% not at all).
1.6% of residents speak other language at home (63% very well, 35% well, 2% not well).
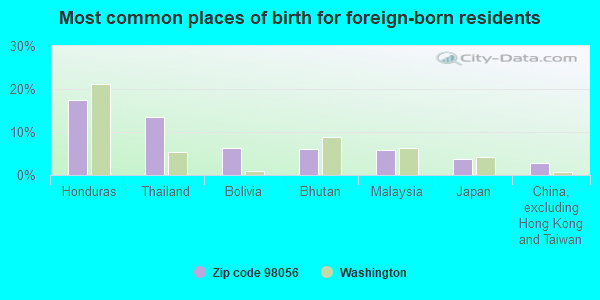
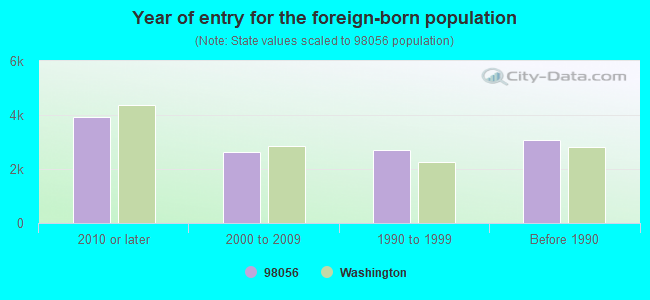
Foreign born population: 11,787 (32.2%) (51.9% of them are naturalized citizens)
Facilities with environmental interests located in this zip code:
BP STORE 5509 (3002 NE SUNSET BLVD in RENTON, WA)
Conditionally Exempt Small Quantity Generators, less than 100 kg/month of hazardous waste (Resource Conservation and Recovery Act (tracking hazardous waste)) STATE MASTER (Washington State Department of Ecology's Facility/Site identification system) - TOXICS-8684, LEAKING STORAGE TANK, UNDERGROUND STORAGE TANK PROGRAM STATE MASTER (Washington State Department of Ecology's Facility/Site identification system) - HAZWASTE-WAD988487096, HAZARDOUS WASTE PROGRAM, EPCRA, TOXICS-, REMEDIAL ACTION PLAN MONITORING Business SIC classification: GASOLINE SERVICE STATIONS Organizations: CONOCOPHILLIPS (CONTACT/OPERATOR)
, CONOCOPHILLIPS COMPANY (CONTACT/OWNER)
Alternative names: BP STA 11055, TOSCO FACILITY 05509
CHEVRON USA INC SS 94522 (4044 NE SUNSET BLVD in RENTON, WA)
(Resource Conservation and Recovery Act (tracking hazardous waste)) STATE MASTER (Washington State Department of Ecology's Facility/Site identification system) - HAZWASTE-WAD988485660, HAZARDOUS WASTE PROGRAM, TOXICS-5168, LEAKING STORAGE TANK, UNDERGROUND STORAGE TANK PROGRAM, VOLUNTARY CLEAN UP PROGRAM, HAZWASTE-WAD988485660, EPCRA Business SIC classification: GASOLINE SERVICE STATIONS; NONCLASSIFIABLE ESTABLISHMENTS Organizations: CHEVRON PRODUCTS CO (CONTACT/ HAZARDOUS WASTE)
Alternative names: SUNSET CHEVRON
BUSY BEE CLEANERS (3164 SUNSET BLVD NE in RENTON, WA)
Conditionally Exempt Small Quantity Generators, less than 100 kg/month of hazardous waste (Resource Conservation and Recovery Act (tracking hazardous waste)) STATE MASTER (Washington State Department of Ecology's Facility/Site identification system) - HAZWASTE-WAD980984322, CESQG Business SIC classification: DRYCLEANING PLANTS, EXCEPT RUG CLEANING Organizations: IL SUNG JUN (CONTACT/OPERATOR)
, RJ HALLISSEY CO INC (HAZARDOUS WASTE LAND OWNER)
ARCO 5491 (1537 DUVALL AVE NE in RENTON, WA)
(Resource Conservation and Recovery Act (tracking hazardous waste)) STATE MASTER (Washington State Department of Ecology's Facility/Site identification system) - TOXICS-97712, LEAKING STORAGE TANK, UNDERGROUND STORAGE TANK PROGRAM, HAZWASTE-WAD988515003, EPCRA, HAZARDOUS WASTE PROGRAM Business SIC classification: GASOLINE SERVICE STATIONS Organizations: INFINITY INTERNATIONAL INC (CONTACT/OPERATOR)
, BP WEST COAST PRODUCTS LLC (CONTACT/OWNER)
Alternative names: ARCO 05491
ARCO 5362 (2900 NE 3RD ST in RENTON, WA)
(Resource Conservation and Recovery Act (tracking hazardous waste)) STATE MASTER (Washington State Department of Ecology's Facility/Site identification system) - HAZWASTE-WAD988514881, SQG, TOXICS-97567, UNDERGROUND STORAGE TANK PROGRAM, HAZWASTE-WAD988514881, EPCRA Business SIC classification: GASOLINE SERVICE STATIONS Organizations: BP WEST COAST PRODUCTS LLC (CONTACT/OWNER)
Alternative names: ARCO 05362
BP SERVICE STATION 11070 (4105 NORTHEAST 4TH STREET in RENTON, WA)
Conditionally Exempt Small Quantity Generators, less than 100 kg/month of hazardous waste (Resource Conservation and Recovery Act (tracking hazardous waste)) STATE MASTER (Washington State Department of Ecology's Facility/Site identification system) - TOXICS-10161, LEAKING STORAGE TANK, TOXICS-, UNDERGROUND STORAGE TANK PROGRAM, VOLUNTARY CLEAN UP PROGRAM, HAZWASTE-WAD988487286, EPCRA, HAZARDOUS WASTE PROGRAM Business SIC classification: GASOLINE SERVICE STATIONS Organizations: DAN DEL MUNDO (CONTACT/OPERATOR)
, CONOCOPHILLIPS COMPANY (CONTACT/OWNER)
Alternative names: BP SERVICE STATION 4TH ST
CONOCOPHILLIPS 30100 (4715 NE SUNSET in RENTON, WA)
Conditionally Exempt Small Quantity Generators, less than 100 kg/month of hazardous waste (Resource Conservation and Recovery Act (tracking hazardous waste)) STATE MASTER (Washington State Department of Ecology's Facility/Site identification system) - HAZWASTE-WAD988488557, HAZARDOUS WASTE PROGRAM, TOXICS-9546, LEAKING STORAGE TANK, UNDERGROUND STORAGE TANK PROGRAM, HAZWASTE-WAD988488557, EPCRA Business SIC classification: GASOLINE SERVICE STATIONS Organizations: MITCH KAZEMI (CONTACT/OPERATOR)
Alternative names: BP SERVICE STATION 03128, SUNSET 76
ACORN CUSTOM CABINETRY INCORPORATED (7211 132ND PLACE SOUTHEAST in RENTON, WA)
COMPLIANCE ACTIVITY (Tracking inspections of insecticide, fungicide, and rodenticide, and toxic substances) TRI REPORTER (Tracking of toxic chemicals releasing facilities) STATE MASTER (Washington State Department of Ecology's Facility/Site identification system) - HAZWASTE-CRK000027090, TRI REPORTER, HAZARDOUS WASTE PROGRAM Business SIC classification: WOOD KITCHEN CABINETS
CLEANING SHOPPE (2830 SUNSET BLVD NE in RENTON, WA)
(Resource Conservation and Recovery Act (tracking hazardous waste))
Housing units lacking complete kitchen facilities: 1.0%
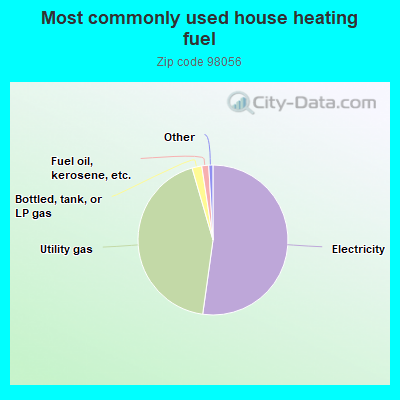
52.2%Electricity
43.3%Utility gas
2.1%Bottled, tank, or LP gas
1.5%Fuel oil, kerosene, etc.
Population in 1990: 23,790. Population change in the 1990s: +471 (+2.0%).
Place of birth for U.S.-born residents:
This state: 14,521
Northeast: 1,225
Midwest: 2,352
South: 1,789
West: 4,484
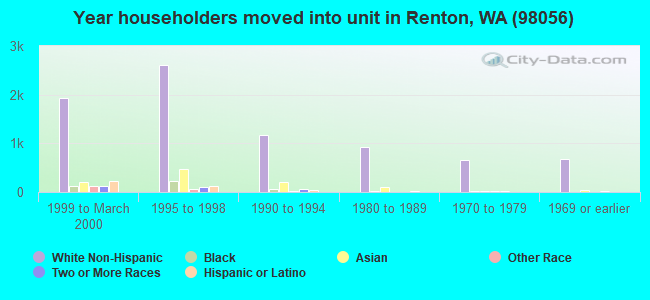
47% of the 98056 zip code residents lived in the same house 5 years ago. Out of people who lived in different houses, 66% lived in this county. Out of people who lived in different counties, 50% lived in Washington.
87% of the 98056 zip code residents lived in the same house 1 year ago. Out of people who lived in different houses, 69% moved from this county. Out of people who lived in different houses, 11% moved from different county within same state. Out of people who lived in different houses, 14% moved from different state. Out of people who lived in different houses, 3% moved from abroad.
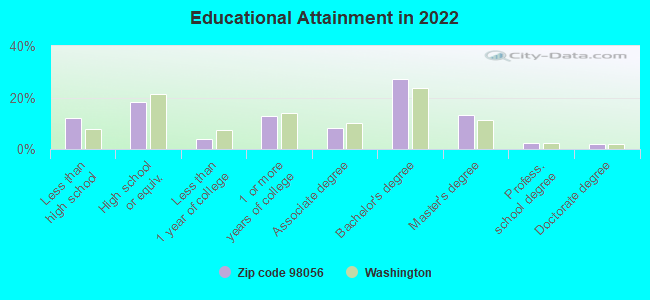
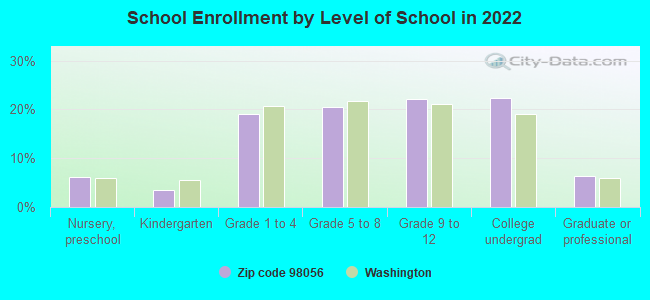
Private vs. public school enrollment:
Students in private schools in grades 1 to 8 (elementary and middle school): 459
Here:
15.5%
Washington:
12.4%
Students in private schools in grades 9 to 12 (high school): 169
Here:
10.2%
Washington:
9.2%
Students in private undergraduate colleges: 200
Here:
12.0%
Washington:
16.5%
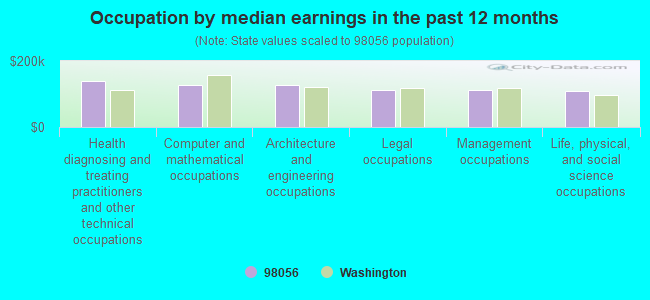
Occupation by median earnings in the past 12 months ($)
139,243Health diagnosing and treating practitioners and other technical occupations
127,064Computer and mathematical occupations
125,884Architecture and engineering occupations
112,358Legal occupations
111,150Management occupations
110,078Life, physical, and social science occupations
Companies with federal contracts located in this zip code:
BOB HERLING (2916 KENNEWICK PL NE in RENTON, WA; small business)
$48,595 with Navy for Mechanical Presses, Power Driven. Signed on 2003-09-30. Completion date: 2003-12-26.
EMERALD CITY FENCE RENTALS LLC (1725 NE 24TH in RENTON, WA; small business)
-$1,014 with Navy for Landscaping/Groundskeeping Services. Signed on 2004-10-12. Completion date: 2004-08-10.
Top industries in this zip code by the number of employees in 2005:
2002 - 2018 National Fire Incident Reporting System (NFIRS) incidents
According to the data from the years 2002 - 2018 the average number of fire incidents per year is 81. The highest number of reported fire incidents - 152 took place in 2004, and the least - 13 in 2002. The data has a growing trend.
When looking into fire subcategories, the most reports belonged to: Outside Fires (46.4%), and Structure Fires (36.1%).
Fire incident types reported to NFIRS in Zip Code 98056


 Nearest zip codes: 98057, 98178, 98006, 98055, 98040, 98059.
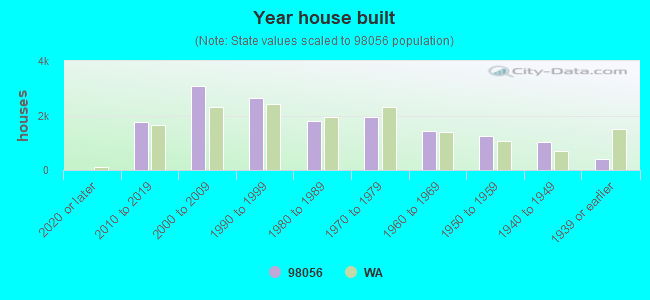


 According to the data from the years 2002 - 2018 the average number of fire incidents per year is 81. The highest number of reported fire incidents - 152 took place in 2004, and the least - 13 in 2002. The data has a growing trend.
 When looking into fire subcategories, the most reports belonged to: Outside Fires (46.4%), and Structure Fires (36.1%).