Estimated zip code population in 2022: 27,098
Zip code population in 2010: 24,092
Zip code population in 2000: 21,860
Houses and condos: 10,298
Renter-occupied apartments: 3,182
% of renters here:
32%State:
36%
March 2022 cost of living index in zip code 98178: 113.1
(more than average, U.S. average is 100)
Land area: 4.8
sq. mi.
Water area: 1.0
sq. mi.
Population density: 5,591 people per square mile (average).
OSM Map
General Map
Google Map
MSN Map
OSM Map
General Map
Google Map
MSN Map
OSM Map
General Map
Google Map
MSN Map
OSM Map
General Map
Google Map
MSN Map
Please wait while loading the map...
Real estate property taxes paid for housing units in 2022:
This zip code:
0.8% ($5,436)Washington:
0.8% ($4,283)
Median real estate property taxes paid for housing units with mortgages in 2022: $5,325 (0.7%)
Median real estate property taxes paid for housing units with no mortgage in 2022: $5,708 (0.9%)
Profiles of local businesses
Business Search - 14 Million verified businesses
Males: 13,706 Females: 13,392
For population 25 years and over in 98178:
High school or higher: 86.1%Bachelor's degree or higher: 36.3%Graduate or professional degree: 13.1%Unemployed: 5.8%Mean travel time to work (commute): 31.7 minutes
For population 15 years and over in 98178:
Never married: 31.9%Now married: 48.8%Separated: 2.5%Widowed: 6.9%Divorced: 9.9%
Zip code 98178 compared to state average:
Black race population percentage significantly above state average. Hispanic race population percentage below state average. Foreign-born population percentage above state average. Length of stay since moving in significantly above state average. 8,177 30.2% White 7,789 28.7% Asian 6,938 25.6% Black 1,946 7.2% Hispanic or Latino 1,746 6.4% Two or more races 283 1.0% American Indian 179 0.7% Some other race 37 0.1% Native Hawaiian and Other
Data:
Median household income ($)
Median household income (% change since 2000)
Household income diversity
Ratio of average income to average house value (%)
Ratio of average income to average rent
Median household income ($) - White
Median household income ($) - Black or African American
Median household income ($) - Asian
Median household income ($) - Hispanic or Latino
Median household income ($) - American Indian and Alaska Native
Median household income ($) - Multirace
Median household income ($) - Other Race
Median household income for houses/condos with a mortgage ($)
Median household income for apartments without a mortgage ($)
Races - White alone (%)
Races - White alone (% change since 2000)
Races - Black alone (%)
Races - Black alone (% change since 2000)
Races - American Indian alone (%)
Races - American Indian alone (% change since 2000)
Races - Asian alone (%)
Races - Asian alone (% change since 2000)
Races - Hispanic (%)
Races - Hispanic (% change since 2000)
Races - Native Hawaiian and Other Pacific Islander alone (%)
Races - Native Hawaiian and Other Pacific Islander alone (% change since 2000)
Races - Two or more races (%)
Races - Two or more races (% change since 2000)
Races - Other race alone (%)
Races - Other race alone (% change since 2000)
Racial diversity
Unemployment (%)
Unemployment (% change since 2000)
Unemployment (%) - White
Unemployment (%) - Black or African American
Unemployment (%) - Asian
Unemployment (%) - Hispanic or Latino
Unemployment (%) - American Indian and Alaska Native
Unemployment (%) - Multirace
Unemployment (%) - Other Race
Population density (people per square mile)
Population - Males (%)
Population - Females (%)
Population - Males (%) - White
Population - Males (%) - Black or African American
Population - Males (%) - Asian
Population - Males (%) - Hispanic or Latino
Population - Males (%) - American Indian and Alaska Native
Population - Males (%) - Multirace
Population - Males (%) - Other Race
Population - Females (%) - White
Population - Females (%) - Black or African American
Population - Females (%) - Asian
Population - Females (%) - Hispanic or Latino
Population - Females (%) - American Indian and Alaska Native
Population - Females (%) - Multirace
Population - Females (%) - Other Race
Coronavirus confirmed cases (Apr 27, 2024)
Deaths caused by coronavirus (Apr 27, 2024)
Coronavirus confirmed cases (per 100k population) (Apr 27, 2024)
Deaths caused by coronavirus (per 100k population) (Apr 27, 2024)
Daily increase in number of cases (Apr 27, 2024)
Weekly increase in number of cases (Apr 27, 2024)
Cases doubled (in days) (Apr 27, 2024)
Hospitalized patients (Apr 18, 2022)
Negative test results (Apr 18, 2022)
Total test results (Apr 18, 2022)
COVID Vaccine doses distributed (per 100k population) (Sep 19, 2023)
COVID Vaccine doses administered (per 100k population) (Sep 19, 2023)
COVID Vaccine doses distributed (Sep 19, 2023)
COVID Vaccine doses administered (Sep 19, 2023)
Likely homosexual households (%)
Likely homosexual households (% change since 2000)
Likely homosexual households - Lesbian couples (%)
Likely homosexual households - Lesbian couples (% change since 2000)
Likely homosexual households - Gay men (%)
Likely homosexual households - Gay men (% change since 2000)
Cost of living index
Median gross rent ($)
Median contract rent ($)
Median monthly housing costs ($)
Median house or condo value ($)
Median house or condo value ($ change since 2000)
Mean house or condo value by units in structure - 1, detached ($)
Mean house or condo value by units in structure - 1, attached ($)
Mean house or condo value by units in structure - 2 ($)
Mean house or condo value by units in structure by units in structure - 3 or 4 ($)
Mean house or condo value by units in structure - 5 or more ($)
Mean house or condo value by units in structure - Boat, RV, van, etc. ($)
Mean house or condo value by units in structure - Mobile home ($)
Median house or condo value ($) - White
Median house or condo value ($) - Black or African American
Median house or condo value ($) - Asian
Median house or condo value ($) - Hispanic or Latino
Median house or condo value ($) - American Indian and Alaska Native
Median house or condo value ($) - Multirace
Median house or condo value ($) - Other Race
Median resident age
Resident age diversity
Median resident age - Males
Median resident age - Females
Median resident age - White
Median resident age - Black or African American
Median resident age - Asian
Median resident age - Hispanic or Latino
Median resident age - American Indian and Alaska Native
Median resident age - Multirace
Median resident age - Other Race
Median resident age - Males - White
Median resident age - Males - Black or African American
Median resident age - Males - Asian
Median resident age - Males - Hispanic or Latino
Median resident age - Males - American Indian and Alaska Native
Median resident age - Males - Multirace
Median resident age - Males - Other Race
Median resident age - Females - White
Median resident age - Females - Black or African American
Median resident age - Females - Asian
Median resident age - Females - Hispanic or Latino
Median resident age - Females - American Indian and Alaska Native
Median resident age - Females - Multirace
Median resident age - Females - Other Race
Commute - mean travel time to work (minutes)
Travel time to work - Less than 5 minutes (%)
Travel time to work - Less than 5 minutes (% change since 2000)
Travel time to work - 5 to 9 minutes (%)
Travel time to work - 5 to 9 minutes (% change since 2000)
Travel time to work - 10 to 19 minutes (%)
Travel time to work - 10 to 19 minutes (% change since 2000)
Travel time to work - 20 to 29 minutes (%)
Travel time to work - 20 to 29 minutes (% change since 2000)
Travel time to work - 30 to 39 minutes (%)
Travel time to work - 30 to 39 minutes (% change since 2000)
Travel time to work - 40 to 59 minutes (%)
Travel time to work - 40 to 59 minutes (% change since 2000)
Travel time to work - 60 to 89 minutes (%)
Travel time to work - 60 to 89 minutes (% change since 2000)
Travel time to work - 90 or more minutes (%)
Travel time to work - 90 or more minutes (% change since 2000)
Marital status - Never married (%)
Marital status - Now married (%)
Marital status - Separated (%)
Marital status - Widowed (%)
Marital status - Divorced (%)
Median family income ($)
Median family income (% change since 2000)
Median non-family income ($)
Median non-family income (% change since 2000)
Median per capita income ($)
Median per capita income (% change since 2000)
Median family income ($) - White
Median family income ($) - Black or African American
Median family income ($) - Asian
Median family income ($) - Hispanic or Latino
Median family income ($) - American Indian and Alaska Native
Median family income ($) - Multirace
Median family income ($) - Other Race
Median year house/condo built
Median year apartment built
Year house built - Built 2005 or later (%)
Year house built - Built 2000 to 2004 (%)
Year house built - Built 1990 to 1999 (%)
Year house built - Built 1980 to 1989 (%)
Year house built - Built 1970 to 1979 (%)
Year house built - Built 1960 to 1969 (%)
Year house built - Built 1950 to 1959 (%)
Year house built - Built 1940 to 1949 (%)
Year house built - Built 1939 or earlier (%)
Average household size
Household density (households per square mile)
Average household size - White
Average household size - Black or African American
Average household size - Asian
Average household size - Hispanic or Latino
Average household size - American Indian and Alaska Native
Average household size - Multirace
Average household size - Other Race
Occupied housing units (%)
Vacant housing units (%)
Owner occupied housing units (%)
Renter occupied housing units (%)
Vacancy status - For rent (%)
Vacancy status - For sale only (%)
Vacancy status - Rented or sold, not occupied (%)
Vacancy status - For seasonal, recreational, or occasional use (%)
Vacancy status - For migrant workers (%)
Vacancy status - Other vacant (%)
Residents with income below the poverty level (%)
Residents with income below 50% of the poverty level (%)
Children below poverty level (%)
Poor families by family type - Married-couple family (%)
Poor families by family type - Male, no wife present (%)
Poor families by family type - Female, no husband present (%)
Poverty status for native-born residents (%)
Poverty status for foreign-born residents (%)
Poverty among high school graduates not in families (%)
Poverty among people who did not graduate high school not in families (%)
Residents with income below the poverty level (%) - White
Residents with income below the poverty level (%) - Black or African American
Residents with income below the poverty level (%) - Asian
Residents with income below the poverty level (%) - Hispanic or Latino
Residents with income below the poverty level (%) - American Indian and Alaska Native
Residents with income below the poverty level (%) - Multirace
Residents with income below the poverty level (%) - Other Race
Air pollution - Air Quality Index (AQI)
Air pollution - CO
Air pollution - NO2
Air pollution - SO2
Air pollution - Ozone
Air pollution - PM10
Air pollution - PM25
Air pollution - Pb
Crime - Murders per 100,000 population
Crime - Rapes per 100,000 population
Crime - Robberies per 100,000 population
Crime - Assaults per 100,000 population
Crime - Burglaries per 100,000 population
Crime - Thefts per 100,000 population
Crime - Auto thefts per 100,000 population
Crime - Arson per 100,000 population
Crime - City-data.com crime index
Crime - Violent crime index
Crime - Property crime index
Crime - Murders per 100,000 population (5 year average)
Crime - Rapes per 100,000 population (5 year average)
Crime - Robberies per 100,000 population (5 year average)
Crime - Assaults per 100,000 population (5 year average)
Crime - Burglaries per 100,000 population (5 year average)
Crime - Thefts per 100,000 population (5 year average)
Crime - Auto thefts per 100,000 population (5 year average)
Crime - Arson per 100,000 population (5 year average)
Crime - City-data.com crime index (5 year average)
Crime - Violent crime index (5 year average)
Crime - Property crime index (5 year average)
1996 Presidential Elections Results (%) - Democratic Party (Clinton)
1996 Presidential Elections Results (%) - Republican Party (Dole)
1996 Presidential Elections Results (%) - Other
2000 Presidential Elections Results (%) - Democratic Party (Gore)
2000 Presidential Elections Results (%) - Republican Party (Bush)
2000 Presidential Elections Results (%) - Other
2004 Presidential Elections Results (%) - Democratic Party (Kerry)
2004 Presidential Elections Results (%) - Republican Party (Bush)
2004 Presidential Elections Results (%) - Other
2008 Presidential Elections Results (%) - Democratic Party (Obama)
2008 Presidential Elections Results (%) - Republican Party (McCain)
2008 Presidential Elections Results (%) - Other
2012 Presidential Elections Results (%) - Democratic Party (Obama)
2012 Presidential Elections Results (%) - Republican Party (Romney)
2012 Presidential Elections Results (%) - Other
2016 Presidential Elections Results (%) - Democratic Party (Clinton)
2016 Presidential Elections Results (%) - Republican Party (Trump)
2016 Presidential Elections Results (%) - Other
2020 Presidential Elections Results (%) - Democratic Party (Biden)
2020 Presidential Elections Results (%) - Republican Party (Trump)
2020 Presidential Elections Results (%) - Other
Ancestries Reported - Arab (%)
Ancestries Reported - Czech (%)
Ancestries Reported - Danish (%)
Ancestries Reported - Dutch (%)
Ancestries Reported - English (%)
Ancestries Reported - French (%)
Ancestries Reported - French Canadian (%)
Ancestries Reported - German (%)
Ancestries Reported - Greek (%)
Ancestries Reported - Hungarian (%)
Ancestries Reported - Irish (%)
Ancestries Reported - Italian (%)
Ancestries Reported - Lithuanian (%)
Ancestries Reported - Norwegian (%)
Ancestries Reported - Polish (%)
Ancestries Reported - Portuguese (%)
Ancestries Reported - Russian (%)
Ancestries Reported - Scotch-Irish (%)
Ancestries Reported - Scottish (%)
Ancestries Reported - Slovak (%)
Ancestries Reported - Subsaharan African (%)
Ancestries Reported - Swedish (%)
Ancestries Reported - Swiss (%)
Ancestries Reported - Ukrainian (%)
Ancestries Reported - United States (%)
Ancestries Reported - Welsh (%)
Ancestries Reported - West Indian (%)
Ancestries Reported - Other (%)
Educational Attainment - No schooling completed (%)
Educational Attainment - Less than high school (%)
Educational Attainment - High school or equivalent (%)
Educational Attainment - Less than 1 year of college (%)
Educational Attainment - 1 or more years of college (%)
Educational Attainment - Associate degree (%)
Educational Attainment - Bachelor's degree (%)
Educational Attainment - Master's degree (%)
Educational Attainment - Professional school degree (%)
Educational Attainment - Doctorate degree (%)
School Enrollment - Nursery, preschool (%)
School Enrollment - Kindergarten (%)
School Enrollment - Grade 1 to 4 (%)
School Enrollment - Grade 5 to 8 (%)
School Enrollment - Grade 9 to 12 (%)
School Enrollment - College undergrad (%)
School Enrollment - Graduate or professional (%)
School Enrollment - Not enrolled in school (%)
School enrollment - Public schools (%)
School enrollment - Private schools (%)
School enrollment - Not enrolled (%)
Median number of rooms in houses and condos
Median number of rooms in apartments
Housing units lacking complete plumbing facilities (%)
Housing units lacking complete kitchen facilities (%)
Density of houses
Urban houses (%)
Rural houses (%)
Households with people 60 years and over (%)
Households with people 65 years and over (%)
Households with people 75 years and over (%)
Households with one or more nonrelatives (%)
Households with no nonrelatives (%)
Population in households (%)
Family households (%)
Nonfamily households (%)
Population in families (%)
Family households with own children (%)
Median number of bedrooms in owner occupied houses
Mean number of bedrooms in owner occupied houses
Median number of bedrooms in renter occupied houses
Mean number of bedrooms in renter occupied houses
Median number of vehichles in owner occupied houses
Mean number of vehichles in owner occupied houses
Median number of vehichles in renter occupied houses
Mean number of vehichles in renter occupied houses
Mortgage status - with mortgage (%)
Mortgage status - with second mortgage (%)
Mortgage status - with home equity loan (%)
Mortgage status - with both second mortgage and home equity loan (%)
Mortgage status - without a mortgage (%)
Average family size
Average family size - White
Average family size - Black or African American
Average family size - Asian
Average family size - Hispanic or Latino
Average family size - American Indian and Alaska Native
Average family size - Multirace
Average family size - Other Race
Geographical mobility - Same house 1 year ago (%)
Geographical mobility - Moved within same county (%)
Geographical mobility - Moved from different county within same state (%)
Geographical mobility - Moved from different state (%)
Geographical mobility - Moved from abroad (%)
Place of birth - Born in state of residence (%)
Place of birth - Born in other state (%)
Place of birth - Native, outside of US (%)
Place of birth - Foreign born (%)
Housing units in structures - 1, detached (%)
Housing units in structures - 1, attached (%)
Housing units in structures - 2 (%)
Housing units in structures - 3 or 4 (%)
Housing units in structures - 5 to 9 (%)
Housing units in structures - 10 to 19 (%)
Housing units in structures - 20 to 49 (%)
Housing units in structures - 50 or more (%)
Housing units in structures - Mobile home (%)
Housing units in structures - Boat, RV, van, etc. (%)
House/condo owner moved in on average (years ago)
Renter moved in on average (years ago)
Year householder moved into unit - Moved in 1999 to March 2000 (%)
Year householder moved into unit - Moved in 1995 to 1998 (%)
Year householder moved into unit - Moved in 1990 to 1994 (%)
Year householder moved into unit - Moved in 1980 to 1989 (%)
Year householder moved into unit - Moved in 1970 to 1979 (%)
Year householder moved into unit - Moved in 1969 or earlier (%)
Means of transportation to work - Drove car alone (%)
Means of transportation to work - Carpooled (%)
Means of transportation to work - Public transportation (%)
Means of transportation to work - Bus or trolley bus (%)
Means of transportation to work - Streetcar or trolley car (%)
Means of transportation to work - Subway or elevated (%)
Means of transportation to work - Railroad (%)
Means of transportation to work - Ferryboat (%)
Means of transportation to work - Taxicab (%)
Means of transportation to work - Motorcycle (%)
Means of transportation to work - Bicycle (%)
Means of transportation to work - Walked (%)
Means of transportation to work - Other means (%)
Working at home (%)
Industry diversity
Most Common Industries - Agriculture, forestry, fishing and hunting, and mining (%)
Most Common Industries - Agriculture, forestry, fishing and hunting (%)
Most Common Industries - Mining, quarrying, and oil and gas extraction (%)
Most Common Industries - Construction (%)
Most Common Industries - Manufacturing (%)
Most Common Industries - Wholesale trade (%)
Most Common Industries - Retail trade (%)
Most Common Industries - Transportation and warehousing, and utilities (%)
Most Common Industries - Transportation and warehousing (%)
Most Common Industries - Utilities (%)
Most Common Industries - Information (%)
Most Common Industries - Finance and insurance, and real estate and rental and leasing (%)
Most Common Industries - Finance and insurance (%)
Most Common Industries - Real estate and rental and leasing (%)
Most Common Industries - Professional, scientific, and management, and administrative and waste management services (%)
Most Common Industries - Professional, scientific, and technical services (%)
Most Common Industries - Management of companies and enterprises (%)
Most Common Industries - Administrative and support and waste management services (%)
Most Common Industries - Educational services, and health care and social assistance (%)
Most Common Industries - Educational services (%)
Most Common Industries - Health care and social assistance (%)
Most Common Industries - Arts, entertainment, and recreation, and accommodation and food services (%)
Most Common Industries - Arts, entertainment, and recreation (%)
Most Common Industries - Accommodation and food services (%)
Most Common Industries - Other services, except public administration (%)
Most Common Industries - Public administration (%)
Occupation diversity
Most Common Occupations - Management, business, science, and arts occupations (%)
Most Common Occupations - Management, business, and financial occupations (%)
Most Common Occupations - Management occupations (%)
Most Common Occupations - Business and financial operations occupations (%)
Most Common Occupations - Computer, engineering, and science occupations (%)
Most Common Occupations - Computer and mathematical occupations (%)
Most Common Occupations - Architecture and engineering occupations (%)
Most Common Occupations - Life, physical, and social science occupations (%)
Most Common Occupations - Education, legal, community service, arts, and media occupations (%)
Most Common Occupations - Community and social service occupations (%)
Most Common Occupations - Legal occupations (%)
Most Common Occupations - Education, training, and library occupations (%)
Most Common Occupations - Arts, design, entertainment, sports, and media occupations (%)
Most Common Occupations - Healthcare practitioners and technical occupations (%)
Most Common Occupations - Health diagnosing and treating practitioners and other technical occupations (%)
Most Common Occupations - Health technologists and technicians (%)
Most Common Occupations - Service occupations (%)
Most Common Occupations - Healthcare support occupations (%)
Most Common Occupations - Protective service occupations (%)
Most Common Occupations - Fire fighting and prevention, and other protective service workers including supervisors (%)
Most Common Occupations - Law enforcement workers including supervisors (%)
Most Common Occupations - Food preparation and serving related occupations (%)
Most Common Occupations - Building and grounds cleaning and maintenance occupations (%)
Most Common Occupations - Personal care and service occupations (%)
Most Common Occupations - Sales and office occupations (%)
Most Common Occupations - Sales and related occupations (%)
Most Common Occupations - Office and administrative support occupations (%)
Most Common Occupations - Natural resources, construction, and maintenance occupations (%)
Most Common Occupations - Farming, fishing, and forestry occupations (%)
Most Common Occupations - Construction and extraction occupations (%)
Most Common Occupations - Installation, maintenance, and repair occupations (%)
Most Common Occupations - Production, transportation, and material moving occupations (%)
Most Common Occupations - Production occupations (%)
Most Common Occupations - Transportation occupations (%)
Most Common Occupations - Material moving occupations (%)
People in Group quarters - Institutionalized population (%)
People in Group quarters - Correctional institutions (%)
People in Group quarters - Federal prisons and detention centers (%)
People in Group quarters - Halfway houses (%)
People in Group quarters - Local jails and other confinement facilities (including police lockups) (%)
People in Group quarters - Military disciplinary barracks (%)
People in Group quarters - State prisons (%)
People in Group quarters - Other types of correctional institutions (%)
People in Group quarters - Nursing homes (%)
People in Group quarters - Hospitals/wards, hospices, and schools for the handicapped (%)
People in Group quarters - Hospitals/wards and hospices for chronically ill (%)
People in Group quarters - Hospices or homes for chronically ill (%)
People in Group quarters - Military hospitals or wards for chronically ill (%)
People in Group quarters - Other hospitals or wards for chronically ill (%)
People in Group quarters - Hospitals or wards for drug/alcohol abuse (%)
People in Group quarters - Mental (Psychiatric) hospitals or wards (%)
People in Group quarters - Schools, hospitals, or wards for the mentally retarded (%)
People in Group quarters - Schools, hospitals, or wards for the physically handicapped (%)
People in Group quarters - Institutions for the deaf (%)
People in Group quarters - Institutions for the blind (%)
People in Group quarters - Orthopedic wards and institutions for the physically handicapped (%)
People in Group quarters - Wards in general hospitals for patients who have no usual home elsewhere (%)
People in Group quarters - Wards in military hospitals for patients who have no usual home elsewhere (%)
People in Group quarters - Juvenile institutions (%)
People in Group quarters - Long-term care (%)
People in Group quarters - Homes for abused, dependent, and neglected children (%)
People in Group quarters - Residential treatment centers for emotionally disturbed children (%)
People in Group quarters - Training schools for juvenile delinquents (%)
People in Group quarters - Short-term care, detention or diagnostic centers for delinquent children (%)
People in Group quarters - Type of juvenile institution unknown (%)
People in Group quarters - Noninstitutionalized population (%)
People in Group quarters - College dormitories (includes college quarters off campus) (%)
People in Group quarters - Military quarters (%)
People in Group quarters - On base (%)
People in Group quarters - Barracks, unaccompanied personnel housing (UPH), (Enlisted/Officer), ;and similar group living quarters for military personnel (%)
People in Group quarters - Transient quarters for temporary residents (%)
People in Group quarters - Military ships (%)
People in Group quarters - Group homes (%)
People in Group quarters - Homes or halfway houses for drug/alcohol abuse (%)
People in Group quarters - Homes for the mentally ill (%)
People in Group quarters - Homes for the mentally retarded (%)
People in Group quarters - Homes for the physically handicapped (%)
People in Group quarters - Other group homes (%)
People in Group quarters - Religious group quarters (%)
People in Group quarters - Dormitories (%)
People in Group quarters - Agriculture workers' dormitories on farms (%)
People in Group quarters - Job Corps and vocational training facilities (%)
People in Group quarters - Other workers' dormitories (%)
People in Group quarters - Crews of maritime vessels (%)
People in Group quarters - Other nonhousehold living situations (%)
People in Group quarters - Other noninstitutional group quarters (%)
Residents speaking English at home (%)
Residents speaking English at home - Born in the United States (%)
Residents speaking English at home - Native, born elsewhere (%)
Residents speaking English at home - Foreign born (%)
Residents speaking Spanish at home (%)
Residents speaking Spanish at home - Born in the United States (%)
Residents speaking Spanish at home - Native, born elsewhere (%)
Residents speaking Spanish at home - Foreign born (%)
Residents speaking other language at home (%)
Residents speaking other language at home - Born in the United States (%)
Residents speaking other language at home - Native, born elsewhere (%)
Residents speaking other language at home - Foreign born (%)
Class of Workers - Employee of private company (%)
Class of Workers - Self-employed in own incorporated business (%)
Class of Workers - Private not-for-profit wage and salary workers (%)
Class of Workers - Local government workers (%)
Class of Workers - State government workers (%)
Class of Workers - Federal government workers (%)
Class of Workers - Self-employed workers in own not incorporated business and Unpaid family workers (%)
House heating fuel used in houses and condos - Utility gas (%)
House heating fuel used in houses and condos - Bottled, tank, or LP gas (%)
House heating fuel used in houses and condos - Electricity (%)
House heating fuel used in houses and condos - Fuel oil, kerosene, etc. (%)
House heating fuel used in houses and condos - Coal or coke (%)
House heating fuel used in houses and condos - Wood (%)
House heating fuel used in houses and condos - Solar energy (%)
House heating fuel used in houses and condos - Other fuel (%)
House heating fuel used in houses and condos - No fuel used (%)
House heating fuel used in apartments - Utility gas (%)
House heating fuel used in apartments - Bottled, tank, or LP gas (%)
House heating fuel used in apartments - Electricity (%)
House heating fuel used in apartments - Fuel oil, kerosene, etc. (%)
House heating fuel used in apartments - Coal or coke (%)
House heating fuel used in apartments - Wood (%)
House heating fuel used in apartments - Solar energy (%)
House heating fuel used in apartments - Other fuel (%)
House heating fuel used in apartments - No fuel used (%)
Armed forces status - In Armed Forces (%)
Armed forces status - Civilian (%)
Armed forces status - Civilian - Veteran (%)
Armed forces status - Civilian - Nonveteran (%)
Fatal accidents locations in years 2005-2021
Fatal accidents locations in 2005
Fatal accidents locations in 2006
Fatal accidents locations in 2007
Fatal accidents locations in 2008
Fatal accidents locations in 2009
Fatal accidents locations in 2010
Fatal accidents locations in 2011
Fatal accidents locations in 2012
Fatal accidents locations in 2013
Fatal accidents locations in 2014
Fatal accidents locations in 2015
Fatal accidents locations in 2016
Fatal accidents locations in 2017
Fatal accidents locations in 2018
Fatal accidents locations in 2019
Fatal accidents locations in 2020
Fatal accidents locations in 2021
Alcohol use - People drinking some alcohol every month (%)
Alcohol use - People not drinking at all (%)
Alcohol use - Average days/month drinking alcohol
Alcohol use - Average drinks/week
Alcohol use - Average days/year people drink much
Audiometry - Average condition of hearing (%)
Audiometry - People that can hear a whisper from across a quiet room (%)
Audiometry - People that can hear normal voice from across a quiet room (%)
Audiometry - Ears ringing, roaring, buzzing (%)
Audiometry - Had a job exposure to loud noise (%)
Audiometry - Had off-work exposure to loud noise (%)
Blood Pressure & Cholesterol - Has high blood pressure (%)
Blood Pressure & Cholesterol - Checking blood pressure at home (%)
Blood Pressure & Cholesterol - Frequently checking blood cholesterol (%)
Blood Pressure & Cholesterol - Has high cholesterol level (%)
Consumer Behavior - Money monthly spent on food at supermarket/grocery store
Consumer Behavior - Money monthly spent on food at other stores
Consumer Behavior - Money monthly spent on eating out
Consumer Behavior - Money monthly spent on carryout/delivered foods
Consumer Behavior - Income spent on food at supermarket/grocery store (%)
Consumer Behavior - Income spent on food at other stores (%)
Consumer Behavior - Income spent on eating out (%)
Consumer Behavior - Income spent on carryout/delivered foods (%)
Current Health Status - General health condition (%)
Current Health Status - Blood donors (%)
Current Health Status - Has blood ever tested for HIV virus (%)
Current Health Status - Left-handed people (%)
Dermatology - People using sunscreen (%)
Diabetes - Diabetics (%)
Diabetes - Had a blood test for high blood sugar (%)
Diabetes - People taking insulin (%)
Diet Behavior & Nutrition - Diet health (%)
Diet Behavior & Nutrition - Milk product consumption (# of products/month)
Diet Behavior & Nutrition - Meals not home prepared (#/week)
Diet Behavior & Nutrition - Meals from fast food or pizza place (#/week)
Diet Behavior & Nutrition - Ready-to-eat foods (#/month)
Diet Behavior & Nutrition - Frozen meals/pizza (#/month)
Drug Use - People that ever used marijuana or hashish (%)
Drug Use - Ever used hard drugs (%)
Drug Use - Ever used any form of cocaine (%)
Drug Use - Ever used heroin (%)
Drug Use - Ever used methamphetamine (%)
Health Insurance - People covered by health insurance (%)
Kidney Conditions-Urology - Avg. # of times urinating at night
Medical Conditions - People with asthma (%)
Medical Conditions - People with anemia (%)
Medical Conditions - People with psoriasis (%)
Medical Conditions - People with overweight (%)
Medical Conditions - Elderly people having difficulties in thinking or remembering (%)
Medical Conditions - People who ever received blood transfusion (%)
Medical Conditions - People having trouble seeing even with glass/contacts (%)
Medical Conditions - People with arthritis (%)
Medical Conditions - People with gout (%)
Medical Conditions - People with congestive heart failure (%)
Medical Conditions - People with coronary heart disease (%)
Medical Conditions - People with angina pectoris (%)
Medical Conditions - People who ever had heart attack (%)
Medical Conditions - People who ever had stroke (%)
Medical Conditions - People with emphysema (%)
Medical Conditions - People with thyroid problem (%)
Medical Conditions - People with chronic bronchitis (%)
Medical Conditions - People with any liver condition (%)
Medical Conditions - People who ever had cancer or malignancy (%)
Mental Health - People who have little interest in doing things (%)
Mental Health - People feeling down, depressed, or hopeless (%)
Mental Health - People who have trouble sleeping or sleeping too much (%)
Mental Health - People feeling tired or having little energy (%)
Mental Health - People with poor appetite or overeating (%)
Mental Health - People feeling bad about themself (%)
Mental Health - People who have trouble concentrating on things (%)
Mental Health - People moving or speaking slowly or too fast (%)
Mental Health - People having thoughts they would be better off dead (%)
Oral Health - Average years since last visit a dentist
Oral Health - People embarrassed because of mouth (%)
Oral Health - People with gum disease (%)
Oral Health - General health of teeth and gums (%)
Oral Health - Average days a week using dental floss/device
Oral Health - Average days a week using mouthwash for dental problem
Oral Health - Average number of teeth
Pesticide Use - Households using pesticides to control insects (%)
Pesticide Use - Households using pesticides to kill weeds (%)
Physical Activity - People doing vigorous-intensity work activities (%)
Physical Activity - People doing moderate-intensity work activities (%)
Physical Activity - People walking or bicycling (%)
Physical Activity - People doing vigorous-intensity recreational activities (%)
Physical Activity - People doing moderate-intensity recreational activities (%)
Physical Activity - Average hours a day doing sedentary activities
Physical Activity - Average hours a day watching TV or videos
Physical Activity - Average hours a day using computer
Physical Functioning - People having limitations keeping them from working (%)
Physical Functioning - People limited in amount of work they can do (%)
Physical Functioning - People that need special equipment to walk (%)
Physical Functioning - People experiencing confusion/memory problems (%)
Physical Functioning - People requiring special healthcare equipment (%)
Prescription Medications - Average number of prescription medicines taking
Preventive Aspirin Use - Adults 40+ taking low-dose aspirin (%)
Reproductive Health - Vaginal deliveries (%)
Reproductive Health - Cesarean deliveries (%)
Reproductive Health - Deliveries resulted in a live birth (%)
Reproductive Health - Pregnancies resulted in a delivery (%)
Reproductive Health - Women breastfeeding newborns (%)
Reproductive Health - Women that had a hysterectomy (%)
Reproductive Health - Women that had both ovaries removed (%)
Reproductive Health - Women that have ever taken birth control pills (%)
Reproductive Health - Women taking birth control pills (%)
Reproductive Health - Women that have ever used Depo-Provera or injectables (%)
Reproductive Health - Women that have ever used female hormones (%)
Sexual Behavior - People 18+ that ever had sex (vaginal, anal, or oral) (%)
Sexual Behavior - Males 18+ that ever had vaginal sex with a woman (%)
Sexual Behavior - Males 18+ that ever performed oral sex on a woman (%)
Sexual Behavior - Males 18+ that ever had anal sex with a woman (%)
Sexual Behavior - Males 18+ that ever had any sex with a man (%)
Sexual Behavior - Females 18+ that ever had vaginal sex with a man (%)
Sexual Behavior - Females 18+ that ever performed oral sex on a man (%)
Sexual Behavior - Females 18+ that ever had anal sex with a man (%)
Sexual Behavior - Females 18+ that ever had any kind of sex with a woman (%)
Sexual Behavior - Average age people first had sex
Sexual Behavior - Average number of female sex partners in lifetime (males 18+)
Sexual Behavior - Average number of female vaginal sex partners in lifetime (males 18+)
Sexual Behavior - Average age people first performed oral sex on a woman (18+)
Sexual Behavior - Average number of woman performed oral sex on in lifetime (18+)
Sexual Behavior - Average number of male sex partners in lifetime (males 18+)
Sexual Behavior - Average number of male anal sex partners in lifetime (males 18+)
Sexual Behavior - Average age people first performed oral sex on a man (18+)
Sexual Behavior - Average number of male oral sex partners in lifetime (18+)
Sexual Behavior - People using protection when performing oral sex (%)
Sexual Behavior - Average number of times people have vaginal or anal sex a year
Sexual Behavior - People having sex without condom (%)
Sexual Behavior - Average number of male sex partners in lifetime (females 18+)
Sexual Behavior - Average number of male vaginal sex partners in lifetime (females 18+)
Sexual Behavior - Average number of female sex partners in lifetime (females 18+)
Sexual Behavior - Circumcised males 18+ (%)
Sleep Disorders - Average hours sleeping at night
Sleep Disorders - People that has trouble sleeping (%)
Smoking-Cigarette Use - People smoking cigarettes (%)
Taste & Smell - People 40+ having problems with smell (%)
Taste & Smell - People 40+ having problems with taste (%)
Taste & Smell - People 40+ that ever had wisdom teeth removed (%)
Taste & Smell - People 40+ that ever had tonsils teeth removed (%)
Taste & Smell - People 40+ that ever had a loss of consciousness because of a head injury (%)
Taste & Smell - People 40+ that ever had a broken nose or other serious injury to face or skull (%)
Taste & Smell - People 40+ that ever had two or more sinus infections (%)
Weight - Average height (inches)
Weight - Average weight (pounds)
Weight - Average BMI
Weight - People that are obese (%)
Weight - People that ever were obese (%)
Weight - People trying to lose weight (%)
100%
urban population.
Estimated median house/condo value in 2022: $710,973
98178:
$710,973Washington:
$569,500
Median resident age: This zip code:
40.2 yearsWashington median age:
38.4 years
Average household size: This zip code:
2.7 peopleWashington:
2.5 people
Averages for the 2020 tax year for zip code 98178, filed in 2021:
Average Adjusted Gross Income (AGI) in 2020: $72,707 (Individual Income Tax Returns) Here:
$72,707State:
$99,264
Salary/wage: $64,848 (reported on 83.9% of returns )Here:
$64,848State:
$80,347
(% of AGI for various income ranges: 1051.2% for AGIs below $25k , 3495.8% for AGIs $25k-50k , 6589.0% for AGIs $50k-75k , 9744.0% for AGIs $75k-100k , 19986.8% for AGIs $100k-200k , 75265.5% for AGIs over 200k ) Taxable interest for individuals: $988 (reported on 29.1% of returns )This zip code:
$988Washington:
$2,077
(% of AGI for various income ranges: 15.2% for AGIs below $25k , 12.6% for AGIs $25k-50k , 23.2% for AGIs $50k-75k , 50.4% for AGIs $75k-100k , 94.7% for AGIs $100k-200k , 515.9% for AGIs over 200k ) Ordinary dividends: $4,183 (reported on 17.8% of returns )(% of AGI for various income ranges: 17.5% for AGIs below $25k , 19.8% for AGIs $25k-50k , 55.0% for AGIs $50k-75k , 96.2% for AGIs $75k-100k , 286.9% for AGIs $100k-200k , 1726.4% for AGIs over 200k ) Net capital gain/loss in AGI: +$14,803 (reported on 17.3% of returns )Here:
+$14,803State:
+$40,092
(% of AGI for various income ranges: 8.3% for AGIs below $25k , 29.2% for AGIs $25k-50k , 65.7% for AGIs $50k-75k , 117.0% for AGIs $75k-100k , 584.5% for AGIs $100k-200k , 11064.1% for AGIs over 200k ) Profit/loss from business: +$12,604 (reported on 15.1% of returns )Here:
+$12,604State:
+$18,312
(% of AGI for various income ranges: 143.1% for AGIs below $25k , 145.5% for AGIs $25k-50k , 180.1% for AGIs $50k-75k , 274.9% for AGIs $75k-100k , 524.2% for AGIs $100k-200k , 2792.3% for AGIs over 200k ) Taxable individual retirement arrangement distribution: $19,100 (reported on 6.2% of returns )98178:
$19,100Washington:
$24,221
(% of AGI for various income ranges: 30.8% for AGIs below $25k , 46.0% for AGIs $25k-50k , 112.6% for AGIs $50k-75k , 246.7% for AGIs $75k-100k , 443.2% for AGIs $100k-200k , 1924.5% for AGIs over 200k ) Self-employed (Keogh) retirement plans: $13,017 (reported on 0.4% of returns )98178:
$13,017Washington:
$24,166
(% of AGI for various income ranges: 30.7% for AGIs $75k-100k , 214.1% for AGIs over 200k ) Total itemized deductions: $29,414 (reported on 13.5% of returns )Here:
$29,414State:
$39,068
(% of AGI for various income ranges: 72.4% for AGIs below $25k , 158.6% for AGIs $25k-50k , 419.7% for AGIs $50k-75k , 736.0% for AGIs $75k-100k , 1565.5% for AGIs $100k-200k , 6589.5% for AGIs over 200k ) Charity contributions: $5,737 (reported on 10.2% of returns )(% of AGI for various income ranges: 5.3% for AGIs below $25k , 13.3% for AGIs $25k-50k , 52.0% for AGIs $50k-75k , 101.0% for AGIs $75k-100k , 254.0% for AGIs $100k-200k , 1160.0% for AGIs over 200k ) Taxes paid: $7,743 (reported on 13.5% of returns )(% of AGI for various income ranges: 16.4% for AGIs below $25k , 45.7% for AGIs $25k-50k , 120.2% for AGIs $50k-75k , 211.6% for AGIs $75k-100k , 417.6% for AGIs $100k-200k , 1530.0% for AGIs over 200k ) Earned income credit: $2,107 (reported on 13.0% of returns )(% of AGI for various income ranges: 89.1% for AGIs below $25k , 51.9% for AGIs $25k-50k , 1.0% for AGIs $50k-75k ) Percentage of individuals using paid preparers for their 2020 taxes: 92.1%(% for various income ranges: 91.5% for AGIs below $25k , 92.0% for AGIs $25k-50k , 92.1% for AGIs $50k-75k , 92.6% for AGIs $75k-100k , 92.6% for AGIs $100k-200k , 93.2% for AGIs over 200k )
Averages for the 2012 tax year for zip code 98178, filed in 2013:
Average Adjusted Gross Income (AGI) in 2012: $49,967 (Individual Income Tax Returns) Here:
$49,967State:
$69,533
Salary/wage: $45,902 (reported on 84.7% of returns )Here:
$45,902State:
$57,267
(% of AGI for various income ranges: 76.0% for AGIs below $25k , 82.8% for AGIs $25k-50k , 80.3% for AGIs $50k-75k , 79.6% for AGIs $75k-100k , 78.7% for AGIs $100k-200k , 60.5% for AGIs over 200k ) Taxable interest for individuals: $914 (reported on 32.9% of returns )This zip code:
$914Washington:
$1,816
(% of AGI for various income ranges: 0.7% for AGIs below $25k , 0.5% for AGIs $25k-50k , 0.7% for AGIs $50k-75k , 0.6% for AGIs $75k-100k , 0.6% for AGIs $100k-200k , 0.6% for AGIs over 200k ) Ordinary dividends: $3,900 (reported on 16.5% of returns )(% of AGI for various income ranges: 2.1% for AGIs below $25k , 0.9% for AGIs $25k-50k , 1.1% for AGIs $50k-75k , 1.1% for AGIs $75k-100k , 1.1% for AGIs $100k-200k , 2.5% for AGIs over 200k ) Net capital gain/loss in AGI: +$6,431 (reported on 12.0% of returns )Here:
+$6,431State:
+$21,568
(% of AGI for various income ranges: 0.3% for AGIs $25k-50k , 0.5% for AGIs $50k-75k , 0.5% for AGIs $75k-100k , 1.5% for AGIs $100k-200k , 9.1% for AGIs over 200k ) Profit/loss from business: +$13,810 (reported on 12.8% of returns )Here:
+$13,810State:
+$16,521
(% of AGI for various income ranges: 9.5% for AGIs below $25k , 3.1% for AGIs $25k-50k , 2.2% for AGIs $50k-75k , 2.1% for AGIs $75k-100k , 2.9% for AGIs $100k-200k , 4.9% for AGIs over 200k ) Taxable individual retirement arrangement distribution: $14,360 (reported on 8.0% of returns )98178:
$14,360Washington:
$18,648
(% of AGI for various income ranges: 1.9% for AGIs below $25k , 1.5% for AGIs $25k-50k , 2.3% for AGIs $50k-75k , 2.4% for AGIs $75k-100k , 2.5% for AGIs $100k-200k , 3.3% for AGIs over 200k ) Self-employment retirement plans: $13,100 (reported on 0.3% of returns )98178:
$13,100Washington:
$20,087
Total itemized deductions: $20,219 (24% of AGI, reported on 30.9% of returns )Here:
$20,219State:
$23,872
Here:
23.7% of AGIState:
18.2% of AGI
(% of AGI for various income ranges: 10.2% for AGIs below $25k , 10.2% for AGIs $25k-50k , 14.4% for AGIs $50k-75k , 14.6% for AGIs $75k-100k , 14.0% for AGIs $100k-200k , 9.0% for AGIs over 200k ) Charity contributions: $2,897 (reported on 24.3% of returns )(% of AGI for various income ranges: 0.6% for AGIs below $25k , 0.9% for AGIs $25k-50k , 1.5% for AGIs $50k-75k , 1.6% for AGIs $75k-100k , 1.9% for AGIs $100k-200k , 1.4% for AGIs over 200k ) Taxes paid: $5,390 (reported on 30.6% of returns )(% of AGI for various income ranges: 2.3% for AGIs below $25k , 2.6% for AGIs $25k-50k , 3.8% for AGIs $50k-75k , 3.7% for AGIs $75k-100k , 3.8% for AGIs $100k-200k , 2.9% for AGIs over 200k ) Earned income credit: $2,256 (reported on 20.9% of returns )(% of AGI for various income ranges: 7.7% for AGIs below $25k , 1.1% for AGIs $25k-50k ) Percentage of individuals using paid preparers for their 2012 taxes: 46.8%(% for various income ranges: 43.4% for AGIs below $25k , 46.0% for AGIs $25k-50k , 49.2% for AGIs $50k-75k , 50.9% for AGIs $75k-100k , 51.3% for AGIs $100k-200k , 66.7% for AGIs over 200k )
Averages for the 2004 tax year for zip code 98178, filed in 2005:
Average Adjusted Gross Income (AGI) in 2004: $42,821 (Individual Income Tax Returns) Here:
$42,821State:
$54,331
Salary/wage: $39,386 (reported on 84.1% of returns )Here:
$39,386State:
$45,761
(% of AGI for various income ranges: 123.4% for AGIs below $10k , 74.7% for AGIs $10k-25k , 83.5% for AGIs $25k-50k , 81.0% for AGIs $50k-75k , 81.5% for AGIs $75k-100k , 63.2% for AGIs over 100k ) Taxable interest for individuals: $1,655 (reported on 44.2% of returns )This zip code:
$1,655Washington:
$2,110
(% of AGI for various income ranges: 5.1% for AGIs below $10k , 2.3% for AGIs $10k-25k , 1.4% for AGIs $25k-50k , 1.2% for AGIs $50k-75k , 1.3% for AGIs $75k-100k , 2.5% for AGIs over 100k ) Taxable dividends: $3,517 (reported on 23.4% of returns )(% of AGI for various income ranges: 4.2% for AGIs below $10k , 1.5% for AGIs $10k-25k , 1.1% for AGIs $25k-50k , 1.4% for AGIs $50k-75k , 1.6% for AGIs $75k-100k , 3.5% for AGIs over 100k ) Net capital gain/loss: +$7,584 (reported on 17.9% of returns )Here:
+$7,584State:
+$15,835
(% of AGI for various income ranges: -1.8% for AGIs below $10k , 0.3% for AGIs $10k-25k , 0.2% for AGIs $25k-50k , 1.0% for AGIs $50k-75k , 1.7% for AGIs $75k-100k , 10.7% for AGIs over 100k ) Profit/loss from business: +$8,864 (reported on 12.6% of returns )Here:
+$8,864State:
+$13,994
(% of AGI for various income ranges: 3.1% for AGIs below $10k , 5.3% for AGIs $10k-25k , 2.0% for AGIs $25k-50k , 1.7% for AGIs $50k-75k , 1.5% for AGIs $75k-100k , 3.8% for AGIs over 100k ) IRA payment deduction: $2,558 (reported on 2.0% of returns )98178:
$2,558Washington:
$3,001
(% of AGI for various income ranges: 0.1% for AGIs $10k-25k , 0.2% for AGIs $25k-50k , 0.1% for AGIs $50k-75k , 0.1% for AGIs $75k-100k , 0.1% for AGIs over 100k ) Self-employed pension: $14,023 (reported on 0.4% of returns )Here:
$14,023Washington:
$14,244
Total itemized deductions: $17,761 (27% of AGI, reported on 37.2% of returns )Here:
$17,761State:
$19,669
Here:
26.9% of AGIState:
20.7% of AGI
(% of AGI for various income ranges: 23.0% for AGIs below $10k , 12.9% for AGIs $10k-25k , 14.6% for AGIs $25k-50k , 18.7% for AGIs $50k-75k , 16.7% for AGIs $75k-100k , 12.8% for AGIs over 100k ) Charity contributions deductions: $2,431 (4% of AGI, reported on 32.1% of returns )Here:
3.5% of AGIState:
3.5% of AGI
(% of AGI for various income ranges: 0.8% for AGIs below $10k , 1.0% for AGIs $10k-25k , 1.4% for AGIs $25k-50k , 2.1% for AGIs $50k-75k , 2.2% for AGIs $75k-100k , 2.0% for AGIs over 100k ) Total tax: $5,592 (reported on 77.3% of returns )(% of AGI for various income ranges: 4.1% for AGIs below $10k , 4.1% for AGIs $10k-25k , 6.9% for AGIs $25k-50k , 9.1% for AGIs $50k-75k , 10.8% for AGIs $75k-100k , 16.6% for AGIs over 100k ) Earned income credit: $1,615 (reported on 15.4% of returns )Percentage of individuals using paid preparers for their 2004 taxes: 55.6%(% for various income ranges: 47.2% for AGIs below $10k , 60.0% for AGIs $10k-25k , 56.4% for AGIs $25k-50k , 55.2% for AGIs $50k-75k , 54.1% for AGIs $75k-100k , 60.2% for AGIs over 100k )
Estimated median household income in 2022: This zip code:
$97,927Washington:
$91,306
Nearest zip codes: 98057 ,
98118 ,
98056 ,
98168 ,
98188 ,
98055 .
Tukwila Zip Code Map
Percentage of family households: This zip code:
41.9%Washington:
45.0%
Percentage of households with unmarried partners: This zip code:
7.5%Washington:
48.7%
Likely homosexual households (counted as self-reported same-sex unmarried-partner households)
Lesbian couples: 0.2% of all households Gay men: 0.4% of all households
Household received Food Stamps/SNAP in the past 12 months: 1,537Household did not receive Food Stamps/SNAP in the past 12 months: 8,316
Women who had a birth in the past 12 months: 343 (289 now married , 56 unmarried) Women who did not have a birth in the past 12 months: 5,891 (3,047 now married , 2,831 unmarried)
Housing units in zip code 98178 with a mortgage: 4,691 (692
second mortgage , 108
home equity loan , 573
both second mortgage and home equity loan )
Median monthly owner costs for units with a mortgage: $2,585
Median monthly owner costs for units without a mortgage: $868
Residents with income below the poverty level in 2022:
This zip code:
10.4%Whole state:
10.0%
Residents with income below 50% of the poverty level in 2022:
This zip code:
4.1%Whole state:
4.6%
Median number of rooms in houses and condos: Median number of rooms in apartments: Notable locations in this zip code not listed on our city pages
Click to draw/clear zip code borders Notable locations in zip code 98178: (A) , Bryn Mawr Greenwood Greenhouses (B) , King County Fire Protection District 20 Station 22 (C) , King County Fire Protection District 20 Station 21 (D) . Display/hide their locations on the map
Shopping Center: (1) . Display/hide its location on the map
Churches in zip code 98178 include: (A) , Pentecostal Covenant Church (B) , Ryan Way Kingdom Hall of Jehovahs Witnesses (C) , Skyway Church of God (D) , Skyway United Methodist Church (E) , Tabernacle of Praise (F) , Bryn Mawr United Methodist Church (G) , The Church of Jesus Christ of Latter Day Saints (H) , Amazing Grace Lutheran Church (I) . Display/hide their locations on the map
Parks in zip code 98178 include: (1) , Lakeridge Park (2) . Display/hide their locations on the map
Tourist attractions (not listed on the city page) :
Year house built (houses)
0 2020 or later766 2010 to 20191,104 2000 to 2009817 1990 to 1999914 1980 to 1989549 1970 to 19791,056 1960 to 19691,897 1950 to 19592,052 1940 to 1949889 1939 or earlier
Zip code 98178 household income distribution in 2022 335 Less than $10,000248 $10,000 to $14,999375 $15,000 to $19,999189 $20,000 to $24,999314 $25,000 to $29,999230 $30,000 to $34,999171 $35,000 to $39,999191 $40,000 to $44,999251 $45,000 to $49,999621 $50,000 to $59,999800 $60,000 to $74,9991,177 $75,000 to $99,9991,048 $100,000 to $124,999720 $125,000 to $149,9991,254 $150,000 to $199,9991,878 $200,000 or moreEstimate of home value of owner-occupied houses/condos in 2022 in zip code 98178 16 Less than $10,00020 $10,000 to $14,99916 $20,000 to $24,99936 $25,000 to $29,99916 $30,000 to $34,9996 $40,000 to $49,99923 $50,000 to $59,99922 $60,000 to $69,99936 $70,000 to $79,99975 $150,000 to $174,99917 $200,000 to $249,999260 $250,000 to $299,999405 $300,000 to $399,999954 $400,000 to $499,9993,330 $500,000 to $749,9991,232 $750,000 to $999,999626 $1,000,000 to $1,499,999110 $1,500,000 to $1,999,99927 $2,000,000 or moreRent paid by renters in 2022 in zip code 98178 17 $150 to $19970 $200 to $24915 $300 to $34911 $350 to $39910 $400 to $44960 $550 to $59928 $600 to $64929 $700 to $74915 $750 to $79928 $800 to $89988 $900 to $999533 $1,000 to $1,249423 $1,250 to $1,499962 $1,500 to $1,999396 $2,000 to $2,499108 $2,500 to $2,999149 $3,000 to $3,499107 $3,500 or more132 No cash rent
Median gross rent in 2022: $1,743.
Estimated median house (or condo) value in 2022 for: White Non-Hispanic householders: $715,509Black or African American householders: $729,118American Indian or Alaska Native householders: $546,426Asian householders: $767,058Native Hawaiian and other Pacific Islander householders: $601,275Some other race householders: $618,595Two or more races householders: $555,911Hispanic or Latino householders: $611,585Estimated median house or condo value in 2022: $710,973
98178:
$710,973Washington:
$569,500
Lower value quartile - upper value quartile: $523,661 - $858,262
Mean price in 2022: Detached houses: $707,723Here:
$707,723State:
$734,307
Townhouses or other attached units: $686,026Here:
$686,026State:
$657,697
In 2-unit structures: $538,552Here:
$538,552State:
$534,634
In 5-or-more-unit structures: $381,881Here:
$381,881State:
$503,183
Mobile homes: $272,253Here:
$272,253State:
$218,362
Housing units in structures:
One, detached: 7,526One, attached: 212Two: 1693 or 4: 1355 to 9: 32110 to 19: 93220 to 49: 25150 or more: 665Mobile homes: 88Unemployment : 5.8%
Means of transportation to work in zip code 98178 62.6% 8,571 Drove a car alone10.6% 1,448 Carpooled4.9% 672 Bus or trolley bus0.1% 20 Streetcar or trolley car2.7% 370 Railroad0.3% 39 Bicycle0.3% 39 Walked0.0% 3 Other means17.1% 2,343 Worked at homeTravel time to work (commute) in zip code 98178 45 Less than 5 minutes294 5 to 9 minutes536 10 to 14 minutes1,348 15 to 19 minutes1,833 20 to 24 minutes1,070 25 to 29 minutes2,210 30 to 34 minutes405 35 to 39 minutes614 40 to 44 minutes1,574 45 to 59 minutes1,017 60 to 89 minutes265 90 or more minutes
Neighborhoods in zip code 98178: Percentage of zip code residents living and working in this county: 97.4%
Household type by relationship:
Households: 27,098
Male householders: 4,935 (1,232 living alone ), Female householders: 4,912 (1,429 living alone )4,474 spouses (4,372 opposite-sex spouses ), 504 unmarried partners , (485 opposite-sex unmarried partners ), 7,460 children (7,037 natural , 313 adopted , 100 stepchildren ), 677 grandchildren , 443 brothers or sisters , 1,157 parents , 0 foster children , 583 other relatives , 1,741 non-relatives In group quarters: 174 (-1 institutionalized population )
Size of family households: 2,226 2-persons , 1,625 3-persons , 1,112 4-persons , 615 5-persons , 397 6-persons , 316 7-or-more-persons
Size of nonfamily households: 2,661 1-person , 687 2-persons , 115 3-persons , 50 4-persons , 30 5-persons
3,802 married couples with children. single-parent households (295 men , 736 women ).
62.7% of residents of 98178 zip code speak English at home. of residents speak Spanish at home (36% very well, 28% well, 35% not well, 1% not at all ).of residents speak other Indo-European language at home (91% very well, 9% well, 1% not well ).of residents speak Asian or Pacific Island language at home (43% very well, 29% well, 23% not well, 5% not at all ).of residents speak other language at home (75% very well, 11% well, 10% not well, 4% not at all ).
Foreign born population: 8,526 (31.5%)
(65.7%
of them are naturalized citizens )
This zip code:
31.5%Whole state:
15.3%
24% Thailand 14% Malaysia 8% Kenya 7% Eritrea 6% Honduras 4% Bhutan 2% Burma (Myanmar) 9% Somali 5% English 4% Ethiopian 2% American 2% German 2% Irish 2% European
Year of entry for the foreign-born population
2,973 2010 or later 1,973 2000 to 2009 1,672 1990 to 1999 2,498 Before 1990
There are
21 Medical Specialists in Zip Code 98178 .
Facilities with environmental interests located in this zip code:
BURLINGTON NORTHERN SANTA FE RR S SEATTL (12400 51ST PL S in SEATTLE, WA)
National Pollutant Discharge Elimination System NON-MAJOR (Tracking pollutant discharge elimination systems) - permit Large Quantity Generators, more that 1000 kg of hazardous waste/month (Resource Conservation and Recovery Act (tracking hazardous waste)) STATE MASTER (Washington State Department of Ecology's Facility/Site identification system) - HAZWASTE-WAD980983571, HAZARDOUS WASTE PROGRAM, WATQUAL-SO3005562, NPDES STORMWATER PERMIT Business SIC classification: DAIRY FARMS; RAILROADS, LINE-HAUL OPERATING; RAILROAD SWITCHING AND TERMINAL ESTABLISHMENTS; FIXED FACILITIES AND INSPECTION AND WEIGHING SERVICES FOR MOTOR VEHICLE TRANSPORTATION; NONCLASSIFIABLE ESTABLISHMENTSOrganizations: PACIFIC RAIL SERVICES (CONTACT/OWNER)
Alternative names: PACIFIC RAIL SERVICES, PACIFIC RAIL SERV+BNSF SO SEAT, Unitrans Inc
BUILDING BUSTERS INC (13001 MARTIN LUTHER KING JR WAY in SEATTLE, WA)
National Pollutant Discharge Elimination System NON-MAJOR (Tracking pollutant discharge elimination systems) - permit STATE MASTER (Washington State Department of Ecology's Facility/Site identification system) - TOXICS-, VOLUNTARY CLEAN UP PROGRAM, WATQUAL-SO3002153, NPDES STORMWATER PERMIT Business SIC classification: MOTOR VEHICLE PARTS, USEDOrganizations: WASHINGTON WRECKING (CONTACT/OPERATOR)
BP SERVICE STATION 03140 (12911 MARTIN LUTHER KING JR WAY in SEATTLE, WA)
Conditionally Exempt Small Quantity Generators, less than 100 kg/month of hazardous waste (Resource Conservation and Recovery Act (tracking hazardous waste)) STATE MASTER (Washington State Department of Ecology's Facility/Site identification system) - HAZWASTE-WA0000127001, HAZARDOUS WASTE PROGRAM, EPCRA Business SIC classification: GASOLINE SERVICE STATIONSOrganizations: OSAMA HAMDAN (CONTACT/OPERATOR)
, CONOCOPHILLIPS COMPANY (CONTACT/OWNER)
BP SERVICE STATION 03161 (11655 RENTON AVENUE in SEATTLE, WA)
Conditionally Exempt Small Quantity Generators, less than 100 kg/month of hazardous waste (Resource Conservation and Recovery Act (tracking hazardous waste)) STATE MASTER (Washington State Department of Ecology's Facility/Site identification system) - TOXICS-9521, LEAKING STORAGE TANK, TOXICS-, UNDERGROUND STORAGE TANK PROGRAM, HAZWASTE-WAD988466215, EPCRA, HAZARDOUS WASTE PROGRAM Business SIC classification: GASOLINE SERVICE STATIONS; AUTOMOTIVE SERVICES, EXCEPT REPAIR AND CARWASHESOrganizations: FAUZI BUTALEP (CONTACT/OPERATOR)
, CONOCOPHILLIPS COMPANY (CONTACT/OWNER)
Alternative names: TOSCO 0316130119
BRYN MAWR ELEMENTARY SCHOOL (8212 S 118TH ST in SEATTLE, WA)
(Geographic Names Information System) (National Center for Education Statistics) - STATE ID-2439 Organizations: RENTON SCH DIST 403 (SCHOOL DISTRICT)
BLACK RIVER HIGH SCHOOL (7800 S 132ND ST in SEATTLE, WA)
(National Center for Education Statistics) - STATE ID-2212 Organizations: RENTON SCH DIST 403 (SCHOOL DISTRICT)
Housing units lacking complete plumbing facilities: 1.6%
Housing units lacking complete kitchen facilities: 1.3%
50.7% Electricity 37.3% Utility gas 9.3% Fuel oil, kerosene, etc. 1.2% Bottled, tank, or LP gas 0.7% Wood 0.6% No fuel used
Population in 1990: 19,522. Population change in the 1990s: +2,338 (+12.0%).
Place of birth for U.S.-born residents:
This state: 11,077Northeast: 641Midwest: 1,332South: 2,467West: 2,524
56% of the 98178 zip code residents lived in the same house 5 years ago.
Out of people who lived in different houses, 76% lived in this county.
Out of people who lived in different counties, 50% lived in Washington.
91% of the 98178 zip code residents lived in the same house 1 year ago.
Out of people who lived in different houses, 70% moved from this county.
Out of people who lived in different houses, 9% moved from different county within same state.
Out of people who lived in different houses, 13% moved from different state.
Out of people who lived in different houses, 9% moved from abroad.
Private vs. public school enrollment:
Students in private schools in grades 1 to 8 (elementary and middle school): 220
Here:
9.0%Washington:
12.4%
Students in private schools in grades 9 to 12 (high school): 212
Here:
19.7%Washington:
9.2%
Students in private undergraduate colleges: 147
Here:
12.3%Washington:
16.5%
Occupation by median earnings in the past 12 months ($)
161,054 Legal occupations 132,716 Architecture and engineering occupations 116,083 Computer and mathematical occupations 92,697 Health diagnosing and treating practitioners and other technical occupations 88,465 Management occupations 74,091 Business and financial operations occupations
Companies with federal contracts located in this zip code:
JEAN MARIE CLEMMONS (10835 FOREST AVENUE SOUTH in SEATTLE, WA; small business) in 2 contracts from 2000 to 2001
$45,185 with U.S. Army Corps of Engineers - civil program financing only for Library Services. Signed on 2000-05-16. Completion date: 2002-05-31.
, same as above. Signed on 2001-09-28. Completion date: 2002-05-31.
Top industries in this zip code by the number of employees in 2005:
Arts, Entertainment, and Recreation: Bowling Centers (100-249 employees: 1 establishment)Health Care and Social Assistance: Homes for the Elderly (50-99: 1, 1-4: 7)Accommodation and Food Services: Full-Service Restaurants (50-99: 1, 5-9: 1, 1-4: 3)Health Care and Social Assistance: Child Day Care Services (20-49: 1, 10-19: 1, 1-4: 7)Wholesale Trade: Plumbing and Heating Equipment and Supplies (Hydronics) Merchant Wholesalers (10-19: 2, 5-9: 2, 1-4: 7)Educational Services: Elementary and Secondary Schools (20-49: 1, 10-19: 1)
People in group quarters in 2010:
99 people in group homes intended for adults
32 people in other noninstitutional facilities
13 people in workers' group living quarters and job corps centers
5 people in emergency and transitional shelters (with sleeping facilities) for people experiencing homelessness
4 people in nursing facilities/skilled-nursing facilities
People in group quarters in 2000:
29 people in other group homes
6 people in homes or halfway houses for drug/alcohol abuse
Fatal accident statistics in 2013:
Fatal accident count: 1Vehicles involved in fatal accidents: 1Fatal accidents caused by drunken drivers: 0Fatalities: 1Persons involved in fatal accidents: 1Pedestrians involved in fatal accidents: 1
Fatal accident statistics in 2010:
Fatal accident count: 1Vehicles involved in fatal accidents: 1Fatal accidents caused by drunken drivers: 0Fatalities: 1Persons involved in fatal accidents: 1Pedestrians involved in fatal accidents: 1
Home Mortgage Disclosure Act Aggregated Statistics For Year 2009(Based on 3 full and 6 partial tracts) A) FHA, FSA/RHS & VA B) Conventional C) Refinancings D) Home Improvement Loans E) Loans on Dwellings For 5+ Families F) Non-occupant Loans on Number Average Value Number Average Value Number Average Value Number Average Value Number Average Value Number Average Value
LOANS ORIGINATED 164 $243,831 162 $212,243 777 $238,376 33 $80,412 0 $0 63 $200,837 APPLICATIONS APPROVED, NOT ACCEPTED 10 $265,608 21 $227,149 115 $253,421 5 $69,916 0 $0 8 $236,599 APPLICATIONS DENIED 23 $296,866 47 $214,962 364 $263,964 18 $131,116 2 $945,655 35 $228,766 APPLICATIONS WITHDRAWN 29 $280,820 25 $227,587 199 $263,428 15 $122,230 0 $0 19 $286,906 FILES CLOSED FOR INCOMPLETENESS 5 $293,966 7 $303,851 48 $271,385 2 $182,110 0 $0 4 $337,382
Aggregated Statistics For Year 2008(Based on 3 full and 6 partial tracts) A) FHA, FSA/RHS & VA B) Conventional C) Refinancings D) Home Improvement Loans E) Loans on Dwellings For 5+ Families F) Non-occupant Loans on Number Average Value Number Average Value Number Average Value Number Average Value Number Average Value Number Average Value
LOANS ORIGINATED 63 $279,144 291 $265,678 592 $251,158 55 $123,137 0 $0 103 $258,247 APPLICATIONS APPROVED, NOT ACCEPTED 8 $257,351 58 $256,339 134 $229,511 12 $146,916 0 $0 24 $231,386 APPLICATIONS DENIED 21 $310,294 109 $333,298 503 $272,151 102 $114,919 1 $503,950 31 $254,044 APPLICATIONS WITHDRAWN 21 $270,551 43 $268,519 234 $268,232 28 $207,018 1 $548,000 35 $249,768 FILES CLOSED FOR INCOMPLETENESS 0 $0 11 $278,902 64 $286,422 4 $36,645 0 $0 13 $311,738
Aggregated Statistics For Year 2007(Based on 3 full and 6 partial tracts) A) FHA, FSA/RHS & VA B) Conventional C) Refinancings D) Home Improvement Loans E) Loans on Dwellings For 5+ Families F) Non-occupant Loans on G) Loans On Manufactured Number Average Value Number Average Value Number Average Value Number Average Value Number Average Value Number Average Value Number Average Value
LOANS ORIGINATED 16 $307,044 638 $257,129 1,010 $251,979 112 $130,507 6 $1,293,200 174 $228,987 5 $185,658 APPLICATIONS APPROVED, NOT ACCEPTED 1 $351,850 131 $239,278 256 $239,210 30 $185,344 0 $0 34 $256,588 1 $84,210 APPLICATIONS DENIED 3 $250,903 215 $260,027 673 $264,507 171 $144,058 0 $0 93 $272,085 3 $265,267 APPLICATIONS WITHDRAWN 5 $274,934 84 $277,059 281 $248,522 33 $185,512 0 $0 32 $213,043 0 $0 FILES CLOSED FOR INCOMPLETENESS 0 $0 27 $274,202 115 $255,441 11 $259,812 0 $0 17 $266,786 0 $0
Aggregated Statistics For Year 2006(Based on 3 full and 6 partial tracts) A) FHA, FSA/RHS & VA B) Conventional C) Refinancings D) Home Improvement Loans E) Loans on Dwellings For 5+ Families F) Non-occupant Loans on G) Loans On Manufactured Number Average Value Number Average Value Number Average Value Number Average Value Number Average Value Number Average Value Number Average Value
LOANS ORIGINATED 6 $281,613 995 $204,713 1,076 $221,473 124 $125,307 5 $6,151,452 229 $209,735 7 $135,854 APPLICATIONS APPROVED, NOT ACCEPTED 1 $231,480 164 $219,516 248 $218,854 39 $175,913 1 $1,157,400 63 $198,010 1 $263,370 APPLICATIONS DENIED 3 $334,163 415 $201,710 838 $239,619 104 $164,776 0 $0 119 $258,470 9 $656,851 APPLICATIONS WITHDRAWN 2 $243,445 177 $204,943 450 $231,299 26 $180,870 0 $0 59 $203,848 2 $158,095 FILES CLOSED FOR INCOMPLETENESS 1 $287,040 46 $192,286 136 $243,435 15 $153,863 0 $0 11 $188,796 0 $0
Aggregated Statistics For Year 2005(Based on 3 full and 6 partial tracts) A) FHA, FSA/RHS & VA B) Conventional C) Refinancings D) Home Improvement Loans E) Loans on Dwellings For 5+ Families F) Non-occupant Loans on G) Loans On Manufactured Number Average Value Number Average Value Number Average Value Number Average Value Number Average Value Number Average Value Number Average Value
LOANS ORIGINATED 18 $202,824 1,166 $170,371 1,200 $195,805 136 $108,283 2 $6,540,595 267 $181,286 2 $183,750 APPLICATIONS APPROVED, NOT ACCEPTED 4 $209,538 230 $160,677 204 $191,538 24 $114,443 0 $0 48 $204,384 6 $40,415 APPLICATIONS DENIED 6 $151,128 351 $175,120 798 $206,566 84 $112,077 0 $0 100 $187,440 8 $154,826 APPLICATIONS WITHDRAWN 8 $235,209 191 $189,911 530 $212,906 28 $198,459 1 $921,800 50 $185,937 3 $212,797 FILES CLOSED FOR INCOMPLETENESS 2 $130,935 49 $146,835 130 $221,220 8 $99,940 0 $0 8 $181,899 2 $186,815
Aggregated Statistics For Year 2004(Based on 3 full and 6 partial tracts) A) FHA, FSA/RHS & VA B) Conventional C) Refinancings D) Home Improvement Loans E) Loans on Dwellings For 5+ Families F) Non-occupant Loans on G) Loans On Manufactured Number Average Value Number Average Value Number Average Value Number Average Value Number Average Value Number Average Value Number Average Value
LOANS ORIGINATED 23 $201,285 854 $165,675 1,316 $174,546 118 $72,351 1 $814,810 195 $157,203 9 $88,790 APPLICATIONS APPROVED, NOT ACCEPTED 2 $167,565 162 $159,825 310 $174,874 29 $103,058 0 $0 49 $149,582 0 $0 APPLICATIONS DENIED 4 $180,275 232 $174,855 811 $179,931 103 $86,150 0 $0 81 $172,032 11 $106,746 APPLICATIONS WITHDRAWN 3 $181,117 121 $157,211 514 $181,920 18 $106,420 0 $0 49 $160,264 0 $0 FILES CLOSED FOR INCOMPLETENESS 0 $0 36 $155,378 130 $205,745 8 $103,884 0 $0 11 $162,983 3 $194,250
Aggregated Statistics For Year 2003(Based on 3 full and 6 partial tracts) A) FHA, FSA/RHS & VA B) Conventional C) Refinancings D) Home Improvement Loans E) Loans on Dwellings For 5+ Families F) Non-occupant Loans on Number Average Value Number Average Value Number Average Value Number Average Value Number Average Value Number Average Value
LOANS ORIGINATED 68 $190,636 645 $171,588 2,388 $158,536 97 $41,390 8 $419,388 271 $138,406 APPLICATIONS APPROVED, NOT ACCEPTED 2 $201,525 114 $185,640 380 $169,366 37 $35,675 1 $900,000 40 $161,366 APPLICATIONS DENIED 8 $192,495 181 $160,143 832 $174,528 102 $39,650 0 $0 77 $152,825 APPLICATIONS WITHDRAWN 6 $176,318 76 $185,696 496 $176,227 12 $91,656 0 $0 39 $154,194 FILES CLOSED FOR INCOMPLETENESS 2 $219,600 26 $120,687 100 $176,746 12 $28,012 0 $0 10 $151,550
Aggregated Statistics For Year 2002(Based on 3 full and 6 partial tracts) A) FHA, FSA/RHS & VA B) Conventional C) Refinancings D) Home Improvement Loans E) Loans on Dwellings For 5+ Families F) Non-occupant Loans on Number Average Value Number Average Value Number Average Value Number Average Value Number Average Value Number Average Value
LOANS ORIGINATED 64 $181,248 462 $159,871 1,776 $155,894 85 $35,598 4 $250,590 211 $123,017 APPLICATIONS APPROVED, NOT ACCEPTED 6 $166,573 79 $171,087 297 $169,999 33 $20,386 0 $0 31 $141,156 APPLICATIONS DENIED 5 $193,212 86 $162,824 602 $159,911 67 $20,571 0 $0 49 $140,524 APPLICATIONS WITHDRAWN 12 $162,704 57 $165,571 387 $163,518 23 $18,547 0 $0 47 $134,571 FILES CLOSED FOR INCOMPLETENESS 6 $153,508 14 $189,558 182 $179,633 4 $14,210 0 $0 7 $93,751
Aggregated Statistics For Year 2001(Based on 3 full and 6 partial tracts) A) FHA, FSA/RHS & VA B) Conventional C) Refinancings D) Home Improvement Loans E) Loans on Dwellings For 5+ Families F) Non-occupant Loans on Number Average Value Number Average Value Number Average Value Number Average Value Number Average Value Number Average Value
LOANS ORIGINATED 77 $155,482 474 $161,120 1,437 $149,336 106 $33,037 2 $637,225 117 $130,376 APPLICATIONS APPROVED, NOT ACCEPTED 6 $177,138 72 $156,688 232 $160,303 16 $15,564 0 $0 14 $144,481 APPLICATIONS DENIED 5 $179,978 129 $139,410 541 $154,009 96 $22,537 0 $0 35 $127,550 APPLICATIONS WITHDRAWN 12 $169,992 62 $131,953 338 $159,284 29 $27,686 0 $0 19 $143,803 FILES CLOSED FOR INCOMPLETENESS 3 $156,053 19 $145,208 103 $159,275 10 $21,283 1 $1,646,080 8 $128,860
Aggregated Statistics For Year 2000(Based on 3 full and 6 partial tracts) A) FHA, FSA/RHS & VA B) Conventional C) Refinancings D) Home Improvement Loans E) Loans on Dwellings For 5+ Families F) Non-occupant Loans on Number Average Value Number Average Value Number Average Value Number Average Value Number Average Value Number Average Value
LOANS ORIGINATED 116 $149,445 546 $139,325 476 $125,222 175 $28,570 3 $1,078,423 95 $107,384 APPLICATIONS APPROVED, NOT ACCEPTED 4 $138,558 82 $136,941 121 $125,643 48 $34,671 0 $0 9 $98,728 APPLICATIONS DENIED 10 $129,006 147 $144,365 387 $126,857 120 $29,926 1 $134,210 41 $104,776 APPLICATIONS WITHDRAWN 11 $165,901 88 $139,428 181 $135,845 22 $66,470 0 $0 22 $113,725 FILES CLOSED FOR INCOMPLETENESS 2 $105,720 18 $142,021 78 $157,142 6 $27,222 0 $0 10 $141,043
Aggregated Statistics For Year 1999(Based on 2 full and 3 partial tracts) A) FHA, FSA/RHS & VA B) Conventional C) Refinancings D) Home Improvement Loans E) Loans on Dwellings For 5+ Families F) Non-occupant Loans on Number Average Value Number Average Value Number Average Value Number Average Value Number Average Value Number Average Value
LOANS ORIGINATED 75 $138,627 303 $131,266 477 $122,160 95 $28,280 4 $1,079,728 69 $102,135 APPLICATIONS APPROVED, NOT ACCEPTED 2 $106,100 39 $121,369 98 $119,120 27 $18,693 2 $1,913,650 8 $145,560 APPLICATIONS DENIED 8 $163,681 89 $122,255 235 $127,135 67 $24,304 0 $0 25 $132,467 APPLICATIONS WITHDRAWN 6 $125,813 50 $136,888 152 $123,495 9 $53,423 0 $0 7 $132,524 FILES CLOSED FOR INCOMPLETENESS 2 $130,060 14 $168,320 64 $135,604 0 $0 0 $0 6 $112,813
Private Mortgage Insurance Companies Aggregated Statistics For Year 2009(Based on 3 full and 6 partial tracts) A) Conventional B) Refinancings C) Non-occupant Loans on Number Average Value Number Average Value Number Average Value
LOANS ORIGINATED 28 $268,046 17 $256,291 0 $0 APPLICATIONS APPROVED, NOT ACCEPTED 21 $240,070 5 $341,182 3 $206,080 APPLICATIONS DENIED 6 $233,270 6 $222,875 0 $0 APPLICATIONS WITHDRAWN 4 $267,438 3 $259,973 0 $0 FILES CLOSED FOR INCOMPLETENESS 1 $306,000 0 $0 1 $306,000
Aggregated Statistics For Year 2008(Based on 3 full and 6 partial tracts) A) Conventional B) Refinancings C) Non-occupant Loans on Number Average Value Number Average Value Number Average Value
LOANS ORIGINATED 109 $278,169 43 $308,101 7 $243,031 APPLICATIONS APPROVED, NOT ACCEPTED 38 $316,117 24 $334,250 1 $450,000 APPLICATIONS DENIED 15 $264,944 8 $260,302 5 $254,546 APPLICATIONS WITHDRAWN 10 $269,486 4 $294,258 1 $350,000 FILES CLOSED FOR INCOMPLETENESS 5 $341,398 0 $0 2 $291,570
Aggregated Statistics For Year 2007(Based on 3 full and 6 partial tracts) A) Conventional B) Refinancings C) Non-occupant Loans on Number Average Value Number Average Value Number Average Value
LOANS ORIGINATED 101 $312,522 53 $304,527 8 $269,920 APPLICATIONS APPROVED, NOT ACCEPTED 7 $242,826 12 $293,253 0 $0 APPLICATIONS DENIED 2 $365,495 0 $0 0 $0 APPLICATIONS WITHDRAWN 5 $262,838 7 $259,136 2 $233,745 FILES CLOSED FOR INCOMPLETENESS 9 $420,494 1 $594,740 0 $0
Aggregated Statistics For Year 2006(Based on 3 full and 6 partial tracts) A) Conventional B) Refinancings C) Non-occupant Loans on Number Average Value Number Average Value Number Average Value
LOANS ORIGINATED 48 $278,313 31 $280,473 1 $360,080 APPLICATIONS APPROVED, NOT ACCEPTED 11 $261,555 13 $306,289 1 $350,000 APPLICATIONS DENIED 0 $0 2 $436,745 1 $410,530 APPLICATIONS WITHDRAWN 2 $378,110 1 $394,740 0 $0 FILES CLOSED FOR INCOMPLETENESS 0 $0 0 $0 0 $0
Aggregated Statistics For Year 2005(Based on 3 full and 6 partial tracts) A) Conventional B) Refinancings C) Non-occupant Loans on Number Average Value Number Average Value Number Average Value
LOANS ORIGINATED 78 $224,238 41 $240,379 16 $220,146 APPLICATIONS APPROVED, NOT ACCEPTED 8 $194,339 11 $225,566 3 $286,370 APPLICATIONS DENIED 0 $0 1 $343,420 0 $0 APPLICATIONS WITHDRAWN 3 $208,503 3 $277,873 1 $224,280 FILES CLOSED FOR INCOMPLETENESS 0 $0 0 $0 0 $0
Aggregated Statistics For Year 2004(Based on 3 full and 6 partial tracts) A) Conventional B) Refinancings C) Non-occupant Loans on Number Average Value Number Average Value Number Average Value
LOANS ORIGINATED 79 $214,770 55 $224,541 10 $191,806 APPLICATIONS APPROVED, NOT ACCEPTED 7 $235,009 19 $215,239 2 $243,970 APPLICATIONS DENIED 1 $150,200 1 $464,480 0 $0 APPLICATIONS WITHDRAWN 2 $229,740 4 $253,805 0 $0 FILES CLOSED FOR INCOMPLETENESS 1 $198,000 2 $275,500 0 $0
Aggregated Statistics For Year 2003(Based on 3 full and 6 partial tracts) A) Conventional B) Refinancings C) Non-occupant Loans on Number Average Value Number Average Value Number Average Value
LOANS ORIGINATED 144 $197,028 126 $188,173 15 $143,979 APPLICATIONS APPROVED, NOT ACCEPTED 26 $183,726 32 $187,764 4 $165,882 APPLICATIONS DENIED 1 $61,730 12 $204,412 3 $141,017 APPLICATIONS WITHDRAWN 4 $203,010 15 $198,491 1 $61,730 FILES CLOSED FOR INCOMPLETENESS 0 $0 0 $0 0 $0
Aggregated Statistics For Year 2002(Based on 3 full and 6 partial tracts) A) Conventional B) Refinancings C) Non-occupant Loans on Number Average Value Number Average Value Number Average Value
LOANS ORIGINATED 129 $194,455 111 $196,254 12 $157,558 APPLICATIONS APPROVED, NOT ACCEPTED 19 $183,551 43 $202,354 0 $0 APPLICATIONS DENIED 7 $181,493 9 $218,917 3 $156,303 APPLICATIONS WITHDRAWN 3 $251,160 4 $235,180 1 $282,920 FILES CLOSED FOR INCOMPLETENESS 0 $0 0 $0 0 $0
Aggregated Statistics For Year 2001(Based on 3 full and 6 partial tracts) A) Conventional B) Refinancings C) Non-occupant Loans on Number Average Value Number Average Value Number Average Value
LOANS ORIGINATED 137 $182,387 128 $180,160 3 $150,977 APPLICATIONS APPROVED, NOT ACCEPTED 24 $206,562 22 $179,927 5 $146,484 APPLICATIONS DENIED 8 $184,009 18 $187,397 0 $0 APPLICATIONS WITHDRAWN 11 $139,637 4 $159,062 1 $110,000 FILES CLOSED FOR INCOMPLETENESS 0 $0 0 $0 0 $0
Aggregated Statistics For Year 2000(Based on 3 full and 6 partial tracts) A) Conventional B) Refinancings C) Non-occupant Loans on Number Average Value Number Average Value Number Average Value
LOANS ORIGINATED 133 $165,041 69 $157,680 10 $148,760 APPLICATIONS APPROVED, NOT ACCEPTED 28 $172,733 10 $169,765 6 $148,462 APPLICATIONS DENIED 6 $168,588 2 $149,175 0 $0 APPLICATIONS WITHDRAWN 2 $185,525 0 $0 0 $0 FILES CLOSED FOR INCOMPLETENESS 1 $197,370 0 $0 0 $0
Aggregated Statistics For Year 1999(Based on 2 full and 3 partial tracts) A) Conventional B) Refinancings C) Non-occupant Loans on Number Average Value Number Average Value Number Average Value
LOANS ORIGINATED 109 $157,663 36 $150,806 5 $132,192 APPLICATIONS APPROVED, NOT ACCEPTED 10 $147,127 14 $134,014 0 $0 APPLICATIONS DENIED 4 $161,930 1 $173,200 1 $150,310 APPLICATIONS WITHDRAWN 2 $186,155 1 $117,430 0 $0 FILES CLOSED FOR INCOMPLETENESS 1 $243,940 0 $0 0 $0
2002 - 2018 National Fire Incident Reporting System (NFIRS) incidents See full 2006 National Fire Incident Reporting System statistics for zip code 98178, Washington
Most common first names in zip code 98178 among deceased individuals Name Count Lived (average)
John 129 73.8 years Robert 111 70.1 years William 95 73.8 years Mary 91 78.8 years James 81 71.8 years Charles 63 72.9 years George 62 74.8 years Margaret 58 79.3 years Dorothy 47 78.9 years Joseph 44 73.6 years
Most common last names in zip code 98178 among deceased individuals Last name Count Lived (average)
Johnson 49 78.4 years Anderson 47 77.1 years Smith 39 71.7 years Nelson 31 73.2 years Williams 27 73.4 years Moore 26 76.1 years Miller 22 75.2 years Martin 21 79.2 years Olson 20 77.9 years Wilson 19 74.8 years
Businesses in zip code 98178

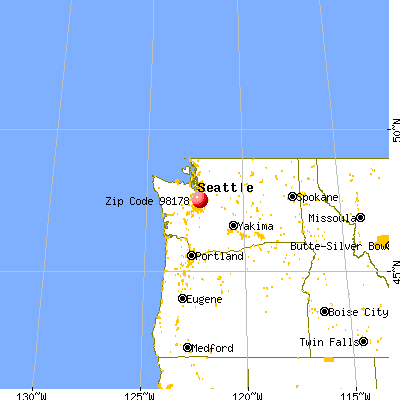


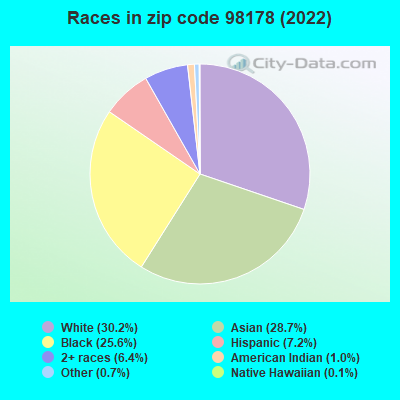


 Nearest zip codes: 98057, 98118, 98056, 98168, 98188, 98055.
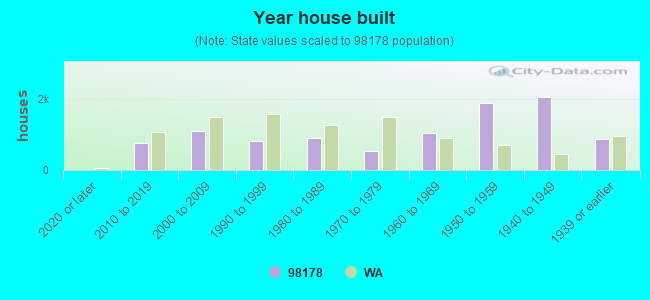

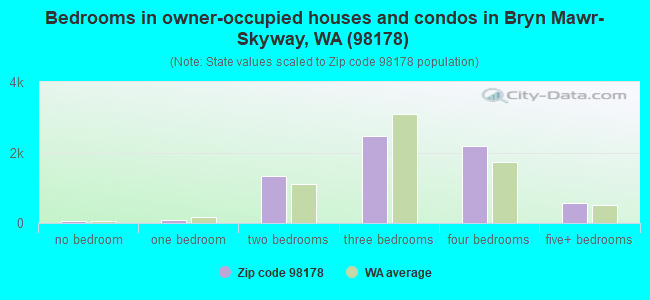

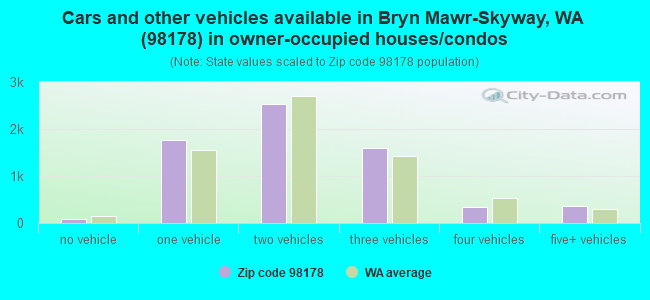
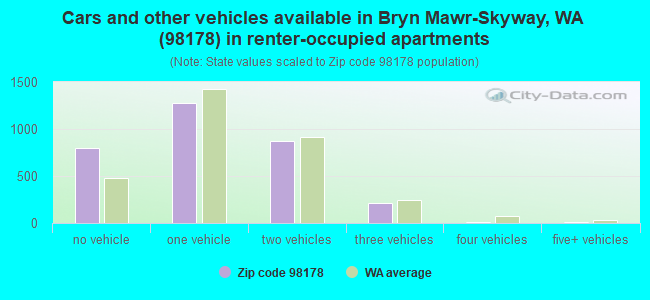


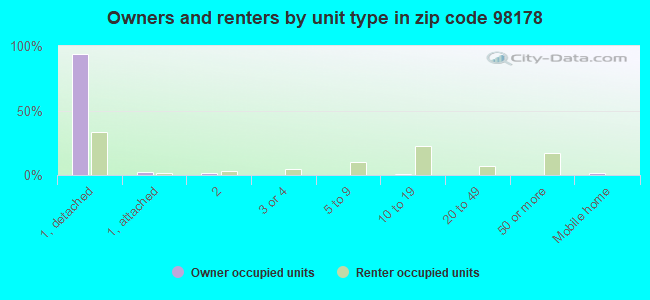
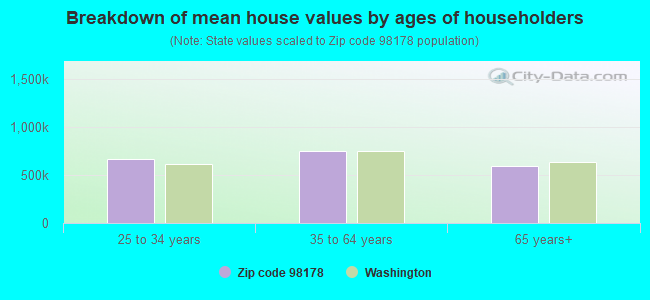


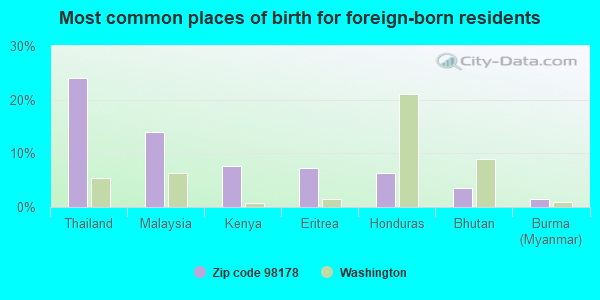
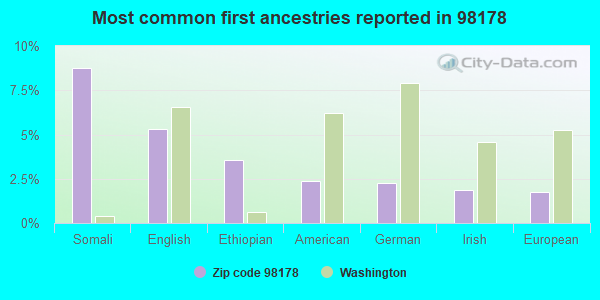
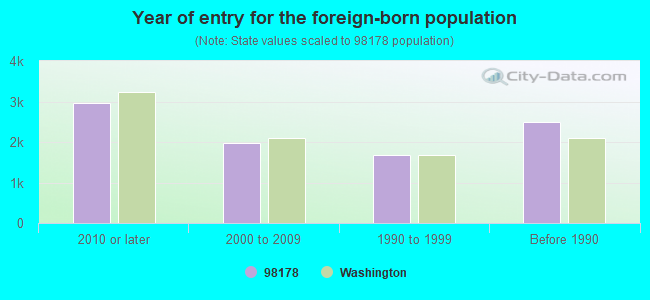


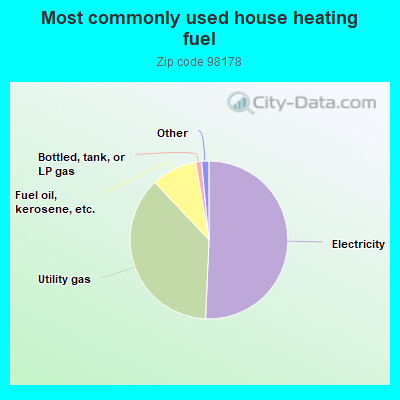
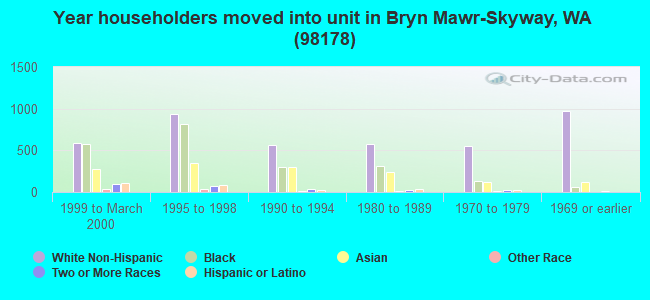
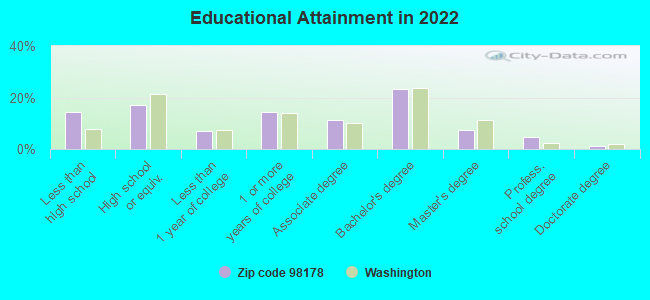
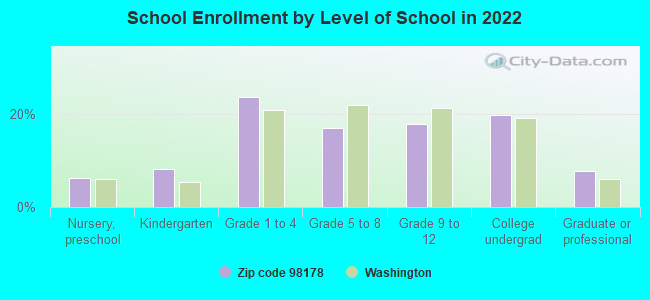

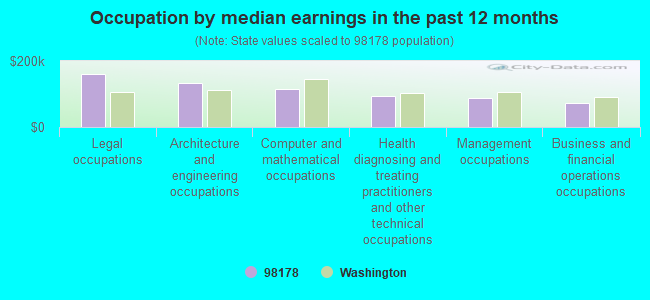
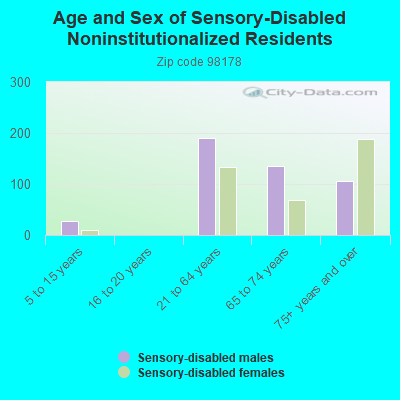
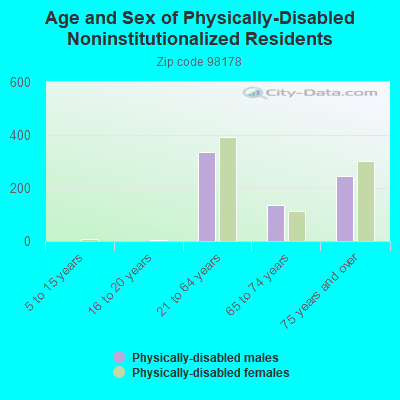
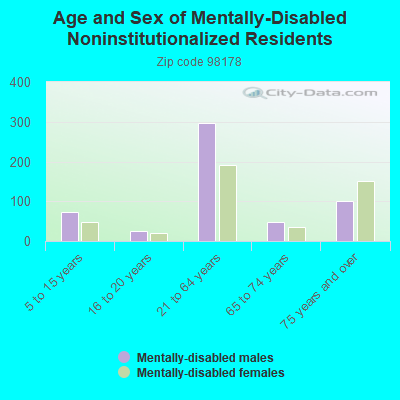
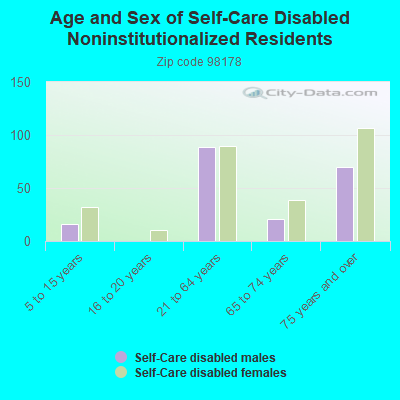
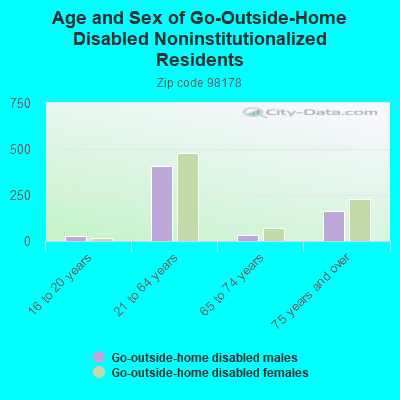
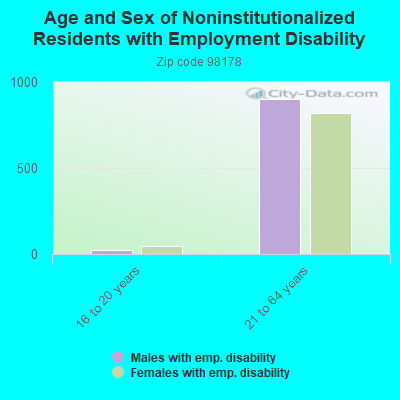
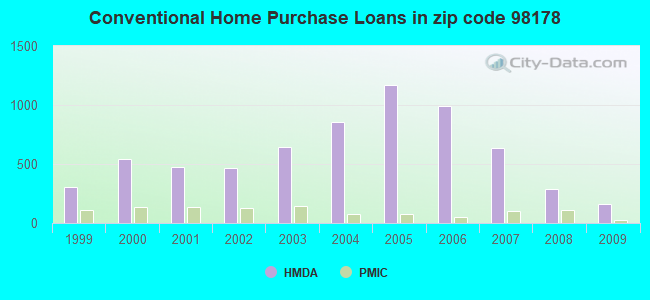
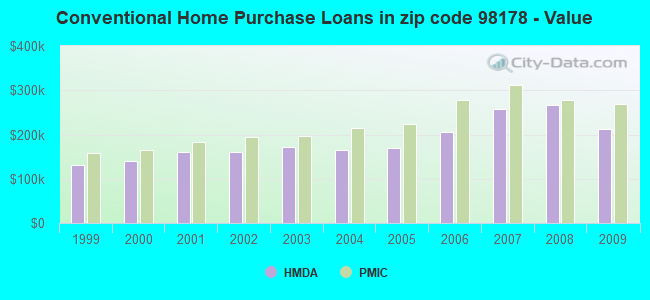
 According to the data from the years 2002 - 2018 the average number of fires per year is 83. The highest number of reported fire incidents - 135 took place in 2015, and the least - 12 in 2002. The data has an increasing trend.
 When looking into fire subcategories, the most incidents belonged to: Structure Fires (43.8%), and Outside Fires (34.2%).