Estimated zip code population in 2022: 42,577 Zip code population in 2010: 41,938 Zip code population in 2000: 37,481
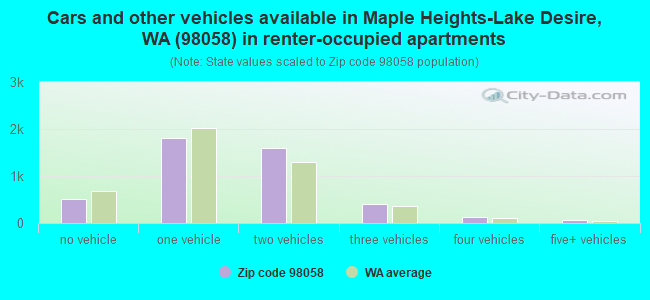
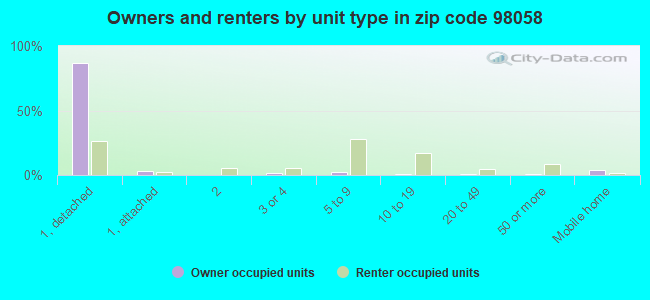
Houses and condos: 16,669 Renter-occupied apartments: 4,537
% of renters here:
28%
State:
36%
March 2022 cost of living index in zip code 98058: 113.0 (more than average, U.S. average is 100)
Land area: 18.9 sq. mi. Water area: 0.8 sq. mi.
Population density: 2,249 people per square mile
(low).
OSM Map
General Map
Google Map
MSN Map
OSM Map
General Map
Google Map
MSN Map
OSM Map
General Map
Google Map
MSN Map
OSM Map
General Map
Google Map
MSN Map
Please wait while loading the map...
Real estate property taxes paid for housing units in 2022:
This zip code:
0.8% ($5,925)
Washington:
0.8% ($4,283)
Median real estate property taxes paid for housing units with mortgages in 2022: $5,867 (0.8%) Median real estate property taxes paid for housing units with no mortgage in 2022: $6,060 (0.9%)
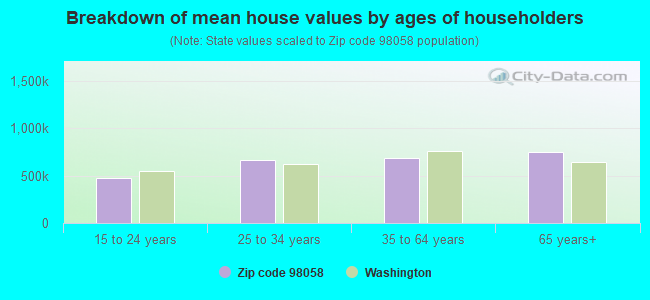
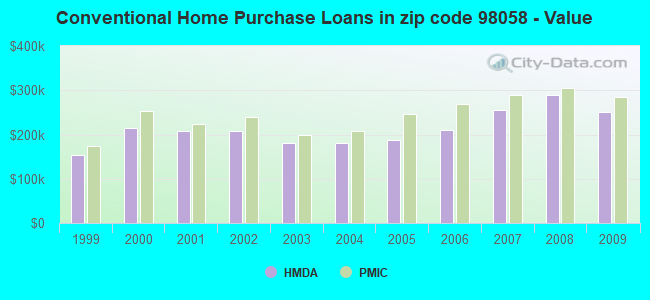
Estimated median house/condo value in 2022: $703,634
98058:
$703,634
Washington:
$569,500
According to our research of Washington and other state lists, there were 13 registered sex offenders living in 98058 zip code as of April 26, 2024. The ratio of all residents to sex offenders in zip code 98058 is 3,413 to 1. The ratio of registered sex offenders to all residents in this zip code is much lower than the state average.
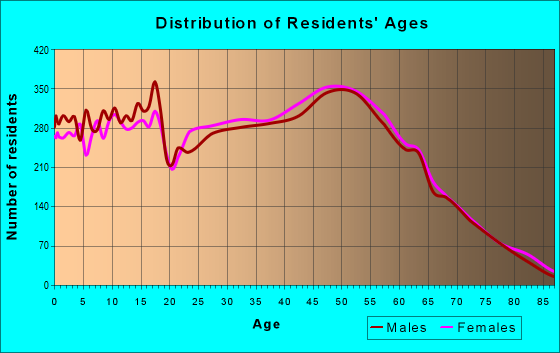
Median resident age:
This zip code:
38.8 years
Washington median age:
38.4 years
Average household size:
This zip code:
2.7 people
Washington:
2.5 people
Averages for the 2020 tax year for zip code 98058, filed in 2021:
Average Adjusted Gross Income (AGI) in 2020: $89,675 (Individual Income Tax Returns)
Here:
$89,675
State:
$99,264
Salary/wage: $79,851 (reported on 83.0% of returns)
Here:
$79,851
State:
$80,347
(% of AGI for various income ranges: 1088.7% for AGIs below $25k, 3433.9% for AGIs $25k-50k, 6345.7% for AGIs $50k-75k, 9346.5% for AGIs $75k-100k, 18288.7% for AGIs $100k-200k, 64831.3% for AGIs over 200k)
Taxable interest for individuals: $1,035 (reported on 37.7% of returns)
This zip code:
$1,035
Washington:
$2,077
(% of AGI for various income ranges: 18.3% for AGIs below $25k, 20.1% for AGIs $25k-50k, 29.3% for AGIs $50k-75k, 49.3% for AGIs $75k-100k, 100.5% for AGIs $100k-200k, 395.9% for AGIs over 200k)
Ordinary dividends: $4,321 (reported on 25.2% of returns)
Here:
$4,321
State:
$10,013
(% of AGI for various income ranges: 26.6% for AGIs below $25k, 35.5% for AGIs $25k-50k, 72.8% for AGIs $50k-75k, 141.8% for AGIs $75k-100k, 296.1% for AGIs $100k-200k, 1297.8% for AGIs over 200k)
Net capital gain/loss in AGI: +$17,177 (reported on 22.9% of returns)
Here:
+$17,177
State:
+$40,092
(% of AGI for various income ranges: 16.7% for AGIs below $25k, 34.3% for AGIs $25k-50k, 101.6% for AGIs $50k-75k, 198.1% for AGIs $75k-100k, 538.5% for AGIs $100k-200k, 9227.1% for AGIs over 200k)
Profit/loss from business: +$15,334 (reported on 13.8% of returns)
Here:
+$15,334
State:
+$18,312
(% of AGI for various income ranges: 126.3% for AGIs below $25k, 162.5% for AGIs $25k-50k, 226.2% for AGIs $50k-75k, 293.5% for AGIs $75k-100k, 385.5% for AGIs $100k-200k, 2093.4% for AGIs over 200k)
Taxable individual retirement arrangement distribution: $27,559 (reported on 8.9% of returns)
98058:
$27,559
Washington:
$24,221
(% of AGI for various income ranges: 50.3% for AGIs below $25k, 81.3% for AGIs $25k-50k, 167.1% for AGIs $50k-75k, 391.1% for AGIs $75k-100k, 691.3% for AGIs $100k-200k, 2678.8% for AGIs over 200k)
Self-employed (Keogh) retirement plans: $17,120 (reported on 0.5% of returns)
98058:
$17,120
Washington:
$24,166
(% of AGI for various income ranges: 20.0% for AGIs $100k-200k, 167.4% for AGIs over 200k)
Total itemized deductions: $30,001 (reported on 14.2% of returns)
Here:
$30,001
State:
$39,068
(% of AGI for various income ranges: 78.3% for AGIs below $25k, 159.3% for AGIs $25k-50k, 365.1% for AGIs $50k-75k, 650.7% for AGIs $75k-100k, 1271.7% for AGIs $100k-200k, 4065.3% for AGIs over 200k)
Charity contributions: $6,616 (reported on 10.6% of returns)
Here:
$6,616
State:
$15,331
(% of AGI for various income ranges: 2.4% for AGIs below $25k, 13.9% for AGIs $25k-50k, 34.2% for AGIs $50k-75k, 75.0% for AGIs $75k-100k, 234.7% for AGIs $100k-200k, 858.5% for AGIs over 200k)
Taxes paid: $7,924 (reported on 14.1% of returns)
98058:
$7,924
State:
$7,774
(% of AGI for various income ranges: 14.5% for AGIs below $25k, 43.9% for AGIs $25k-50k, 96.6% for AGIs $50k-75k, 184.5% for AGIs $75k-100k, 343.7% for AGIs $100k-200k, 1006.9% for AGIs over 200k)
Earned income credit: $1,928 (reported on 8.4% of returns)
Here:
$1,928
State:
$2,020
(% of AGI for various income ranges: 55.1% for AGIs below $25k, 45.1% for AGIs $25k-50k, 0.5% for AGIs $50k-75k)
Percentage of individuals using paid preparers for their 2020 taxes: 92.4%
Here:
92%
State:
93%
(% for various income ranges: 90.6% for AGIs below $25k, 92.9% for AGIs $25k-50k, 92.5% for AGIs $50k-75k, 92.6% for AGIs $75k-100k, 92.8% for AGIs $100k-200k, 94.2% for AGIs over 200k)
Averages for the 2012 tax year for zip code 98058, filed in 2013:
Average Adjusted Gross Income (AGI) in 2012: $66,856 (Individual Income Tax Returns)
Here:
$66,856
State:
$69,533
Salary/wage: $61,283 (reported on 86.4% of returns)
Here:
$61,283
State:
$57,267
(% of AGI for various income ranges: 76.6% for AGIs below $25k, 81.8% for AGIs $25k-50k, 79.1% for AGIs $50k-75k, 79.4% for AGIs $75k-100k, 82.9% for AGIs $100k-200k, 69.1% for AGIs over 200k)
Taxable interest for individuals: $869 (reported on 43.7% of returns)
This zip code:
$869
Washington:
$1,816
(% of AGI for various income ranges: 0.9% for AGIs below $25k, 0.5% for AGIs $25k-50k, 0.6% for AGIs $50k-75k, 0.5% for AGIs $75k-100k, 0.5% for AGIs $100k-200k, 0.8% for AGIs over 200k)
Ordinary dividends: $3,137 (reported on 24.2% of returns)
Here:
$3,137
State:
$8,163
(% of AGI for various income ranges: 1.4% for AGIs below $25k, 0.9% for AGIs $25k-50k, 0.9% for AGIs $50k-75k, 0.8% for AGIs $75k-100k, 1.1% for AGIs $100k-200k, 1.9% for AGIs over 200k)
Net capital gain/loss in AGI: +$4,908 (reported on 17.7% of returns)
Here:
+$4,908
State:
+$21,568
(% of AGI for various income ranges: 0.1% for AGIs $25k-50k, 0.3% for AGIs $50k-75k, 0.3% for AGIs $75k-100k, 0.9% for AGIs $100k-200k, 5.4% for AGIs over 200k)
Profit/loss from business: +$12,651 (reported on 12.3% of returns)
Here:
+$12,651
State:
+$16,521
(% of AGI for various income ranges: 7.2% for AGIs below $25k, 3.1% for AGIs $25k-50k, 1.8% for AGIs $50k-75k, 1.8% for AGIs $75k-100k, 1.9% for AGIs $100k-200k, 2.0% for AGIs over 200k)
Taxable individual retirement arrangement distribution: $18,585 (reported on 10.0% of returns)
98058:
$18,585
Washington:
$18,648
(% of AGI for various income ranges: 2.7% for AGIs below $25k, 2.2% for AGIs $25k-50k, 2.9% for AGIs $50k-75k, 3.2% for AGIs $75k-100k, 2.6% for AGIs $100k-200k, 3.1% for AGIs over 200k)
Self-employment retirement plans: $19,422 (reported on 0.4% of returns)
98058:
$19,422
Washington:
$20,087
(% of AGI for various income ranges: 0.2% for AGIs $25k-50k, 0.1% for AGIs $100k-200k, 0.4% for AGIs over 200k)
Total itemized deductions: $21,382 (20% of AGI, reported on 39.3% of returns)
Here:
$21,382
State:
$23,872
Here:
19.8% of AGI
State:
18.2% of AGI
(% of AGI for various income ranges: 10.4% for AGIs below $25k, 10.0% for AGIs $25k-50k, 14.1% for AGIs $50k-75k, 14.4% for AGIs $75k-100k, 13.7% for AGIs $100k-200k, 9.7% for AGIs over 200k)
Charity contributions: $3,423 (reported on 32.4% of returns)
Here:
$3,423
State:
$4,465
(% of AGI for various income ranges: 0.6% for AGIs below $25k, 0.9% for AGIs $25k-50k, 1.3% for AGIs $50k-75k, 1.6% for AGIs $75k-100k, 2.0% for AGIs $100k-200k, 2.1% for AGIs over 200k)
Taxes paid: $6,220 (reported on 38.9% of returns)
98058:
$6,220
State:
$6,400
(% of AGI for various income ranges: 2.6% for AGIs below $25k, 2.7% for AGIs $25k-50k, 3.7% for AGIs $50k-75k, 4.1% for AGIs $75k-100k, 4.1% for AGIs $100k-200k, 3.1% for AGIs over 200k)
Earned income credit: $2,134 (reported on 11.5% of returns)
Here:
$2,134
State:
$2,073
(% of AGI for various income ranges: 5.1% for AGIs below $25k, 0.8% for AGIs $25k-50k)
Percentage of individuals using paid preparers for their 2012 taxes: 39.5%
Here:
39%
State:
43%
(% for various income ranges: 36.4% for AGIs below $25k, 39.3% for AGIs $25k-50k, 41.1% for AGIs $50k-75k, 41.0% for AGIs $75k-100k, 40.1% for AGIs $100k-200k, 52.3% for AGIs over 200k)
Averages for the 2004 tax year for zip code 98058, filed in 2005:
Average Adjusted Gross Income (AGI) in 2004: $55,375 (Individual Income Tax Returns)
Here:
$55,375
State:
$54,331
Salary/wage: $51,367 (reported on 88.1% of returns)
Here:
$51,367
State:
$45,761
(% of AGI for various income ranges: 120.1% for AGIs below $10k, 78.2% for AGIs $10k-25k, 83.6% for AGIs $25k-50k, 83.9% for AGIs $50k-75k, 85.5% for AGIs $75k-100k, 77.7% for AGIs over 100k)
Taxable interest for individuals: $1,013 (reported on 51.5% of returns)
This zip code:
$1,013
Washington:
$2,110
(% of AGI for various income ranges: 4.8% for AGIs below $10k, 2.0% for AGIs $10k-25k, 0.9% for AGIs $25k-50k, 0.9% for AGIs $50k-75k, 0.7% for AGIs $75k-100k, 0.9% for AGIs over 100k)
Taxable dividends: $2,265 (reported on 31.2% of returns)
Here:
$2,265
State:
$5,879
(% of AGI for various income ranges: 5.0% for AGIs below $10k, 1.7% for AGIs $10k-25k, 0.9% for AGIs $25k-50k, 0.9% for AGIs $50k-75k, 0.9% for AGIs $75k-100k, 1.6% for AGIs over 100k)
Net capital gain/loss: +$5,372 (reported on 24.0% of returns)
Here:
+$5,372
State:
+$15,835
(% of AGI for various income ranges: -1.9% for AGIs below $10k, 0.3% for AGIs $10k-25k, 0.3% for AGIs $25k-50k, 0.5% for AGIs $50k-75k, 0.6% for AGIs $75k-100k, 5.2% for AGIs over 100k)
Profit/loss from business: +$11,711 (reported on 13.1% of returns)
Here:
+$11,711
State:
+$13,994
(% of AGI for various income ranges: 4.4% for AGIs below $10k, 5.1% for AGIs $10k-25k, 2.5% for AGIs $25k-50k, 2.5% for AGIs $50k-75k, 2.0% for AGIs $75k-100k, 3.0% for AGIs over 100k)
IRA payment deduction: $3,021 (reported on 2.8% of returns)
98058:
$3,021
Washington:
$3,001
(% of AGI for various income ranges: 0.4% for AGIs below $10k, 0.2% for AGIs $10k-25k, 0.3% for AGIs $25k-50k, 0.2% for AGIs $50k-75k, 0.1% for AGIs $75k-100k, 0.1% for AGIs over 100k)
Self-employed pension: $11,843 (reported on 0.7% of returns)
Here:
$11,843
Washington:
$14,244
(% of AGI for various income ranges: 0.1% for AGIs $25k-50k, 0.1% for AGIs $50k-75k, 0.1% for AGIs $75k-100k, 0.3% for AGIs over 100k)
Total itemized deductions: $18,090 (21% of AGI, reported on 44.8% of returns)
Here:
$18,090
State:
$19,669
Here:
21.5% of AGI
State:
20.7% of AGI
(% of AGI for various income ranges: 19.6% for AGIs below $10k, 12.8% for AGIs $10k-25k, 14.6% for AGIs $25k-50k, 17.4% for AGIs $50k-75k, 16.9% for AGIs $75k-100k, 12.4% for AGIs over 100k)
Charity contributions deductions: $2,634 (3% of AGI, reported on 39.1% of returns)
Here:
$2,634
State:
$3,569
Here:
3.0% of AGI
State:
3.5% of AGI
(% of AGI for various income ranges: 1.1% for AGIs below $10k, 1.1% for AGIs $10k-25k, 1.2% for AGIs $25k-50k, 1.8% for AGIs $50k-75k, 2.1% for AGIs $75k-100k, 2.1% for AGIs over 100k)
Total tax: $8,030 (reported on 82.0% of returns)
98058:
$8,030
State:
$9,065
(% of AGI for various income ranges: 3.5% for AGIs below $10k, 5.1% for AGIs $10k-25k, 7.4% for AGIs $25k-50k, 9.2% for AGIs $50k-75k, 10.3% for AGIs $75k-100k, 16.9% for AGIs over 100k)
Earned income credit: $1,609 (reported on 9.3% of returns)
Here:
$1,609
State:
$1,607
Percentage of individuals using paid preparers for their 2004 taxes: 43.2%
Here:
43%
State:
49%
(% for various income ranges: 34.5% for AGIs below $10k, 47.1% for AGIs $10k-25k, 46.0% for AGIs $25k-50k, 45.4% for AGIs $50k-75k, 40.8% for AGIs $75k-100k, 42.3% for AGIs over 100k)
Likely homosexual households (counted as self-reported same-sex unmarried-partner households)
Lesbian couples: 0.1% of all households
Gay men: 0.0% of all households
Household received Food Stamps/SNAP in the past 12 months: 1,290 Household did not receive Food Stamps/SNAP in the past 12 months: 14,674
Women who had a birth in the past 12 months: 520 (385 now married, 132 unmarried) Women who did not have a birth in the past 12 months: 9,960 (4,503 now married, 5,455 unmarried)
Housing units in zip code 98058 with a mortgage: 7,716 (806 second mortgage, 15 home equity loan, 703 both second mortgage and home equity loan) Houses without a mortgage: 219
Median monthly owner costs for units with a mortgage: $2,464 Median monthly owner costs for units without a mortgage: $885
Residents with income below the poverty level in 2022:
This zip code:
8.4%
Whole state:
10.0%
Residents with income below 50% of the poverty level in 2022:
This zip code:
4.2%
Whole state:
4.6%
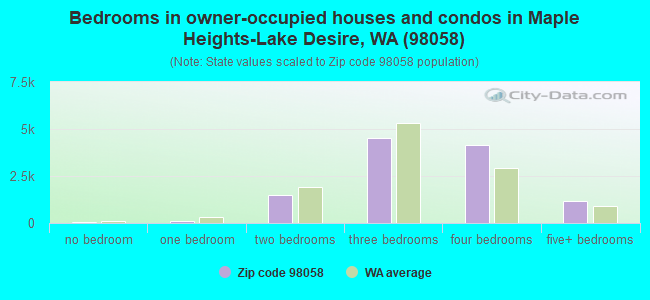
Median number of rooms in houses and condos:
Here:
7.0
State:
6.5
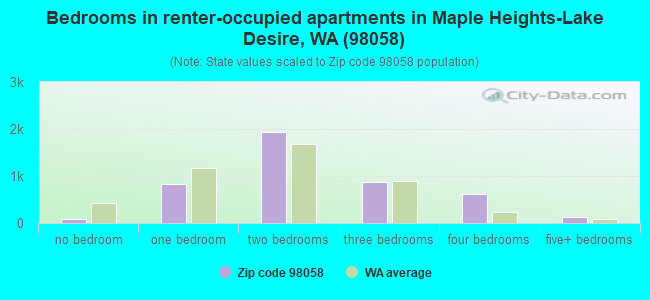
Median number of rooms in apartments:
Here:
4.4
State:
3.9
Notable locations in this zip code not listed on our city pages
Notable locations in zip code 98058: Maplewood Golf and Country Club (A), Fire King Coal Mine (B), Indian (C), Indian Coal Mine (D), Riverbend Recreational Vehicle Park (E), Fairwood Square (F), Fairwood Golf and Country Club (G), King County Fire Protection District 43 Maple Valley Fire and Life Safety Station 84 (H), King County Fire Protection District 43 Maple Valley Fire and Life Safety Storage Facility (I), King County Fire Protection District 40 Station 41 (J). Display/hide their locations on the map
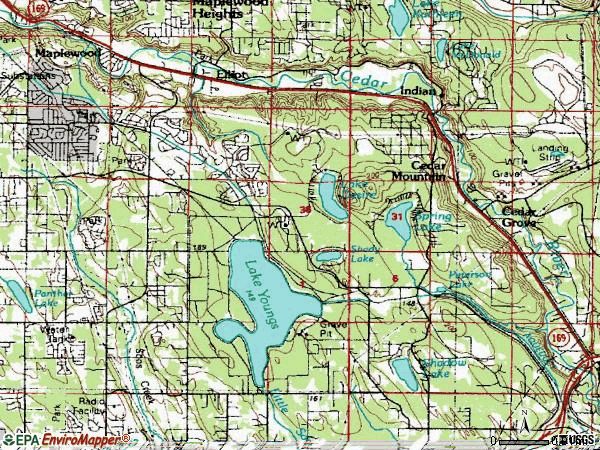
Lakes and reservoirs: Spring Lake (A), Lake Desire (B), Peterson Lake (C), Norkool Pond (D), Shadow Lake (E), Shady Lake (F), Lake Youngs (G). Display/hide their locations on the map
Parks in zip code 98058 include: Tiffany Park (1), Cascade Park (2), Lake Youngs Park (3), Boulevard Lane Park (4), Renton Park (5). Display/hide their locations on the map
6,027 married couples with children.
2,042 single-parent households (334 men, 1,708 women).
73.4% of residents of 98058 zip code speak English at home.
7.4% of residents speak Spanish at home (63% very well, 17% well, 9% not well, 11% not at all).
6.3% of residents speak other Indo-European language at home (63% very well, 19% well, 14% not well, 5% not at all).
10.7% of residents speak Asian or Pacific Island language at home (54% very well, 31% well, 13% not well, 2% not at all).
2.4% of residents speak other language at home (82% very well, 12% well, 6% not well).
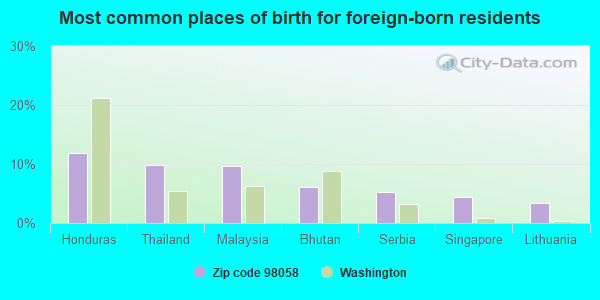
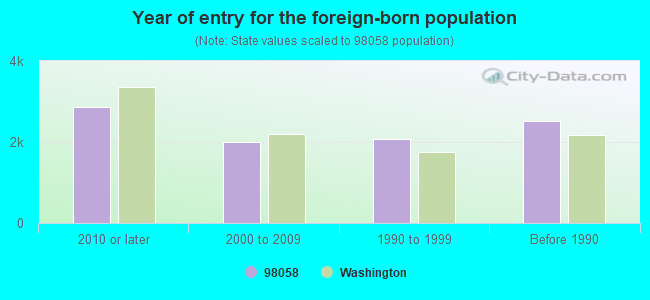
Foreign born population: 8,829 (20.7%) (61.8% of them are naturalized citizens)
Facilities with environmental interests located in this zip code:
CHEVRON 200585 (13923 SOUTHEAST PETROVITSKY ROAD in RENTON, WA)
HAZARDOUS WASTE BIENNIAL REPORTER (Resource Conservation and Recovery Act (tracking hazardous waste)) (Resource Conservation and Recovery Act (tracking hazardous waste)) STATE MASTER (Washington State Department of Ecology's Facility/Site identification system) - HAZWASTE-WAD988489696, HAZARDOUS WASTE PROGRAM, EPCRA, TOXICS-8681, LEAKING STORAGE TANK, TOXICS-, UNDERGROUND STORAGE TANK PROGRAM Business SIC classification: GASOLINE SERVICE STATIONS Organizations: SHIRLEY ZIEHE (CONTACT/OPERATOR)
, CHEVRON PRODUCTS COMPANY (CONTACT/OWNER)
Alternative names: 7 ELEVEN CHEVRON 230720057H, CHEVRON STATIONS INCORPORATED, CHEVRON SERVICE STATION 200585
ARCO 6026 PSI 5085 (17200 140TH AVE SE in RENTON, WA)
Small Quantity Generators, between 100 kg and 1000 kg of hazardous waste/month (Resource Conservation and Recovery Act (tracking hazardous waste)) STATE MASTER (Washington State Department of Ecology's Facility/Site identification system) - TOXICS-8797, LEAKING STORAGE TANK, UNDERGROUND STORAGE TANK PROGRAM, HAZWASTE-WAD988515243, EPCRA, SQG Business SIC classification: GASOLINE SERVICE STATIONS Organizations: BP WEST COST PRODUCTS LLC (CONTACT/OPERATOR)
Alternative names: ARCO 06026
CASCADE CLEANERS (16912 116TH AVE SE in RENTON, WA)
Conditionally Exempt Small Quantity Generators, less than 100 kg/month of hazardous waste (Resource Conservation and Recovery Act (tracking hazardous waste)) - notification STATE MASTER (Washington State Department of Ecology's Facility/Site identification system) - HAZWASTE-WAD988521340, CESQG Business SIC classification: DRYCLEANING PLANTS, EXCEPT RUG CLEANING Organizations: CLARENCE LO (CONTACT/OPERATOR)
CARRIAGE CREST ELEMENTARY SCHOOL (18235 140TH AVE SE in RENTON, WA)
(Geographic Names Information System) (National Center for Education Statistics) - STATE ID-4353 Organizations: KENT SCHOOL DIST 415 (SCHOOL DISTRICT)
CASCADE ELEMENTARY SCHOOL (16022 116TH AVE SE in RENTON, WA)
(Geographic Names Information System) (National Center for Education Statistics) - STATE ID-3337 Organizations: RENTON SCH DIST 403 (SCHOOL DISTRICT)
CEDAR RIVER WATER& SEWER DISTRICT (16802 SE 165TH ST in RENTON, WA)
(Resource Conservation and Recovery Act (tracking hazardous waste)) COMMUNITY WATER SYSTEM (SDWIS) Business NAICS classification: HYDROELECTRIC POWER GENERATION. Organizations: KIRK HINKELER (CONTACT/OPERATOR)
, CEDAR RIVER WATER & SEWER DISTRICT (CONTACT/OWNER)
134TH AVE SE HOLDING (W SIDE 134TH AVE SE 200 YDS N in RENTON, WA)
(Resource Conservation and Recovery Act (tracking hazardous waste)) Organizations: WA ECY (CONTACT/OWNER)
BONNEVILLE WASTE (MAPLE VALLEY COVINGTON LINE 1 in RENTON, WA)
(Resource Conservation and Recovery Act (tracking hazardous waste)) Organizations: WA ECY (CONTACT/OWNER)
CEDAR RIV WATER SEWER ROCK M (E LAKE DESIRE DR SE END OF in RENTON, WA)
(Resource Conservation and Recovery Act (tracking hazardous waste))
CEDAR RIVER BARREL (162ND AVE SE & JONES RD ON RIV in RENTON, WA)
(Resource Conservation and Recovery Act (tracking hazardous waste)) Organizations: WA ECY (CONTACT/OWNER)
Housing units lacking complete plumbing facilities: 0.2% Housing units lacking complete kitchen facilities: 0.3%
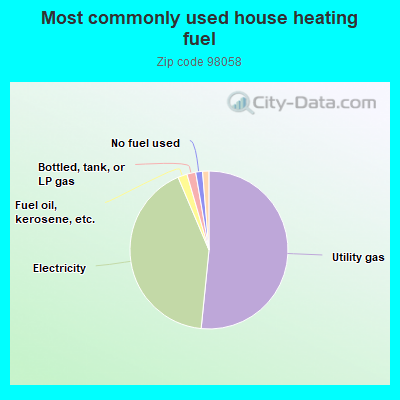
51.7%Utility gas
42.1%Electricity
1.9%Fuel oil, kerosene, etc.
1.8%Bottled, tank, or LP gas
1.4%No fuel used
0.6%Wood
0.6%Other fuel
Population in 1990: 10,153. Population change in the 1990s: +27,328 (+269.2%).
Place of birth for U.S.-born residents:
This state: 19,030
Northeast: 1,359
Midwest: 2,913
South: 2,505
West: 7,269
56% of the 98058 zip code residents lived in the same house 5 years ago. Out of people who lived in different houses, 71% lived in this county. Out of people who lived in different counties, 50% lived in Washington.
87% of the 98058 zip code residents lived in the same house 1 year ago. Out of people who lived in different houses, 64% moved from this county. Out of people who lived in different houses, 10% moved from different county within same state. Out of people who lived in different houses, 20% moved from different state. Out of people who lived in different houses, 5% moved from abroad.
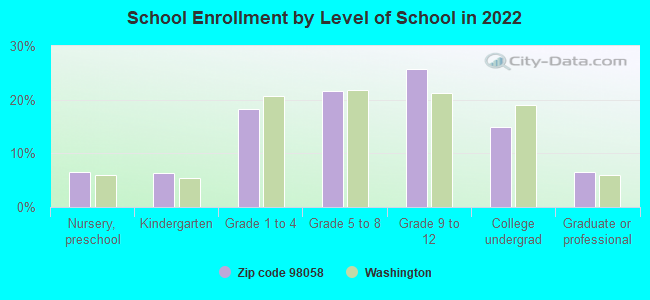
Private vs. public school enrollment:
Students in private schools in grades 1 to 8 (elementary and middle school): 483
Here:
13.1%
Washington:
12.4%
Students in private schools in grades 9 to 12 (high school): 356
Here:
14.9%
Washington:
9.2%
Students in private undergraduate colleges: 211
Here:
15.2%
Washington:
16.5%
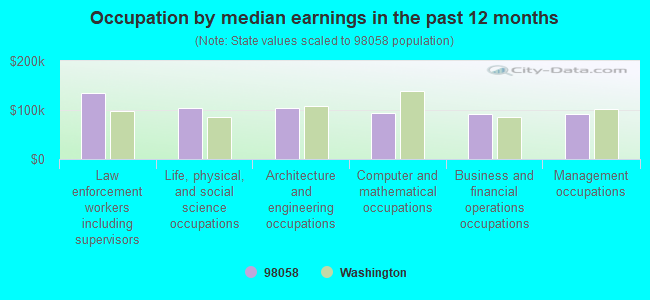
Occupation by median earnings in the past 12 months ($)
135,232Law enforcement workers including supervisors
103,520Life, physical, and social science occupations
103,102Architecture and engineering occupations
93,913Computer and mathematical occupations
92,755Business and financial operations occupations
90,922Management occupations
Companies with federal contracts located in this zip code (RENTON, WA):
KNAUSS, LARRY G (16405 SE JONES RD; small business) : $129,810 in 5 contractsfrom 2005 to 2006
Contracts for Psychiatry Services by Army Signed by year:2000: $0; 2001: $0; 2002: $0; 2003: $0; 2004: $0; 2005: $129,805; 2006: $5.
Biggest contracts:
$119,847 with Army for Psychiatry Services. Signed on 2005-10-17. Completion date: 2006-09-30.
$10,957, same as above.Signed on 2005-08-18. Completion date: 2005-09-30.
$5, same as above.Signed on 2006-03-16. Completion date: 2006-09-30.
$0, same as above.Signed on 2005-10-17. Completion date: 2006-09-30.
ROSENFELDER, FRED I (15715 SE 171ST PLACE; small business)
$3,250 with Air Force for Other Professional Services. Signed on 2005-06-17. Completion date: 2005-08-01.
UV SYSTEMS INC (16605 127TH AVE SE; small business)
$2,604 with Army for Electric Lamps. Signed on 2004-03-04. Completion date: 2004-03-17.
LASERKRAFT (12714 SE 191ST PL; small business)
$275 with Navy for Miscellaneous Items. Signed on 2004-06-04. Completion date: 2004-06-18.
Top industries in this zip code by the number of employees in 2005:
Other Services (except Public Administration): Religious Organizations (100-249 employees: 1 establishment, 20-49 employees: 1 establishment, 10-19 employees: 3 establishments, 5-9 employees: 1 establishment, 1-4 employees: 5 establishments)
2002 - 2018 National Fire Incident Reporting System (NFIRS) incidents
According to the data from the years 2002 - 2018 the average number of fires per year is 97. The highest number of fire incidents - 173 took place in 2004, and the least - 12 in 2012. The data has an increasing trend.
When looking into fire subcategories, the most incidents belonged to: Structure Fires (45.3%), and Outside Fires (39.6%).
Fire incident types reported to NFIRS in Zip Code 98058


 Nearest zip codes: 98059, 98042, 98055, 98031, 98056, 98057.


 According to the data from the years 2002 - 2018 the average number of fires per year is 97. The highest number of fire incidents - 173 took place in 2004, and the least - 12 in 2012. The data has an increasing trend.
 When looking into fire subcategories, the most incidents belonged to: Structure Fires (45.3%), and Outside Fires (39.6%).