Estimated zip code population in 2022: 10,786 Zip code population in 2010: 10,010 Zip code population in 2000: 9,519
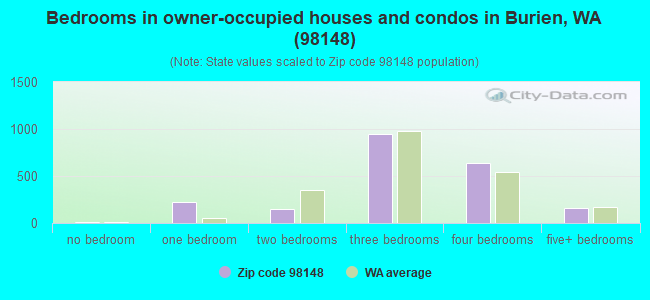
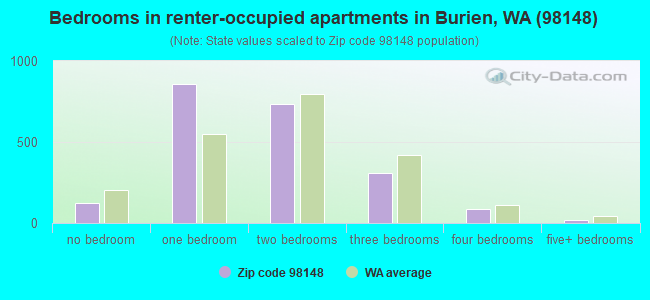
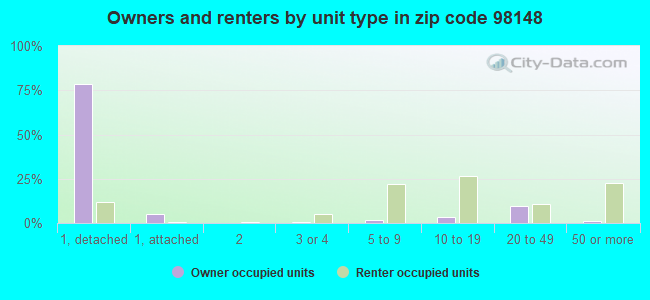
Houses and condos: 4,607 Renter-occupied apartments: 2,123
% of renters here:
50%
State:
36%
March 2022 cost of living index in zip code 98148: 113.4 (more than average, U.S. average is 100)
Land area: 3.1 sq. mi. Water area: 0.0 sq. mi.
Population density: 3,442 people per square mile
(average).
OSM Map
General Map
Google Map
MSN Map
OSM Map
General Map
Google Map
MSN Map
OSM Map
General Map
Google Map
MSN Map
OSM Map
General Map
Google Map
MSN Map
Please wait while loading the map...
Real estate property taxes paid for housing units in 2022:
This zip code:
0.8% ($4,962)
Washington:
0.8% ($4,283)
Median real estate property taxes paid for housing units with mortgages in 2022: $5,146 (0.8%) Median real estate property taxes paid for housing units with no mortgage in 2022: $4,519 (0.8%)
Estimated median house/condo value in 2022: $612,086
98148:
$612,086
Washington:
$569,500
According to our research of Washington and other state lists, there were 3 registered sex offenders living in 98148 zip code as of April 26, 2024. The ratio of all residents to sex offenders in zip code 98148 is 3,806 to 1. The ratio of registered sex offenders to all residents in this zip code is much lower than the state average.
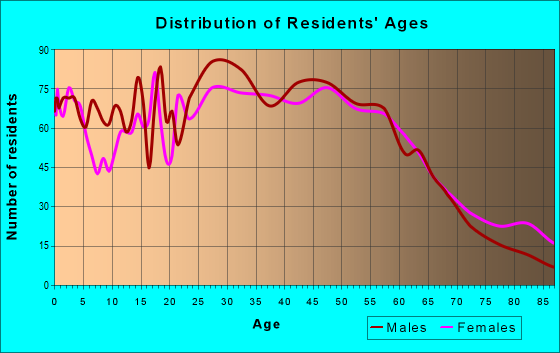
Median resident age:
This zip code:
36.5 years
Washington median age:
38.4 years
Average household size:
This zip code:
2.5 people
Washington:
2.5 people
Averages for the 2020 tax year for zip code 98148, filed in 2021:
Average Adjusted Gross Income (AGI) in 2020: $65,846 (Individual Income Tax Returns)
Here:
$65,846
State:
$99,264
Salary/wage: $58,327 (reported on 85.8% of returns)
Here:
$58,327
State:
$80,347
(% of AGI for various income ranges: 1182.8% for AGIs below $25k, 3661.7% for AGIs $25k-50k, 6507.1% for AGIs $50k-75k, 10217.0% for AGIs $75k-100k, 17622.4% for AGIs $100k-200k, 60308.6% for AGIs over 200k)
Taxable interest for individuals: $619 (reported on 25.0% of returns)
This zip code:
$619
Washington:
$2,077
(% of AGI for various income ranges: 8.0% for AGIs below $25k, 10.3% for AGIs $25k-50k, 23.5% for AGIs $50k-75k, 27.8% for AGIs $75k-100k, 55.3% for AGIs $100k-200k, 124.3% for AGIs over 200k)
Ordinary dividends: $3,111 (reported on 14.9% of returns)
Here:
$3,111
State:
$10,013
(% of AGI for various income ranges: 14.4% for AGIs below $25k, 18.0% for AGIs $25k-50k, 59.9% for AGIs $50k-75k, 118.6% for AGIs $75k-100k, 166.9% for AGIs $100k-200k, 644.3% for AGIs over 200k)
Net capital gain/loss in AGI: +$13,014 (reported on 13.6% of returns)
Here:
+$13,014
State:
+$40,092
(% of AGI for various income ranges: 3.7% for AGIs below $25k, 12.0% for AGIs $25k-50k, 63.5% for AGIs $50k-75k, 160.0% for AGIs $75k-100k, 325.3% for AGIs $100k-200k, 9691.4% for AGIs over 200k)
Profit/loss from business: +$12,706 (reported on 14.4% of returns)
Here:
+$12,706
State:
+$18,312
(% of AGI for various income ranges: 183.7% for AGIs below $25k, 172.6% for AGIs $25k-50k, 212.8% for AGIs $50k-75k, 327.8% for AGIs $75k-100k, 433.1% for AGIs $100k-200k, 1510.0% for AGIs over 200k)
Taxable individual retirement arrangement distribution: $18,194 (reported on 5.9% of returns)
98148:
$18,194
Washington:
$24,221
(% of AGI for various income ranges: 38.1% for AGIs below $25k, 38.5% for AGIs $25k-50k, 108.4% for AGIs $50k-75k, 229.5% for AGIs $75k-100k, 486.7% for AGIs $100k-200k, 1325.7% for AGIs over 200k)
Total itemized deductions: $27,896 (reported on 9.4% of returns)
Here:
$27,896
State:
$39,068
(% of AGI for various income ranges: 52.6% for AGIs below $25k, 95.9% for AGIs $25k-50k, 254.8% for AGIs $50k-75k, 661.9% for AGIs $75k-100k, 1108.2% for AGIs $100k-200k, 3918.6% for AGIs over 200k)
Charity contributions: $5,666 (reported on 7.0% of returns)
Here:
$5,666
State:
$15,331
(% of AGI for various income ranges: 8.9% for AGIs $25k-50k, 41.7% for AGIs $50k-75k, 81.4% for AGIs $75k-100k, 207.8% for AGIs $100k-200k, 588.6% for AGIs over 200k)
Taxes paid: $7,449 (reported on 9.4% of returns)
98148:
$7,449
State:
$7,774
(% of AGI for various income ranges: 9.4% for AGIs below $25k, 25.5% for AGIs $25k-50k, 71.5% for AGIs $50k-75k, 171.9% for AGIs $75k-100k, 302.9% for AGIs $100k-200k, 1052.9% for AGIs over 200k)
Earned income credit: $2,029 (reported on 12.2% of returns)
Here:
$2,029
State:
$2,020
(% of AGI for various income ranges: 79.9% for AGIs below $25k, 45.2% for AGIs $25k-50k)
Percentage of individuals using paid preparers for their 2020 taxes: 92.3%
Here:
92%
State:
93%
(% for various income ranges: 90.2% for AGIs below $25k, 91.8% for AGIs $25k-50k, 93.0% for AGIs $50k-75k, 94.5% for AGIs $75k-100k, 93.6% for AGIs $100k-200k, 94.7% for AGIs over 200k)
Averages for the 2012 tax year for zip code 98148, filed in 2013:
Average Adjusted Gross Income (AGI) in 2012: $45,847 (Individual Income Tax Returns)
Here:
$45,847
State:
$69,533
Salary/wage: $42,929 (reported on 85.1% of returns)
Here:
$42,929
State:
$57,267
(% of AGI for various income ranges: 75.3% for AGIs below $25k, 84.2% for AGIs $25k-50k, 84.5% for AGIs $50k-75k, 77.7% for AGIs $75k-100k, 79.9% for AGIs $100k-200k, 53.8% for AGIs over 200k)
Taxable interest for individuals: $714 (reported on 30.9% of returns)
This zip code:
$714
Washington:
$1,816
(% of AGI for various income ranges: 0.8% for AGIs below $25k, 0.4% for AGIs $25k-50k, 0.3% for AGIs $50k-75k, 0.6% for AGIs $75k-100k, 0.6% for AGIs $100k-200k, 0.2% for AGIs over 200k)
Ordinary dividends: $3,096 (reported on 14.3% of returns)
Here:
$3,096
State:
$8,163
(% of AGI for various income ranges: 1.4% for AGIs below $25k, 0.7% for AGIs $25k-50k, 0.7% for AGIs $50k-75k, 1.4% for AGIs $75k-100k, 1.3% for AGIs $100k-200k)
Net capital gain/loss in AGI: +$4,289 (reported on 9.3% of returns)
Here:
+$4,289
State:
+$21,568
(% of AGI for various income ranges: 0.3% for AGIs $50k-75k, 1.1% for AGIs $75k-100k, 2.8% for AGIs $100k-200k)
Profit/loss from business: +$11,407 (reported on 11.4% of returns)
Here:
+$11,407
State:
+$16,521
(% of AGI for various income ranges: 8.8% for AGIs below $25k, 3.0% for AGIs $25k-50k, 2.2% for AGIs $50k-75k, 1.9% for AGIs $75k-100k, 1.9% for AGIs $100k-200k)
Taxable individual retirement arrangement distribution: $14,027 (reported on 7.7% of returns)
98148:
$14,027
Washington:
$18,648
(% of AGI for various income ranges: 2.0% for AGIs below $25k, 1.4% for AGIs $25k-50k, 2.0% for AGIs $50k-75k, 2.9% for AGIs $75k-100k, 4.0% for AGIs $100k-200k)
Total itemized deductions: $19,433 (24% of AGI, reported on 24.9% of returns)
Here:
$19,433
State:
$23,872
Here:
23.8% of AGI
State:
18.2% of AGI
(% of AGI for various income ranges: 8.0% for AGIs below $25k, 7.3% for AGIs $25k-50k, 9.5% for AGIs $50k-75k, 13.2% for AGIs $75k-100k, 13.6% for AGIs $100k-200k, 13.2% for AGIs over 200k)
Charity contributions: $2,825 (reported on 18.9% of returns)
Here:
$2,825
State:
$4,465
(% of AGI for various income ranges: 0.4% for AGIs below $25k, 0.6% for AGIs $25k-50k, 0.9% for AGIs $50k-75k, 1.6% for AGIs $75k-100k, 1.9% for AGIs $100k-200k, 1.3% for AGIs over 200k)
Taxes paid: $4,897 (reported on 24.7% of returns)
98148:
$4,897
State:
$6,400
(% of AGI for various income ranges: 1.5% for AGIs below $25k, 1.6% for AGIs $25k-50k, 2.5% for AGIs $50k-75k, 3.2% for AGIs $75k-100k, 3.6% for AGIs $100k-200k, 4.0% for AGIs over 200k)
Earned income credit: $2,051 (reported on 17.4% of returns)
Here:
$2,051
State:
$2,073
(% of AGI for various income ranges: 5.5% for AGIs below $25k, 0.8% for AGIs $25k-50k)
Percentage of individuals using paid preparers for their 2012 taxes: 48.3%
Here:
48%
State:
43%
(% for various income ranges: 47.7% for AGIs below $25k, 48.3% for AGIs $25k-50k, 46.7% for AGIs $50k-75k, 51.2% for AGIs $75k-100k, 48.8% for AGIs $100k-200k, 75.0% for AGIs over 200k)
Averages for the 2004 tax year for zip code 98148, filed in 2005:
Average Adjusted Gross Income (AGI) in 2004: $37,774 (Individual Income Tax Returns)
Here:
$37,774
State:
$54,331
Salary/wage: $35,233 (reported on 85.9% of returns)
Here:
$35,233
State:
$45,761
(% of AGI for various income ranges: 122.5% for AGIs below $10k, 77.2% for AGIs $10k-25k, 87.2% for AGIs $25k-50k, 84.7% for AGIs $50k-75k, 82.6% for AGIs $75k-100k, 57.9% for AGIs over 100k)
Taxable interest for individuals: $1,422 (reported on 37.3% of returns)
This zip code:
$1,422
Washington:
$2,110
(% of AGI for various income ranges: 5.0% for AGIs below $10k, 1.9% for AGIs $10k-25k, 0.8% for AGIs $25k-50k, 1.0% for AGIs $50k-75k, 0.9% for AGIs $75k-100k, 2.7% for AGIs over 100k)
Taxable dividends: $2,434 (reported on 19.3% of returns)
Here:
$2,434
State:
$5,879
(% of AGI for various income ranges: 4.0% for AGIs below $10k, 1.4% for AGIs $10k-25k, 0.6% for AGIs $25k-50k, 0.8% for AGIs $50k-75k, 1.7% for AGIs $75k-100k, 2.3% for AGIs over 100k)
Net capital gain/loss: +$5,446 (reported on 14.6% of returns)
Here:
+$5,446
State:
+$15,835
(% of AGI for various income ranges: -2.0% for AGIs below $10k, -0.1% for AGIs $10k-25k, 0.0% for AGIs $25k-50k, 0.9% for AGIs $50k-75k, 1.0% for AGIs $75k-100k, 10.1% for AGIs over 100k)
Profit/loss from business: +$8,482 (reported on 10.9% of returns)
Here:
+$8,482
State:
+$13,994
(% of AGI for various income ranges: 8.6% for AGIs below $10k, 4.9% for AGIs $10k-25k, 2.1% for AGIs $25k-50k, 1.4% for AGIs $50k-75k, 1.8% for AGIs $75k-100k, 2.8% for AGIs over 100k)
IRA payment deduction: $2,907 (reported on 2.0% of returns)
98148:
$2,907
Washington:
$3,001
(% of AGI for various income ranges: 0.2% for AGIs $10k-25k, 0.2% for AGIs $25k-50k, 0.1% for AGIs $50k-75k, 0.1% for AGIs over 100k)
Self-employed pension: $4,154 (reported on 0.3% of returns)
Here:
$4,154
Washington:
$14,244
Total itemized deductions: $15,644 (24% of AGI, reported on 28.1% of returns)
Here:
$15,644
State:
$19,669
Here:
24.5% of AGI
State:
20.7% of AGI
(% of AGI for various income ranges: 20.5% for AGIs below $10k, 8.0% for AGIs $10k-25k, 9.2% for AGIs $25k-50k, 14.5% for AGIs $50k-75k, 14.4% for AGIs $75k-100k, 11.8% for AGIs over 100k)
Charity contributions deductions: $2,319 (3% of AGI, reported on 23.3% of returns)
Here:
$2,319
State:
$3,569
Here:
3.4% of AGI
State:
3.5% of AGI
(% of AGI for various income ranges: 1.0% for AGIs below $10k, 0.7% for AGIs $10k-25k, 0.9% for AGIs $25k-50k, 1.9% for AGIs $50k-75k, 1.9% for AGIs $75k-100k, 1.9% for AGIs over 100k)
Total tax: $4,638 (reported on 77.0% of returns)
98148:
$4,638
State:
$9,065
(% of AGI for various income ranges: 3.2% for AGIs below $10k, 4.5% for AGIs $10k-25k, 7.5% for AGIs $25k-50k, 9.4% for AGIs $50k-75k, 10.9% for AGIs $75k-100k, 15.9% for AGIs over 100k)
Earned income credit: $1,639 (reported on 14.6% of returns)
Here:
$1,639
State:
$1,607
Percentage of individuals using paid preparers for their 2004 taxes: 51.6%
Here:
52%
State:
49%
(% for various income ranges: 46.9% for AGIs below $10k, 54.6% for AGIs $10k-25k, 50.7% for AGIs $25k-50k, 51.4% for AGIs $50k-75k, 50.9% for AGIs $75k-100k, 60.4% for AGIs over 100k)
Likely homosexual households (counted as self-reported same-sex unmarried-partner households)
Lesbian couples: 1.0% of all households
Gay men: 0.2% of all households
Household received Food Stamps/SNAP in the past 12 months: 484 Household did not receive Food Stamps/SNAP in the past 12 months: 3,783
Women who had a birth in the past 12 months: 190 (171 now married, 21 unmarried) Women who did not have a birth in the past 12 months: 2,288 (956 now married, 1,333 unmarried)
Housing units in zip code 98148 with a mortgage: 1,388 (78 second mortgage, 77 both second mortgage and home equity loan) Houses without a mortgage: 17
Median monthly owner costs for units with a mortgage: $2,476 Median monthly owner costs for units without a mortgage: $769
Residents with income below the poverty level in 2022:
This zip code:
9.5%
Whole state:
10.0%
Residents with income below 50% of the poverty level in 2022:
This zip code:
5.1%
Whole state:
4.6%
Median number of rooms in houses and condos:
Here:
6.4
State:
6.5
Median number of rooms in apartments:
Here:
3.7
State:
3.9
Notable locations in this zip code not listed on our city pages
Notable locations in zip code 98148: Normandy Village (A), Five Corners Plaza (B), Tyee Valley Golf Course (C), King County Fire Protection District 2 Station 29 (D). Display/hide their locations on the map
Churches in zip code 98148 include: Prince of Peace Lutheran Church (A), Resurrection Life Assembly (B), The Church of Jesus Christ of Latter Day Saints (C), Three Tree Community Church (D), First Church of Christ Scientist at Burien (E), Normandy Christian Church (F), Evergreen Church (G), Kingdom Hall of Jehovahs Witnesses (H), Our Saviours Lutheran Church (I). Display/hide their locations on the map
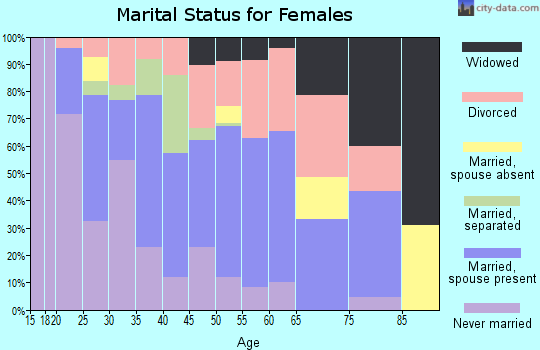
1,274 married couples with children.
706 single-parent households (173 men, 533 women).
62.5% of residents of 98148 zip code speak English at home.
17.7% of residents speak Spanish at home (47% very well, 20% well, 28% not well, 5% not at all).
4.2% of residents speak other Indo-European language at home (64% very well, 35% well, 1% not at all).
8.2% of residents speak Asian or Pacific Island language at home (43% very well, 25% well, 28% not well, 4% not at all).
7.3% of residents speak other language at home (78% very well, 20% well, 3% not at all).
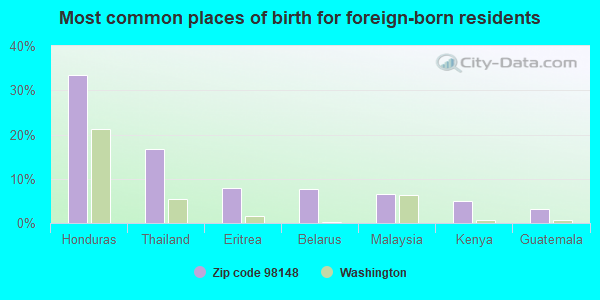
Foreign born population: 2,594 (24.1%) (54.9% of them are naturalized citizens)
Major facilities with environmental interests located in this zip code:
CHEVRON SS 98412 (17651 1ST AVE S in SEATTLE, WA)
Conditionally Exempt Small Quantity Generators, less than 100 kg/month of hazardous waste (Resource Conservation and Recovery Act (tracking hazardous waste)) STATE MASTER (Washington State Department of Ecology's Facility/Site identification system) - TOXICS-5246, UNDERGROUND STORAGE TANK PROGRAM, HAZWASTE-WA0000712562, CESQG Business SIC classification: PETROLEUM BULK STATIONS AND TERMINALS Organizations: CHEVRON PRODUCTS CO (CONTACT/ HAZARDOUS WASTE)
, KATHY NORRIS (CONTACT/OPERATOR)
Alternative names: CHEVRON 98412
COMMUNITY CHAPEL BIBLE TRAIN (18635 8TH AVE S in SEATTLE, WA)
COMPLIANCE ACTIVITY (Tracking inspections of insecticide, fungicide, and rodenticide, and toxic substances) (Resource Conservation and Recovery Act (tracking hazardous waste)) STATE MASTER (Washington State Department of Ecology's Facility/Site identification system) - TOXICS-2422, UNDERGROUND STORAGE TANK PROGRAM Business SIC classification: NONCLASSIFIABLE ESTABLISHMENTS Alternative names: COMMUNITY CHAPEL & BIBLE TRAINING CNT, COMMUNITY CHAPEL CHRISTIAN SCHOOL
ALASKA AIRLINES FACILITY SHOP (1515 S 192ND in SEATTLE, WA)
(Resource Conservation and Recovery Act (tracking hazardous waste)) STATE MASTER (Washington State Department of Ecology's Facility/Site identification system) - HAZWASTE-WAD988505780, HAZARDOUS WASTE PROGRAM Business SIC classification: AIR TRANSPORTATION, SCHEDULED Business NAICS classification: SCHEDULED PASSENGER AIR TRANSPORTATION.; SCHEDULED PASSENGER AIR TRANSPORTATION. Organizations: ALASKA AIRLINES INC (CONTACT/OPERATOR)
BFS RETAIL & COMMERCIAL OPS LLC SEATTLE (15324 1ST AVE S in SEATTLE, WA)
(Resource Conservation and Recovery Act (tracking hazardous waste)) STATE MASTER (Washington State Department of Ecology's Facility/Site identification system) - HAZWASTE-WAD988468971, HAZARDOUS WASTE PROGRAM Business SIC classification: AUTO AND HOME SUPPLY STORES Organizations: TONY BASSOON (CONTACT/OPERATOR)
, BFS RETAIL & COMMERCIAL OPERATIONS LLC (CONTACT/OWNER)
Alternative names: FIRESTONE TIRE RUBBER
BURIEN HONDA (15026 1ST AVE S in SEATTLE, WA)
(Resource Conservation and Recovery Act (tracking hazardous waste)) STATE MASTER (Washington State Department of Ecology's Facility/Site identification system) - TOXICS-8277, LEAKING STORAGE TANK, UNDERGROUND STORAGE TANK PROGRAM, HAZWASTE-WAD075735258, CESQG Business SIC classification: MOTOR VEHICLE DEALERS (NEW AND USED) Organizations: KATHY BROWN (CONTACT/OPERATOR)
Alternative names: J & J MOTORS INC
ABC RADIATOR (15855 1ST AVENUE SOUTH in SEATTLE, WA)
Conditionally Exempt Small Quantity Generators, less than 100 kg/month of hazardous waste (Resource Conservation and Recovery Act (tracking hazardous waste)) - notification STATE MASTER (Washington State Department of Ecology's Facility/Site identification system) - TOXICS-, UNDERGROUND STORAGE TANK PROGRAM, HAZWASTE-WAD069557312, CESQG Business SIC classification: MOTOR VEHICLE DEALERS (NEW AND USED); GENERAL AUTOMOTIVE REPAIR SHOPS Business NAICS classification: GENERAL AUTOMOTIVE REPAIR.; GENERAL AUTOMOTIVE REPAIR. Organizations: RUSSELL RIZZO (CONTACT/OPERATOR)
, RUSSCO INC DBA ABC RADIATOR (CONTACT/OWNER)
AIRPORT AUTO & RV REPAIR (18634 DES MOINES MEMORIAL DR in SEATTLE, WA)
Conditionally Exempt Small Quantity Generators, less than 100 kg/month of hazardous waste (Resource Conservation and Recovery Act (tracking hazardous waste)) - notification STATE MASTER (Washington State Department of Ecology's Facility/Site identification system) - HAZWASTE-WAD988474953, CESQG Business SIC classification: TOP, BODY, AND UPHOLSTERY REPAIR SHOPS AND PAINT SHOPS Business NAICS classification: AUTOMOTIVE BODY, PAINT, AND INTERIOR REPAIR AND MAINTENANCE.; AUTOMOTIVE BODY, PAINT, AND INTERIOR REPAIR AND MAINTENANCE. Organizations: ED CHAPIN (CONTACT/OPERATOR)
BJORNEBY AUTO REBUILD INC (1265 S 188TH in SEATTLE, WA)
Small Quantity Generators, between 100 kg and 1000 kg of hazardous waste/month (Resource Conservation and Recovery Act (tracking hazardous waste)) STATE MASTER (Washington State Department of Ecology's Facility/Site identification system) - HAZWASTE-WAD045327335, HAZARDOUS WASTE PROGRAM, SQG Business SIC classification: TOP, BODY, AND UPHOLSTERY REPAIR SHOPS AND PAINT SHOPS Business NAICS classification: AUTOMOTIVE BODY, PAINT, AND INTERIOR REPAIR AND MAINTENANCE.; AUTOMOTIVE BODY, PAINT, AND INTERIOR REPAIR AND MAINTENANCE. Organizations: MICHELE CONARD (CONTACT/OPERATOR)
BURIEN NISSAN INC (16042 1ST AVE S in SEATTLE, WA)
Conditionally Exempt Small Quantity Generators, less than 100 kg/month of hazardous waste (Resource Conservation and Recovery Act (tracking hazardous waste)) - notification STATE MASTER (Washington State Department of Ecology's Facility/Site identification system) - TOXICS-10981, UNDERGROUND STORAGE TANK PROGRAM, HAZWASTE-WAD988493615, CESQG Business SIC classification: MOTOR VEHICLE DEALERS (NEW AND USED); GENERAL AUTOMOTIVE REPAIR SHOPS Organizations: DEBRA KELLEY (CONTACT/OPERATOR)
Alternative names: ANDREWS BURIEN NISSAN INC
BURIEN TOYOTA (15025 1ST AVE S in SEATTLE, WA)
Small Quantity Generators, between 100 kg and 1000 kg of hazardous waste/month (Resource Conservation and Recovery Act (tracking hazardous waste)) - notification STATE MASTER (Washington State Department of Ecology's Facility/Site identification system) - TOXICS-, UNDERGROUND STORAGE TANK PROGRAM, HAZWASTE-WAD980979405, HAZARDOUS WASTE PROGRAM, SQG Business SIC classification: MOTOR VEHICLE DEALERS (NEW AND USED) Organizations: DUANE SMITH (CONTACT/OPERATOR)
Alternative names: BURIEN TOYOTA UST 148
CIRCLE K 01991 (17700 AMBAUM BOULEVARD in BURIEN, WA)
Conditionally Exempt Small Quantity Generators, less than 100 kg/month of hazardous waste (Resource Conservation and Recovery Act (tracking hazardous waste)) STATE MASTER (Washington State Department of Ecology's Facility/Site identification system) - HAZWASTE-WAR000010454, HAZARDOUS WASTE PROGRAM, TOXICS-, UNDERGROUND STORAGE TANK PROGRAM, HAZWASTE-WAR000010454, EPCRA Business SIC classification: GASOLINE SERVICE STATIONS Organizations: KAYO OIL (CONTACT/OPERATOR)
, CONOCOPHILLIPS COMPANY (CONTACT/OWNER)
Alternative names: CIRCLE K CONVENIENCE STORE 1991
CIRCLE K STORE 5480 BP OIL (15846 1ST AVENUE SOUTH in SEATTLE, WA)
Conditionally Exempt Small Quantity Generators, less than 100 kg/month of hazardous waste (Resource Conservation and Recovery Act (tracking hazardous waste)) STATE MASTER (Washington State Department of Ecology's Facility/Site identification system) - TOXICS-10132, LEAKING STORAGE TANK, UNDERGROUND STORAGE TANK PROGRAM, HAZWASTE-WAD988487039, EPCRA, HAZARDOUS WASTE PROGRAM Business SIC classification: GASOLINE SERVICE STATIONS Organizations: KAYO OIL (CONTACT/OPERATOR)
, CONOCOPHILLIPS COMPANY (CONTACT/OWNER)
Alternative names: TOSCO FACILITY 05480
ALTERNATIVE SATELLITE HIGH SCHL (440 S. 186TH in SEATTLE, WA)
(National Center for Education Statistics) - STATE ID-3336 Organizations: HIGHLINE SCH DIST 401 (SCHOOL DISTRICT)
Housing units lacking complete kitchen facilities: 1.7%
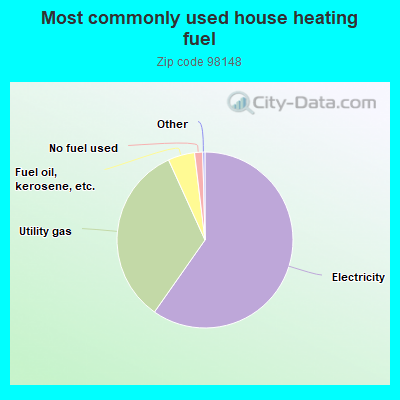
59.8%Electricity
33.5%Utility gas
4.9%Fuel oil, kerosene, etc.
1.5%No fuel used
Population in 1990: 8,818. Population change in the 1990s: +701 (+7.9%).
Place of birth for U.S.-born residents:
This state: 5,093
Northeast: 471
Midwest: 530
South: 627
West: 1,339
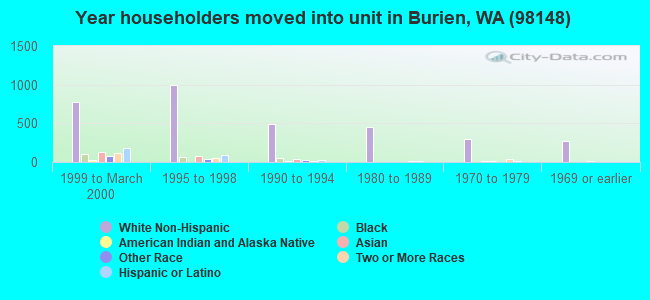
47% of the 98148 zip code residents lived in the same house 5 years ago. Out of people who lived in different houses, 75% lived in this county. Out of people who lived in different counties, 50% lived in Washington.
79% of the 98148 zip code residents lived in the same house 1 year ago. Out of people who lived in different houses, 56% moved from this county. Out of people who lived in different houses, 10% moved from different county within same state. Out of people who lived in different houses, 20% moved from different state. Out of people who lived in different houses, 12% moved from abroad.
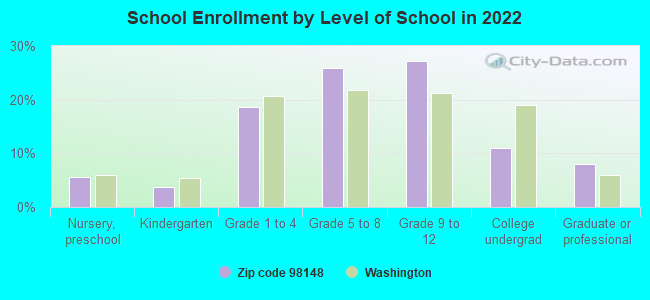
Private vs. public school enrollment:
Students in private schools in grades 1 to 8 (elementary and middle school): 80
Here:
9.5%
Washington:
12.4%
Students in private schools in grades 9 to 12 (high school): 22
Here:
4.4%
Washington:
9.2%
Students in private undergraduate colleges: 37
Here:
18.0%
Washington:
16.5%
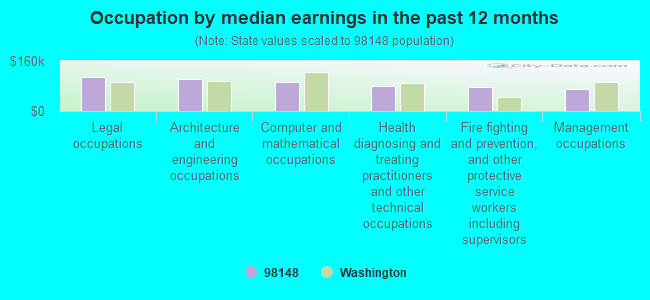
Occupation by median earnings in the past 12 months ($)
110,146Legal occupations
103,101Architecture and engineering occupations
93,801Computer and mathematical occupations
81,319Health diagnosing and treating practitioners and other technical occupations
78,289Fire fighting and prevention, and other protective service workers including supervisors
68,999Management occupations
Companies with federal contracts located in this zip code:
MONROE MACHINED PRODUCTS INC (1422 S 192ND ST in SEATTLE, WA; small business) : $3,420,251 in 70 contractsfrom 1999 to 2006
Contracts for Hardware, Commercial, Airframe Structural Components, Miscellaneous Aircraft Accessories and Components, Hardware, Weapon System, and moreby Air Force, Defense Logistics Agency, Army Signed by year:2000: $719,917; 2001: $1,067,447; 2002: $386,867; 2003: $0; 2004: $226,125; 2005: $863,949; 2006: $128,186.
Biggest contracts:
$585,930 with Air Force for Hardware, Commercial. Signed on 2005-07-06. Completion date: 2006-10-31.
$459,426 with Defense Logistics Agency for Airframe Structural Components. Signed on 2001-02-26. Completion date: 2001-04-22.
$199,895 with Air Force for Airframe Structural Components. Signed on 2000-02-14. Completion date: 2001-03-22.
$111,448 with Defense Logistics Agency for Miscellaneous Aircraft Accessories and Components. Signed on 2001-07-18. Completion date: 2002-03-26.
PACIFIC TORQUE, INC (18060 DES MOINES MEM DR S in SEATTLE, WA; small business) : $511,799 in 14 contractsfrom 2000 to 2006
Contracts for Vehicular Power Transmission Components, Maintenance, Repair and Rebuilding of Equipment -- Engines, Turbines, and Components, Maintenance, Repair and Rebuilding of Equipment -- Construction, Mining, Excavating, and Highway Maintenance Equipment, Miscellaneous Vehicular Components by Army, U.S. Army Corps of Engineers - civil program financing only Signed by year:2000: $238,884; 2001: $184,800; 2002: $49,385; 2003: $7,878; 2004: $22,466; 2005: $4,735; 2006: $3,651.
Biggest contracts:
$238,884 with Army for Vehicular Power Transmission Components. Signed on 2000-06-02. Completion date: 2000-08-14.
$92,400, same as above.Signed on 2001-10-12. Completion date: 2002-03-29.
$92,400, same as above.Signed on 2001-10-18. Completion date: 2002-04-30.
$49,385 with U.S. Army Corps of Engineers - civil program financing only for Maintenance, Repair and Rebuilding of Equipment -- Engines, Turbines, and Components. Signed on 2002-12-16. Completion date: 2003-01-06.
J & K CONNECTORS LLLP (19209 DES MOINES WAY S in SEATTLE, WA; small business) : $114,963 in 14 contractsfrom 2001 to 2005
Contracts for Connectors, Electrical, Miscellaneous Electrical and Electronic Components by Navy, Defense Logistics Agency Signed by year:2000: $0; 2001: $42,856; 2002: $0; 2003: $0; 2004: $26,042; 2005: $46,065; 2006: $0.
Biggest contracts:
$42,856 with Navy for Connectors, Electrical. Signed on 2001-04-03. Completion date: 2001-04-20.
$13,793 with Defense Logistics Agency for Connectors, Electrical. Signed on 2005-09-23. Completion date: 2005-11-24.
$13,128, same as above.Signed on 2005-09-06. Completion date: 2005-12-05.
$5,313, same as above.Signed on 2004-11-09. Completion date: 2005-02-08.
OBERLOH WOODWIND & BRASS WORKS (18018 1ST AVE S in BURIEN, WA; small business) : $12,490 in 5 contractsfrom 2003 to 2004
Contracts for Maintenance, Repair and Rebuilding of Equipment -- Musical Instruments, Phonographs, and Home-Type Radios by Army Signed by year:2000: $0; 2001: $0; 2002: $0; 2003: $5,270; 2004: $7,220; 2005: $0; 2006: $0.
Biggest contracts:
$5,270 with Army for Maintenance, Repair and Rebuilding of Equipment -- Musical Instruments, Phonographs, and Home-Type Radios. Signed on 2003-09-09. Completion date: 2003-08-30.
$4,095, same as above.Signed on 2004-08-12. Completion date: 2004-09-09.
$2,510, same as above.Signed on 2004-09-20. Completion date: 2004-09-09.
$600, same as above.Signed on 2004-04-15. Completion date: 2004-04-30.
MOTION INDUSTRIES, INC (18900 DES MOINES MEMORIAL in SEATTLE, WA) : $7,598 in 5 contractsin 2005
Contracts for Packing and Gasket Materials, Bearings, Antifriction, Unmounted by Navy Signed by year:2000: $0; 2001: $0; 2002: $0; 2003: $0; 2004: $0; 2005: $7,598; 2006: $0.
Biggest contracts:
$5,086 with Navy for Packing and Gasket Materials. Signed on 2005-07-08. Completion date: 2005-07-22.
$2,353 with Navy for Bearings, Antifriction, Unmounted. Signed on 2005-04-14. Completion date: 2005-04-28.
$1,370 with Navy for Packing and Gasket Materials. Signed on 2005-07-15. Completion date: 2005-08-05.
$60 with Navy for Bearings, Antifriction, Unmounted. Signed on 2005-06-21. Completion date: 2005-06-24.
Top industries in this zip code by the number of employees in 2005:
2002 - 2018 National Fire Incident Reporting System (NFIRS) incidents
According to the data from the years 2002 - 2018 the average number of fire incidents per year is 40. The highest number of fires - 59 took place in 2008, and the least - 22 in 2006. The data has an increasing trend.
When looking into fire subcategories, the most incidents belonged to: Structure Fires (54.1%), and Outside Fires (26.8%).
Fire incident types reported to NFIRS in Zip Code 98148


 Nearest zip codes: 98158, 98166, 98168, 98188, 98198, 98146.


 According to the data from the years 2002 - 2018 the average number of fire incidents per year is 40. The highest number of fires - 59 took place in 2008, and the least - 22 in 2006. The data has an increasing trend.
 When looking into fire subcategories, the most incidents belonged to: Structure Fires (54.1%), and Outside Fires (26.8%).