Estimated zip code population in 2022: 53,461 Zip code population in 2010: 45,899 Zip code population in 2000: 34,724
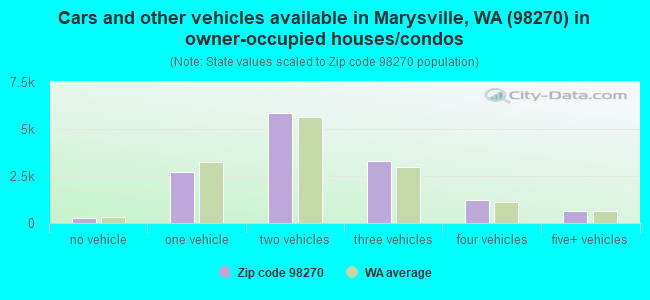
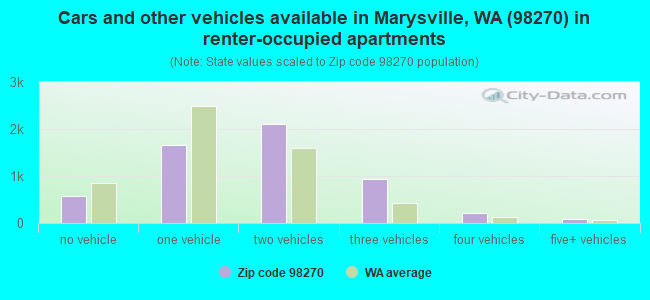
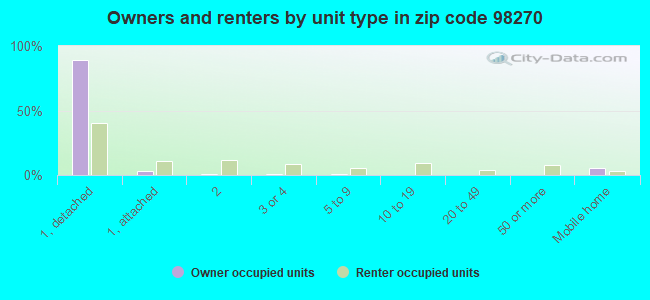
Houses and condos: 20,155 Renter-occupied apartments: 5,669
% of renters here:
29%
State:
36%
March 2022 cost of living index in zip code 98270: 111.2 (more than average, U.S. average is 100)
Land area: 14.3 sq. mi. Water area: 0.2 sq. mi.
Population density: 3,736 people per square mile
(average).
OSM Map
General Map
Google Map
MSN Map
OSM Map
General Map
Google Map
MSN Map
OSM Map
General Map
Google Map
MSN Map
OSM Map
General Map
Google Map
MSN Map
Please wait while loading the map...
Real estate property taxes paid for housing units in 2022:
This zip code:
0.7% ($4,102)
Washington:
0.8% ($4,283)
Median real estate property taxes paid for housing units with mortgages in 2022: $4,162 (0.7%) Median real estate property taxes paid for housing units with no mortgage in 2022: $3,901 (0.8%)
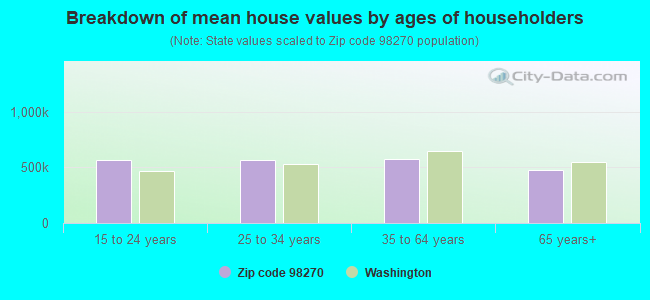
Estimated median house/condo value in 2022: $560,478
98270:
$560,478
Washington:
$569,500
According to our research of Washington and other state lists, there were 37 registered sex offenders living in 98270 zip code as of April 27, 2024. The ratio of all residents to sex offenders in zip code 98270 is 1,343 to 1. The ratio of registered sex offenders to all residents in this zip code is near the state average.
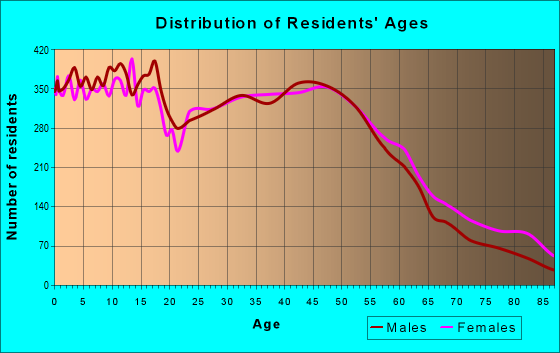
Median resident age:
This zip code:
38.0 years
Washington median age:
38.4 years
Average household size:
This zip code:
2.7 people
Washington:
2.5 people
Averages for the 2020 tax year for zip code 98270, filed in 2021:
Average Adjusted Gross Income (AGI) in 2020: $70,329 (Individual Income Tax Returns)
Here:
$70,329
State:
$99,264
Salary/wage: $62,657 (reported on 86.0% of returns)
Here:
$62,657
State:
$80,347
(% of AGI for various income ranges: 1084.7% for AGIs below $25k, 3459.8% for AGIs $25k-50k, 6300.1% for AGIs $50k-75k, 9552.7% for AGIs $75k-100k, 17661.6% for AGIs $100k-200k, 51104.3% for AGIs over 200k)
Taxable interest for individuals: $739 (reported on 26.8% of returns)
This zip code:
$739
Washington:
$2,077
(% of AGI for various income ranges: 11.8% for AGIs below $25k, 12.1% for AGIs $25k-50k, 16.9% for AGIs $50k-75k, 25.7% for AGIs $75k-100k, 50.3% for AGIs $100k-200k, 382.3% for AGIs over 200k)
Ordinary dividends: $3,012 (reported on 13.8% of returns)
Here:
$3,012
State:
$10,013
(% of AGI for various income ranges: 17.6% for AGIs below $25k, 20.1% for AGIs $25k-50k, 37.7% for AGIs $50k-75k, 54.9% for AGIs $75k-100k, 89.2% for AGIs $100k-200k, 1143.3% for AGIs over 200k)
Net capital gain/loss in AGI: +$12,101 (reported on 12.7% of returns)
Here:
+$12,101
State:
+$40,092
(% of AGI for various income ranges: 6.1% for AGIs below $25k, 14.1% for AGIs $25k-50k, 40.5% for AGIs $50k-75k, 72.9% for AGIs $75k-100k, 241.4% for AGIs $100k-200k, 9205.3% for AGIs over 200k)
Profit/loss from business: +$12,859 (reported on 11.1% of returns)
Here:
+$12,859
State:
+$18,312
(% of AGI for various income ranges: 71.2% for AGIs below $25k, 108.0% for AGIs $25k-50k, 189.2% for AGIs $50k-75k, 249.6% for AGIs $75k-100k, 343.4% for AGIs $100k-200k, 1539.0% for AGIs over 200k)
Taxable individual retirement arrangement distribution: $19,492 (reported on 6.1% of returns)
98270:
$19,492
Washington:
$24,221
(% of AGI for various income ranges: 45.2% for AGIs below $25k, 52.1% for AGIs $25k-50k, 124.1% for AGIs $50k-75k, 193.5% for AGIs $75k-100k, 340.2% for AGIs $100k-200k, 2053.3% for AGIs over 200k)
Self-employed (Keogh) retirement plans: $11,100 (reported on 0.2% of returns)
98270:
$11,100
Washington:
$24,166
(% of AGI for various income ranges: 2.6% for AGIs $25k-50k, 12.7% for AGIs $100k-200k)
Total itemized deductions: $29,879 (reported on 10.7% of returns)
Here:
$29,879
State:
$39,068
(% of AGI for various income ranges: 50.7% for AGIs below $25k, 122.9% for AGIs $25k-50k, 360.8% for AGIs $50k-75k, 595.3% for AGIs $75k-100k, 891.2% for AGIs $100k-200k, 6223.3% for AGIs over 200k)
Charity contributions: $6,389 (reported on 7.1% of returns)
Here:
$6,389
State:
$15,331
(% of AGI for various income ranges: 2.4% for AGIs below $25k, 9.6% for AGIs $25k-50k, 38.0% for AGIs $50k-75k, 61.6% for AGIs $75k-100k, 155.3% for AGIs $100k-200k, 1103.3% for AGIs over 200k)
Taxes paid: $6,387 (reported on 10.5% of returns)
98270:
$6,387
State:
$7,774
(% of AGI for various income ranges: 9.0% for AGIs below $25k, 27.3% for AGIs $25k-50k, 87.7% for AGIs $50k-75k, 138.1% for AGIs $75k-100k, 213.0% for AGIs $100k-200k, 810.0% for AGIs over 200k)
Earned income credit: $2,024 (reported on 9.5% of returns)
Here:
$2,024
State:
$2,020
(% of AGI for various income ranges: 61.3% for AGIs below $25k, 42.5% for AGIs $25k-50k, 0.8% for AGIs $50k-75k)
Percentage of individuals using paid preparers for their 2020 taxes: 94.0%
Here:
94%
State:
93%
(% for various income ranges: 92.6% for AGIs below $25k, 94.2% for AGIs $25k-50k, 94.4% for AGIs $50k-75k, 94.4% for AGIs $75k-100k, 94.7% for AGIs $100k-200k, 92.9% for AGIs over 200k)
Averages for the 2012 tax year for zip code 98270, filed in 2013:
Average Adjusted Gross Income (AGI) in 2012: $55,202 (Individual Income Tax Returns)
Here:
$55,202
State:
$69,533
Salary/wage: $51,235 (reported on 87.6% of returns)
Here:
$51,235
State:
$57,267
(% of AGI for various income ranges: 76.1% for AGIs below $25k, 81.7% for AGIs $25k-50k, 82.7% for AGIs $50k-75k, 86.6% for AGIs $75k-100k, 86.5% for AGIs $100k-200k, 44.0% for AGIs over 200k)
Taxable interest for individuals: $650 (reported on 34.2% of returns)
This zip code:
$650
Washington:
$1,816
(% of AGI for various income ranges: 0.8% for AGIs below $25k, 0.4% for AGIs $25k-50k, 0.3% for AGIs $50k-75k, 0.4% for AGIs $75k-100k, 0.3% for AGIs $100k-200k, 0.7% for AGIs over 200k)
Ordinary dividends: $1,935 (reported on 14.7% of returns)
Here:
$1,935
State:
$8,163
(% of AGI for various income ranges: 1.4% for AGIs below $25k, 0.5% for AGIs $25k-50k, 0.4% for AGIs $50k-75k, 0.4% for AGIs $75k-100k, 0.4% for AGIs $100k-200k, 1.0% for AGIs over 200k)
Net capital gain/loss in AGI: +$3,811 (reported on 9.7% of returns)
Here:
+$3,811
State:
+$21,568
(% of AGI for various income ranges: 0.2% for AGIs $50k-75k, 0.1% for AGIs $75k-100k, 0.3% for AGIs $100k-200k, 7.5% for AGIs over 200k)
Profit/loss from business: +$12,173 (reported on 10.0% of returns)
Here:
+$12,173
State:
+$16,521
(% of AGI for various income ranges: 4.9% for AGIs below $25k, 2.5% for AGIs $25k-50k, 1.9% for AGIs $50k-75k, 1.2% for AGIs $75k-100k, 1.5% for AGIs $100k-200k, 5.2% for AGIs over 200k)
Taxable individual retirement arrangement distribution: $13,858 (reported on 7.3% of returns)
98270:
$13,858
Washington:
$18,648
(% of AGI for various income ranges: 2.5% for AGIs below $25k, 1.8% for AGIs $25k-50k, 1.6% for AGIs $50k-75k, 1.6% for AGIs $75k-100k, 2.0% for AGIs $100k-200k, 1.7% for AGIs over 200k)
Self-employment retirement plans: $8,800 (reported on 0.2% of returns)
98270:
$8,800
Washington:
$20,087
Total itemized deductions: $19,662 (22% of AGI, reported on 35.2% of returns)
Here:
$19,662
State:
$23,872
Here:
21.9% of AGI
State:
18.2% of AGI
(% of AGI for various income ranges: 9.2% for AGIs below $25k, 10.3% for AGIs $25k-50k, 13.0% for AGIs $50k-75k, 14.4% for AGIs $75k-100k, 13.5% for AGIs $100k-200k, 10.5% for AGIs over 200k)
Charity contributions: $2,876 (reported on 26.7% of returns)
Here:
$2,876
State:
$4,465
(% of AGI for various income ranges: 0.6% for AGIs below $25k, 0.8% for AGIs $25k-50k, 1.2% for AGIs $50k-75k, 1.5% for AGIs $75k-100k, 1.9% for AGIs $100k-200k, 1.6% for AGIs over 200k)
Taxes paid: $4,491 (reported on 34.9% of returns)
98270:
$4,491
State:
$6,400
(% of AGI for various income ranges: 1.6% for AGIs below $25k, 2.1% for AGIs $25k-50k, 2.9% for AGIs $50k-75k, 3.3% for AGIs $75k-100k, 3.3% for AGIs $100k-200k, 2.2% for AGIs over 200k)
Earned income credit: $2,087 (reported on 14.0% of returns)
Here:
$2,087
State:
$2,073
(% of AGI for various income ranges: 5.1% for AGIs below $25k, 1.0% for AGIs $25k-50k)
Percentage of individuals using paid preparers for their 2012 taxes: 43.0%
Here:
43%
State:
43%
(% for various income ranges: 39.2% for AGIs below $25k, 43.0% for AGIs $25k-50k, 44.6% for AGIs $50k-75k, 45.1% for AGIs $75k-100k, 46.4% for AGIs $100k-200k, 65.0% for AGIs over 200k)
Averages for the 2004 tax year for zip code 98270, filed in 2005:
Average Adjusted Gross Income (AGI) in 2004: $45,584 (Individual Income Tax Returns)
Here:
$45,584
State:
$54,331
Salary/wage: $42,390 (reported on 88.0% of returns)
Here:
$42,390
State:
$45,761
(% of AGI for various income ranges: 120.3% for AGIs below $10k, 76.0% for AGIs $10k-25k, 85.1% for AGIs $25k-50k, 87.0% for AGIs $50k-75k, 87.7% for AGIs $75k-100k, 66.3% for AGIs over 100k)
Taxable interest for individuals: $1,099 (reported on 40.5% of returns)
This zip code:
$1,099
Washington:
$2,110
(% of AGI for various income ranges: 5.6% for AGIs below $10k, 2.2% for AGIs $10k-25k, 0.8% for AGIs $25k-50k, 0.6% for AGIs $50k-75k, 0.7% for AGIs $75k-100k, 1.2% for AGIs over 100k)
Taxable dividends: $1,786 (reported on 22.0% of returns)
Here:
$1,786
State:
$5,879
(% of AGI for various income ranges: 3.8% for AGIs below $10k, 1.3% for AGIs $10k-25k, 0.6% for AGIs $25k-50k, 0.5% for AGIs $50k-75k, 0.5% for AGIs $75k-100k, 1.6% for AGIs over 100k)
Net capital gain/loss: +$5,632 (reported on 16.3% of returns)
Here:
+$5,632
State:
+$15,835
(% of AGI for various income ranges: -2.1% for AGIs below $10k, 0.1% for AGIs $10k-25k, 0.5% for AGIs $25k-50k, 0.6% for AGIs $50k-75k, 1.0% for AGIs $75k-100k, 7.2% for AGIs over 100k)
Profit/loss from business: +$9,181 (reported on 11.8% of returns)
Here:
+$9,181
State:
+$13,994
(% of AGI for various income ranges: -1.0% for AGIs below $10k, 3.8% for AGIs $10k-25k, 2.2% for AGIs $25k-50k, 2.1% for AGIs $50k-75k, 1.7% for AGIs $75k-100k, 3.3% for AGIs over 100k)
IRA payment deduction: $2,800 (reported on 1.8% of returns)
98270:
$2,800
Washington:
$3,001
(% of AGI for various income ranges: 0.1% for AGIs $10k-25k, 0.1% for AGIs $25k-50k, 0.1% for AGIs $50k-75k, 0.1% for AGIs $75k-100k, 0.1% for AGIs over 100k)
Self-employed pension: $9,969 (reported on 0.4% of returns)
Here:
$9,969
Washington:
$14,244
Total itemized deductions: $16,710 (25% of AGI, reported on 43.6% of returns)
Here:
$16,710
State:
$19,669
Here:
25.0% of AGI
State:
20.7% of AGI
(% of AGI for various income ranges: 22.4% for AGIs below $10k, 11.7% for AGIs $10k-25k, 15.7% for AGIs $25k-50k, 18.8% for AGIs $50k-75k, 17.6% for AGIs $75k-100k, 12.5% for AGIs over 100k)
Charity contributions deductions: $2,256 (3% of AGI, reported on 35.6% of returns)
Here:
$2,256
State:
$3,569
Here:
3.2% of AGI
State:
3.5% of AGI
(% of AGI for various income ranges: 1.1% for AGIs below $10k, 1.0% for AGIs $10k-25k, 1.3% for AGIs $25k-50k, 1.9% for AGIs $50k-75k, 2.1% for AGIs $75k-100k, 2.1% for AGIs over 100k)
Total tax: $5,542 (reported on 78.3% of returns)
98270:
$5,542
State:
$9,065
(% of AGI for various income ranges: 2.8% for AGIs below $10k, 4.1% for AGIs $10k-25k, 6.4% for AGIs $25k-50k, 8.0% for AGIs $50k-75k, 9.6% for AGIs $75k-100k, 16.9% for AGIs over 100k)
Earned income credit: $1,601 (reported on 12.1% of returns)
Here:
$1,601
State:
$1,607
Percentage of individuals using paid preparers for their 2004 taxes: 51.4%
Here:
51%
State:
49%
(% for various income ranges: 42.0% for AGIs below $10k, 53.8% for AGIs $10k-25k, 53.9% for AGIs $25k-50k, 51.1% for AGIs $50k-75k, 50.7% for AGIs $75k-100k, 57.3% for AGIs over 100k)
Likely homosexual households (counted as self-reported same-sex unmarried-partner households)
Lesbian couples: 0.1% of all households
Gay men: 0.1% of all households
Household received Food Stamps/SNAP in the past 12 months: 1,892 Household did not receive Food Stamps/SNAP in the past 12 months: 17,733
Women who had a birth in the past 12 months: 663 (454 now married, 200 unmarried) Women who did not have a birth in the past 12 months: 12,375 (5,806 now married, 6,560 unmarried)
Housing units in zip code 98270 with a mortgage: 10,097 (900 second mortgage, 26 home equity loan, 687 both second mortgage and home equity loan) Houses without a mortgage: 73
Median monthly owner costs for units with a mortgage: $2,188 Median monthly owner costs for units without a mortgage: $680
Residents with income below the poverty level in 2022:
This zip code:
6.9%
Whole state:
10.0%
Residents with income below 50% of the poverty level in 2022:
This zip code:
3.2%
Whole state:
4.6%
Median number of rooms in houses and condos:
Here:
6.3
State:
6.5
Median number of rooms in apartments:
Here:
4.4
State:
3.9
Notable locations in this zip code not listed on our city pages
Notable locations in zip code 98270: Schons Family Dairy Farm (A), Neff Farms (B), Cedar Crest Golf Course (C), Woodinville Town Center (D), Kellogg Marsh Grange (E), Marysville Ash Avenue Park and Ride (F), Marysville I Park and Ride (G), Brookside Mobile Recreational Vehicle Park (H), Maryville Fred Meyer (I), Geddes Marina (J), Marysville Sewage Treatment Plant (K), Northwest Ambulance (L), Marysville Fire District / Snohomish County Fire District 12 Station 66 (M), Ken Baxter Senior Community Center (N), Grandview Village Retirement Community (O), Merrill Gardens at Marysville (P), Marysville Care Center (Q), Madeleine Villa Health Care Center (R), Marysville Public Safety Building (S), Marysville Fire District / Snohomish County Fire District 12 Station 62 (T). Display/hide their locations on the map
Churches in zip code 98270 include: Marysville Christian Church (A), Kingdom Hall of Jehovahs Witnesses (B), The Church of Jesus Christ of Latter Day Saints (C), Ninety - Second Street Church of Christ (D), Allen Creek Community Church (E), Allen Creek Baptist Church (F), First Baptist Church (G), Evergreen Unitarian Universalist Fellowship Church (H), Saint Philip's Episcopal Church (I). Display/hide their locations on the map
8,086 married couples with children.
2,230 single-parent households (428 men, 1,802 women).
80.1% of residents of 98270 zip code speak English at home.
7.9% of residents speak Spanish at home (70% very well, 21% well, 9% not well, 1% not at all).
5.9% of residents speak other Indo-European language at home (65% very well, 23% well, 10% not well, 2% not at all).
4.9% of residents speak Asian or Pacific Island language at home (63% very well, 22% well, 13% not well, 2% not at all).
1.2% of residents speak other language at home (92% very well, 2% well, 1% not well, 6% not at all).
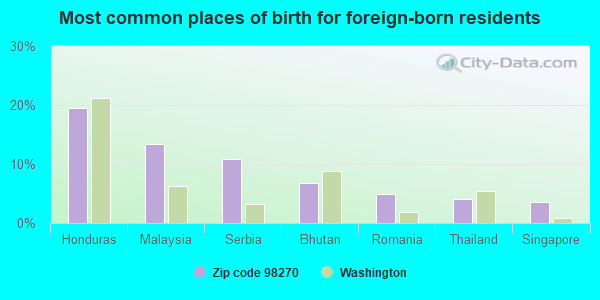
Foreign born population: 6,577 (12.3%) (63.7% of them are naturalized citizens)
Major facilities with environmental interests located in this zip code:
ALTAS PET GALLERY (1250 A STATE AVENUE in MARYSVILLE, WA)
(Integrated Compliance Information System) - ICIS-10-2004-0050, FORMAL ENFORCEMENT ACTION, ENFORCEMENT/COMPLIANCE ACTIVITY (Integrated Compliance Information System) - ICIS-10-2004-0050, FORMAL ENFORCEMENT ACTION, ENFORCEMENT/COMPLIANCE ACTIVITY COMPLIANCE ACTIVITY (Tracking inspections of insecticide, fungicide, and rodenticide, and toxic substances) Alternative names: ALTA PET GALLERY
BOEING S&CS TULALIP TEST SITE (11224 34TH AVE NE in MARYSVILLE, WA) . Tribal Land
COMPLIANCE ACTIVITY (Tracking inspections of insecticide, fungicide, and rodenticide, and toxic substances) HAZARDOUS WASTE BIENNIAL REPORTER (Resource Conservation and Recovery Act (tracking hazardous waste)) (Resource Conservation and Recovery Act (tracking hazardous waste)) STATE MASTER (Washington State Department of Ecology's Facility/Site identification system) - TOXICS-NW0616, VOLUNTARY CLEAN UP PROGRAM, TOXICS-, GROUND WATER PROGRAM, HAZWASTE-WAD980185789, HAZARDOUS WASTE PROGRAM, EPCRA Business SIC classification: AIRCRAFT; AIRCRAFT PARTS AND AUXILIARY EQUIPMENT Business NAICS classification: AIRCRAFT MANUFACTURING.; AIRCRAFT MANUFACTURING. Organizations: JAMES JOHNSTONE (CONTACT/OPERATOR)
, BOEING CO (CONTACT/OWNER)
Alternative names: BOEING A&M TULALIP TEST SITE, BOEING AEROSPACE CO TULALIP TEST SITE, TULALIP AMMUN BACKUP STORAGE
ARROW MACHINING COMPANY INCORPORATED (7224 44TH AVE NE in MARYSVILLE, WA)
HAZARDOUS WASTE BIENNIAL REPORTER (Resource Conservation and Recovery Act (tracking hazardous waste)) (Resource Conservation and Recovery Act (tracking hazardous waste)) STATE MASTER (Washington State Department of Ecology's Facility/Site identification system) - HAZWASTE-WA0000312942, HAZARDOUS WASTE PROGRAM, Business SIC classification: INDUSTRIAL AND COMMERCIAL MACHINERY AND EQUIPMENT Organizations: CLINT OSBORN (CONTACT/OPERATOR)
, ARROW MACHINING CO INC (CONTACT/OWNER)
Alternative names: ARROW MACHINING CO INC
CHEVRON 99609 (1206 4TH ST in MARYSVILLE, WA)
(Resource Conservation and Recovery Act (tracking hazardous waste)) STATE MASTER (Washington State Department of Ecology's Facility/Site identification system) - TOXICS-5263, LEAKING STORAGE TANK, UNDERGROUND STORAGE TANK PROGRAM, HAZWASTE-WAD988489605, EPCRA, HAZARDOUS WASTE PROGRAM Business SIC classification: GASOLINE SERVICE STATIONS Organizations: APSI (CONTACT/OPERATOR)
, CHEVRON PRODUCTS CO (CONTACT/OWNER)
Alternative names: PDQ OIL CO 1103
ARCO 4390 (1124 4TH ST in MARYSVILLE, WA)
(Resource Conservation and Recovery Act (tracking hazardous waste)) STATE MASTER (Washington State Department of Ecology's Facility/Site identification system) - TOXICS-8767, UNDERGROUND STORAGE TANK PROGRAM, HAZWASTE-WAD988514667, EPCRA Business SIC classification: GASOLINE SERVICE STATIONS Organizations: KID ASHER INC DBA MARYSVILLE AM PM (CONTACT/OPERATOR)
, BP WEST COAST PRODUCTS (CONTACT/OWNER)
Alternative names: ARCO 04390
BIG O TIRES 4 LESS MARYSVILLE (70 C STATE AVE in MARYSVILLE, WA)
Conditionally Exempt Small Quantity Generators, less than 100 kg/month of hazardous waste (Resource Conservation and Recovery Act (tracking hazardous waste)) - notification STATE MASTER (Washington State Department of Ecology's Facility/Site identification system) - HAZWASTE-WA0000258681, CESQG Business SIC classification: GENERAL AUTOMOTIVE REPAIR SHOPS Business NAICS classification: GENERAL AUTOMOTIVE REPAIR.; GENERAL AUTOMOTIVE REPAIR. Organizations: DAVCO ENTERPRISES INC (CONTACT/OWNER)
Alternative names: PYRAMIDS TIRES 4 LESS MARYSVILLE
CAPTAIN DIZZY EXXON (1203 STATE AVE in MARYSVILLE, WA)
(Resource Conservation and Recovery Act (tracking hazardous waste)) STATE MASTER (Washington State Department of Ecology's Facility/Site identification system) - TOXICS-439792, LEAKING STORAGE TANK, UNDERGROUND STORAGE TANK PROGRAM Organizations: DENNIS HOOFNAGLE (CONTACT/OPERATOR)
, JOHN HOOFNAGLE (CONTACT/OWNER)
Alternative names: OK TIRE FORMER SITE
CEDARCREST GOLF COURSE (7007 GROVE ST in MARYSVILLE, WA)
(Resource Conservation and Recovery Act (tracking hazardous waste)) STATE MASTER (Washington State Department of Ecology's Facility/Site identification system) - HAZWASTE-WA0000105650, HAZARDOUS WASTE PROGRAM Business SIC classification: PUBLIC GOLF COURSES Organizations: MARYSVILLE CITY (CONTACT/OPERATOR)
AMERICAN DRY CLEANERS (1518 GROVE ST in MARYSVILLE, WA)
Conditionally Exempt Small Quantity Generators, less than 100 kg/month of hazardous waste (Resource Conservation and Recovery Act (tracking hazardous waste)) - notification TRANSPORTER (Resource Conservation and Recovery Act (tracking hazardous waste)) STATE MASTER (Washington State Department of Ecology's Facility/Site identification system) - HAZWASTE-WAH000004598, CESQG Organizations: SUNG SEO (CONTACT/OPERATOR)
AARONS AUTOMOTIVE & TRUCK REPAIR (7625 44TH AVE NE in MARYSVILLE, WA)
Conditionally Exempt Small Quantity Generators, less than 100 kg/month of hazardous waste (Resource Conservation and Recovery Act (tracking hazardous waste)) - notification STATE MASTER (Washington State Department of Ecology's Facility/Site identification system) - HAZWASTE-WA0000105601, CESQG Business SIC classification: GENERAL AUTOMOTIVE REPAIR SHOPS Business NAICS classification: GENERAL AUTOMOTIVE REPAIR.; GENERAL AUTOMOTIVE REPAIR. Organizations: DUANE AARON (CONTACT/OPERATOR)
, AARONS AUTOMOTIVE INC (CONTACT/OWNER)
Alternative names: AARONS AUTOMOTIVE INC, AARONS AUTOMOTIVE INC
BODY CRAFT INC (14616 SMOKEY PT BLVD in MARYSVILLE, WA)
Conditionally Exempt Small Quantity Generators, less than 100 kg/month of hazardous waste (Resource Conservation and Recovery Act (tracking hazardous waste)) - notification STATE MASTER (Washington State Department of Ecology's Facility/Site identification system) - HAZWASTE-WAD982659963, CESQG Business SIC classification: TOP, BODY, AND UPHOLSTERY REPAIR SHOPS AND PAINT SHOPS Business NAICS classification: AUTOMOTIVE BODY, PAINT, AND INTERIOR REPAIR AND MAINTENANCE.; AUTOMOTIVE BODY, PAINT, AND INTERIOR REPAIR AND MAINTENANCE. Organizations: RON BAUER (CONTACT/OPERATOR)
BP SERVICE STATION 11263 (1221 4TH AVE in MARYSVILLE, WA)
Conditionally Exempt Small Quantity Generators, less than 100 kg/month of hazardous waste (Resource Conservation and Recovery Act (tracking hazardous waste)) STATE MASTER (Washington State Department of Ecology's Facility/Site identification system) - TOXICS-10180, LEAKING STORAGE TANK, UNDERGROUND STORAGE TANK PROGRAM, HAZWASTE-WAD988487559, EPCRA, HAZARDOUS WASTE PROGRAM Business SIC classification: GASOLINE SERVICE STATIONS Organizations: SAMIR MESSIHA (CONTACT/OPERATOR)
, CONOCOPHILLIPS COMPANY (CONTACT/OWNER)
Alternative names: BP SERVICE STATION MARYSVILLE
CHARLIES STATE AVENUE COLLISION REPAIR (9015 STATE AVE in MARYSVILLE, WA)
Conditionally Exempt Small Quantity Generators, less than 100 kg/month of hazardous waste (Resource Conservation and Recovery Act (tracking hazardous waste)) STATE MASTER (Washington State Department of Ecology's Facility/Site identification system) - HAZWASTE-WAD981763469, CESQG Business SIC classification: TOP, BODY, AND UPHOLSTERY REPAIR SHOPS AND PAINT SHOPS Business NAICS classification: AUTOMOTIVE BODY, PAINT, AND INTERIOR REPAIR AND MAINTENANCE.; AUTOMOTIVE BODY, PAINT, AND INTERIOR REPAIR AND MAINTENANCE. Organizations: CHARLES CRUZEN (CONTACT/OPERATOR)
, CHARILES STATE AVENUE COLLISION REPAIR (CONTACT/OWNER)
Housing units lacking complete plumbing facilities: 0.3% Housing units lacking complete kitchen facilities: 0.3%
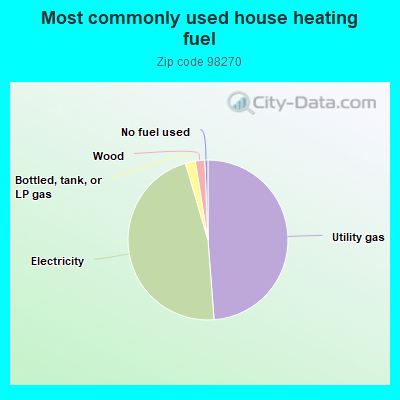
48.4%Utility gas
46.3%Electricity
2.0%Bottled, tank, or LP gas
1.9%Wood
0.6%No fuel used
Population in 1990: 19,966. Population change in the 1990s: +14,758 (+73.9%).
Place of birth for U.S.-born residents:
This state: 28,878
Northeast: 1,350
Midwest: 3,489
South: 2,310
West: 9,963
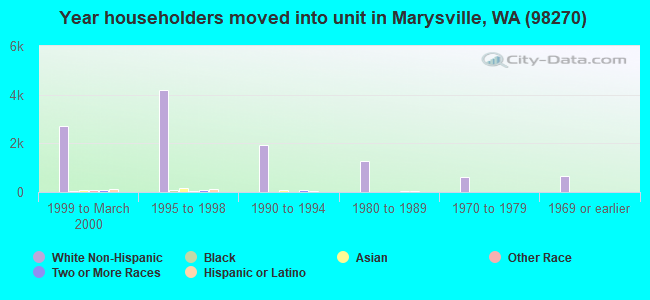
43% of the 98270 zip code residents lived in the same house 5 years ago. Out of people who lived in different houses, 62% lived in this county. Out of people who lived in different counties, 50% lived in Washington.
90% of the 98270 zip code residents lived in the same house 1 year ago. Out of people who lived in different houses, 64% moved from this county. Out of people who lived in different houses, 21% moved from different county within same state. Out of people who lived in different houses, 11% moved from different state. Out of people who lived in different houses, 3% moved from abroad.
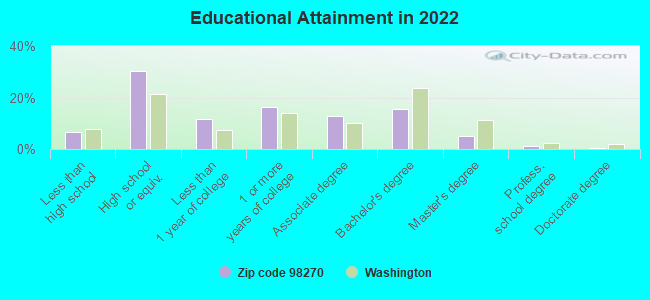
Private vs. public school enrollment:
Students in private schools in grades 1 to 8 (elementary and middle school): 688
Here:
13.7%
Washington:
12.4%
Students in private schools in grades 9 to 12 (high school): 136
Here:
5.0%
Washington:
9.2%
Students in private undergraduate colleges: 330
Here:
18.3%
Washington:
16.5%
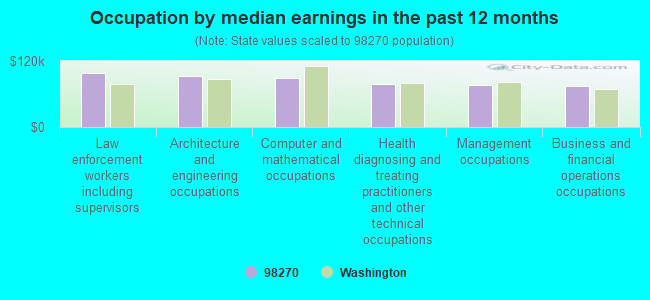
Occupation by median earnings in the past 12 months ($)
98,659Law enforcement workers including supervisors
93,181Architecture and engineering occupations
88,608Computer and mathematical occupations
77,838Health diagnosing and treating practitioners and other technical occupations
76,364Management occupations
73,661Business and financial operations occupations
Companies with federal contracts located in this zip code (MARYSVILLE, WA):
D E W MANAGEMENT SERVICES INC (5019 GROVE ST STE 101A; small business) : $22,460,407 in 33 contractsfrom 1999 to 2003
Contracts for Operation of Government-Owned Facilities -- Dining Facilities, Food Services, Other Management Support Services, Technical Representation Services -- Food Preparation and Serving Equipment by Navy, Air Force, Army Signed by year:2000: $8,632,766; 2001: $7,976,805; 2002: $1,463,222; 2003: $232,094; 2004: $0; 2005: $0; 2006: $0.
Biggest contracts:
$4,312,035 with Navy for Operation of Government-Owned Facilities -- Dining Facilities. Taking place in CA. Signed on 2001-10-01. Completion date: 2003-09-30.
$3,504,679, same as above.Signed on 2000-10-01. Completion date: 2001-09-30.
$3,212,623, same as above.Signed on 1999-11-01. Completion date: 2000-09-30.
$1,671,585 with Navy for Food Services. Taking place in FL. Signed on 2001-03-14. Completion date: 2001-04-03.
D.E.W JOINT VENTURE (6812 74TH DR NE; small business) : $373,486 in 2 contractsin 2001
$247,682 with Navy for Food Services. Taking place in HI. Signed on 2001-10-01. Completion date: 2001-11-30.
$125,804, same as above.Signed on 2001-12-01. Completion date: 2001-12-31.
NORDIC MARINE FLOATS OF ALASKA (604 CEDAR AVE; small business)
$43,300 with Navy for Pontoons And Floating Docks. Signed on 2005-08-19. Completion date: 2005-09-12.
TERRY WILLIAMS (7723 47th avenue; small business) : $6,500 in 4 contractsfrom 2003 to 2004
$7,500 with Department of State for Other Professional Services. Signed on 2004-08-31. Completion date: 2004-08-31.
$4,500, same as above.Signed on 2004-04-07. Effective on 2004-01-01. Completion date: 2004-12-31.
$2,000, same as above.Signed on 2003-12-02. Completion date: 2003-12-31.
-$7,500, same as above.Signed on 2004-09-16. Completion date: 2004-09-16.
CORROSION MITIGATION LLC (7023 76TH DR NE; small business)
$3,900 with Army for Construction of Structures and Facilities -- Fuel Supply Facilities. Signed on 2004-06-03. Completion date: 2004-07-30.
AMERICAN CLEANERS INC (1518 GROVE STREET; small business)
$3,490 with Navy for Laundry and DryCleaning Services. Signed on 2004-10-19. Completion date: 2005-09-30.
HILZMAN, AMY (8206 47TH AVE NE, UNIT A; small business)
$810 with Navy for ADP Software, Equipment, and Telecommunications Training. Signed on 2005-04-18. Completion date: 2005-04-18.
Top industries in this zip code by the number of employees in 2005:
2002 - 2018 National Fire Incident Reporting System (NFIRS) incidents
According to the data from the years 2002 - 2018 the average number of fire incidents per year is 123. The highest number of reported fires - 242 took place in 2003, and the least - 29 in 2016. The data has a declining trend.
When looking into fire subcategories, the most incidents belonged to: Structure Fires (41.2%), and Outside Fires (37.4%).
Fire incident types reported to NFIRS in Zip Code 98270
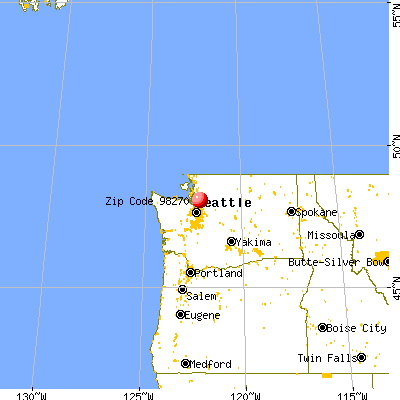


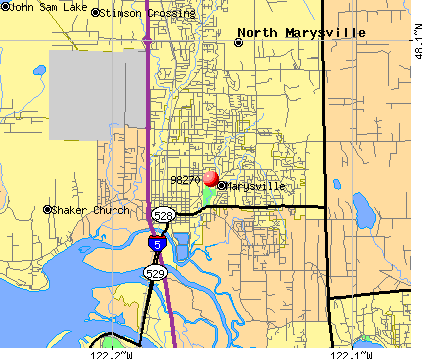 Nearest zip codes: 98205, 98258, 98201, 98271, 98207, 98203.


 According to the data from the years 2002 - 2018 the average number of fire incidents per year is 123. The highest number of reported fires - 242 took place in 2003, and the least - 29 in 2016. The data has a declining trend.
 When looking into fire subcategories, the most incidents belonged to: Structure Fires (41.2%), and Outside Fires (37.4%).