Estimated zip code population in 2022: 26,082 Zip code population in 2010: 20,987 Zip code population in 2000: 31,532
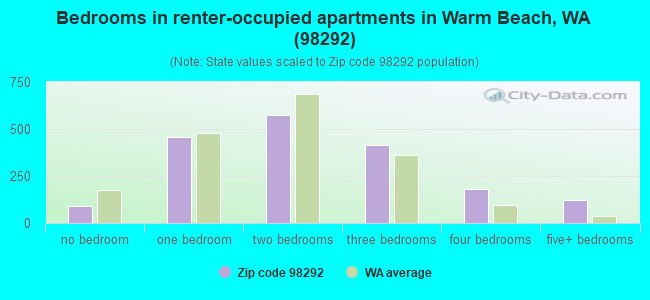
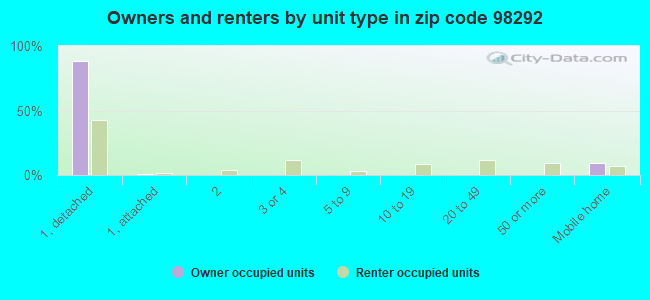
Houses and condos: 10,013 Renter-occupied apartments: 1,841
% of renters here:
19%
State:
36%
March 2022 cost of living index in zip code 98292: 112.6 (more than average, U.S. average is 100)
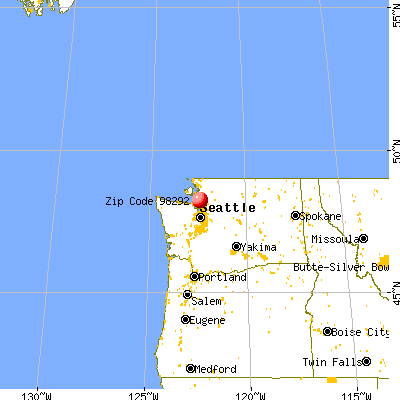
Land area: 74.5 sq. mi. Water area: 5.6 sq. mi.
Population density: 350 people per square mile
(very low).
OSM Map
General Map
Google Map
MSN Map
OSM Map
General Map
Google Map
MSN Map
OSM Map
General Map
Google Map
MSN Map
OSM Map
General Map
Google Map
MSN Map
Please wait while loading the map...
Real estate property taxes paid for housing units in 2022:
This zip code:
0.7% ($4,636)
Washington:
0.8% ($4,283)
Median real estate property taxes paid for housing units with mortgages in 2022: $4,639 (0.7%) Median real estate property taxes paid for housing units with no mortgage in 2022: $4,657 (0.7%)
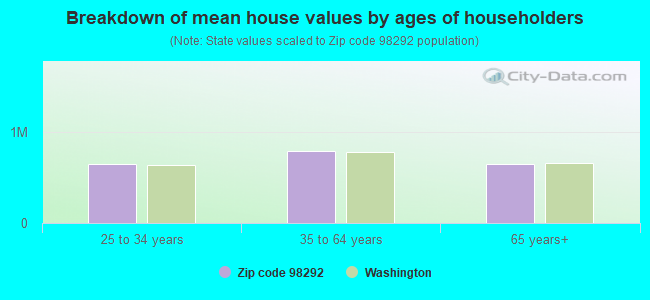
Estimated median house/condo value in 2022: $671,274
98292:
$671,274
Washington:
$569,500
According to our research of Washington and other state lists, there were 9 registered sex offenders living in 98292 zip code as of April 27, 2024. The ratio of all residents to sex offenders in zip code 98292 is 2,453 to 1. The ratio of registered sex offenders to all residents in this zip code is lower than the state average.
Median resident age:
This zip code:
41.9 years
Washington median age:
38.4 years
Average household size:
This zip code:
2.7 people
Washington:
2.5 people
Averages for the 2020 tax year for zip code 98292, filed in 2021:
Average Adjusted Gross Income (AGI) in 2020: $91,921 (Individual Income Tax Returns)
Here:
$91,921
State:
$99,264
Salary/wage: $75,159 (reported on 78.3% of returns)
Here:
$75,159
State:
$80,347
(% of AGI for various income ranges: 1070.8% for AGIs below $25k, 3216.1% for AGIs $25k-50k, 5918.1% for AGIs $50k-75k, 8840.2% for AGIs $75k-100k, 17670.6% for AGIs $100k-200k, 60635.2% for AGIs over 200k)
Taxable interest for individuals: $1,742 (reported on 38.8% of returns)
This zip code:
$1,742
Washington:
$2,077
(% of AGI for various income ranges: 28.8% for AGIs below $25k, 33.4% for AGIs $25k-50k, 50.1% for AGIs $50k-75k, 51.4% for AGIs $75k-100k, 102.6% for AGIs $100k-200k, 1534.1% for AGIs over 200k)
Ordinary dividends: $6,752 (reported on 21.8% of returns)
Here:
$6,752
State:
$10,013
(% of AGI for various income ranges: 44.0% for AGIs below $25k, 60.0% for AGIs $25k-50k, 108.6% for AGIs $50k-75k, 143.1% for AGIs $75k-100k, 239.8% for AGIs $100k-200k, 3344.4% for AGIs over 200k)
Net capital gain/loss in AGI: +$28,956 (reported on 20.8% of returns)
Here:
+$28,956
State:
+$40,092
(% of AGI for various income ranges: 15.0% for AGIs below $25k, 48.3% for AGIs $25k-50k, 129.6% for AGIs $50k-75k, 201.8% for AGIs $75k-100k, 535.5% for AGIs $100k-200k, 21947.4% for AGIs over 200k)
Profit/loss from business: +$18,411 (reported on 12.3% of returns)
Here:
+$18,411
State:
+$18,312
(% of AGI for various income ranges: 65.0% for AGIs below $25k, 114.4% for AGIs $25k-50k, 190.2% for AGIs $50k-75k, 244.0% for AGIs $75k-100k, 521.2% for AGIs $100k-200k, 3838.5% for AGIs over 200k)
Taxable individual retirement arrangement distribution: $24,291 (reported on 11.4% of returns)
98292:
$24,291
Washington:
$24,221
(% of AGI for various income ranges: 68.4% for AGIs below $25k, 119.2% for AGIs $25k-50k, 281.0% for AGIs $50k-75k, 460.2% for AGIs $75k-100k, 829.8% for AGIs $100k-200k, 2758.1% for AGIs over 200k)
Self-employed (Keogh) retirement plans: $19,300 (reported on 0.5% of returns)
98292:
$19,300
Washington:
$24,166
(% of AGI for various income ranges: 24.1% for AGIs $100k-200k, 271.5% for AGIs over 200k)
Total itemized deductions: $34,091 (reported on 15.1% of returns)
Here:
$34,091
State:
$39,068
(% of AGI for various income ranges: 109.6% for AGIs below $25k, 211.9% for AGIs $25k-50k, 431.5% for AGIs $50k-75k, 696.8% for AGIs $75k-100k, 1321.9% for AGIs $100k-200k, 7876.7% for AGIs over 200k)
Charity contributions: $8,700 (reported on 10.8% of returns)
Here:
$8,700
State:
$15,331
(% of AGI for various income ranges: 3.1% for AGIs below $25k, 16.2% for AGIs $25k-50k, 50.3% for AGIs $50k-75k, 65.4% for AGIs $75k-100k, 212.6% for AGIs $100k-200k, 2253.3% for AGIs over 200k)
Taxes paid: $7,273 (reported on 15.0% of returns)
98292:
$7,273
State:
$7,774
(% of AGI for various income ranges: 18.1% for AGIs below $25k, 37.7% for AGIs $25k-50k, 102.1% for AGIs $50k-75k, 157.6% for AGIs $75k-100k, 329.9% for AGIs $100k-200k, 1351.5% for AGIs over 200k)
Earned income credit: $1,839 (reported on 6.9% of returns)
Here:
$1,839
State:
$2,020
(% of AGI for various income ranges: 45.5% for AGIs below $25k, 37.2% for AGIs $25k-50k)
Percentage of individuals using paid preparers for their 2020 taxes: 93.0%
Here:
93%
State:
93%
(% for various income ranges: 90.0% for AGIs below $25k, 93.1% for AGIs $25k-50k, 94.4% for AGIs $50k-75k, 93.8% for AGIs $75k-100k, 93.8% for AGIs $100k-200k, 94.3% for AGIs over 200k)
Averages for the 2012 tax year for zip code 98292, filed in 2013:
Average Adjusted Gross Income (AGI) in 2012: $70,059 (Individual Income Tax Returns)
Here:
$70,059
State:
$69,533
Salary/wage: $57,997 (reported on 82.0% of returns)
Here:
$57,997
State:
$57,267
(% of AGI for various income ranges: 70.3% for AGIs below $25k, 73.5% for AGIs $25k-50k, 73.8% for AGIs $50k-75k, 74.8% for AGIs $75k-100k, 80.1% for AGIs $100k-200k, 33.8% for AGIs over 200k)
Taxable interest for individuals: $2,129 (reported on 44.7% of returns)
This zip code:
$2,129
Washington:
$1,816
(% of AGI for various income ranges: 2.0% for AGIs below $25k, 1.2% for AGIs $25k-50k, 1.0% for AGIs $50k-75k, 0.8% for AGIs $75k-100k, 0.6% for AGIs $100k-200k, 3.2% for AGIs over 200k)
Ordinary dividends: $5,557 (reported on 23.6% of returns)
Here:
$5,557
State:
$8,163
(% of AGI for various income ranges: 2.7% for AGIs below $25k, 1.2% for AGIs $25k-50k, 1.6% for AGIs $50k-75k, 1.1% for AGIs $75k-100k, 1.3% for AGIs $100k-200k, 3.7% for AGIs over 200k)
Net capital gain/loss in AGI: +$11,691 (reported on 18.3% of returns)
Here:
+$11,691
State:
+$21,568
(% of AGI for various income ranges: 0.2% for AGIs $25k-50k, 0.2% for AGIs $50k-75k, 0.7% for AGIs $75k-100k, 1.8% for AGIs $100k-200k, 11.5% for AGIs over 200k)
Profit/loss from business: +$13,979 (reported on 12.9% of returns)
Here:
+$13,979
State:
+$16,521
(% of AGI for various income ranges: 5.5% for AGIs below $25k, 3.1% for AGIs $25k-50k, 2.2% for AGIs $50k-75k, 2.3% for AGIs $75k-100k, 2.2% for AGIs $100k-200k, 2.6% for AGIs over 200k)
Taxable individual retirement arrangement distribution: $16,976 (reported on 11.9% of returns)
98292:
$16,976
Washington:
$18,648
(% of AGI for various income ranges: 4.0% for AGIs below $25k, 3.2% for AGIs $25k-50k, 3.0% for AGIs $50k-75k, 3.2% for AGIs $75k-100k, 3.0% for AGIs $100k-200k, 2.0% for AGIs over 200k)
Self-employment retirement plans: $12,733 (reported on 0.6% of returns)
98292:
$12,733
Washington:
$20,087
Total itemized deductions: $22,568 (20% of AGI, reported on 42.8% of returns)
Here:
$22,568
State:
$23,872
Here:
20.2% of AGI
State:
18.2% of AGI
(% of AGI for various income ranges: 15.2% for AGIs below $25k, 13.9% for AGIs $25k-50k, 16.4% for AGIs $50k-75k, 15.6% for AGIs $75k-100k, 15.1% for AGIs $100k-200k, 7.8% for AGIs over 200k)
Charity contributions: $3,536 (reported on 33.2% of returns)
Here:
$3,536
State:
$4,465
(% of AGI for various income ranges: 1.0% for AGIs below $25k, 1.3% for AGIs $25k-50k, 1.7% for AGIs $50k-75k, 1.6% for AGIs $75k-100k, 1.7% for AGIs $100k-200k, 2.0% for AGIs over 200k)
Taxes paid: $5,673 (reported on 42.5% of returns)
98292:
$5,673
State:
$6,400
(% of AGI for various income ranges: 3.4% for AGIs below $25k, 3.0% for AGIs $25k-50k, 3.8% for AGIs $50k-75k, 3.7% for AGIs $75k-100k, 4.0% for AGIs $100k-200k, 2.2% for AGIs over 200k)
Earned income credit: $1,949 (reported on 9.8% of returns)
Here:
$1,949
State:
$2,073
(% of AGI for various income ranges: 3.7% for AGIs below $25k, 0.7% for AGIs $25k-50k)
Percentage of individuals using paid preparers for their 2012 taxes: 46.1%
Here:
46%
State:
43%
(% for various income ranges: 38.2% for AGIs below $25k, 43.8% for AGIs $25k-50k, 49.4% for AGIs $50k-75k, 52.7% for AGIs $75k-100k, 50.8% for AGIs $100k-200k, 71.4% for AGIs over 200k)
Averages for the 2004 tax year for zip code 98292, filed in 2005:
Average Adjusted Gross Income (AGI) in 2004: $53,469 (Individual Income Tax Returns)
Here:
$53,469
State:
$54,331
Salary/wage: $45,736 (reported on 82.0% of returns)
Here:
$45,736
State:
$45,761
(% of AGI for various income ranges: 140.9% for AGIs below $10k, 67.9% for AGIs $10k-25k, 75.6% for AGIs $25k-50k, 77.5% for AGIs $50k-75k, 81.6% for AGIs $75k-100k, 55.5% for AGIs over 100k)
Taxable interest for individuals: $2,168 (reported on 51.6% of returns)
This zip code:
$2,168
Washington:
$2,110
(% of AGI for various income ranges: 14.7% for AGIs below $10k, 3.8% for AGIs $10k-25k, 2.2% for AGIs $25k-50k, 1.5% for AGIs $50k-75k, 1.5% for AGIs $75k-100k, 2.1% for AGIs over 100k)
Taxable dividends: $3,295 (reported on 31.3% of returns)
Here:
$3,295
State:
$5,879
(% of AGI for various income ranges: 10.0% for AGIs below $10k, 2.4% for AGIs $10k-25k, 1.4% for AGIs $25k-50k, 1.5% for AGIs $50k-75k, 1.2% for AGIs $75k-100k, 2.6% for AGIs over 100k)
Net capital gain/loss: +$13,051 (reported on 24.9% of returns)
Here:
+$13,051
State:
+$15,835
(% of AGI for various income ranges: -1.9% for AGIs below $10k, 1.3% for AGIs $10k-25k, 0.7% for AGIs $25k-50k, 1.0% for AGIs $50k-75k, 2.1% for AGIs $75k-100k, 14.9% for AGIs over 100k)
Profit/loss from business: +$14,867 (reported on 15.5% of returns)
Here:
+$14,867
State:
+$13,994
(% of AGI for various income ranges: 8.7% for AGIs below $10k, 5.2% for AGIs $10k-25k, 4.4% for AGIs $25k-50k, 3.9% for AGIs $50k-75k, 3.4% for AGIs $75k-100k, 4.8% for AGIs over 100k)
IRA payment deduction: $3,165 (reported on 3.0% of returns)
98292:
$3,165
Washington:
$3,001
(% of AGI for various income ranges: 0.3% for AGIs $10k-25k, 0.3% for AGIs $25k-50k, 0.2% for AGIs $50k-75k, 0.1% for AGIs $75k-100k, 0.1% for AGIs over 100k)
Self-employed pension: $10,640 (reported on 1.0% of returns)
Here:
$10,640
Washington:
$14,244
(% of AGI for various income ranges: 0.1% for AGIs $25k-50k, 0.1% for AGIs $50k-75k, 0.1% for AGIs $75k-100k, 0.3% for AGIs over 100k)
Total itemized deductions: $18,658 (24% of AGI, reported on 47.4% of returns)
Here:
$18,658
State:
$19,669
Here:
24.0% of AGI
State:
20.7% of AGI
(% of AGI for various income ranges: 34.5% for AGIs below $10k, 17.6% for AGIs $10k-25k, 17.3% for AGIs $25k-50k, 19.0% for AGIs $50k-75k, 18.9% for AGIs $75k-100k, 12.8% for AGIs over 100k)
Charity contributions deductions: $2,749 (3% of AGI, reported on 38.9% of returns)
Here:
$2,749
State:
$3,569
Here:
3.3% of AGI
State:
3.5% of AGI
(% of AGI for various income ranges: 1.9% for AGIs below $10k, 1.7% for AGIs $10k-25k, 1.6% for AGIs $25k-50k, 2.0% for AGIs $50k-75k, 2.0% for AGIs $75k-100k, 2.2% for AGIs over 100k)
Total tax: $7,428 (reported on 80.9% of returns)
98292:
$7,428
State:
$9,065
(% of AGI for various income ranges: 6.4% for AGIs below $10k, 4.4% for AGIs $10k-25k, 6.9% for AGIs $25k-50k, 8.4% for AGIs $50k-75k, 9.7% for AGIs $75k-100k, 17.1% for AGIs over 100k)
Earned income credit: $1,526 (reported on 8.4% of returns)
Here:
$1,526
State:
$1,607
Percentage of individuals using paid preparers for their 2004 taxes: 51.7%
Here:
52%
State:
49%
(% for various income ranges: 38.7% for AGIs below $10k, 51.1% for AGIs $10k-25k, 51.8% for AGIs $25k-50k, 54.6% for AGIs $50k-75k, 53.4% for AGIs $75k-100k, 64.6% for AGIs over 100k)
Likely homosexual households (counted as self-reported same-sex unmarried-partner households)
Lesbian couples: 0.2% of all households
Gay men: 0.0% of all households
Household received Food Stamps/SNAP in the past 12 months: 745 Household did not receive Food Stamps/SNAP in the past 12 months: 8,697
Women who had a birth in the past 12 months: 332 (265 now married, 68 unmarried) Women who did not have a birth in the past 12 months: 4,809 (2,119 now married, 2,691 unmarried)
Housing units in zip code 98292 with a mortgage: 5,419 (546 second mortgage, 9 home equity loan, 499 both second mortgage and home equity loan) Houses without a mortgage: 35
Median monthly owner costs for units with a mortgage: $2,421 Median monthly owner costs for units without a mortgage: $747
Residents with income below the poverty level in 2022:
This zip code:
9.1%
Whole state:
10.0%
Residents with income below 50% of the poverty level in 2022:
This zip code:
4.5%
Whole state:
4.6%
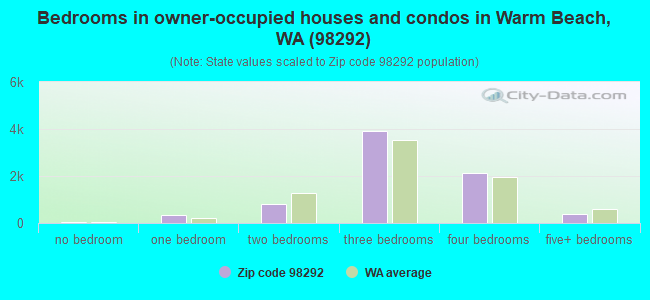
Median number of rooms in houses and condos:
Here:
6.4
State:
6.5
Median number of rooms in apartments:
Here:
4.4
State:
3.9
Notable locations in this zip code not listed on our city pages
Notable locations in zip code 98292: No Vu Dairy (A), Camano Vu Dairy (B), Kwant Dairy (C), Silwood Dairy Farms (D), Struiksma Dairy (E), Cliffhaven Jersey Farm (F), Normanna Farm (G), S and S Farms (H), Aqua Farm (I), Country Koi Farm (J), Eagle Tree Farm (K), Ellingsen Farm (L), Haflinger Haven Farm (M), Harvey Arabian Farms (N), Hillside Farm (O), Morning Glory Farms (P), Rainbow Bridge Farm (Q), Stalkfleet Farm (R), Talbot Tree Farm (S), Tazer Valley Farm (T). Display/hide their locations on the map
Churches in zip code 98292 include: Freeborn Church (A), Lighthouse Christian Fellowship Church (B), Seven Lakes Baptist Church (C), Cedarhome Seventh Day Adventist Church (D), Stanwood Foursquare Church (E), Cedarhome Baptist Church (F), Free Methodist Christian Church of Warm Beach (G), Kingdom Hall of Jehovahs Witnesses (H), New View Church (I). Display/hide their locations on the map
Lakes and reservoirs: Lake Rowland (A), Cummings Lake (B), Lake Shoecraft (C), Lake Martha (D), Sunday Lake (E), Lake Goodwin (F), Lake Howard (G), Irvine Slough (H). Display/hide their locations on the map
Streams, rivers, and creeks: Glade Bekken (A), Pilchuck Creek (B), Church Creek (C), Isohis Slough (D), South Slough (E), Steamboat Slough (F), Stillaguamish River (G), Tom Moore Slough (H), Freedom Creek (I). Display/hide their locations on the map
4,116 married couples with children.
1,302 single-parent households (678 men, 624 women).
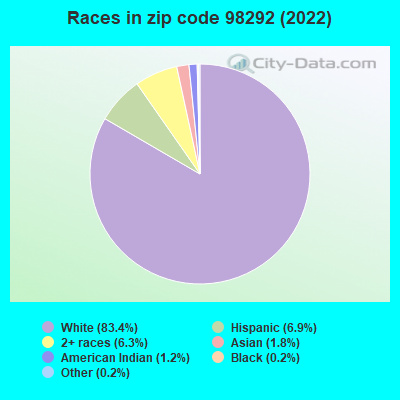
94.7% of residents of 98292 zip code speak English at home.
2.0% of residents speak Spanish at home (57% very well, 35% well, 8% not at all).
2.0% of residents speak other Indo-European language at home (77% very well, 21% well, 3% not well).
0.9% of residents speak Asian or Pacific Island language at home (78% very well, 16% well, 5% not well).
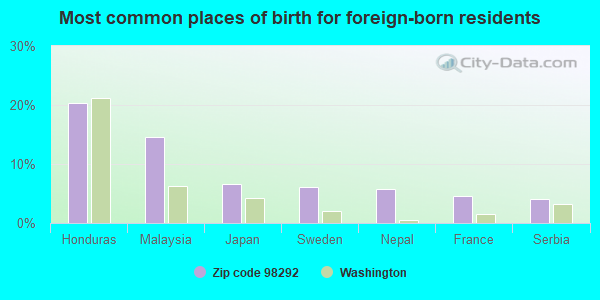
Foreign born population: 1,045 (4.0%) (71.5% of them are naturalized citizens)
This zip code:
4.0%
Whole state:
15.3%
20%Honduras
15%Malaysia
7%Japan
6%Sweden
6%Nepal
5%France
4%Serbia
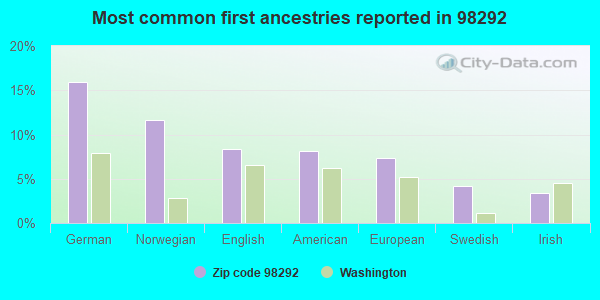
16%German
12%Norwegian
8%English
8%American
7%European
4%Swedish
3%Irish
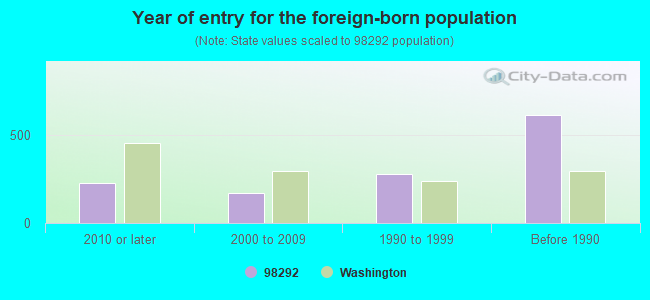
Year of entry for the foreign-born population
2272010 or later
1682000 to 2009
2781990 to 1999
615Before 1990
Facilities with environmental interests located in this zip code:
ABCO MACHINE INC 124TH ST (13205 NE 124TH STE B in STANWOOD, WA)
Conditionally Exempt Small Quantity Generators, less than 100 kg/month of hazardous waste (Resource Conservation and Recovery Act (tracking hazardous waste)) STATE MASTER (Washington State Department of Ecology's Facility/Site identification system) - HAZWASTE-WAD988507653, CESQG Business SIC classification: GENERAL AUTOMOTIVE REPAIR SHOPS Business NAICS classification: GENERAL AUTOMOTIVE REPAIR. Organizations: JIM HARTER (CONTACT/OPERATOR)
, TWIN CITY AUTO PARTS STORE (HAZARDOUS WASTE LAND OWNER)
ABCO MACHINE INC SARATOGA DR (10430 SARATOGA DR NW in STANWOOD, WA)
(Resource Conservation and Recovery Act (tracking hazardous waste)) STATE MASTER (Washington State Department of Ecology's Facility/Site identification system) - HAZWASTE-WAR000009514, CESQG Business SIC classification: GENERAL AUTOMOTIVE REPAIR SHOPS Organizations: JIM HARTER (CONTACT/OPERATOR)
CM'S 300 STREET PIT (3200 300TH ST NW in STANWOOD, WA)
National Pollutant Discharge Elimination System NON-MAJOR (Tracking pollutant discharge elimination systems) - permit STATE MASTER (Washington State Department of Ecology's Facility/Site identification system) - WATQUAL-WAG503285, National Pollutant Discharge Elimination System Permit Business SIC classification: CONSTRUCTION SAND AND GRAVEL; INDUSTRIAL SAND Organizations: CM TRUCKING AND CONSTRUCTION I (CONTACT/OPERATOR)
Alternative names: CM TRUCKING & CONSTRUCTION INC, CMS 300 ST PIT
CAMANO BODY SHOP INC (1196 EAST STATE ROAD 532 in CAMANO ISLAND, WA)
Conditionally Exempt Small Quantity Generators, less than 100 kg/month of hazardous waste (Resource Conservation and Recovery Act (tracking hazardous waste)) - notification STATE MASTER (Washington State Department of Ecology's Facility/Site identification system) - HAZWASTE-WAD131473381, CESQG Business SIC classification: TOP, BODY, AND UPHOLSTERY REPAIR SHOPS AND PAINT SHOPS Business NAICS classification: AUTOMOTIVE BODY, PAINT, AND INTERIOR REPAIR AND MAINTENANCE.; AUTOMOTIVE BODY, PAINT, AND INTERIOR REPAIR AND MAINTENANCE. Organizations: MIKE FISHER (CONTACT/OPERATOR)
CEDARHOME ELEMENTARY SCHOOL (27911 68TH AVENUE NW in STANWOOD, WA)
(National Center for Education Statistics) - STATE ID-4513 Organizations: STANWOOD-CAMANO SCHOOL DIST 401 (SCHOOL DISTRICT)
CLEVEN L H & J R WELLS DBA WE (T30N R3 S3 LOTS 21 THRU 28 in CAMANO ISLAND, WA)
(Integrated Compliance Information System) - ICIS-10-1979-0007, FORMAL ENFORCEMENT ACTION Business SIC classification: HIGHWAY AND STREET CONSTRUCTION, EXCEPT ELEVATED HIGHWAYS
BRYANT ESTATES CONSTRUCTN SITE (116 STANWOOD BRYANT ROAD in STANWOOD, WA)
ENFORCEMENT/COMPLIANCE ACTIVITY (Integrated Compliance Information System) National Pollutant Discharge Elimination System NON-MAJOR (Tracking pollutant discharge elimination systems) - permit Business SIC classification: GENERAL CONTRACTORS-SINGLE-FAMILY HOUSES Alternative names: 100-FOLD INVESTING LLC
Housing units lacking complete plumbing facilities: 1.0% Housing units lacking complete kitchen facilities: 1.4%
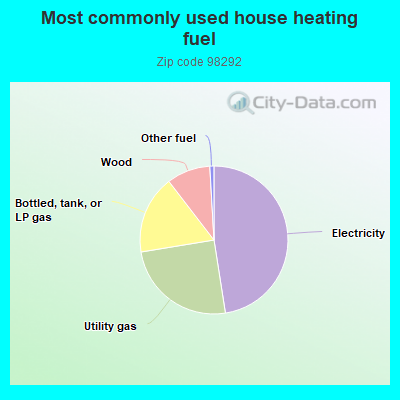
47.4%Electricity
24.8%Utility gas
17.1%Bottled, tank, or LP gas
9.5%Wood
0.9%Other fuel
Population in 1990: 19,288. Population change in the 1990s: +12,244 (+63.5%).
Place of birth for U.S.-born residents:
This state: 16,403
Northeast: 467
Midwest: 2,323
South: 859
West: 4,584
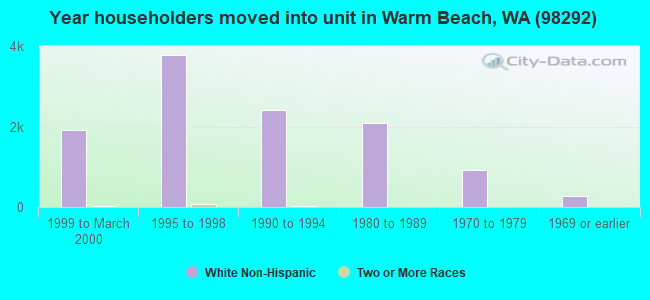
51% of the 98292 zip code residents lived in the same house 5 years ago. Out of people who lived in different houses, 42% lived in this county. Out of people who lived in different counties, 50% lived in Washington.
92% of the 98292 zip code residents lived in the same house 1 year ago. Out of people who lived in different houses, 63% moved from this county. Out of people who lived in different houses, 17% moved from different county within same state. Out of people who lived in different houses, 23% moved from different state.
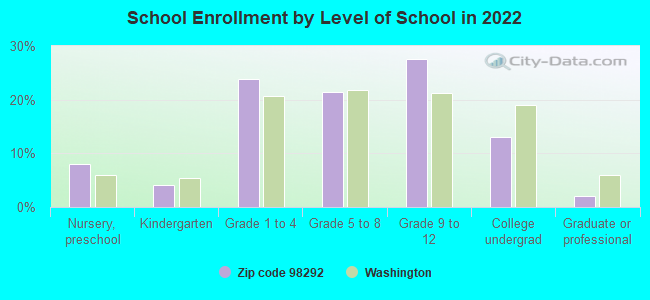
Private vs. public school enrollment:
Students in private schools in grades 1 to 8 (elementary and middle school): 624
Here:
23.0%
Washington:
12.4%
Students in private schools in grades 9 to 12 (high school): 162
Here:
9.9%
Washington:
9.2%
Students in private undergraduate colleges: 52
Here:
6.7%
Washington:
16.5%
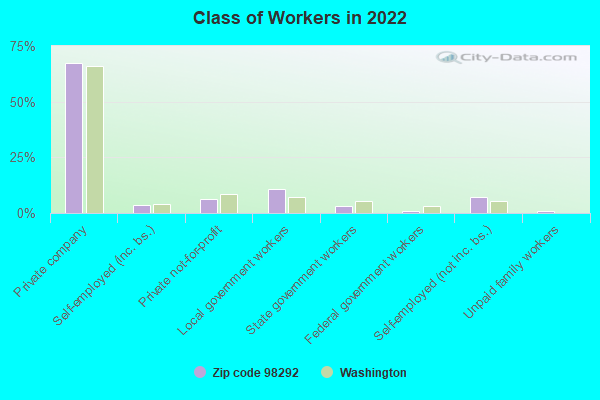
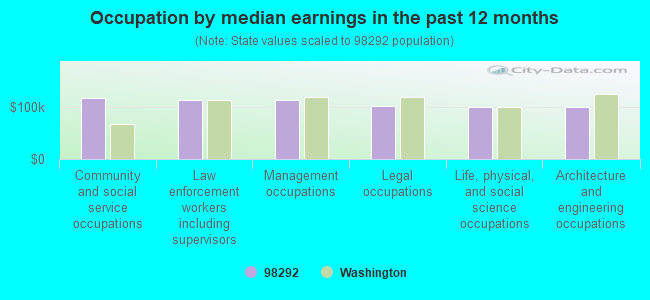
Occupation by median earnings in the past 12 months ($)
118,293Community and social service occupations
115,110Law enforcement workers including supervisors
113,920Management occupations
103,156Legal occupations
100,817Life, physical, and social science occupations
100,169Architecture and engineering occupations
Companies with federal contracts located in this zip code (STANWOOD, WA):
TWIN CITY FOODS, INC (10120 269TH PL NW; small business) 800 employees, $120000000 revenue. : $3,535,000 in 5 contractsfrom 2000 to 2002
Contracts for Fruits and Vegetables, Dairy Foods and Eggs by Agricultural Marketing Service (disused code) Signed by year:2000: $458,000; 2001: $272,000; 2002: $2,805,000; 2003: $0; 2004: $0; 2005: $0; 2006: $0.
Biggest contracts:
$2,805,000 with Agricultural Marketing Service (disused code) for Fruits and Vegetables. Taking place in MI. Signed on 2002-07-15. Completion date: 2002-12-15.
$368,000 with Agricultural Marketing Service (disused code) for Dairy Foods and Eggs. Signed on 2000-09-15. Completion date: 2001-01-15.
$211,000 with Agricultural Marketing Service (disused code) for Fruits and Vegetables. Taking place in MI. Signed on 2001-01-15. Completion date: 2001-05-15.
$90,000 with Agricultural Marketing Service (disused code) for Dairy Foods and Eggs. Signed on 2000-10-15. Completion date: 2001-03-15.
NCS CORPORATION (33014 ENGLISH GRADE ROAD; small business)
$121,467 with Air Force for Maintenance, Repair and Rebuilding of Equipment -- Communication, Detection, and Coherent Radiation Equipment. Signed on 2003-06-30. Completion date: 2003-12-31.
JACQUELINE SCHENKEL (31316 78TH DRIVE NW; small business) : $107,907 in 2 contractsfrom 2000 to 2001
$54,747 with Navy for Nursing Services. Signed on 2001-09-19. Completion date: 2002-09-30.
$53,160, same as above.Signed on 2000-10-01. Completion date: 2001-09-29.
LARRY SANDE DRAGLINE SERVICE (31225 PIONEER HWY; small business) : $23,030 in 2 contractsfrom 1999 to 2000
$24,300 with U.S. Army Corps of Engineers - civil program financing only for Maintenance, Repair or Alteration of Real Property -- Other Non-Building Facilities. Signed on 1999-10-07. Completion date: 1999-10-31.
-$1,270, same as above.Signed on 2000-09-05. Completion date: 1999-10-19.
ANDRES, LESLIE A (32112 24TH AVE NW; small business)
$6,500 with Navy for Court Reporting Services. Signed on 2006-04-11. Completion date: 2006-04-14.
Top industries in this zip code by the number of employees in 2005:
Health Care and Social Assistance: Nursing Care Facilities (250-499 employees: 1 establishment)
Other Services (except Public Administration): Religious Organizations (100-249: 1, 10-19: 2, 5-9: 5, 1-4: 5)
Health Care and Social Assistance: Continuing Care Retirement Communities (100-249: 1, 50-99: 1)
2002 - 2018 National Fire Incident Reporting System (NFIRS) incidents
According to the data from the years 2002 - 2018 the average number of fire incidents per year is 117. The highest number of fires - 244 took place in 2003, and the least - 10 in 2016. The data has a dropping trend.
When looking into fire subcategories, the most incidents belonged to: Structure Fires (42.8%), and Outside Fires (35.3%).
Fire incident types reported to NFIRS in Zip Code 98292


 Nearest zip codes: 98238, 98271, 98282, 98273, 98274, 98260.


 According to the data from the years 2002 - 2018 the average number of fire incidents per year is 117. The highest number of fires - 244 took place in 2003, and the least - 10 in 2016. The data has a dropping trend.
 When looking into fire subcategories, the most incidents belonged to: Structure Fires (42.8%), and Outside Fires (35.3%).