Estimated zip code population in 2022: 7,623 Zip code population in 2010: 6,340 Zip code population in 2000: 6,564
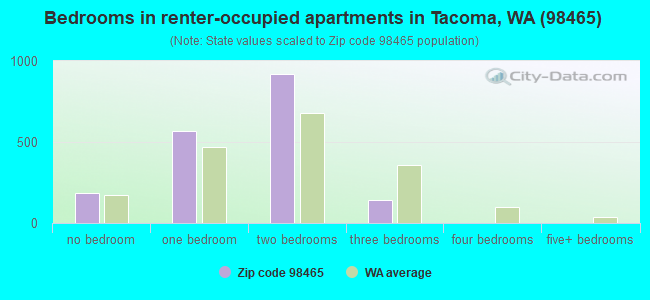
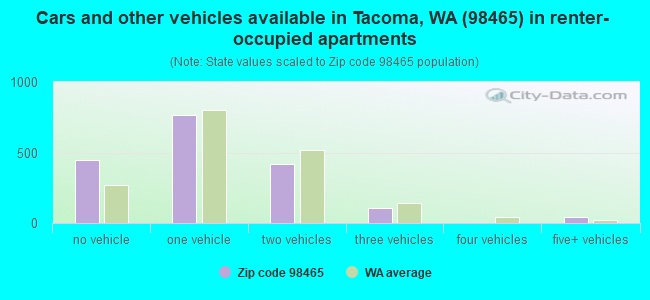
Houses and condos: 3,956 Renter-occupied apartments: 1,788
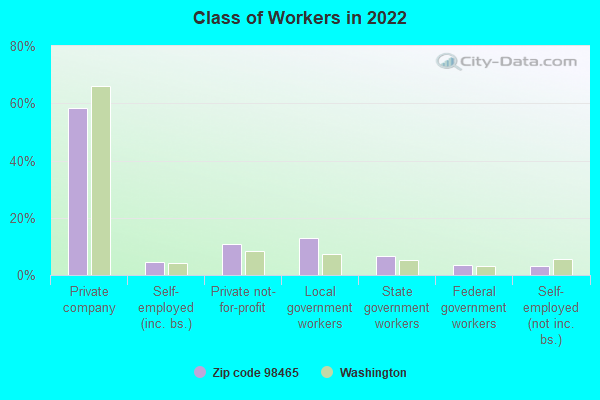
% of renters here:
47%
State:
36%
March 2022 cost of living index in zip code 98465: 111.4 (more than average, U.S. average is 100)
Land area: 1.7 sq. mi. Water area: 0.7 sq. mi.
Population density: 4,587 people per square mile
(average).
OSM Map
General Map
Google Map
MSN Map
OSM Map
General Map
Google Map
MSN Map
OSM Map
General Map
Google Map
MSN Map
OSM Map
General Map
Google Map
MSN Map
Please wait while loading the map...
Real estate property taxes paid for housing units in 2022:
This zip code:
1.0% ($5,695)
Washington:
0.8% ($4,283)
Median real estate property taxes paid for housing units with mortgages in 2022: $5,355 (0.9%) Median real estate property taxes paid for housing units with no mortgage in 2022: $5,970 (1.1%)
Business Search- 14 Million verified businesses
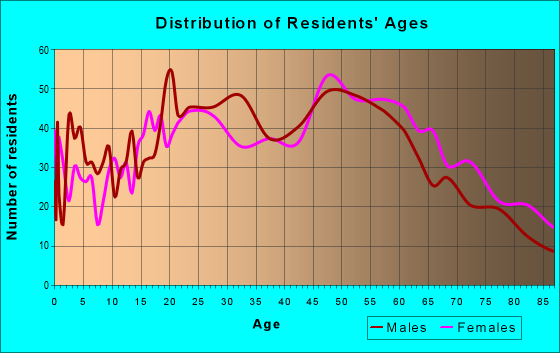
Males: 3,648
(47.9%)
Females: 3,974
(52.1%)
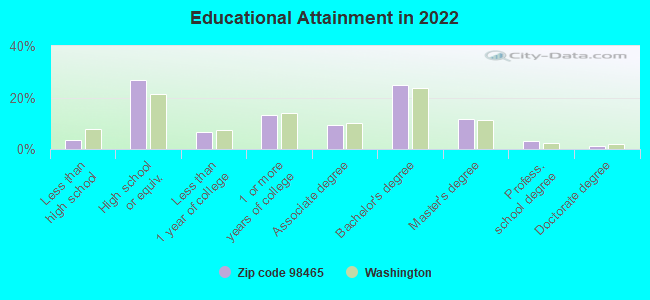
For population 25 years and over in 98465:
High school or higher: 96.5%
Bachelor's degree or higher: 40.8%
Graduate or professional degree: 15.8%
Unemployed: 3.3%
Mean travel time to work (commute): 24.6 minutes
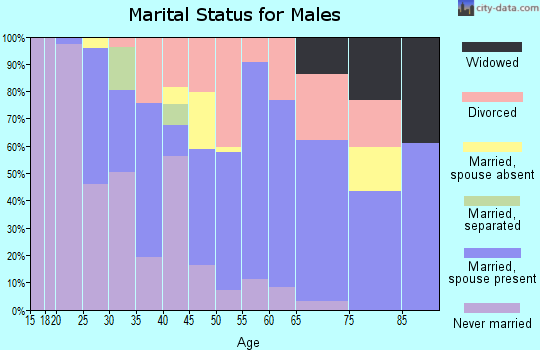
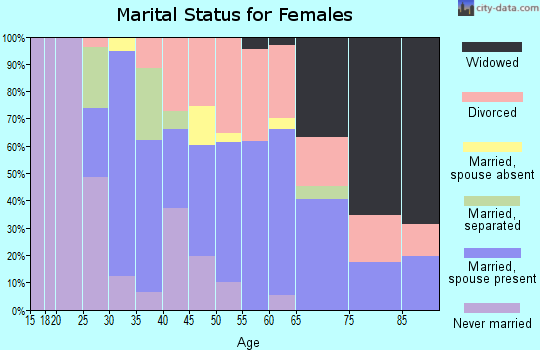
For population 15 years and over in 98465:
Never married: 33.0%
Now married: 42.0%
Separated: 1.4%
Widowed: 8.1%
Divorced: 15.4%
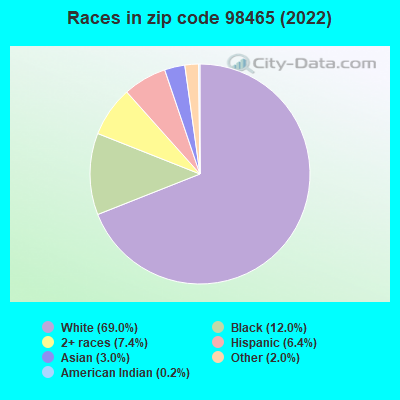
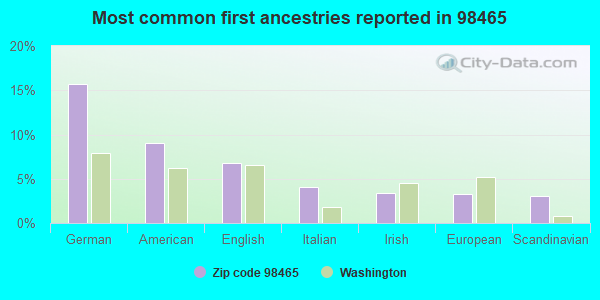
Zip code 98465 compared to state average:
Black race population percentage significantly above state average.
Hispanic race population percentage below state average.
Foreign-born population percentage below state average.
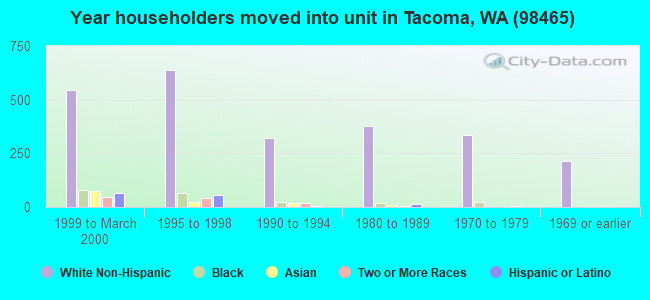
Length of stay since moving in significantly above state average.
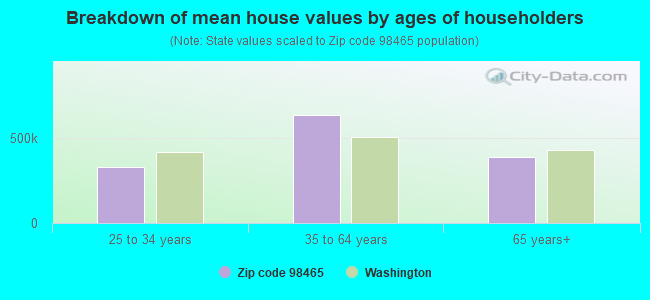
Estimated median house/condo value in 2022: $584,177
98465:
$584,177
Washington:
$569,500
According to our research of Washington and other state lists, there were 2 registered sex offenders living in 98465 zip code as of April 26, 2024. The ratio of all residents to sex offenders in zip code 98465 is 3,217 to 1. The ratio of registered sex offenders to all residents in this zip code is much lower than the state average.
Median resident age:
This zip code:
41.5 years
Washington median age:
38.4 years
Average household size:
This zip code:
2.0 people
Washington:
2.5 people
Averages for the 2020 tax year for zip code 98465, filed in 2021:
Average Adjusted Gross Income (AGI) in 2020: $74,370 (Individual Income Tax Returns)
Here:
$74,370
State:
$99,264
Salary/wage: $63,218 (reported on 80.1% of returns)
Here:
$63,218
State:
$80,347
(% of AGI for various income ranges: 1122.6% for AGIs below $25k, 3382.4% for AGIs $25k-50k, 6299.8% for AGIs $50k-75k, 9750.4% for AGIs $75k-100k, 17213.7% for AGIs $100k-200k, 75297.1% for AGIs over 200k)
Taxable interest for individuals: $1,624 (reported on 28.3% of returns)
This zip code:
$1,624
Washington:
$2,077
(% of AGI for various income ranges: 16.8% for AGIs below $25k, 20.5% for AGIs $25k-50k, 24.8% for AGIs $50k-75k, 105.0% for AGIs $75k-100k, 198.7% for AGIs $100k-200k, 704.3% for AGIs over 200k)
Ordinary dividends: $5,790 (reported on 21.5% of returns)
Here:
$5,790
State:
$10,013
(% of AGI for various income ranges: 25.5% for AGIs below $25k, 50.5% for AGIs $25k-50k, 120.2% for AGIs $50k-75k, 222.9% for AGIs $75k-100k, 554.0% for AGIs $100k-200k, 1975.7% for AGIs over 200k)
Net capital gain/loss in AGI: +$12,904 (reported on 20.4% of returns)
Here:
+$12,904
State:
+$40,092
(% of AGI for various income ranges: 15.7% for AGIs below $25k, 41.6% for AGIs $25k-50k, 78.5% for AGIs $50k-75k, 258.3% for AGIs $75k-100k, 930.0% for AGIs $100k-200k, 8325.7% for AGIs over 200k)
Profit/loss from business: +$19,996 (reported on 12.3% of returns)
Here:
+$19,996
State:
+$18,312
(% of AGI for various income ranges: 64.3% for AGIs below $25k, 90.5% for AGIs $25k-50k, 242.8% for AGIs $50k-75k, 307.1% for AGIs $75k-100k, 1202.3% for AGIs $100k-200k, 3844.3% for AGIs over 200k)
Taxable individual retirement arrangement distribution: $24,938 (reported on 8.9% of returns)
98465:
$24,938
Washington:
$24,221
(% of AGI for various income ranges: 35.7% for AGIs below $25k, 72.8% for AGIs $25k-50k, 188.7% for AGIs $50k-75k, 405.8% for AGIs $75k-100k, 1015.0% for AGIs $100k-200k, 3875.7% for AGIs over 200k)
Self-employed (Keogh) retirement plans: $25,300 (reported on 0.5% of returns)
98465:
$25,300
Washington:
$24,166
(% of AGI for various income ranges: 168.7% for AGIs $100k-200k)
Total itemized deductions: $31,424 (reported on 11.0% of returns)
Here:
$31,424
State:
$39,068
(% of AGI for various income ranges: 73.2% for AGIs below $25k, 114.5% for AGIs $25k-50k, 300.9% for AGIs $50k-75k, 629.6% for AGIs $75k-100k, 1285.7% for AGIs $100k-200k, 7045.7% for AGIs over 200k)
Charity contributions: $9,238 (reported on 8.9% of returns)
Here:
$9,238
State:
$15,331
(% of AGI for various income ranges: 25.8% for AGIs $25k-50k, 52.6% for AGIs $50k-75k, 123.8% for AGIs $75k-100k, 307.0% for AGIs $100k-200k, 2095.7% for AGIs over 200k)
Taxes paid: $7,340 (reported on 11.0% of returns)
98465:
$7,340
State:
$7,774
(% of AGI for various income ranges: 13.8% for AGIs below $25k, 26.4% for AGIs $25k-50k, 73.3% for AGIs $50k-75k, 161.2% for AGIs $75k-100k, 337.7% for AGIs $100k-200k, 1458.6% for AGIs over 200k)
Earned income credit: $1,831 (reported on 11.0% of returns)
Here:
$1,831
State:
$2,020
(% of AGI for various income ranges: 58.4% for AGIs below $25k, 38.4% for AGIs $25k-50k)
Percentage of individuals using paid preparers for their 2020 taxes: 93.2%
Here:
93%
State:
93%
(% for various income ranges: 92.9% for AGIs below $25k, 94.1% for AGIs $25k-50k, 92.2% for AGIs $50k-75k, 92.3% for AGIs $75k-100k, 92.9% for AGIs $100k-200k, 95.5% for AGIs over 200k)
Averages for the 2012 tax year for zip code 98465, filed in 2013:
Average Adjusted Gross Income (AGI) in 2012: $58,353 (Individual Income Tax Returns)
Here:
$58,353
State:
$69,533
Salary/wage: $47,629 (reported on 79.5% of returns)
Here:
$47,629
State:
$57,267
(% of AGI for various income ranges: 71.6% for AGIs below $25k, 77.8% for AGIs $25k-50k, 71.2% for AGIs $50k-75k, 70.1% for AGIs $75k-100k, 66.6% for AGIs $100k-200k, 45.4% for AGIs over 200k)
Taxable interest for individuals: $1,424 (reported on 34.5% of returns)
This zip code:
$1,424
Washington:
$1,816
(% of AGI for various income ranges: 0.9% for AGIs below $25k, 0.9% for AGIs $25k-50k, 0.7% for AGIs $50k-75k, 1.0% for AGIs $75k-100k, 1.0% for AGIs $100k-200k, 0.7% for AGIs over 200k)
Ordinary dividends: $5,904 (reported on 21.7% of returns)
Here:
$5,904
State:
$8,163
(% of AGI for various income ranges: 2.9% for AGIs below $25k, 1.6% for AGIs $25k-50k, 1.5% for AGIs $50k-75k, 1.9% for AGIs $75k-100k, 2.4% for AGIs $100k-200k, 2.8% for AGIs over 200k)
Net capital gain/loss in AGI: +$3,278 (reported on 18.3% of returns)
Here:
+$3,278
State:
+$21,568
(% of AGI for various income ranges: 0.5% for AGIs $50k-75k, 1.1% for AGIs $75k-100k, 1.7% for AGIs $100k-200k, 1.9% for AGIs over 200k)
Profit/loss from business: +$17,203 (reported on 10.2% of returns)
Here:
+$17,203
State:
+$16,521
(% of AGI for various income ranges: 4.2% for AGIs below $25k, 2.4% for AGIs $25k-50k, 2.2% for AGIs $50k-75k, 3.2% for AGIs $75k-100k, 3.8% for AGIs $100k-200k, 2.8% for AGIs over 200k)
Taxable individual retirement arrangement distribution: $18,111 (reported on 11.2% of returns)
98465:
$18,111
Washington:
$18,648
(% of AGI for various income ranges: 2.6% for AGIs below $25k, 2.0% for AGIs $25k-50k, 3.4% for AGIs $50k-75k, 4.1% for AGIs $75k-100k, 4.9% for AGIs $100k-200k, 3.3% for AGIs over 200k)
Self-employment retirement plans: $15,300 (reported on 0.6% of returns)
98465:
$15,300
Washington:
$20,087
Total itemized deductions: $22,753 (21% of AGI, reported on 31.4% of returns)
Here:
$22,753
State:
$23,872
Here:
20.9% of AGI
State:
18.2% of AGI
(% of AGI for various income ranges: 9.3% for AGIs below $25k, 10.8% for AGIs $25k-50k, 12.1% for AGIs $50k-75k, 15.8% for AGIs $75k-100k, 16.6% for AGIs $100k-200k, 8.4% for AGIs over 200k)
Charity contributions: $4,442 (reported on 25.8% of returns)
Here:
$4,442
State:
$4,465
(% of AGI for various income ranges: 0.6% for AGIs below $25k, 1.0% for AGIs $25k-50k, 1.1% for AGIs $50k-75k, 1.9% for AGIs $75k-100k, 2.8% for AGIs $100k-200k, 2.9% for AGIs over 200k)
Taxes paid: $6,587 (reported on 31.1% of returns)
98465:
$6,587
State:
$6,400
(% of AGI for various income ranges: 2.3% for AGIs below $25k, 3.0% for AGIs $25k-50k, 3.2% for AGIs $50k-75k, 4.2% for AGIs $75k-100k, 5.3% for AGIs $100k-200k, 2.5% for AGIs over 200k)
Earned income credit: $1,824 (reported on 14.3% of returns)
Here:
$1,824
State:
$2,073
(% of AGI for various income ranges: 4.1% for AGIs below $25k, 0.7% for AGIs $25k-50k)
Percentage of individuals using paid preparers for their 2012 taxes: 42.5%
Here:
43%
State:
43%
(% for various income ranges: 34.5% for AGIs below $25k, 41.6% for AGIs $25k-50k, 46.8% for AGIs $50k-75k, 48.3% for AGIs $75k-100k, 54.8% for AGIs $100k-200k, 70.0% for AGIs over 200k)
Averages for the 2004 tax year for zip code 98465, filed in 2005:
Average Adjusted Gross Income (AGI) in 2004: $45,306 (Individual Income Tax Returns)
Here:
$45,306
State:
$54,331
Salary/wage: $38,079 (reported on 81.9% of returns)
Here:
$38,079
State:
$45,761
(% of AGI for various income ranges: 152.5% for AGIs below $10k, 75.6% for AGIs $10k-25k, 80.4% for AGIs $25k-50k, 75.6% for AGIs $50k-75k, 72.5% for AGIs $75k-100k, 53.3% for AGIs over 100k)
Taxable interest for individuals: $2,563 (reported on 40.9% of returns)
This zip code:
$2,563
Washington:
$2,110
(% of AGI for various income ranges: 6.0% for AGIs below $10k, 1.9% for AGIs $10k-25k, 0.9% for AGIs $25k-50k, 1.3% for AGIs $50k-75k, 2.7% for AGIs $75k-100k, 3.5% for AGIs over 100k)
Taxable dividends: $4,371 (reported on 26.4% of returns)
Here:
$4,371
State:
$5,879
(% of AGI for various income ranges: 8.8% for AGIs below $10k, 1.6% for AGIs $10k-25k, 1.3% for AGIs $25k-50k, 1.4% for AGIs $50k-75k, 2.9% for AGIs $75k-100k, 3.8% for AGIs over 100k)
Net capital gain/loss: +$8,459 (reported on 21.2% of returns)
Here:
+$8,459
State:
+$15,835
(% of AGI for various income ranges: -1.1% for AGIs below $10k, -0.3% for AGIs $10k-25k, 0.0% for AGIs $25k-50k, 0.9% for AGIs $50k-75k, 1.6% for AGIs $75k-100k, 9.7% for AGIs over 100k)
Profit/loss from business: +$16,672 (reported on 12.2% of returns)
Here:
+$16,672
State:
+$13,994
(% of AGI for various income ranges: 5.7% for AGIs below $10k, 3.2% for AGIs $10k-25k, 2.3% for AGIs $25k-50k, 2.6% for AGIs $50k-75k, 1.3% for AGIs $75k-100k, 8.0% for AGIs over 100k)
IRA payment deduction: $2,676 (reported on 2.3% of returns)
98465:
$2,676
Washington:
$3,001
(% of AGI for various income ranges: 0.2% for AGIs $10k-25k, 0.2% for AGIs $25k-50k, 0.3% for AGIs $50k-75k, 0.1% for AGIs over 100k)
Self-employed pension: $16,088 (reported on 1.1% of returns)
Here:
$16,088
Washington:
$14,244
Total itemized deductions: $18,459 (21% of AGI, reported on 32.1% of returns)
Here:
$18,459
State:
$19,669
Here:
21.5% of AGI
State:
20.7% of AGI
(% of AGI for various income ranges: 17.9% for AGIs below $10k, 9.4% for AGIs $10k-25k, 10.5% for AGIs $25k-50k, 15.0% for AGIs $50k-75k, 16.7% for AGIs $75k-100k, 13.1% for AGIs over 100k)
Charity contributions deductions: $3,619 (4% of AGI, reported on 27.7% of returns)
Here:
$3,619
State:
$3,569
Here:
3.9% of AGI
State:
3.5% of AGI
(% of AGI for various income ranges: 0.8% for AGIs below $10k, 0.8% for AGIs $10k-25k, 1.1% for AGIs $25k-50k, 2.2% for AGIs $50k-75k, 2.8% for AGIs $75k-100k, 3.1% for AGIs over 100k)
Total tax: $7,344 (reported on 76.3% of returns)
98465:
$7,344
State:
$9,065
(% of AGI for various income ranges: 3.5% for AGIs below $10k, 4.3% for AGIs $10k-25k, 7.8% for AGIs $25k-50k, 10.1% for AGIs $50k-75k, 10.7% for AGIs $75k-100k, 19.1% for AGIs over 100k)
Earned income credit: $1,513 (reported on 13.7% of returns)
Here:
$1,513
State:
$1,607
Percentage of individuals using paid preparers for their 2004 taxes: 50.0%
Here:
50%
State:
49%
(% for various income ranges: 41.6% for AGIs below $10k, 51.7% for AGIs $10k-25k, 47.8% for AGIs $25k-50k, 51.8% for AGIs $50k-75k, 50.0% for AGIs $75k-100k, 68.2% for AGIs over 100k)
Likely homosexual households (counted as self-reported same-sex unmarried-partner households)
Lesbian couples: 0.0% of all households
Gay men: 0.4% of all households
Household received Food Stamps/SNAP in the past 12 months: 446 Household did not receive Food Stamps/SNAP in the past 12 months: 3,377
Women who had a birth in the past 12 months: 155 (106 now married, 47 unmarried) Women who did not have a birth in the past 12 months: 1,576 (544 now married, 1,037 unmarried)
Housing units in zip code 98465 with a mortgage: 1,277 (119 second mortgage, 13 home equity loan, 101 both second mortgage and home equity loan) Houses without a mortgage: 14
Median monthly owner costs for units with a mortgage: $2,292 Median monthly owner costs for units without a mortgage: $804
Residents with income below the poverty level in 2022:
This zip code:
7.4%
Whole state:
10.0%
Residents with income below 50% of the poverty level in 2022:
This zip code:
4.4%
Whole state:
4.6%
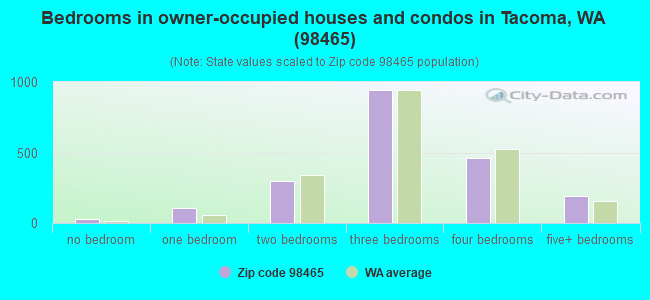
Median number of rooms in houses and condos:
Here:
6.4
State:
6.5
Median number of rooms in apartments:
Here:
3.5
State:
3.9
Notable locations in this zip code not listed on our city pages
Churches in zip code 98465 include: Saint Andrews Episcopal Church (A), Central Seventh Day Adventist Church (B), Highland Hill Baptist Church (C), First Christian Church (D). Display/hide their locations on the map
In group quarters: 90 (-1 institutionalized population)
Size of family households: 948 2-persons, 477 3-persons, 379 4-persons, 70 6-persons
Size of nonfamily households: 1,640 1-person, 322 2-persons, 13 3-persons
749 married couples with children.
346 single-parent households (122 men, 224 women).
90.8% of residents of 98465 zip code speak English at home.
1.8% of residents speak Spanish at home (57% very well, 43% well).
2.8% of residents speak other Indo-European language at home (56% very well, 26% well, 19% not well).
2.6% of residents speak Asian or Pacific Island language at home (38% very well, 56% well, 6% not well).
1.5% of residents speak other language at home (45% very well, 41% well, 14% not well).
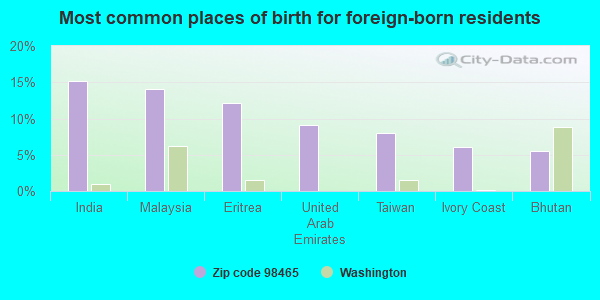
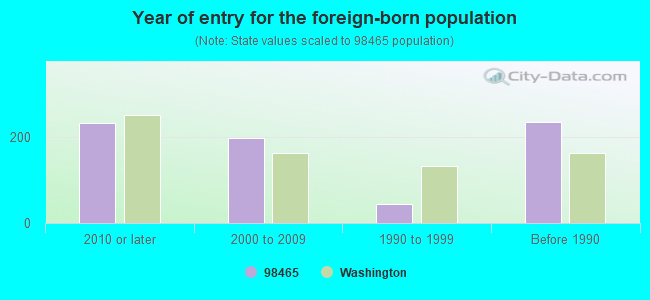
Foreign born population: 654 (8.6%) (61.9% of them are naturalized citizens)
Facilities with environmental interests located in this zip code:
BRUSER CONSTRUCTION (1317 S PEARL ST in TACOMA, WA)
(Resource Conservation and Recovery Act (tracking hazardous waste)) STATE MASTER (Washington State Department of Ecology's Facility/Site identification system) - HAZWASTE-WAR000009423, HAZARDOUS WASTE PROGRAM Business SIC classification: GENERAL CONTRACTORS-RESIDENTIAL BUILDINGS, OTHER THAN SINGLE-FAMILY Business NAICS classification: NEW MULTIFAMILY HOUSING CONSTRUCTION (EXCEPT OPERATIVE BUILDERS).; NEW MULTIFAMILY HOUSING CONSTRUCTION (EXCEPT OPERATIVE BUILDERS). Organizations: MARK BRUSER (CONTACT/OPERATOR)
COMP MENTAL HEALTH (815 SO PEARL in TACOMA, WA)
(National Center for Education Statistics) - STATE ID-4283 Organizations: TACOMA SCH DIST 10 (SCHOOL DISTRICT)
Housing units lacking complete plumbing facilities: 0.9% Housing units lacking complete kitchen facilities: 2.2%
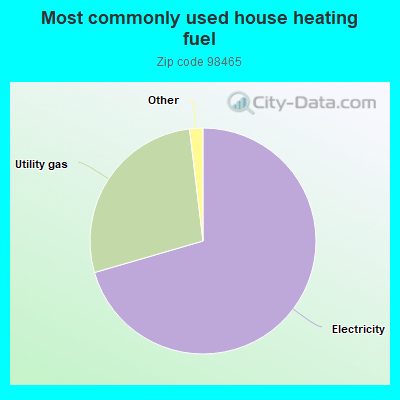
70.5%Electricity
27.6%Utility gas
0.9%Bottled, tank, or LP gas
0.7%Wood
Population in 1990: 6,919.
Place of birth for U.S.-born residents:
This state: 4,153
Northeast: 325
Midwest: 672
South: 557
West: 1,179
52% of the 98465 zip code residents lived in the same house 5 years ago. Out of people who lived in different houses, 74% lived in this county. Out of people who lived in different counties, 50% lived in Washington.
88% of the 98465 zip code residents lived in the same house 1 year ago. Out of people who lived in different houses, 73% moved from this county. Out of people who lived in different houses, 18% moved from different county within same state. Out of people who lived in different houses, 6% moved from different state.
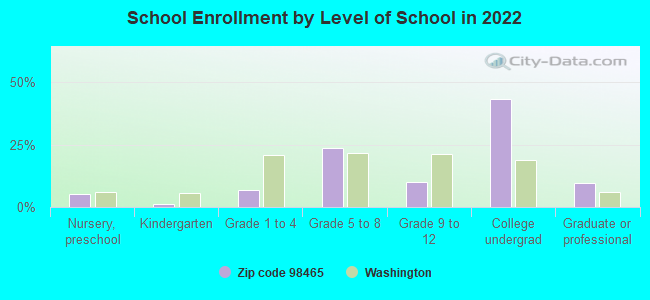
Private vs. public school enrollment:
Students in private schools in grades 1 to 8 (elementary and middle school): 110
Here:
23.5%
Washington:
12.4%
Students in private schools in grades 9 to 12 (high school): 42
Here:
27.7%
Washington:
9.2%
Students in private undergraduate colleges: 77
Here:
11.8%
Washington:
16.5%
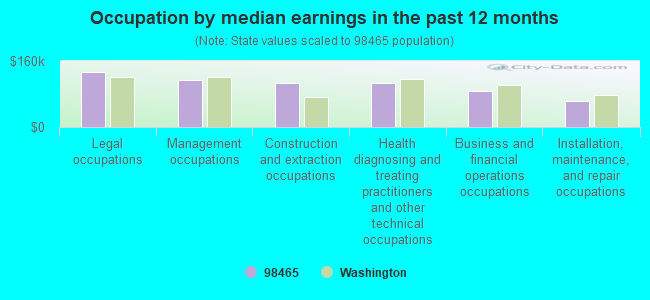
Occupation by median earnings in the past 12 months ($)
132,181Legal occupations
113,484Management occupations
107,850Construction and extraction occupations
107,174Health diagnosing and treating practitioners and other technical occupations
88,155Business and financial operations occupations
63,300Installation, maintenance, and repair occupations
Companies with federal contracts located in this zip code:
WASHINGTON PAVE (6316 S 12TH ST in TACOMA, WA) : $650,088 in 15 contractsfrom 2000 to 2005
Contracts for Other Social Services, Other Education and Training Services, Care of Remains and/or Funeral Services, Education Services by Army, Department of Defense Education Activity Signed by year:2000: $70,526; 2001: $0; 2002: $183,904; 2003: $95,896; 2004: $101,866; 2005: $197,896; 2006: $0.
Biggest contracts:
$101,282 with Army for Other Social Services. Signed on 2005-11-29. Completion date: 2006-11-30.
$96,459, same as above.Signed on 2004-10-22. Completion date: 2003-01-31.
$93,540 with Department of Defense Education Activity for Other Education and Training Services. Signed on 2005-05-25. Completion date: 2006-05-24.
$91,866 with Army for Other Social Services. Signed on 2003-12-02. Completion date: 2003-01-31.
Top industries in this zip code by the number of employees in 2005:
Health Care and Social Assistance: Child Day Care Services (100-249 employees: 1 establishment, 20-49 employees: 1 establishment, 10-19 employees: 2 establishments, 1-4 employees: 2 establishments)
Other Services (except Public Administration): Civic and Social Organizations (100-249: 1, 1-4: 2)
Health Care and Social Assistance: Nursing Care Facilities (100-249: 1)
2002 - 2018 National Fire Incident Reporting System (NFIRS) incidents
According to the data from the years 2002 - 2018 the average number of fire incidents per year is 27. The highest number of fires - 40 took place in 2002, and the least - 12 in 2013. The data has a declining trend.
When looking into fire subcategories, the most incidents belonged to: Outside Fires (73.0%), and Structure Fires (17.7%).
Fire incident types reported to NFIRS in Zip Code 98465


 Nearest zip codes: 98466, 98406, 98407, 98416, 98467, 98405.


 According to the data from the years 2002 - 2018 the average number of fire incidents per year is 27. The highest number of fires - 40 took place in 2002, and the least - 12 in 2013. The data has a declining trend.
 When looking into fire subcategories, the most incidents belonged to: Outside Fires (73.0%), and Structure Fires (17.7%).