Estimated zip code population in 2022: 20,777 Zip code population in 2010: 17,385 Zip code population in 2000: 13,540
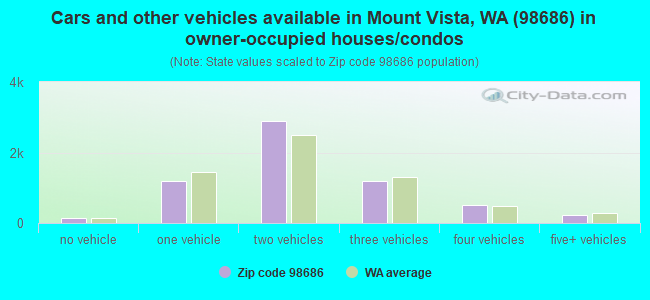
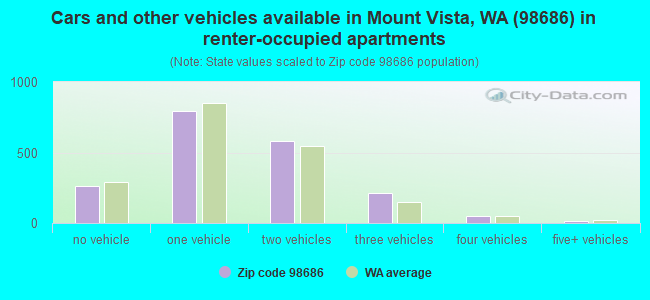
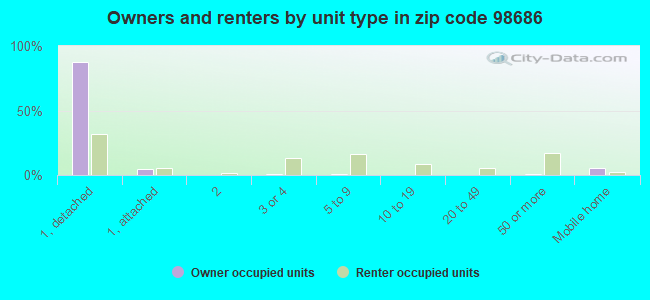
Houses and condos: 8,569 Renter-occupied apartments: 1,910
% of renters here:
24%
State:
36%
March 2022 cost of living index in zip code 98686: 103.9 (near average, U.S. average is 100)
Land area: 11.5 sq. mi. Water area: 0.0 sq. mi.
Population density: 1,807 people per square mile
(low).
OSM Map
General Map
Google Map
MSN Map
OSM Map
General Map
Google Map
MSN Map
OSM Map
General Map
Google Map
MSN Map
OSM Map
General Map
Google Map
MSN Map
Please wait while loading the map...
Real estate property taxes paid for housing units in 2022:
This zip code:
0.7% ($4,373)
Washington:
0.8% ($4,283)
Median real estate property taxes paid for housing units with mortgages in 2022: $4,252 (0.7%) Median real estate property taxes paid for housing units with no mortgage in 2022: $4,679 (0.8%)
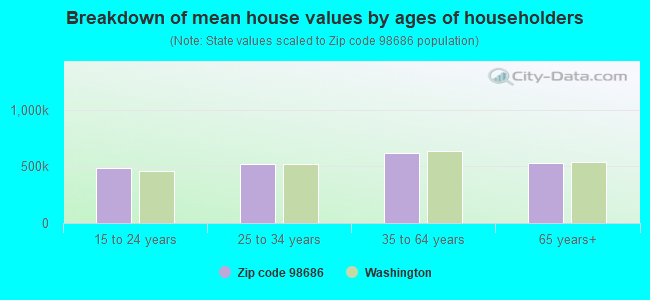
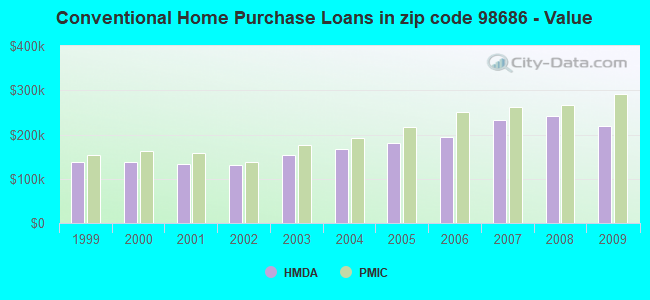
Estimated median house/condo value in 2022: $598,011
98686:
$598,011
Washington:
$569,500
According to our research of Washington and other state lists, there were 5 registered sex offenders living in 98686 zip code as of April 27, 2024. The ratio of all residents to sex offenders in zip code 98686 is 3,897 to 1. The ratio of registered sex offenders to all residents in this zip code is much lower than the state average.
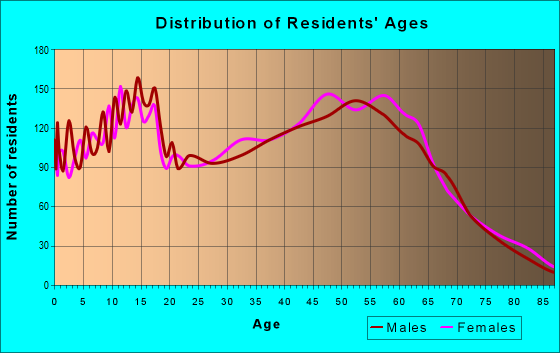
Median resident age:
This zip code:
42.5 years
Washington median age:
38.4 years
Average household size:
This zip code:
2.6 people
Washington:
2.5 people
Averages for the 2020 tax year for zip code 98686, filed in 2021:
Average Adjusted Gross Income (AGI) in 2020: $88,208 (Individual Income Tax Returns)
Here:
$88,208
State:
$99,264
Salary/wage: $74,068 (reported on 78.3% of returns)
Here:
$74,068
State:
$80,347
(% of AGI for various income ranges: 1128.5% for AGIs below $25k, 3415.1% for AGIs $25k-50k, 5969.7% for AGIs $50k-75k, 9108.8% for AGIs $75k-100k, 17948.2% for AGIs $100k-200k, 69022.8% for AGIs over 200k)
Taxable interest for individuals: $1,801 (reported on 36.5% of returns)
This zip code:
$1,801
Washington:
$2,077
(% of AGI for various income ranges: 25.7% for AGIs below $25k, 40.6% for AGIs $25k-50k, 57.1% for AGIs $50k-75k, 88.0% for AGIs $75k-100k, 132.1% for AGIs $100k-200k, 1146.4% for AGIs over 200k)
Ordinary dividends: $8,065 (reported on 24.4% of returns)
Here:
$8,065
State:
$10,013
(% of AGI for various income ranges: 37.7% for AGIs below $25k, 63.5% for AGIs $25k-50k, 126.1% for AGIs $50k-75k, 173.3% for AGIs $75k-100k, 398.9% for AGIs $100k-200k, 4595.2% for AGIs over 200k)
Net capital gain/loss in AGI: +$20,741 (reported on 23.6% of returns)
Here:
+$20,741
State:
+$40,092
(% of AGI for various income ranges: 8.9% for AGIs below $25k, 33.2% for AGIs $25k-50k, 122.7% for AGIs $50k-75k, 192.8% for AGIs $75k-100k, 637.1% for AGIs $100k-200k, 16314.4% for AGIs over 200k)
Profit/loss from business: +$15,682 (reported on 14.3% of returns)
Here:
+$15,682
State:
+$18,312
(% of AGI for various income ranges: 93.4% for AGIs below $25k, 186.2% for AGIs $25k-50k, 365.6% for AGIs $50k-75k, 324.6% for AGIs $75k-100k, 514.3% for AGIs $100k-200k, 2380.8% for AGIs over 200k)
Taxable individual retirement arrangement distribution: $26,149 (reported on 12.2% of returns)
98686:
$26,149
Washington:
$24,221
(% of AGI for various income ranges: 78.4% for AGIs below $25k, 138.5% for AGIs $25k-50k, 311.8% for AGIs $50k-75k, 455.5% for AGIs $75k-100k, 1070.5% for AGIs $100k-200k, 3792.8% for AGIs over 200k)
Self-employed (Keogh) retirement plans: $11,375 (reported on 0.4% of returns)
98686:
$11,375
Washington:
$24,166
(% of AGI for various income ranges: 35.3% for AGIs $100k-200k)
Total itemized deductions: $31,005 (reported on 14.1% of returns)
Here:
$31,005
State:
$39,068
(% of AGI for various income ranges: 112.1% for AGIs below $25k, 156.3% for AGIs $25k-50k, 485.6% for AGIs $50k-75k, 739.0% for AGIs $75k-100k, 1321.4% for AGIs $100k-200k, 5592.8% for AGIs over 200k)
Charity contributions: $9,032 (reported on 10.6% of returns)
Here:
$9,032
State:
$15,331
(% of AGI for various income ranges: 5.8% for AGIs below $25k, 15.9% for AGIs $25k-50k, 57.2% for AGIs $50k-75k, 94.9% for AGIs $75k-100k, 274.7% for AGIs $100k-200k, 1984.4% for AGIs over 200k)
Taxes paid: $7,423 (reported on 14.0% of returns)
98686:
$7,423
State:
$7,774
(% of AGI for various income ranges: 18.7% for AGIs below $25k, 36.4% for AGIs $25k-50k, 112.9% for AGIs $50k-75k, 216.3% for AGIs $75k-100k, 340.4% for AGIs $100k-200k, 1131.2% for AGIs over 200k)
Earned income credit: $1,891 (reported on 8.2% of returns)
Here:
$1,891
State:
$2,020
(% of AGI for various income ranges: 51.8% for AGIs below $25k, 44.2% for AGIs $25k-50k)
Percentage of individuals using paid preparers for their 2020 taxes: 93.0%
Here:
93%
State:
93%
(% for various income ranges: 90.0% for AGIs below $25k, 92.7% for AGIs $25k-50k, 94.9% for AGIs $50k-75k, 93.0% for AGIs $75k-100k, 94.1% for AGIs $100k-200k, 96.3% for AGIs over 200k)
Averages for the 2012 tax year for zip code 98686, filed in 2013:
Average Adjusted Gross Income (AGI) in 2012: $69,958 (Individual Income Tax Returns)
Here:
$69,958
State:
$69,533
Salary/wage: $58,637 (reported on 82.7% of returns)
Here:
$58,637
State:
$57,267
(% of AGI for various income ranges: 73.6% for AGIs below $25k, 74.7% for AGIs $25k-50k, 73.0% for AGIs $50k-75k, 74.6% for AGIs $75k-100k, 76.5% for AGIs $100k-200k, 50.4% for AGIs over 200k)
Taxable interest for individuals: $1,635 (reported on 37.9% of returns)
This zip code:
$1,635
Washington:
$1,816
(% of AGI for various income ranges: 1.8% for AGIs below $25k, 0.8% for AGIs $25k-50k, 0.8% for AGIs $50k-75k, 0.8% for AGIs $75k-100k, 0.6% for AGIs $100k-200k, 1.2% for AGIs over 200k)
Ordinary dividends: $8,471 (reported on 23.5% of returns)
Here:
$8,471
State:
$8,163
(% of AGI for various income ranges: 2.0% for AGIs below $25k, 1.3% for AGIs $25k-50k, 1.7% for AGIs $50k-75k, 1.4% for AGIs $75k-100k, 1.4% for AGIs $100k-200k, 7.4% for AGIs over 200k)
Net capital gain/loss in AGI: +$9,863 (reported on 20.1% of returns)
Here:
+$9,863
State:
+$21,568
(% of AGI for various income ranges: 0.2% for AGIs below $25k, 0.2% for AGIs $25k-50k, 1.1% for AGIs $50k-75k, 0.4% for AGIs $75k-100k, 2.0% for AGIs $100k-200k, 8.4% for AGIs over 200k)
Profit/loss from business: +$16,112 (reported on 14.4% of returns)
Here:
+$16,112
State:
+$16,521
(% of AGI for various income ranges: 6.0% for AGIs below $25k, 3.9% for AGIs $25k-50k, 2.7% for AGIs $50k-75k, 2.7% for AGIs $75k-100k, 2.7% for AGIs $100k-200k, 4.1% for AGIs over 200k)
Taxable individual retirement arrangement distribution: $18,296 (reported on 11.8% of returns)
98686:
$18,296
Washington:
$18,648
(% of AGI for various income ranges: 3.7% for AGIs below $25k, 2.8% for AGIs $25k-50k, 2.7% for AGIs $50k-75k, 3.2% for AGIs $75k-100k, 3.6% for AGIs $100k-200k, 2.5% for AGIs over 200k)
Self-employment retirement plans: $16,433 (reported on 0.7% of returns)
98686:
$16,433
Washington:
$20,087
Total itemized deductions: $22,368 (20% of AGI, reported on 42.2% of returns)
Here:
$22,368
State:
$23,872
Here:
20.4% of AGI
State:
18.2% of AGI
(% of AGI for various income ranges: 15.1% for AGIs below $25k, 13.0% for AGIs $25k-50k, 15.3% for AGIs $50k-75k, 16.6% for AGIs $75k-100k, 14.6% for AGIs $100k-200k, 8.8% for AGIs over 200k)
Charity contributions: $3,784 (reported on 35.2% of returns)
Here:
$3,784
State:
$4,465
(% of AGI for various income ranges: 0.9% for AGIs below $25k, 1.2% for AGIs $25k-50k, 1.7% for AGIs $50k-75k, 2.0% for AGIs $75k-100k, 2.3% for AGIs $100k-200k, 2.0% for AGIs over 200k)
Taxes paid: $6,820 (reported on 42.1% of returns)
98686:
$6,820
State:
$6,400
(% of AGI for various income ranges: 2.8% for AGIs below $25k, 3.2% for AGIs $25k-50k, 4.1% for AGIs $50k-75k, 4.8% for AGIs $75k-100k, 4.8% for AGIs $100k-200k, 3.3% for AGIs over 200k)
Earned income credit: $1,990 (reported on 11.9% of returns)
Here:
$1,990
State:
$2,073
(% of AGI for various income ranges: 4.5% for AGIs below $25k, 1.0% for AGIs $25k-50k)
Percentage of individuals using paid preparers for their 2012 taxes: 45.1%
Here:
45%
State:
43%
(% for various income ranges: 35.7% for AGIs below $25k, 42.7% for AGIs $25k-50k, 48.5% for AGIs $50k-75k, 49.0% for AGIs $75k-100k, 51.4% for AGIs $100k-200k, 74.3% for AGIs over 200k)
Averages for the 2004 tax year for zip code 98686, filed in 2005:
Average Adjusted Gross Income (AGI) in 2004: $58,640 (Individual Income Tax Returns)
Here:
$58,640
State:
$54,331
Salary/wage: $52,000 (reported on 83.8% of returns)
Here:
$52,000
State:
$45,761
(% of AGI for various income ranges: 116.5% for AGIs below $10k, 72.9% for AGIs $10k-25k, 79.1% for AGIs $25k-50k, 77.7% for AGIs $50k-75k, 80.9% for AGIs $75k-100k, 68.3% for AGIs over 100k)
Taxable interest for individuals: $2,030 (reported on 51.1% of returns)
This zip code:
$2,030
Washington:
$2,110
(% of AGI for various income ranges: 8.4% for AGIs below $10k, 2.5% for AGIs $10k-25k, 1.6% for AGIs $25k-50k, 1.3% for AGIs $50k-75k, 0.9% for AGIs $75k-100k, 2.1% for AGIs over 100k)
Taxable dividends: $2,901 (reported on 28.8% of returns)
Here:
$2,901
State:
$5,879
(% of AGI for various income ranges: 7.5% for AGIs below $10k, 1.4% for AGIs $10k-25k, 1.0% for AGIs $25k-50k, 1.0% for AGIs $50k-75k, 1.0% for AGIs $75k-100k, 1.8% for AGIs over 100k)
Net capital gain/loss: +$10,289 (reported on 25.9% of returns)
Here:
+$10,289
State:
+$15,835
(% of AGI for various income ranges: 1.8% for AGIs below $10k, 0.4% for AGIs $10k-25k, 0.3% for AGIs $25k-50k, 0.9% for AGIs $50k-75k, 1.4% for AGIs $75k-100k, 9.0% for AGIs over 100k)
Profit/loss from business: +$12,848 (reported on 16.0% of returns)
Here:
+$12,848
State:
+$13,994
(% of AGI for various income ranges: -3.6% for AGIs below $10k, 4.6% for AGIs $10k-25k, 3.6% for AGIs $25k-50k, 4.0% for AGIs $50k-75k, 3.7% for AGIs $75k-100k, 3.3% for AGIs over 100k)
IRA payment deduction: $2,961 (reported on 3.3% of returns)
98686:
$2,961
Washington:
$3,001
(% of AGI for various income ranges: 0.2% for AGIs $10k-25k, 0.3% for AGIs $25k-50k, 0.1% for AGIs $50k-75k, 0.2% for AGIs $75k-100k, 0.1% for AGIs over 100k)
Self-employed pension: $10,425 (reported on 1.2% of returns)
Here:
$10,425
Washington:
$14,244
(% of AGI for various income ranges: 0.1% for AGIs $25k-50k, 0.2% for AGIs $50k-75k, 0.2% for AGIs $75k-100k, 0.3% for AGIs over 100k)
Total itemized deductions: $20,143 (23% of AGI, reported on 48.1% of returns)
Here:
$20,143
State:
$19,669
Here:
22.6% of AGI
State:
20.7% of AGI
(% of AGI for various income ranges: 23.0% for AGIs below $10k, 13.2% for AGIs $10k-25k, 16.1% for AGIs $25k-50k, 24.5% for AGIs $50k-75k, 18.2% for AGIs $75k-100k, 13.1% for AGIs over 100k)
Charity contributions deductions: $3,052 (3% of AGI, reported on 42.2% of returns)
Here:
$3,052
State:
$3,569
Here:
3.3% of AGI
State:
3.5% of AGI
(% of AGI for various income ranges: 1.1% for AGIs below $10k, 1.2% for AGIs $10k-25k, 1.6% for AGIs $25k-50k, 2.4% for AGIs $50k-75k, 2.2% for AGIs $75k-100k, 2.4% for AGIs over 100k)
Total tax: $8,974 (reported on 80.7% of returns)
98686:
$8,974
State:
$9,065
(% of AGI for various income ranges: 3.8% for AGIs below $10k, 4.4% for AGIs $10k-25k, 7.0% for AGIs $25k-50k, 8.3% for AGIs $50k-75k, 10.1% for AGIs $75k-100k, 17.5% for AGIs over 100k)
Earned income credit: $1,567 (reported on 9.4% of returns)
Here:
$1,567
State:
$1,607
Percentage of individuals using paid preparers for their 2004 taxes: 50.9%
Here:
51%
State:
49%
(% for various income ranges: 39.1% for AGIs below $10k, 47.8% for AGIs $10k-25k, 51.2% for AGIs $25k-50k, 56.4% for AGIs $50k-75k, 51.7% for AGIs $75k-100k, 60.3% for AGIs over 100k)
Likely homosexual households (counted as self-reported same-sex unmarried-partner households)
Lesbian couples: 0.4% of all households
Gay men: 0.1% of all households
Household received Food Stamps/SNAP in the past 12 months: 599 Household did not receive Food Stamps/SNAP in the past 12 months: 7,442
Women who had a birth in the past 12 months: 172 (162 now married, 13 unmarried) Women who did not have a birth in the past 12 months: 4,249 (2,214 now married, 2,025 unmarried)
Housing units in zip code 98686 with a mortgage: 4,340 (371 second mortgage, 364 both second mortgage and home equity loan) Houses without a mortgage: 25
Median monthly owner costs for units with a mortgage: $2,155 Median monthly owner costs for units without a mortgage: $648
Residents with income below the poverty level in 2022:
This zip code:
6.8%
Whole state:
10.0%
Residents with income below 50% of the poverty level in 2022:
This zip code:
4.3%
Whole state:
4.6%
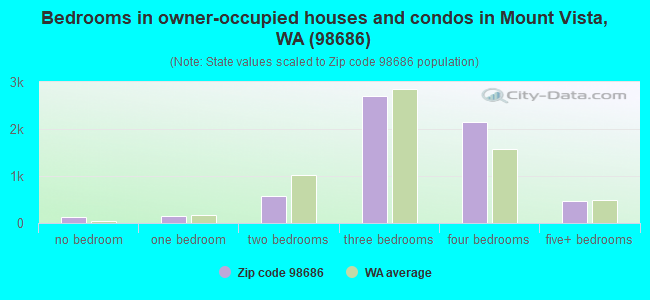
Median number of rooms in houses and condos:
Here:
7.0
State:
6.5
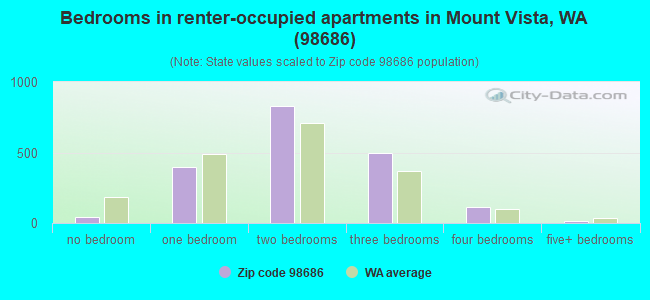
Median number of rooms in apartments:
Here:
4.4
State:
3.9
Notable locations in this zip code not listed on our city pages
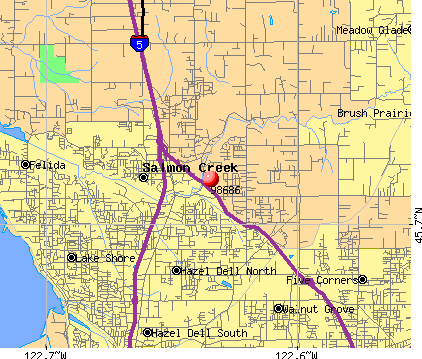
Notable locations in zip code 98686: Salmon Creek Christian Day Care Center (A), City of Vancouver Fire Department Station 7 (B). Display/hide their locations on the map
Churches in zip code 98686 include: Glenwood Community Church (A), Liberty Bible Church of the Nazarene (B), Living Word Baptist Church (C), Saint John Lutheran Church (D), Salmon Creek United Methodist Church (E), New Song Family Worship Center (F). Display/hide their locations on the map
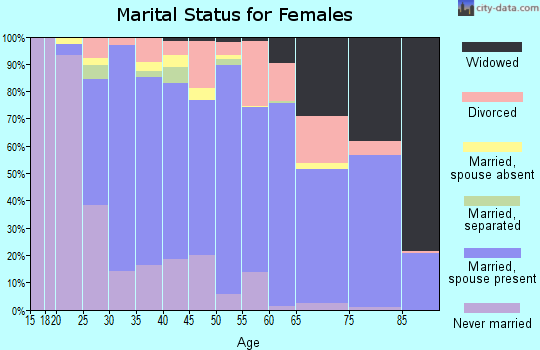
3,455 married couples with children.
797 single-parent households (361 men, 436 women).
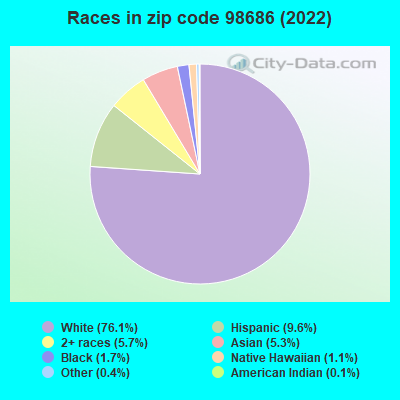
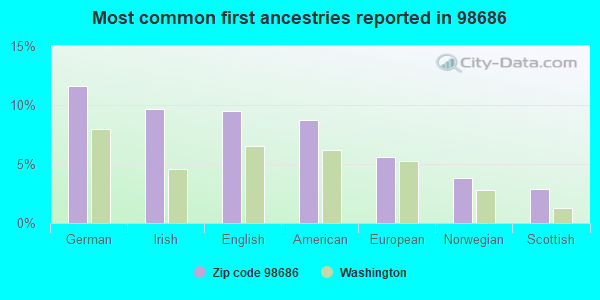
86.6% of residents of 98686 zip code speak English at home.
4.8% of residents speak Spanish at home (57% very well, 32% well, 8% not well, 3% not at all).
4.2% of residents speak other Indo-European language at home (82% very well, 4% well, 14% not well).
3.7% of residents speak Asian or Pacific Island language at home (68% very well, 6% well, 8% not well, 18% not at all).
0.6% of residents speak other language at home (85% very well, 15% well).
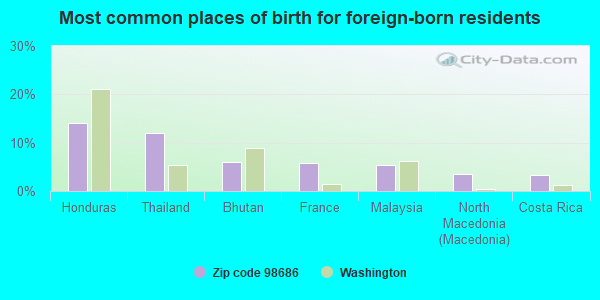
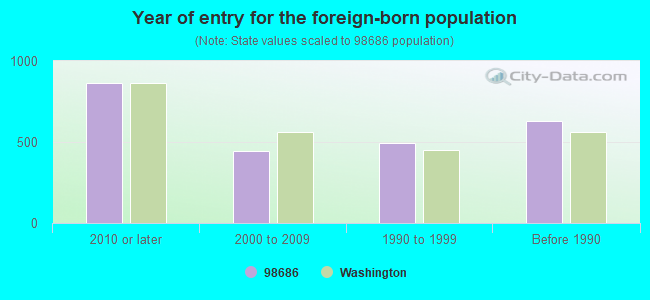
Foreign born population: 2,038 (9.8%) (63.6% of them are naturalized citizens)
Facilities with environmental interests located in this zip code:
COMMERCIAL REPAIR MACHINE WO (11614 NE HWY 99 in VANCOUVER, WA)
National Pollutant Discharge Elimination System NON-MAJOR (Tracking pollutant discharge elimination systems) - permit (Resource Conservation and Recovery Act (tracking hazardous waste)) STATE MASTER (Washington State Department of Ecology's Facility/Site identification system) - WATQUAL-SO3003409, NPDES STORMWATER PERMIT, HAZWASTE-WAR000005132, CESQG Business SIC classification: CRUSHED AND BROKEN STONE; FABRICATED METAL PRODUCTS; NONCLASSIFIABLE ESTABLISHMENTS Organizations: JOHN SOMARAKIS (CONTACT/OWNER)
, COMMERCIAL REPAIR + MACHINE WO (CONTACT/OWNER)
Alternative names: COMMERCIAL REPAIR AND MACHINE, COMMERCIAL REPAIR & MACHINE WORKS
CAROUSEL CLEANERS (13023 NE HWY 99 in VANCOUVER, WA)
Conditionally Exempt Small Quantity Generators, less than 100 kg/month of hazardous waste (Resource Conservation and Recovery Act (tracking hazardous waste)) - notification TRANSPORTER (Resource Conservation and Recovery Act (tracking hazardous waste)) STATE MASTER (Washington State Department of Ecology's Facility/Site identification system) - HAZWASTE-WAR000007427, CESQG Business SIC classification: NONCLASSIFIABLE ESTABLISHMENTS Organizations: PETER SUTHERLAND (CONTACT/OPERATOR)
CHEYENNE LIVESTOCK PROD INC (14014 NE SALMON CREEK AVE BLDG in VANCOUVER, WA)
(Resource Conservation and Recovery Act (tracking hazardous waste)) STATE MASTER (Washington State Department of Ecology's Facility/Site identification system) - HAZWASTE-WA0000335547, HAZARDOUS WASTE PROGRAM Business SIC classification: PLASTICS MATERIALS, SYNTHETIC RESINS, AND NONVULCANIZABLE ELASTOMERS Business NAICS classification: CATTLE FEEDLOTS.; CATTLE FEEDLOTS.
C WELLS & CO INC (1509 B NE 106TH ST in VANCOUVER, WA)
(Resource Conservation and Recovery Act (tracking hazardous waste)) Organizations: CHARLES WELLS (CONTACT/OPERATOR)
Housing units lacking complete plumbing facilities: 0.3% Housing units lacking complete kitchen facilities: 2.0%
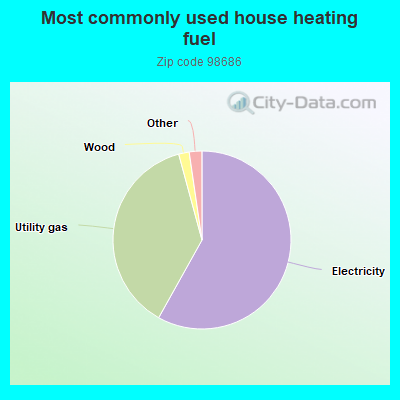
58.1%Electricity
37.7%Utility gas
1.9%Wood
0.9%Other fuel
0.7%Bottled, tank, or LP gas
Population in 1990: 9,966. Population change in the 1990s: +3,574 (+35.9%).
Place of birth for U.S.-born residents:
This state: 6,920
Northeast: 622
Midwest: 1,617
South: 1,033
West: 8,117
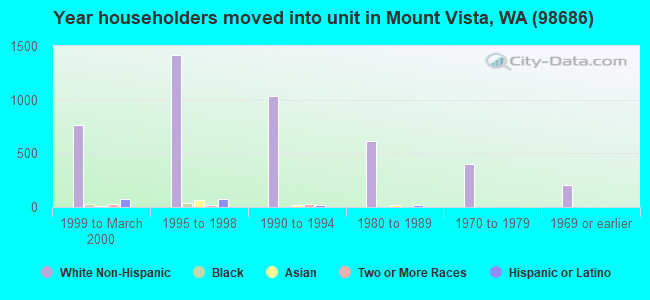
52% of the 98686 zip code residents lived in the same house 5 years ago. Out of people who lived in different houses, 49% lived in this county. Out of people who lived in different counties, 50% lived in Washington.
87% of the 98686 zip code residents lived in the same house 1 year ago. Out of people who lived in different houses, 56% moved from this county. Out of people who lived in different houses, 3% moved from different county within same state. Out of people who lived in different houses, 41% moved from different state. Out of people who lived in different houses, 1% moved from abroad.
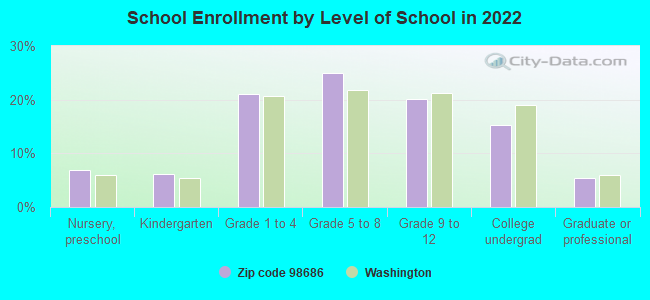
Private vs. public school enrollment:
Students in private schools in grades 1 to 8 (elementary and middle school): 315
Here:
15.0%
Washington:
12.4%
Students in private schools in grades 9 to 12 (high school): 175
Here:
19.0%
Washington:
9.2%
Students in private undergraduate colleges: 194
Here:
28.0%
Washington:
16.5%
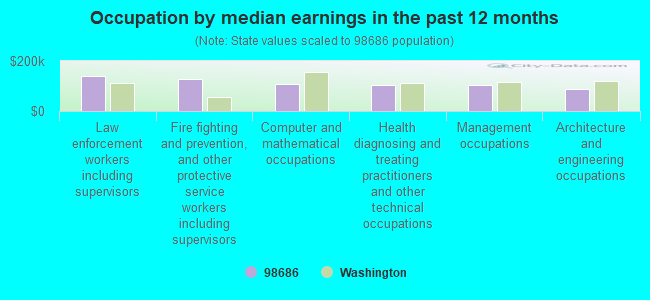
Occupation by median earnings in the past 12 months ($)
141,519Law enforcement workers including supervisors
129,510Fire fighting and prevention, and other protective service workers including supervisors
108,371Computer and mathematical occupations
103,769Health diagnosing and treating practitioners and other technical occupations
103,577Management occupations
86,023Architecture and engineering occupations
Companies with federal contracts located in this zip code (VANCOUVER, WA):
UNDERWATER EARTH MOVERS, INC (2410 NE 106TH ST; small business) : $594,460 in 6 contractsin 2005
Contracts for Construction of Structures and Facilities -- Dredging by U.S. Army Corps of Engineers - civil program financing only, Army Signed by year:2000: $0; 2001: $0; 2002: $0; 2003: $0; 2004: $0; 2005: $594,460; 2006: $0.
Biggest contracts:
$246,900 with U.S. Army Corps of Engineers - civil program financing only for Construction of Structures and Facilities -- Dredging. Taking place in OR. Signed on 2005-06-01. Completion date: 2005-02-11.
$246,900 with Army for Construction of Structures and Facilities -- Dredging. Taking place in OR. Signed on 2005-06-01. Completion date: 2005-02-11.
$30,100 with U.S. Army Corps of Engineers - civil program financing only for Construction of Structures and Facilities -- Dredging. Taking place in OR. Signed on 2005-06-21. Completion date: 2005-02-11.
$30,100 with Army for Construction of Structures and Facilities -- Dredging. Taking place in OR. Signed on 2005-06-21. Completion date: 2005-02-11.
SOMARAKIS, INC (11614 NE HIGHWAY 99; small business) : $120,120 in 3 contractsin 2002
$43,560 with Defense Logistics Agency for Compressors and Vacuum Pumps. Signed on 2002-09-26. Completion date: 2003-03-05.
$43,560, same as above.Signed on 2002-09-26. Completion date: 2003-03-25.
$33,000, same as above.Signed on 2002-03-11. Completion date: 2002-10-07.
AAMAX INC (10004 NE 65TH CT; small business) : $67,390 in 6 contractsfrom 2002 to 2004
Contracts for Custodial Janitorial Services by Army, U.S. Army Corps of Engineers - civil program financing only Signed by year:2000: $0; 2001: $0; 2002: $31,240; 2003: $32,150; 2004: $4,000; 2005: $0; 2006: $0.
Biggest contracts:
$28,150 with Army for Custodial Janitorial Services. Signed on 2003-01-22. Completion date: 2003-01-31.
$27,590, same as above.Signed on 2002-02-15. Completion date: 2003-01-31.
$4,000 with Army for Custodial Janitorial Services. Taking place in OR. Signed on 2004-06-18. Completion date: 2004-06-03.
$4,000 with U.S. Army Corps of Engineers - civil program financing only for Custodial Janitorial Services. Taking place in OR. Signed on 2003-06-04. Completion date: 2004-06-03.
HOLIDAY INN EXPRESS HOTEL & SU (13101 NE 27TH AVE; small business)
$28,098 with Army for Construction of Structures and Facilities -- Conference Space and Facilities. Taking place in AK. Signed on 2004-09-17. Completion date: 2004-09-27.
SHILO INN HAZEL DELL (13206 HWY 99; small business) : -$3,361 in 2 contractsin 2003
$0 with Army for Lodging - Hotel/Motel. Signed on 2003-08-27. Completion date: 2003-01-30.
-$3,361, same as above.Signed on 2003-08-27. Completion date: 2003-01-30.
Top industries in this zip code by the number of employees in 2005:
Health Care and Social Assistance: Offices of Physicians (except Mental Health Specialists) (50-99 employees: 1 establishment, 20-49 employees: 1 establishment, 10-19 employees: 1 establishment, 5-9 employees: 2 establishments, 1-4 employees: 3 establishments)
2002 - 2018 National Fire Incident Reporting System (NFIRS) incidents
Based on the data from the years 2002 - 2018 the average number of fires per year is 35. The highest number of reported fire incidents - 75 took place in 2015, and the least - 7 in 2002. The data has a growing trend.
When looking into fire subcategories, the most incidents belonged to: Outside Fires (45.1%), and Structure Fires (35.1%).
Fire incident types reported to NFIRS in Zip Code 98686


 Nearest zip codes: 98665, 98662, 98685, 98663, 98661, 98660.
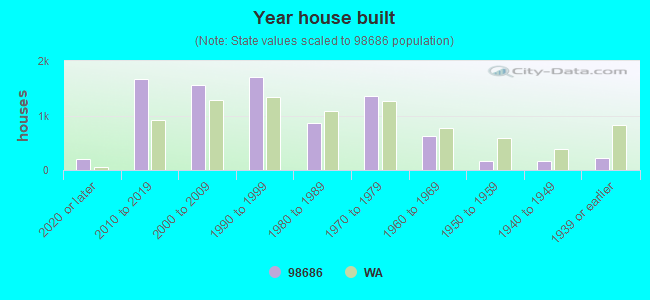


 Based on the data from the years 2002 - 2018 the average number of fires per year is 35. The highest number of reported fire incidents - 75 took place in 2015, and the least - 7 in 2002. The data has a growing trend.
 When looking into fire subcategories, the most incidents belonged to: Outside Fires (45.1%), and Structure Fires (35.1%).