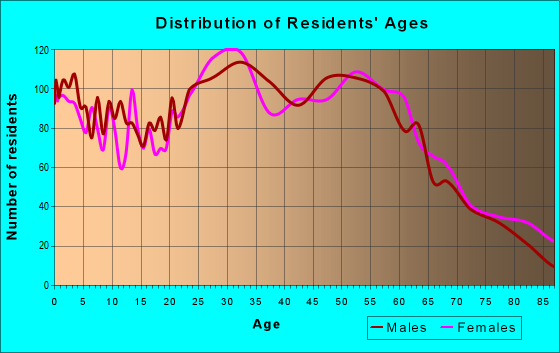
Estimated zip code population in 2022: 15,559 Zip code population in 2010: 14,115 Zip code population in 2000: 14,152
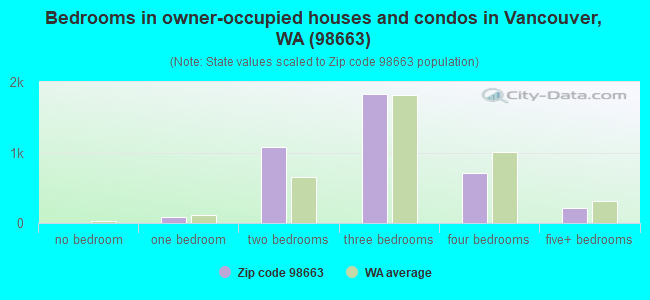
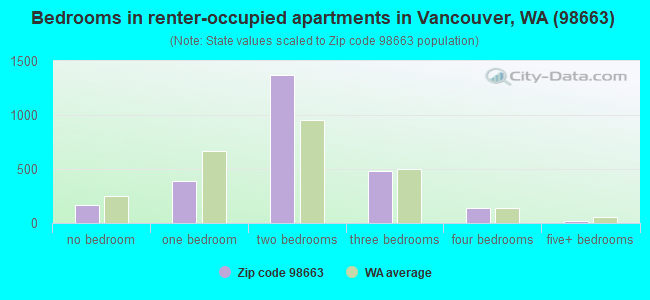
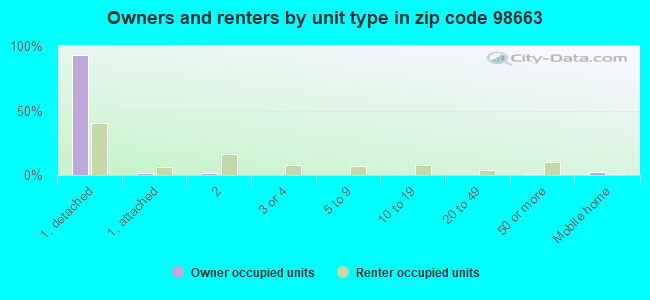
Houses and condos: 6,799 Renter-occupied apartments: 2,567
% of renters here:
40%
State:
36%
March 2022 cost of living index in zip code 98663: 103.5 (near average, U.S. average is 100)
Land area: 4.3 sq. mi. Water area: 0.0 sq. mi.
Population density: 3,619 people per square mile
(average).
OSM Map
General Map
Google Map
MSN Map
OSM Map
General Map
Google Map
MSN Map
OSM Map
General Map
Google Map
MSN Map
OSM Map
General Map
Google Map
MSN Map
Please wait while loading the map...
Real estate property taxes paid for housing units in 2022:
This zip code:
0.7% ($3,496)
Washington:
0.8% ($4,283)
Median real estate property taxes paid for housing units with mortgages in 2022: $3,448 (0.7%) Median real estate property taxes paid for housing units with no mortgage in 2022: $3,633 (0.8%)
Averages for the 2020 tax year for zip code 98663, filed in 2021:
Average Adjusted Gross Income (AGI) in 2020: $65,670 (Individual Income Tax Returns)
Here:
$65,670
State:
$99,264
Salary/wage: $56,881 (reported on 82.8% of returns)
Here:
$56,881
State:
$80,347
(% of AGI for various income ranges: 1220.6% for AGIs below $25k, 3732.2% for AGIs $25k-50k, 6685.1% for AGIs $50k-75k, 9865.3% for AGIs $75k-100k, 18604.1% for AGIs $100k-200k, 59903.8% for AGIs over 200k)
Taxable interest for individuals: $1,164 (reported on 26.4% of returns)
This zip code:
$1,164
Washington:
$2,077
(% of AGI for various income ranges: 13.6% for AGIs below $25k, 13.7% for AGIs $25k-50k, 19.9% for AGIs $50k-75k, 44.2% for AGIs $75k-100k, 139.5% for AGIs $100k-200k, 801.2% for AGIs over 200k)
Ordinary dividends: $4,231 (reported on 16.5% of returns)
Here:
$4,231
State:
$10,013
(% of AGI for various income ranges: 21.0% for AGIs below $25k, 27.7% for AGIs $25k-50k, 78.6% for AGIs $50k-75k, 112.8% for AGIs $75k-100k, 232.0% for AGIs $100k-200k, 2160.0% for AGIs over 200k)
Net capital gain/loss in AGI: +$14,146 (reported on 15.9% of returns)
Here:
+$14,146
State:
+$40,092
(% of AGI for various income ranges: 16.2% for AGIs below $25k, 17.7% for AGIs $25k-50k, 61.7% for AGIs $50k-75k, 141.4% for AGIs $75k-100k, 761.6% for AGIs $100k-200k, 13011.3% for AGIs over 200k)
Profit/loss from business: +$13,563 (reported on 15.0% of returns)
Here:
+$13,563
State:
+$18,312
(% of AGI for various income ranges: 163.4% for AGIs below $25k, 148.7% for AGIs $25k-50k, 196.0% for AGIs $50k-75k, 332.5% for AGIs $75k-100k, 524.3% for AGIs $100k-200k, 4657.5% for AGIs over 200k)
Taxable individual retirement arrangement distribution: $18,577 (reported on 7.2% of returns)
98663:
$18,577
Washington:
$24,221
(% of AGI for various income ranges: 64.4% for AGIs below $25k, 68.1% for AGIs $25k-50k, 190.5% for AGIs $50k-75k, 256.7% for AGIs $75k-100k, 567.3% for AGIs $100k-200k, 1868.8% for AGIs over 200k)
Self-employed (Keogh) retirement plans: $19,633 (reported on 0.4% of returns)
98663:
$19,633
Washington:
$24,166
(% of AGI for various income ranges: 105.2% for AGIs $100k-200k)
Total itemized deductions: $29,365 (reported on 9.0% of returns)
Here:
$29,365
State:
$39,068
(% of AGI for various income ranges: 53.0% for AGIs below $25k, 106.4% for AGIs $25k-50k, 292.6% for AGIs $50k-75k, 528.1% for AGIs $75k-100k, 1119.6% for AGIs $100k-200k, 6236.2% for AGIs over 200k)
Charity contributions: $7,111 (reported on 6.3% of returns)
Here:
$7,111
State:
$15,331
(% of AGI for various income ranges: 2.8% for AGIs below $25k, 8.7% for AGIs $25k-50k, 28.1% for AGIs $50k-75k, 55.4% for AGIs $75k-100k, 202.7% for AGIs $100k-200k, 1730.0% for AGIs over 200k)
Taxes paid: $6,650 (reported on 9.0% of returns)
98663:
$6,650
State:
$7,774
(% of AGI for various income ranges: 8.3% for AGIs below $25k, 22.7% for AGIs $25k-50k, 76.9% for AGIs $50k-75k, 149.1% for AGIs $75k-100k, 290.9% for AGIs $100k-200k, 906.2% for AGIs over 200k)
Earned income credit: $1,854 (reported on 12.1% of returns)
Here:
$1,854
State:
$2,020
(% of AGI for various income ranges: 69.3% for AGIs below $25k, 45.7% for AGIs $25k-50k)
Percentage of individuals using paid preparers for their 2020 taxes: 92.8%
Here:
93%
State:
93%
(% for various income ranges: 89.9% for AGIs below $25k, 93.1% for AGIs $25k-50k, 93.2% for AGIs $50k-75k, 95.2% for AGIs $75k-100k, 95.2% for AGIs $100k-200k, 91.3% for AGIs over 200k)
Averages for the 2012 tax year for zip code 98663, filed in 2013:
Average Adjusted Gross Income (AGI) in 2012: $49,129 (Individual Income Tax Returns)
Here:
$49,129
State:
$69,533
Salary/wage: $43,170 (reported on 83.5% of returns)
Here:
$43,170
State:
$57,267
(% of AGI for various income ranges: 75.9% for AGIs below $25k, 81.4% for AGIs $25k-50k, 75.8% for AGIs $50k-75k, 77.7% for AGIs $75k-100k, 77.2% for AGIs $100k-200k, 41.3% for AGIs over 200k)
Taxable interest for individuals: $1,231 (reported on 27.4% of returns)
This zip code:
$1,231
Washington:
$1,816
(% of AGI for various income ranges: 0.7% for AGIs below $25k, 0.5% for AGIs $25k-50k, 0.7% for AGIs $50k-75k, 0.7% for AGIs $75k-100k, 0.9% for AGIs $100k-200k, 0.7% for AGIs over 200k)
Ordinary dividends: $4,837 (reported on 15.2% of returns)
Here:
$4,837
State:
$8,163
(% of AGI for various income ranges: 1.3% for AGIs below $25k, 0.8% for AGIs $25k-50k, 1.3% for AGIs $50k-75k, 0.8% for AGIs $75k-100k, 1.3% for AGIs $100k-200k, 4.4% for AGIs over 200k)
Net capital gain/loss in AGI: +$3,440 (reported on 12.7% of returns)
Here:
+$3,440
State:
+$21,568
(% of AGI for various income ranges: 0.3% for AGIs $25k-50k, 0.2% for AGIs $50k-75k, 0.9% for AGIs $75k-100k, 1.5% for AGIs $100k-200k, 2.8% for AGIs over 200k)
Profit/loss from business: +$13,103 (reported on 12.4% of returns)
Here:
+$13,103
State:
+$16,521
(% of AGI for various income ranges: 6.8% for AGIs below $25k, 2.8% for AGIs $25k-50k, 3.1% for AGIs $50k-75k, 2.7% for AGIs $75k-100k, 4.6% for AGIs $100k-200k)
Taxable individual retirement arrangement distribution: $12,111 (reported on 8.9% of returns)
98663:
$12,111
Washington:
$18,648
(% of AGI for various income ranges: 1.9% for AGIs below $25k, 2.1% for AGIs $25k-50k, 2.4% for AGIs $50k-75k, 2.6% for AGIs $75k-100k, 3.3% for AGIs $100k-200k)
Self-employment retirement plans: $17,633 (reported on 0.5% of returns)
98663:
$17,633
Washington:
$20,087
Total itemized deductions: $19,410 (23% of AGI, reported on 30.7% of returns)
Here:
$19,410
State:
$23,872
Here:
22.7% of AGI
State:
18.2% of AGI
(% of AGI for various income ranges: 8.8% for AGIs below $25k, 9.5% for AGIs $25k-50k, 14.2% for AGIs $50k-75k, 14.2% for AGIs $75k-100k, 13.7% for AGIs $100k-200k, 11.2% for AGIs over 200k)
Charity contributions: $3,241 (reported on 23.4% of returns)
Here:
$3,241
State:
$4,465
(% of AGI for various income ranges: 0.6% for AGIs below $25k, 0.9% for AGIs $25k-50k, 1.4% for AGIs $50k-75k, 1.9% for AGIs $75k-100k, 1.9% for AGIs $100k-200k, 2.5% for AGIs over 200k)
Taxes paid: $5,383 (reported on 30.3% of returns)
98663:
$5,383
State:
$6,400
(% of AGI for various income ranges: 1.6% for AGIs below $25k, 2.2% for AGIs $25k-50k, 3.3% for AGIs $50k-75k, 4.2% for AGIs $75k-100k, 4.4% for AGIs $100k-200k, 3.9% for AGIs over 200k)
Earned income credit: $1,957 (reported on 18.0% of returns)
Here:
$1,957
State:
$2,073
(% of AGI for various income ranges: 5.3% for AGIs below $25k, 0.9% for AGIs $25k-50k)
Percentage of individuals using paid preparers for their 2012 taxes: 41.1%
Here:
41%
State:
43%
(% for various income ranges: 34.3% for AGIs below $25k, 39.2% for AGIs $25k-50k, 46.5% for AGIs $50k-75k, 49.1% for AGIs $75k-100k, 55.6% for AGIs $100k-200k, 62.5% for AGIs over 200k)
Averages for the 2004 tax year for zip code 98663, filed in 2005:
Average Adjusted Gross Income (AGI) in 2004: $41,134 (Individual Income Tax Returns)
Here:
$41,134
State:
$54,331
Salary/wage: $36,379 (reported on 84.7% of returns)
Here:
$36,379
State:
$45,761
(% of AGI for various income ranges: 91.9% for AGIs below $10k, 76.6% for AGIs $10k-25k, 83.5% for AGIs $25k-50k, 81.3% for AGIs $50k-75k, 83.7% for AGIs $75k-100k, 54.1% for AGIs over 100k)
Taxable interest for individuals: $2,280 (reported on 38.9% of returns)
This zip code:
$2,280
Washington:
$2,110
(% of AGI for various income ranges: 5.1% for AGIs below $10k, 1.9% for AGIs $10k-25k, 1.2% for AGIs $25k-50k, 1.3% for AGIs $50k-75k, 1.0% for AGIs $75k-100k, 4.4% for AGIs over 100k)
Taxable dividends: $2,742 (reported on 18.7% of returns)
Here:
$2,742
State:
$5,879
(% of AGI for various income ranges: 3.8% for AGIs below $10k, 0.9% for AGIs $10k-25k, 0.8% for AGIs $25k-50k, 0.9% for AGIs $50k-75k, 0.8% for AGIs $75k-100k, 2.2% for AGIs over 100k)
Net capital gain/loss: +$13,397 (reported on 15.6% of returns)
Here:
+$13,397
State:
+$15,835
(% of AGI for various income ranges: 3.4% for AGIs below $10k, -0.5% for AGIs $10k-25k, 0.5% for AGIs $25k-50k, 0.5% for AGIs $50k-75k, 1.0% for AGIs $75k-100k, 18.3% for AGIs over 100k)
Profit/loss from business: +$10,605 (reported on 12.6% of returns)
Here:
+$10,605
State:
+$13,994
(% of AGI for various income ranges: 4.6% for AGIs below $10k, 5.0% for AGIs $10k-25k, 2.1% for AGIs $25k-50k, 2.5% for AGIs $50k-75k, 2.8% for AGIs $75k-100k, 4.5% for AGIs over 100k)
IRA payment deduction: $2,715 (reported on 2.7% of returns)
98663:
$2,715
Washington:
$3,001
(% of AGI for various income ranges: 0.2% for AGIs $10k-25k, 0.3% for AGIs $25k-50k, 0.2% for AGIs $50k-75k, 0.1% for AGIs $75k-100k, 0.1% for AGIs over 100k)
Self-employed pension: $11,030 (reported on 0.6% of returns)
Here:
$11,030
Washington:
$14,244
Total itemized deductions: $16,075 (24% of AGI, reported on 33.5% of returns)
Here:
$16,075
State:
$19,669
Here:
23.6% of AGI
State:
20.7% of AGI
(% of AGI for various income ranges: 15.3% for AGIs below $10k, 10.3% for AGIs $10k-25k, 12.4% for AGIs $25k-50k, 14.1% for AGIs $50k-75k, 15.5% for AGIs $75k-100k, 12.5% for AGIs over 100k)
Charity contributions deductions: $2,475 (3% of AGI, reported on 27.2% of returns)
Here:
$2,475
State:
$3,569
Here:
3.4% of AGI
State:
3.5% of AGI
(% of AGI for various income ranges: 0.7% for AGIs below $10k, 0.9% for AGIs $10k-25k, 1.3% for AGIs $25k-50k, 1.6% for AGIs $50k-75k, 2.0% for AGIs $75k-100k, 2.2% for AGIs over 100k)
Total tax: $5,396 (reported on 76.9% of returns)
98663:
$5,396
State:
$9,065
(% of AGI for various income ranges: 3.0% for AGIs below $10k, 4.3% for AGIs $10k-25k, 7.0% for AGIs $25k-50k, 9.2% for AGIs $50k-75k, 10.9% for AGIs $75k-100k, 16.6% for AGIs over 100k)
Earned income credit: $1,614 (reported on 16.4% of returns)
Here:
$1,614
State:
$1,607
Percentage of individuals using paid preparers for their 2004 taxes: 51.0%
Here:
51%
State:
49%
(% for various income ranges: 43.0% for AGIs below $10k, 50.3% for AGIs $10k-25k, 51.2% for AGIs $25k-50k, 53.8% for AGIs $50k-75k, 54.2% for AGIs $75k-100k, 66.3% for AGIs over 100k)
Likely homosexual households (counted as self-reported same-sex unmarried-partner households)
Lesbian couples: 0.4% of all households
Gay men: 0.4% of all households
Household received Food Stamps/SNAP in the past 12 months: 988 Household did not receive Food Stamps/SNAP in the past 12 months: 5,513
Women who had a birth in the past 12 months: 135 (111 now married, 24 unmarried) Women who did not have a birth in the past 12 months: 3,286 (1,320 now married, 1,970 unmarried)
Housing units in zip code 98663 with a mortgage: 2,560 (151 second mortgage, 136 both second mortgage and home equity loan) Houses without a mortgage: 43
Median monthly owner costs for units with a mortgage: $1,822 Median monthly owner costs for units without a mortgage: $604
Residents with income below the poverty level in 2022:
This zip code:
10.0%
Whole state:
10.0%
Residents with income below 50% of the poverty level in 2022:
This zip code:
5.8%
Whole state:
4.6%
Median number of rooms in houses and condos:
Here:
6.3
State:
6.5
Median number of rooms in apartments:
Here:
4.0
State:
3.9
Notable locations in this zip code not listed on our city pages
Notable locations in zip code 98663: Covington Cabin (A), Clark County Historical Museum (B), City of Vancouver Fire Department Station 2 (C). Display/hide their locations on the map
Churches in zip code 98663 include: Calvary Chapel of Vancouver (A), First Church of Christ Scientist (B), First United Methodist Church of Vancouver Washington (C), Garden Grove Branch Community of Christ Church (D), Kingdom Hall of Jehovahs Witnesses (E), Minnehaha Church of Christ (F), Saint Lukes Church (G), Slavic Evangelical Church (H), The Lords Church (I). Display/hide their locations on the map
1,726 married couples with children.
918 single-parent households (537 men, 381 women).
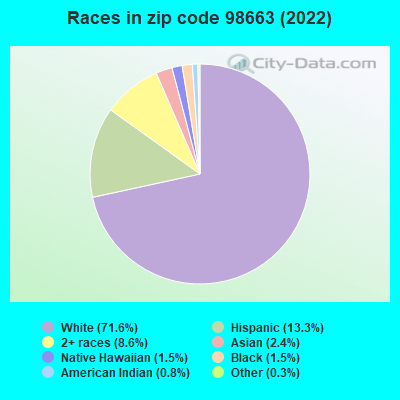
84.9% of residents of 98663 zip code speak English at home.
9.0% of residents speak Spanish at home (55% very well, 22% well, 23% not well).
3.8% of residents speak other Indo-European language at home (71% very well, 11% well, 14% not well, 4% not at all).
1.7% of residents speak Asian or Pacific Island language at home (62% very well, 17% well, 13% not well, 8% not at all).
0.1% of residents speak other language at home (100% very well).
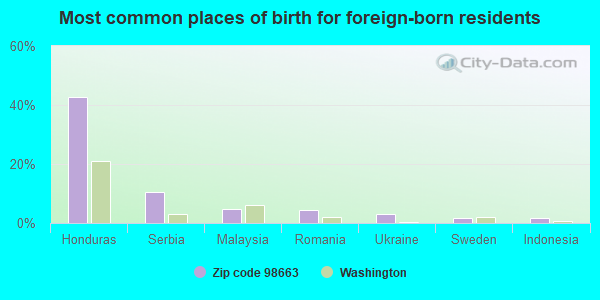
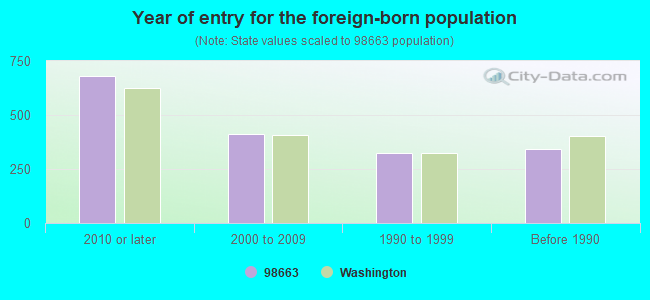
Foreign born population: 1,404 (9.0%) (40.1% of them are naturalized citizens)
Facilities with environmental interests located in this zip code:
CASCADE AUTO BODY (2600 E 33RD ST in VANCOUVER, WA)
(Resource Conservation and Recovery Act (tracking hazardous waste)) STATE MASTER (Washington State Department of Ecology's Facility/Site identification system) - HAZWASTE-WAD057075947, HAZARDOUS WASTE PROGRAM, TOXICS-200649, LEAKING STORAGE TANK, UNDERGROUND STORAGE TANK PROGRAM, HAZWASTE-WAD057075947, CESQG Business SIC classification: TOP, BODY, AND UPHOLSTERY REPAIR SHOPS AND PAINT SHOPS Business NAICS classification: AUTOMOTIVE BODY, PAINT, AND INTERIOR REPAIR AND MAINTENANCE.; AUTOMOTIVE BODY, PAINT, AND INTERIOR REPAIR AND MAINTENANCE. Organizations: NEW KAB 1 LLC (CONTACT/OWNER)
ARCO 5739 PSI 5379 (3817 MAIN ST in VANCOUVER, WA)
Small Quantity Generators, between 100 kg and 1000 kg of hazardous waste/month (Resource Conservation and Recovery Act (tracking hazardous waste)) STATE MASTER (Washington State Department of Ecology's Facility/Site identification system) - TOXICS-4496, UNDERGROUND STORAGE TANK PROGRAM, HAZWASTE-WAD988516126, EPCRA, SQG Business SIC classification: GASOLINE SERVICE STATIONS Organizations: BP WEST COAST PRODUCTS LLC (CONTACT/OPERATOR)
Alternative names: ARCO 05739
CLARK COLLEGE (1800 E MCLOUGHLIN BLVD in VANCOUVER, WA)
Conditionally Exempt Small Quantity Generators, less than 100 kg/month of hazardous waste (Resource Conservation and Recovery Act (tracking hazardous waste)) - notification STATE MASTER (Washington State Department of Ecology's Facility/Site identification system) - TOXICS-97646, LEAKING STORAGE TANK, UNDERGROUND STORAGE TANK PROGRAM, HAZWASTE-WAD134978048, CESQG Business SIC classification: JUNIOR COLLEGES AND TECHNICAL INSTITUTES Organizations: WA STATE (CONTACT/OWNER)
Alternative names: CC CLARK COLLEGE
CONTINENTAL CAN CO (3103A NE 65TH ST in VANCOUVER, WA)
(Resource Conservation and Recovery Act (tracking hazardous waste)) Business NAICS classification: METAL CAN MANUFACTURING.
BOISE CASCADE CORP (906 W 5TH ST in VANCOUVER, WA)
COMPLIANCE ACTIVITY (Tracking inspections of insecticide, fungicide, and rodenticide, and toxic substances)
BOISE CASCADE CORP VANCOUVER (906 W 7TH ST in VANCOUVER, WA)
COMPLIANCE ACTIVITY (Tracking inspections of insecticide, fungicide, and rodenticide, and toxic substances)
Housing units lacking complete plumbing facilities: 0.8% Housing units lacking complete kitchen facilities: 1.2%
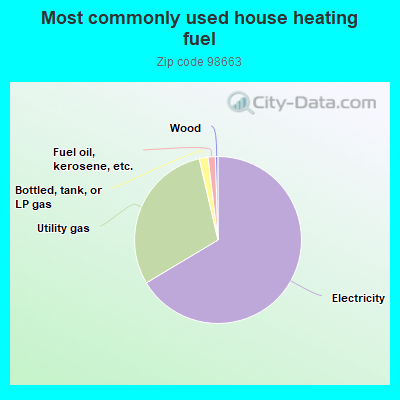
66.3%Electricity
29.9%Utility gas
1.7%Bottled, tank, or LP gas
1.4%Fuel oil, kerosene, etc.
0.5%Wood
Population in 1990: 13,198. Population change in the 1990s: +954 (+7.2%).
Place of birth for U.S.-born residents:
This state: 6,073
Northeast: 607
Midwest: 906
South: 676
West: 5,525
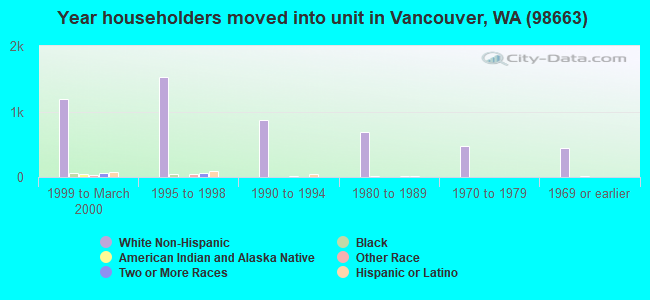
45% of the 98663 zip code residents lived in the same house 5 years ago. Out of people who lived in different houses, 56% lived in this county. Out of people who lived in different counties, 50% lived in Washington.
85% of the 98663 zip code residents lived in the same house 1 year ago. Out of people who lived in different houses, 56% moved from this county. Out of people who lived in different houses, 14% moved from different county within same state. Out of people who lived in different houses, 29% moved from different state. Out of people who lived in different houses, 0% moved from abroad.
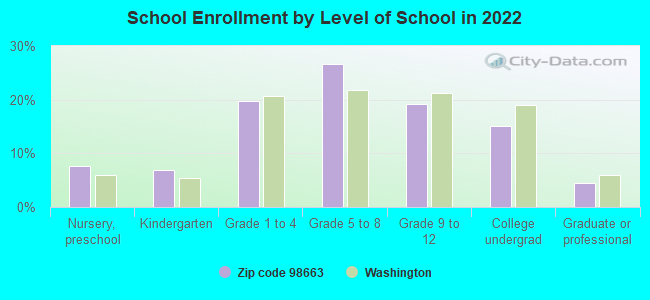
Private vs. public school enrollment:
Students in private schools in grades 1 to 8 (elementary and middle school): 130
Here:
10.1%
Washington:
12.4%
Students in private schools in grades 9 to 12 (high school): 34
Here:
6.5%
Washington:
9.2%
Students in private undergraduate colleges: 27
Here:
6.6%
Washington:
16.5%
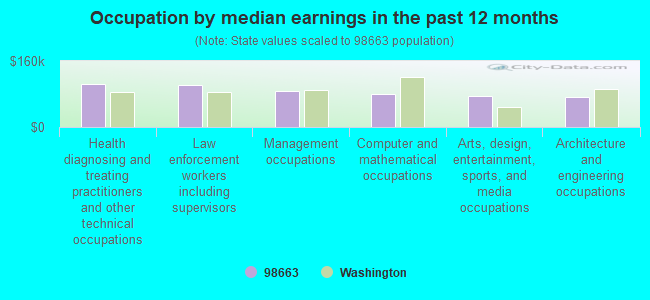
Occupation by median earnings in the past 12 months ($)
103,599Health diagnosing and treating practitioners and other technical occupations
101,748Law enforcement workers including supervisors
86,078Management occupations
80,859Computer and mathematical occupations
75,976Arts, design, entertainment, sports, and media occupations
72,705Architecture and engineering occupations
Companies with federal contracts located in this zip code:
AUTOMATED CONTROL SYSTEMS, INC (3305 MAIN ST STE 201 in VANCOUVER, WA; small business) : $8,426,596 in 123 contractsfrom 2001 to 2006
Contracts for Maintenance, Repair and Rebuilding of Equipment -- Automatic Data Processing Equipment (Including Firmware), Software, Supplies and Support Equipment, ADP Systems Development Services, ADP Software, Automated Information System Design and Integration Services, and moreby U.S. Army Corps of Engineers - civil program financing only, Army, Federal Technology Service, Bureau of Reclamation, and others Signed by year:2000: $0; 2001: $107,000; 2002: $1,311,385; 2003: $1,142,403; 2004: $4,091,308; 2005: $825,063; 2006: $949,437.
Biggest contracts:
$500,000 with U.S. Army Corps of Engineers - civil program financing only for Maintenance, Repair and Rebuilding of Equipment -- Automatic Data Processing Equipment (Including Firmware), Software, Supplies and Support Equipment. Signed on 2003-06-06. Completion date: 2003-12-31.
$438,469, same as above.Signed on 2004-04-27. Completion date: 2004-09-30.
$438,469 with Army for Maintenance, Repair and Rebuilding of Equipment -- Automatic Data Processing Equipment (Including Firmware), Software, Supplies and Support Equipment. Signed on 2004-04-27. Completion date: 2004-09-30.
$429,613 with Army for ADP Systems Development Services. Taking place in OR. Signed on 2006-05-03. Completion date: 2007-02-28.
CLARK COUNTY PUBLIC UTILITY DI (1200 FORT VANCOUVER WAY in VANCOUVER, WA; small business) : $509,967 in 58 contractsfrom 2001 to 2006
Contracts for Electric Services, Gas Services by Public Buildings Service, U.S. Fish and Wildlife Service, Army Signed by year:2000: $0; 2001: $5,480; 2002: $11,007; 2003: $17,910; 2004: $41,467; 2005: $39,446; 2006: $394,657.
Biggest contracts:
$200,000 with Public Buildings Service for Electric Services. Signed on 2006-05-01. Completion date: 2016-04-30.
$135,000 with U.S. Fish and Wildlife Service for Electric Services. Signed on 2006-01-09. Effective on 2006-04-01. Completion date: 2007-03-31.
$34,000 with U.S. Fish and Wildlife Service for Electric Services. Taking place in ID. Signed on 2006-01-19. Completion date: 2006-09-30.
$34,000, same as above.Signed on 2006-01-19. Effective on 2006-01-01. Completion date: 2006-09-30.
OMEGA INTERIORS, INC (6300 NE ST JAMES RD in VANCOUVER, WA; small business)
$6,155 with Navy for Maintenance, Repair or Alteration of Real Property -- Office Buildings. Taking place in OR. Signed on 2000-09-20. Completion date: 2000-11-20.
Top industries in this zip code by the number of employees in 2005:
Health Care and Social Assistance: Nursing Care Facilities (100-249 employees: 1 establishment, 50-99 employees: 2 establishments, 1-4 employees: 1 establishment)
Health Care and Social Assistance: Offices of Physicians (except Mental Health Specialists) (100-249: 1, 50-99: 1, 20-49: 1, 5-9: 1, 1-4: 5)
Health Care and Social Assistance: General Medical and Surgical Hospitals (100-249: 1)
Health Care and Social Assistance: Offices of Dentists (10-19: 4, 5-9: 8, 1-4: 4)
Health Care and Social Assistance: Child and Youth Services (50-99: 1, 20-49: 1, 1-4: 1)
Other Services (except Public Administration): Religious Organizations (20-49: 2, 5-9: 3, 1-4: 2)
Educational Services: Elementary and Secondary Schools (50-99: 1, 10-19: 1)
Professional, Scientific, and Technical Services: Payroll Services (50-99: 1)
Health Care and Social Assistance: Residential Mental Retardation Facilities (50-99: 1)
People in group quarters in 2010:
163 people in nursing facilities/skilled-nursing facilities
57 people in emergency and transitional shelters (with sleeping facilities) for people experiencing homelessness
28 people in other noninstitutional facilities
4 people in group homes intended for adults
4 people in workers' group living quarters and job corps centers
People in group quarters in 2000:
213 people in nursing homes
39 people in other noninstitutional group quarters
25 people in homes or halfway houses for drug/alcohol abuse
Fatal accident statistics in 2013:
Fatal accident count: 1
Vehicles involved in fatal accidents: 3
Fatal accidents caused by drunken drivers: 1
Fatalities: 1
Persons involved in fatal accidents: 5
Pedestrians involved in fatal accidents: 0
Fatal accident statistics in 2011:
Fatal accident count: 2
Vehicles involved in fatal accidents: 3
Fatal accidents caused by drunken drivers: 2
Fatalities: 2
Persons involved in fatal accidents: 5
Pedestrians involved in fatal accidents: 1
Home Mortgage Disclosure Act Aggregated Statistics For Year 2009 (Based on 4 full and 10 partial tracts)
A) FHA, FSA/RHS & VA Home Purchase Loans
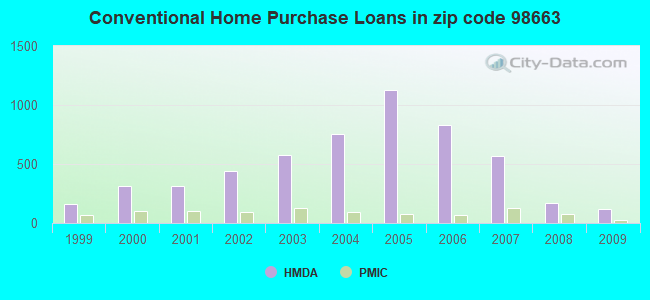
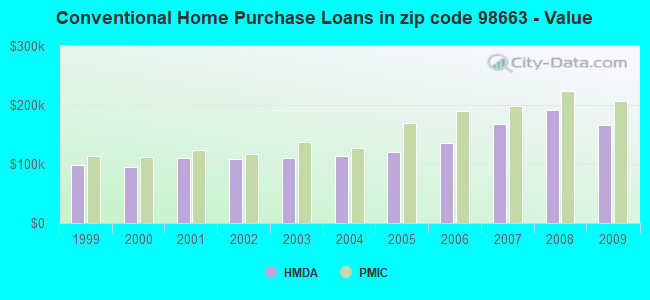
B) Conventional Home Purchase Loans
C) Refinancings
D) Home Improvement Loans
E) Loans on Dwellings For 5+ Families
F) Non-occupant Loans on < 5 Family Dwellings (A B C & D)
G) Loans On Manufactured Home Dwelling (A B C & D)
Number
Average Value
Number
Average Value
Number
Average Value
Number
Average Value
Number
Average Value
Number
Average Value
Number
Average Value
LOANS ORIGINATED
152
$176,233
117
$166,209
625
$177,766
22
$60,136
2
$1,959,945
62
$118,714
2
$142,040
APPLICATIONS APPROVED, NOT ACCEPTED
15
$196,821
12
$184,289
85
$192,131
18
$63,032
0
$0
10
$153,539
0
$0
APPLICATIONS DENIED
25
$193,702
15
$184,299
268
$185,253
26
$55,181
0
$0
30
$134,701
2
$130,490
APPLICATIONS WITHDRAWN
22
$188,379
18
$151,158
131
$192,453
2
$258,520
1
$200,100
19
$141,996
0
$0
FILES CLOSED FOR INCOMPLETENESS
1
$181,440
4
$108,955
50
$172,237
2
$199,120
0
$0
6
$66,217
0
$0
Aggregated Statistics For Year 2008 (Based on 4 full and 10 partial tracts)
A) FHA, FSA/RHS & VA Home Purchase Loans
B) Conventional Home Purchase Loans
C) Refinancings
D) Home Improvement Loans
E) Loans on Dwellings For 5+ Families
F) Non-occupant Loans on < 5 Family Dwellings (A B C & D)
G) Loans On Manufactured Home Dwelling (A B C & D)
Number
Average Value
Number
Average Value
Number
Average Value
Number
Average Value
Number
Average Value
Number
Average Value
Number
Average Value
LOANS ORIGINATED
105
$209,200
167
$191,791
526
$187,963
24
$67,490
5
$1,027,266
94
$150,331
3
$128,540
APPLICATIONS APPROVED, NOT ACCEPTED
14
$180,394
24
$200,533
102
$194,650
6
$73,805
1
$2,688,620
13
$184,300
1
$71,540
APPLICATIONS DENIED
24
$212,782
51
$182,333
358
$187,862
40
$96,372
0
$0
35
$144,631
8
$73,702
APPLICATIONS WITHDRAWN
14
$162,195
26
$197,236
122
$189,544
6
$110,613
0
$0
19
$163,394
2
$174,415
FILES CLOSED FOR INCOMPLETENESS
2
$173,145
9
$191,603
33
$210,969
2
$27,385
0
$0
3
$109,703
0
$0
Aggregated Statistics For Year 2007 (Based on 4 full and 10 partial tracts)
A) FHA, FSA/RHS & VA Home Purchase Loans
B) Conventional Home Purchase Loans
C) Refinancings
D) Home Improvement Loans
E) Loans on Dwellings For 5+ Families
F) Non-occupant Loans on < 5 Family Dwellings (A B C & D)
G) Loans On Manufactured Home Dwelling (A B C & D)
Number
Average Value
Number
Average Value
Number
Average Value
Number
Average Value
Number
Average Value
Number
Average Value
Number
Average Value
LOANS ORIGINATED
30
$211,552
568
$167,195
756
$171,315
68
$102,327
6
$665,703
281
$165,628
5
$118,682
APPLICATIONS APPROVED, NOT ACCEPTED
1
$367,220
83
$135,301
225
$167,102
19
$92,237
1
$865,150
42
$140,576
2
$63,065
APPLICATIONS DENIED
6
$235,808
161
$155,686
520
$168,952
69
$103,147
0
$0
84
$180,239
3
$68,653
APPLICATIONS WITHDRAWN
0
$0
64
$167,241
206
$175,144
17
$112,229
0
$0
31
$174,786
0
$0
FILES CLOSED FOR INCOMPLETENESS
0
$0
18
$134,694
52
$181,688
1
$24,880
0
$0
12
$175,242
0
$0
Aggregated Statistics For Year 2006 (Based on 4 full and 10 partial tracts)
A) FHA, FSA/RHS & VA Home Purchase Loans
B) Conventional Home Purchase Loans
C) Refinancings
D) Home Improvement Loans
E) Loans on Dwellings For 5+ Families
F) Non-occupant Loans on < 5 Family Dwellings (A B C & D)
G) Loans On Manufactured Home Dwelling (A B C & D)
Number
Average Value
Number
Average Value
Number
Average Value
Number
Average Value
Number
Average Value
Number
Average Value
Number
Average Value
LOANS ORIGINATED
40
$203,579
833
$135,743
790
$148,805
94
$82,773
5
$1,162,764
271
$130,422
5
$95,826
APPLICATIONS APPROVED, NOT ACCEPTED
2
$194,260
129
$115,988
181
$136,077
11
$94,871
0
$0
35
$107,587
3
$30,103
APPLICATIONS DENIED
6
$155,000
197
$126,150
384
$149,812
77
$99,052
4
$201,022
72
$143,467
1
$212,960
APPLICATIONS WITHDRAWN
4
$155,692
109
$150,886
280
$146,113
11
$114,823
0
$0
36
$123,426
0
$0
FILES CLOSED FOR INCOMPLETENESS
0
$0
23
$111,371
80
$145,952
5
$42,988
0
$0
4
$131,182
0
$0
Aggregated Statistics For Year 2005 (Based on 4 full and 10 partial tracts)
A) FHA, FSA/RHS & VA Home Purchase Loans
B) Conventional Home Purchase Loans
C) Refinancings
D) Home Improvement Loans
E) Loans on Dwellings For 5+ Families
F) Non-occupant Loans on < 5 Family Dwellings (A B C & D)
G) Loans On Manufactured Home Dwelling (A B C & D)
Number
Average Value
Number
Average Value
Number
Average Value
Number
Average Value
Number
Average Value
Number
Average Value
Number
Average Value
LOANS ORIGINATED
36
$168,838
1,129
$119,981
952
$134,570
68
$79,699
3
$730,303
333
$119,534
4
$139,450
APPLICATIONS APPROVED, NOT ACCEPTED
1
$137,890
195
$103,919
153
$143,349
9
$89,376
0
$0
45
$146,183
1
$137,890
APPLICATIONS DENIED
10
$153,727
235
$105,401
408
$135,384
67
$61,064
0
$0
69
$107,566
13
$53,366
APPLICATIONS WITHDRAWN
5
$136,696
157
$115,112
362
$142,688
17
$118,896
1
$379,330
54
$128,023
2
$137,375
FILES CLOSED FOR INCOMPLETENESS
1
$145,150
35
$117,439
90
$148,758
0
$0
0
$0
14
$148,308
0
$0
Aggregated Statistics For Year 2004 (Based on 4 full and 10 partial tracts)
A) FHA, FSA/RHS & VA Home Purchase Loans
B) Conventional Home Purchase Loans
C) Refinancings
D) Home Improvement Loans
E) Loans on Dwellings For 5+ Families
F) Non-occupant Loans on < 5 Family Dwellings (A B C & D)
G) Loans On Manufactured Home Dwelling (A B C & D)
Number
Average Value
Number
Average Value
Number
Average Value
Number
Average Value
Number
Average Value
Number
Average Value
Number
Average Value
LOANS ORIGINATED
84
$138,912
755
$113,188
842
$123,580
62
$54,506
5
$1,249,320
293
$113,748
6
$62,828
APPLICATIONS APPROVED, NOT ACCEPTED
12
$120,539
146
$89,936
158
$108,155
20
$61,483
0
$0
26
$112,552
4
$51,362
APPLICATIONS DENIED
12
$116,885
216
$90,168
394
$140,628
67
$59,021
0
$0
98
$99,469
8
$69,344
APPLICATIONS WITHDRAWN
14
$123,710
90
$118,364
304
$128,960
20
$56,138
2
$184,270
37
$120,992
7
$116,573
FILES CLOSED FOR INCOMPLETENESS
2
$173,020
20
$92,168
59
$129,952
0
$0
0
$0
8
$99,978
2
$123,725
Aggregated Statistics For Year 2003 (Based on 4 full and 10 partial tracts)
A) FHA, FSA/RHS & VA Home Purchase Loans
B) Conventional Home Purchase Loans
C) Refinancings
D) Home Improvement Loans
E) Loans on Dwellings For 5+ Families
F) Non-occupant Loans on < 5 Family Dwellings (A B C & D)
Number
Average Value
Number
Average Value
Number
Average Value
Number
Average Value
Number
Average Value
Number
Average Value
LOANS ORIGINATED
121
$134,685
578
$110,411
1,847
$113,410
54
$28,039
7
$862,003
298
$101,762
APPLICATIONS APPROVED, NOT ACCEPTED
13
$127,698
98
$95,598
209
$115,721
9
$20,754
0
$0
32
$113,581
APPLICATIONS DENIED
25
$149,882
170
$100,012
467
$113,522
65
$26,046
0
$0
73
$99,320
APPLICATIONS WITHDRAWN
15
$125,858
94
$108,633
325
$118,804
8
$75,094
0
$0
42
$100,893
FILES CLOSED FOR INCOMPLETENESS
3
$175,847
21
$119,460
62
$130,479
2
$24,165
0
$0
8
$99,951
Aggregated Statistics For Year 2002 (Based on 4 full and 10 partial tracts)
A) FHA, FSA/RHS & VA Home Purchase Loans
B) Conventional Home Purchase Loans
C) Refinancings
D) Home Improvement Loans
E) Loans on Dwellings For 5+ Families
F) Non-occupant Loans on < 5 Family Dwellings (A B C & D)
Number
Average Value
Number
Average Value
Number
Average Value
Number
Average Value
Number
Average Value
Number
Average Value
LOANS ORIGINATED
147
$120,254
444
$107,856
1,109
$109,599
40
$34,694
10
$1,104,958
238
$100,476
APPLICATIONS APPROVED, NOT ACCEPTED
11
$121,438
47
$112,436
137
$112,847
6
$34,632
0
$0
17
$111,785
APPLICATIONS DENIED
15
$110,738
98
$84,700
305
$111,385
56
$15,979
0
$0
33
$120,982
APPLICATIONS WITHDRAWN
7
$128,134
63
$100,910
250
$125,309
6
$56,412
0
$0
32
$116,036
FILES CLOSED FOR INCOMPLETENESS
2
$116,620
21
$90,053
66
$102,222
2
$13,665
0
$0
5
$98,318
Aggregated Statistics For Year 2001 (Based on 4 full and 10 partial tracts)
A) FHA, FSA/RHS & VA Home Purchase Loans
B) Conventional Home Purchase Loans
C) Refinancings
D) Home Improvement Loans
E) Loans on Dwellings For 5+ Families
F) Non-occupant Loans on < 5 Family Dwellings (A B C & D)
Number
Average Value
Number
Average Value
Number
Average Value
Number
Average Value
Number
Average Value
Number
Average Value
LOANS ORIGINATED
200
$118,562
313
$110,480
891
$108,162
63
$20,747
6
$1,187,337
132
$109,575
APPLICATIONS APPROVED, NOT ACCEPTED
21
$119,160
36
$99,863
114
$108,543
16
$53,039
2
$836,110
23
$104,450
APPLICATIONS DENIED
10
$134,711
93
$80,398
315
$96,040
45
$15,323
0
$0
40
$82,970
APPLICATIONS WITHDRAWN
10
$120,288
33
$84,081
234
$112,846
11
$12,296
0
$0
9
$64,513
FILES CLOSED FOR INCOMPLETENESS
4
$152,698
8
$112,650
40
$103,439
3
$21,293
2
$578,600
0
$0
Aggregated Statistics For Year 2000 (Based on 4 full and 10 partial tracts)
A) FHA, FSA/RHS & VA Home Purchase Loans
B) Conventional Home Purchase Loans
C) Refinancings
D) Home Improvement Loans
E) Loans on Dwellings For 5+ Families
F) Non-occupant Loans on < 5 Family Dwellings (A B C & D)
Number
Average Value
Number
Average Value
Number
Average Value
Number
Average Value
Number
Average Value
Number
Average Value
LOANS ORIGINATED
171
$116,969
316
$94,346
298
$87,769
64
$20,676
5
$1,048,034
95
$84,358
APPLICATIONS APPROVED, NOT ACCEPTED
11
$103,321
61
$79,482
57
$98,646
22
$10,594
0
$0
23
$96,273
APPLICATIONS DENIED
21
$122,765
110
$75,576
186
$74,575
66
$23,676
0
$0
41
$58,484
APPLICATIONS WITHDRAWN
20
$127,064
58
$101,669
82
$85,455
17
$23,198
0
$0
12
$74,434
FILES CLOSED FOR INCOMPLETENESS
1
$179,370
9
$76,436
26
$91,794
0
$0
0
$0
4
$61,515
Aggregated Statistics For Year 1999 (Based on 2 full and 4 partial tracts)
A) FHA, FSA/RHS & VA Home Purchase Loans
B) Conventional Home Purchase Loans
C) Refinancings
D) Home Improvement Loans
E) Loans on Dwellings For 5+ Families
F) Non-occupant Loans on < 5 Family Dwellings (A B C & D)
2003 - 2018 National Fire Incident Reporting System (NFIRS) incidents
According to the data from the years 2003 - 2018 the average number of fire incidents per year is 49. The highest number of fire incidents - 102 took place in 2015, and the least - 7 in 2016. The data has a rising trend.
When looking into fire subcategories, the most incidents belonged to: Outside Fires (55.1%), and Structure Fires (25.4%).
Fire incident types reported to NFIRS in Zip Code 98663


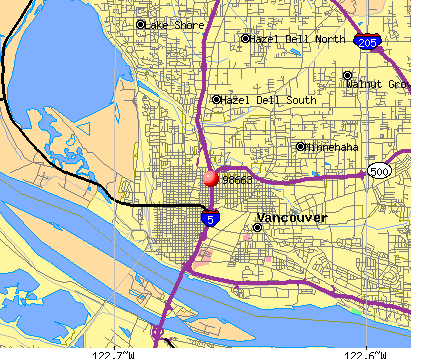 Nearest zip codes: 98665, 98661, 98660, 98685, 97217, 98686.


 According to the data from the years 2003 - 2018 the average number of fire incidents per year is 49. The highest number of fire incidents - 102 took place in 2015, and the least - 7 in 2016. The data has a rising trend.
 When looking into fire subcategories, the most incidents belonged to: Outside Fires (55.1%), and Structure Fires (25.4%).