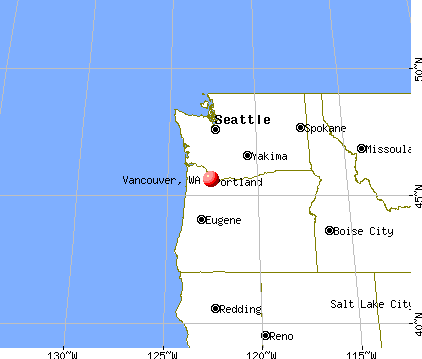
Vancouver, Washington
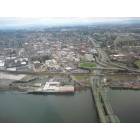
Vancouver: Downtown from Above

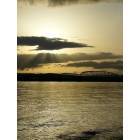
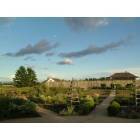
Vancouver: Looking East on the Columbia River
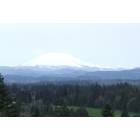
Vancouver: View from Mt. Vista(Salmon Creek), looking at Mt. St. Helens
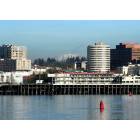
Vancouver: Looking at the I5 bridge beside the Columbia river
Vancouver: Mt St Helens letting off some steam behind Vancouver WA.
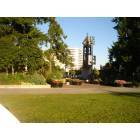
Vancouver: the park
Vancouver: Ft.Vancouver
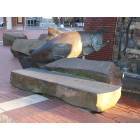
Vancouver: Bench at Esther Short Park
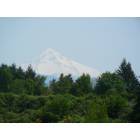
Vancouver: Mount Hood from Vancouver
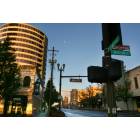
Vancouver: photo of Smith Tower on 6th and main street. in downtown Vancouver WA
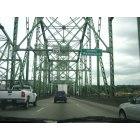
Vancouver: Entering Vancouver Wa on I-5
- see
43
more - add
your
Submit your own pictures of this city and show them to the world
- OSM Map
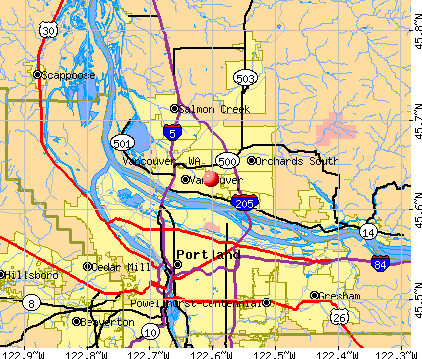
- General Map
- Google Map
- MSN Map
Population change since 2000: +35.5%
 |
| Males: 96,915 | |
| Females: 97,597 |
| Median resident age: | 36.8 years |
| Washington median age: | 38.4 years |
Zip codes: 98660, 98664, 98683, 98684.
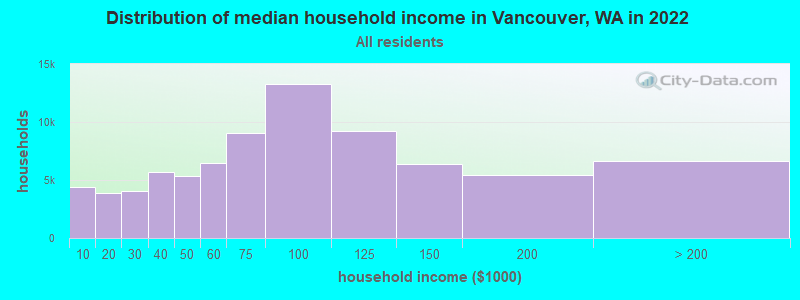
Vancouver Zip Code Map| Vancouver: | $76,799 |
| WA: | $91,306 |
Estimated per capita income in 2022: $41,276 (it was $20,192 in 2000)
Vancouver city income, earnings, and wages data
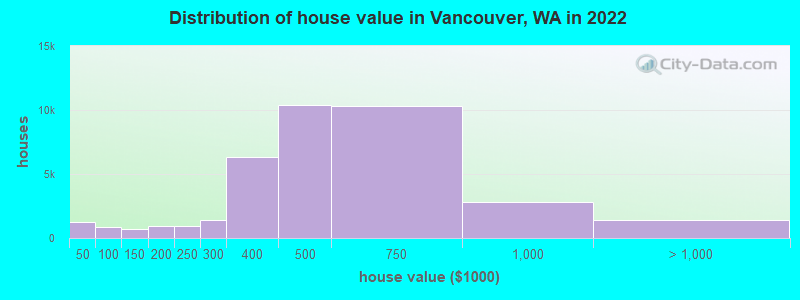
Estimated median house or condo value in 2022: $472,300 (it was $140,800 in 2000)
| Vancouver: | $472,300 |
| WA: | $569,500 |
Mean prices in 2022: all housing units: $498,843; detached houses: $525,533; townhouses or other attached units: $434,402; in 2-unit structures: $406,921; in 3-to-4-unit structures: $249,298; in 5-or-more-unit structures: $433,104; mobile homes: $141,917; occupied boats, rvs, vans, etc.: $153,475
Median gross rent in 2022: $1,565.
(9.1% for White Non-Hispanic residents, 25.6% for Black residents, 10.1% for Hispanic or Latino residents, 9.2% for American Indian residents, 31.9% for Native Hawaiian and other Pacific Islander residents, 13.8% for other race residents, 9.2% for two or more races residents)
Detailed information about poverty and poor residents in Vancouver, WA


Compare current foreclosures in Vancouver, WA:
| Photo | Address | Area | Beds / Baths | Price | Details |
|---|---|---|---|---|---|

|
#1
NE 34th Ave Apt 4b
Vancouver, WA 98665
|
1,186 sq. feet
|
3 baths 2 beds |
show details | |

|
#2
Rossiter Ln
Vancouver, WA 98661
|
1,519 sq. feet
|
3 baths 2 beds |
show details | |

|
#3
NE Nicholson Loop
Vancouver, WA 98661
|
1,246 sq. feet
|
3 baths 3 beds |
show details | |

|
#4
NE 43rd St
Vancouver, WA 98661
|
1,726 sq. feet
|
2 baths 3 beds |
show details | |

|
#5
Ne82nd Street
Vancouver, WA 98662
|
- sq. feet
|
1 baths 3 beds |
show details | |

|
#6
NE 97th St
Vancouver, WA 98682
|
1,432 sq. feet
|
1 baths 3 beds |
show details | |

|
#7
NE 162nd Pl
Vancouver, WA 98684
|
1,240 sq. feet
|
2 baths 3 beds |
show details | |

|
#8
NE 72nd Ave
Vancouver, WA 98686
|
2,347 sq. feet
|
1 baths 3 beds |
show details | |

|
#9
Ne133rd Ave
Vancouver, WA 98682
|
- sq. feet
|
2 baths 3 beds |
show details | |

|
#10
NE 77th Ave
Vancouver, WA 98664
|
1,094 sq. feet
|
2 baths 2 beds |
show details |
| Photo | Address | Area | Beds / Baths | Price | Details |
|---|---|---|---|---|---|

|
#11
Ne80th St
Vancouver, WA 98682
|
1,591 sq. feet
|
2 baths 3 beds |
show details | |

|
#12
NE 16th St
Vancouver, WA 98664
|
- sq. feet
|
2 baths 3 beds |
show details | |

|
#13
NE 69th St
Vancouver, WA 98662
|
960 sq. feet
|
1 baths 3 beds |
show details | |

|
#14
NE 49th St
Vancouver, WA 98661
|
1,928 sq. feet
|
2 baths 3 beds |
show details | |

|
#15
O St
Vancouver, WA 98663
|
784 sq. feet
|
1 baths 1 beds |
show details | |

|
#16
NE 135th Ave
Vancouver, WA 98682
|
2,036 sq. feet
|
2 baths 4 beds |
show details | |

|
#17
NE 13th Ave
Vancouver, WA 98685
|
1,344 sq. feet
|
2 baths 3 beds |
show details | |

|
#18
NE Morrow Rd
Vancouver, WA 98682
|
1,808 sq. feet
|
2 baths 5 beds |
show details | |

|
#19
Norris Rd
Vancouver, WA 98661
|
1,116 sq. feet
|
1 baths 3 beds |
show details | |

|
#20
NE 109th St
Vancouver, WA 98686
|
1,432 sq. feet
|
2 baths 3 beds |
show details |
| Photo | Address | Area | Beds / Baths | Price | Details |
|---|---|---|---|---|---|

|
#21
NE 85th Cir
Vancouver, WA 98665
|
2,155 sq. feet
|
3 baths 3 beds |
show details | |

|
#22
NE 96th Ave
Vancouver, WA 98662
|
1,270 sq. feet
|
2 baths 3 beds |
show details | |

|
#23
NE 111th St
Vancouver, WA 98686
|
2,015 sq. feet
|
2 baths 4 beds |
show details | |

|
#24
NE 23rd Ave
Vancouver, WA 98663
|
1,280 sq. feet
|
1 baths 3 beds |
show details | |

|
#25
E 24th St
Vancouver, WA 98661
|
720 sq. feet
|
1 baths 2 beds |
show details | |

|
#26
NE 22nd Ct
Vancouver, WA 98665
|
3,073 sq. feet
|
4 baths 5 beds |
show details | |

|
#27
NE 32nd St
Vancouver, WA 98682
|
1,094 sq. feet
|
2 baths 3 beds |
show details | |

|
#28
Carlson Rd
Vancouver, WA 98661
|
1,032 sq. feet
|
1 baths 3 beds |
show details | |

|
#29
NE 85th Cir
Vancouver, WA 98662
|
1,635 sq. feet
|
1 baths 3 beds |
show details | |

|
#30
U St
Vancouver, WA 98663
|
1,008 sq. feet
|
1 baths 3 beds |
show details |
| Photo | Address | Area | Beds / Baths | Price | Details |
|---|---|---|---|---|---|

|
#31
Clair St
Vancouver, WA 98661
|
2,520 sq. feet
|
2 baths 4 beds |
show details | |

|
#32
NE 105th Ave
Vancouver, WA 98662
|
3,444 sq. feet
|
5 baths 6 beds |
show details | |

|
#33
NE 65th St
Vancouver, WA 98661
|
1,125 sq. feet
|
1 baths 2 beds |
show details | |

|
#34
SE Columbia Ridge Dr
Vancouver, WA 98664
|
845 sq. feet
|
2 baths 2 beds |
show details | |

|
#35
NE 42nd St
Vancouver, WA 98661
|
1,056 sq. feet
|
1 baths 3 beds |
show details | |

|
#36
NE 36th St
Vancouver, WA 98682
|
1,328 sq. feet
|
2 baths 3 beds |
show details | |

|
#37
Q St
Vancouver, WA 98663
|
1,547 sq. feet
|
2 baths 3 beds |
show details | |

|
#38
NE 37th Ct
Vancouver, WA 98686
|
2,244 sq. feet
|
3 baths 3 beds |
show details | |

|
#39
NE 155th Ave
Vancouver, WA 98682
|
988 sq. feet
|
1 baths 3 beds |
show details | |

|
#40
NE 30th St
Vancouver, WA 98662
|
1,304 sq. feet
|
1 baths 3 beds |
show details |
| Photo | Address | Area | Beds / Baths | Price | Details |
|---|---|---|---|---|---|

|
#41
NW 131st St
Vancouver, WA 98685
|
2,102 sq. feet
|
3 baths 3 beds |
show details | |

|
#42
E 19th St
Vancouver, WA 98663
|
1,498 sq. feet
|
1 baths 2 beds |
show details | |

|
#43
E 28th St
Vancouver, WA 98663
|
974 sq. feet
|
1 baths 2 beds |
show details | |

|
#44
NE 217th Ct
Vancouver, WA 98682
|
2,072 sq. feet
|
3 baths 3 beds |
show details | |

|
#45
NE 58th Ave
Vancouver, WA 98661
|
2,420 sq. feet
|
1 baths 2 beds |
show details | |

|
#46
Rossiter Ln
Vancouver, WA 98661
|
1,182 sq. feet
|
2 baths 3 beds |
show details | |

|
#47
NE 88th Cir
Vancouver, WA 98682
|
1,996 sq. feet
|
3 baths 3 beds |
show details | |

|
#48
NE 102nd Ct
Vancouver, WA 98662
|
1,342 sq. feet
|
4 baths 5 beds |
show details | |

|
#49
NW 10th Ct
Vancouver, WA 98665
|
1,130 sq. feet
|
1 baths 4 beds |
show details | |

|
Check over 1 million property listings on Foreclosure.com!
|
browse all offers | |||


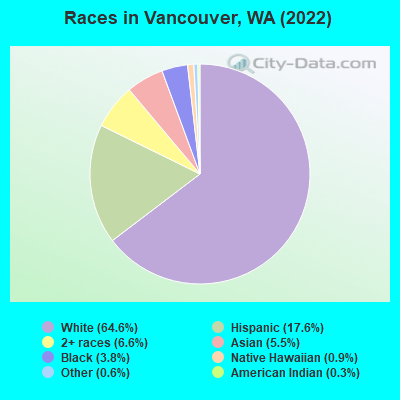
- 125,70764.6%White alone
- 34,22317.6%Hispanic
- 12,9146.6%Two or more races
- 10,6875.5%Asian alone
- 7,4133.8%Black alone
- 1,7380.9%Native Hawaiian and Other
Pacific Islander alone - 1,2090.6%Other race alone
- 6180.3%American Indian alone
Races in Vancouver detailed stats: ancestries, foreign born residents, place of birth
According to our research of Washington and other state lists, there were 249 registered sex offenders living in Vancouver, Washington as of April 27, 2024.
The ratio of all residents to sex offenders in Vancouver is 702 to 1.
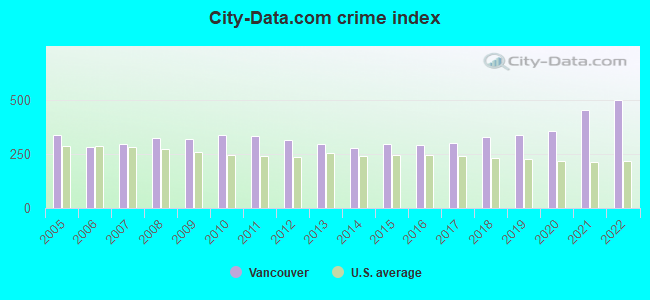
The City-Data.com crime index weighs serious crimes and violent crimes more heavily. Higher means more crime, U.S. average is 246.1. It adjusts for the number of visitors and daily workers commuting into cities.
- means the value is smaller than the state average.- means the value is about the same as the state average.
- means the value is bigger than the state average.
- means the value is much bigger than the state average.
Crime rate in Vancouver detailed stats: murders, rapes, robberies, assaults, burglaries, thefts, arson
Full-time law enforcement employees in 2021, including police officers: 262 (214 officers - 183 male; 31 female).
| Officers per 1,000 residents here: | 1.14 |
| Washington average: | 1.35 |
 Recent articles from our blog. Our writers, many of them Ph.D. graduates or candidates, create easy-to-read articles on a wide variety of topics.

 | Vancouver Innovation Center proposal in East Vancouver (13 replies) |
| Getting a Sense of Vancouver (9 replies) |
| Vancouver and surrounding neighborhoods for potential move (34 replies) |
| Questions about retiring to Vancouver (41 replies) |
| Fun, walkable neighborhoods in Vancouver, WA (3 replies) |
| Vancouver area school bond results (11 replies) |
Latest news from Vancouver, WA collected exclusively by city-data.com from local newspapers, TV, and radio stations
Vancouver, WA City Guides:
Ancestries: German (8.4%), American (6.6%), English (6.2%), Irish (5.0%), European (3.8%), Ukrainian (2.9%).
Current Local Time: PST time zone
Incorporated in 1857
Elevation: 150 feet
Land area: 42.8 square miles.
Population density: 4,545 people per square mile (average).
27,493 residents are foreign born (4.8% Latin America, 4.0% Asia, 3.3% Europe).
| This city: | 14.1% |
| Washington: | 14.9% |
Median real estate property taxes paid for housing units with mortgages in 2022: $3,565 (0.7%)
Median real estate property taxes paid for housing units with no mortgage in 2022: $3,752 (0.8%)
Nearest city with pop. 200,000+: Portland, OR  (7.9 miles , pop. 529,121).
Nearest city with pop. 1,000,000+: Los Angeles, CA (829.3 miles , pop. 3,694,820).
Nearest cities:
), ), ), ), ), )Latitude: 45.63 N, Longitude: 122.60 W
Daytime population change due to commuting: +25,310 (+13.0%)
Workers who live and work in this city: 51,393 (54.0%)
Area code: 360
Property values in Vancouver, WA
Vancouver tourist attractions:
- Westfield Vancouver - Vancouver, Washington - Great Location Shopping Center Mall in the Heart of Vancouver
- Fort Vancouver National Historic Site - Vancouver, Washington - Located Along the Columbia River and Home to a Wide Variety of Species
- The Academy - Vancouver, Washington - From Boarding School for Girls to World Renowned Wedding Chapel
- Salmon Creek Park - Vancouver, Washington - A Prime Swimming Location and Scenic Three Mile Trail
- Beacon Rock - Vancouver, Washington - State Park that Sits in the Core of an Ancient Volcano
- Esther Short Park - Vancouver, Washington - Located in the Heart of the City and Providing Entertainment for Every Genre from Ringing Bells to Public Concerts
- Vancouver Lake Park - Vancouver, Washington - A Scenic Park with Views of Three Major Mountains
- Dalles Dam - Vancouver, Washington - Offers Fish Viewing Tours and Lots of Power
- Heathman Lodge - Vancouver, Washington - Rustic Luxury Hotel Located on Columbia River
Vancouver, Washington accommodation & food services, waste management - Economy and Business Data
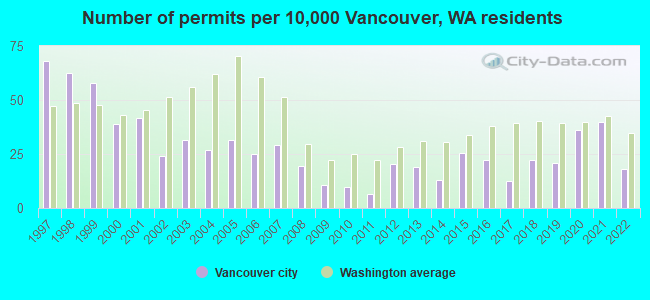
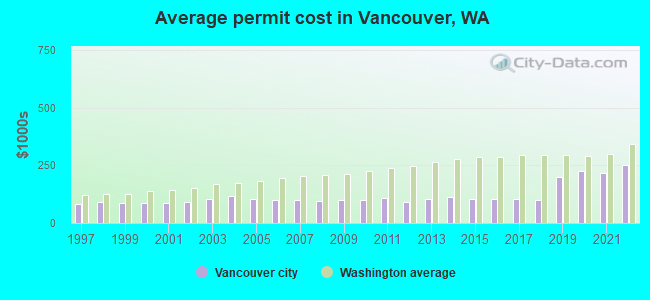
Single-family new house construction building permits:
- 2022: 262 buildings, average cost: $252,700
- 2021: 572 buildings, average cost: $215,800
- 2020: 517 buildings, average cost: $224,700
- 2019: 300 buildings, average cost: $200,700
- 2018: 317 buildings, average cost: $101,300
- 2017: 177 buildings, average cost: $104,100
- 2016: 319 buildings, average cost: $103,400
- 2015: 366 buildings, average cost: $102,500
- 2014: 189 buildings, average cost: $111,000
- 2013: 272 buildings, average cost: $106,100
- 2012: 292 buildings, average cost: $92,400
- 2011: 96 buildings, average cost: $110,200
- 2010: 137 buildings, average cost: $98,300
- 2009: 152 buildings, average cost: $97,900
- 2008: 280 buildings, average cost: $95,700
- 2007: 420 buildings, average cost: $100,500
- 2006: 359 buildings, average cost: $102,200
- 2005: 454 buildings, average cost: $105,500
- 2004: 388 buildings, average cost: $115,800
- 2003: 452 buildings, average cost: $105,700
- 2002: 345 buildings, average cost: $92,600
- 2001: 596 buildings, average cost: $87,700
- 2000: 556 buildings, average cost: $87,900
- 1999: 829 buildings, average cost: $86,200
- 1998: 897 buildings, average cost: $91,500
- 1997: 974 buildings, average cost: $83,600
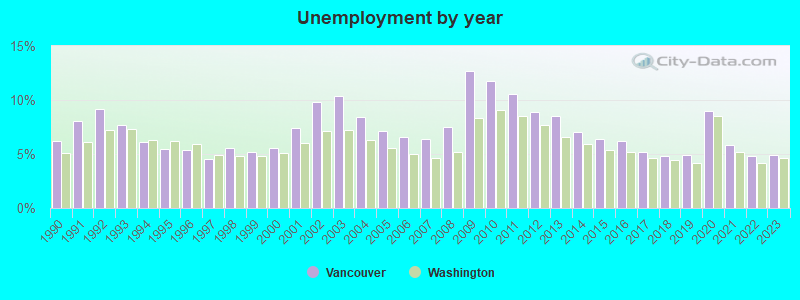
| Here: | 4.9% |
| Washington: | 4.6% |
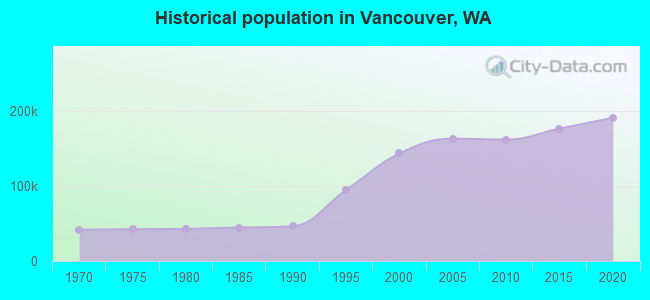
Population change in the 1990s: +37,831 (+35.8%).
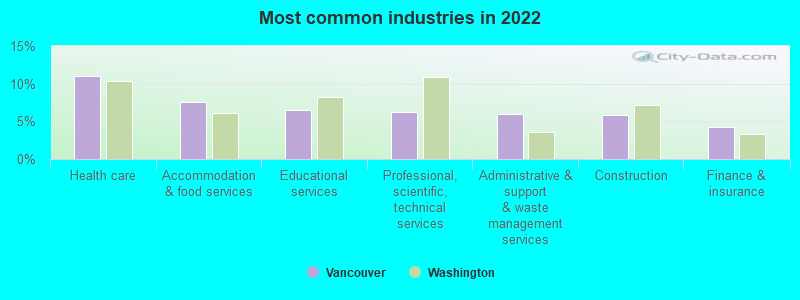
- Health care (11.0%)
- Accommodation & food services (7.6%)
- Educational services (6.6%)
- Professional, scientific, technical services (6.3%)
- Administrative & support & waste management services (6.0%)
- Construction (5.9%)
- Finance & insurance (4.3%)
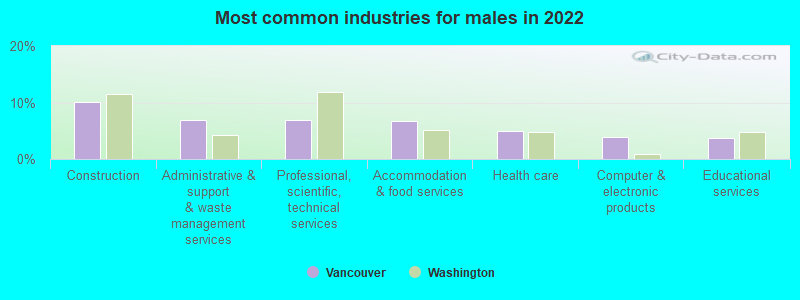
- Construction (10.1%)
- Administrative & support & waste management services (7.0%)
- Professional, scientific, technical services (6.9%)
- Accommodation & food services (6.8%)
- Health care (5.0%)
- Computer & electronic products (4.0%)
- Educational services (3.7%)
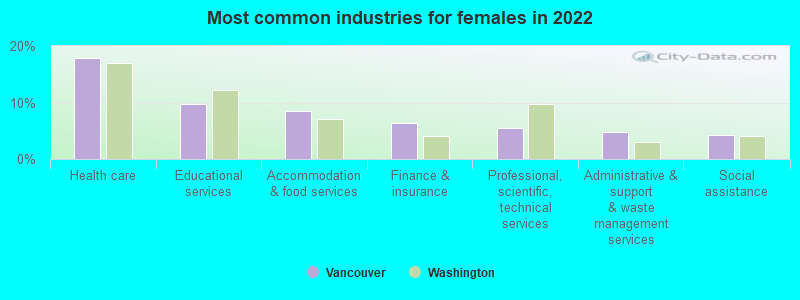
- Health care (17.9%)
- Educational services (9.8%)
- Accommodation & food services (8.6%)
- Finance & insurance (6.3%)
- Professional, scientific, technical services (5.6%)
- Administrative & support & waste management services (4.8%)
- Social assistance (4.3%)
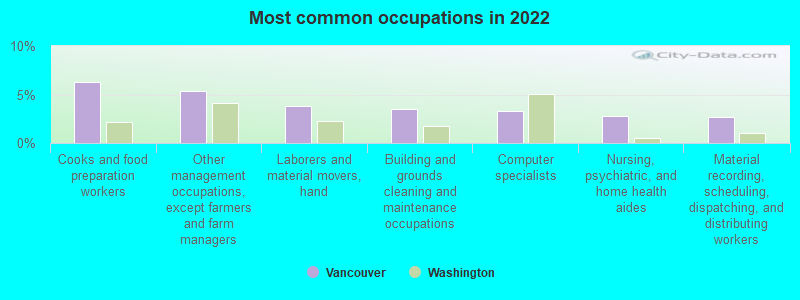
- Cooks and food preparation workers (6.3%)
- Other management occupations, except farmers and farm managers (5.4%)
- Laborers and material movers, hand (3.8%)
- Building and grounds cleaning and maintenance occupations (3.5%)
- Computer specialists (3.3%)
- Nursing, psychiatric, and home health aides (2.8%)
- Material recording, scheduling, dispatching, and distributing workers (2.6%)
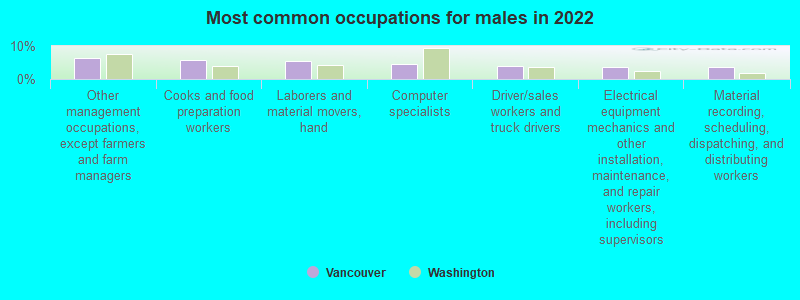
- Other management occupations, except farmers and farm managers (6.3%)
- Cooks and food preparation workers (5.7%)
- Laborers and material movers, hand (5.5%)
- Computer specialists (4.4%)
- Driver/sales workers and truck drivers (4.1%)
- Electrical equipment mechanics and other installation, maintenance, and repair workers, including supervisors (3.5%)
- Material recording, scheduling, dispatching, and distributing workers (3.5%)
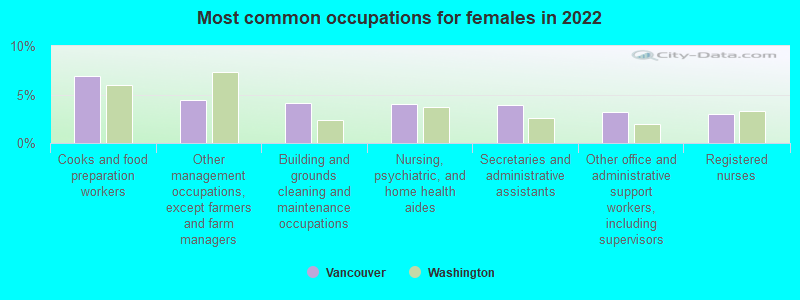
- Cooks and food preparation workers (6.9%)
- Other management occupations, except farmers and farm managers (4.4%)
- Building and grounds cleaning and maintenance occupations (4.1%)
- Nursing, psychiatric, and home health aides (4.1%)
- Secretaries and administrative assistants (4.0%)
- Other office and administrative support workers, including supervisors (3.2%)
- Registered nurses (3.0%)
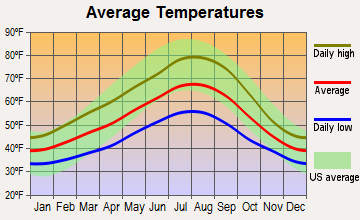
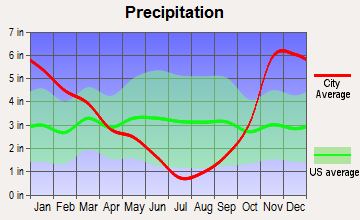
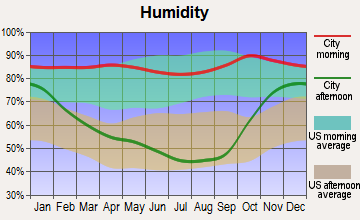
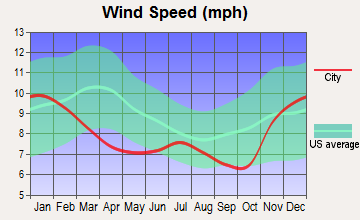
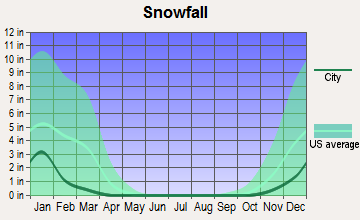
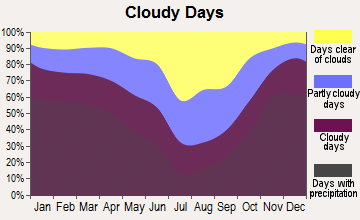
Average climate in Vancouver, Washington
Based on data reported by over 4,000 weather stations

|
|

(lower is better)
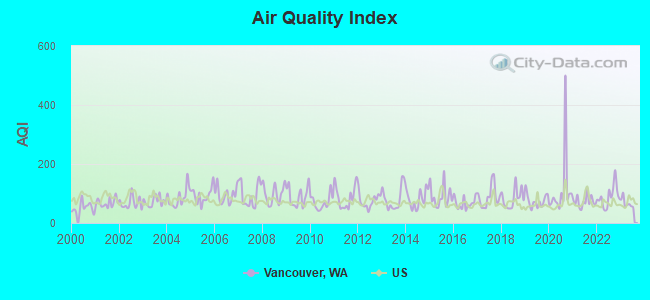
Air Quality Index (AQI) level in 2023 was 67.7. This is about average.
| City: | 67.7 |
| U.S.: | 72.6 |
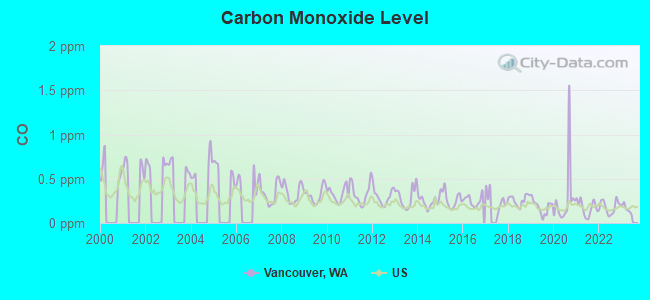
Carbon Monoxide (CO) [ppm] level in 2022 was 0.181. This is better than average. Closest monitor was 3.1 miles away from the city center.
| City: | 0.181 |
| U.S.: | 0.251 |
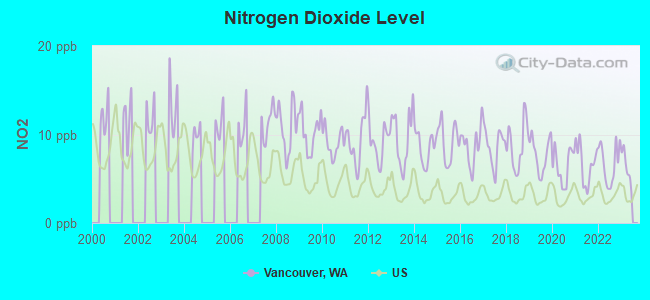
Nitrogen Dioxide (NO2) [ppb] level in 2022 was 6.68. This is worse than average. Closest monitor was 4.3 miles away from the city center.
| City: | 6.68 |
| U.S.: | 5.11 |
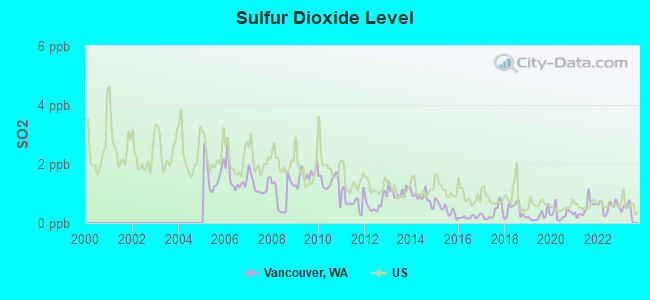
Sulfur Dioxide (SO2) [ppb] level in 2022 was 0.569. This is significantly better than average. Closest monitor was 3.1 miles away from the city center.
| City: | 0.569 |
| U.S.: | 1.515 |
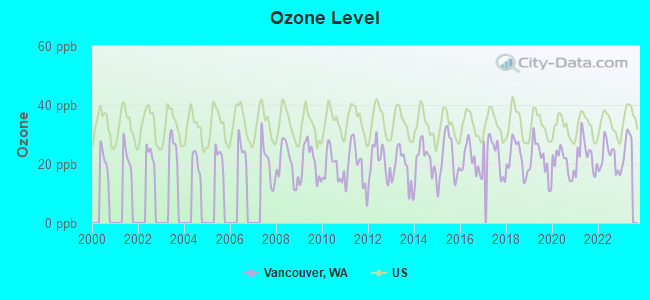
Ozone [ppb] level in 2022 was 22.1. This is significantly better than average. Closest monitor was 3.1 miles away from the city center.
| City: | 22.1 |
| U.S.: | 33.3 |
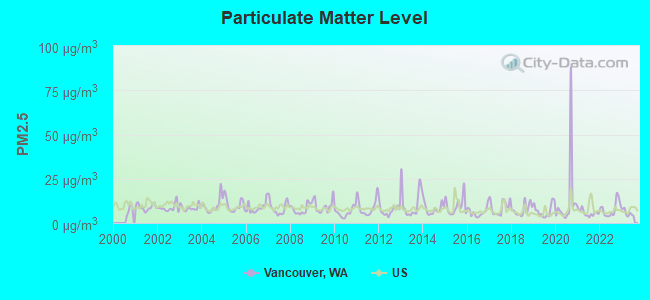
Particulate Matter (PM2.5) [µg/m3] level in 2023 was 5.58. This is significantly better than average. Closest monitor was 1.0 miles away from the city center.
| City: | 5.58 |
| U.S.: | 8.11 |
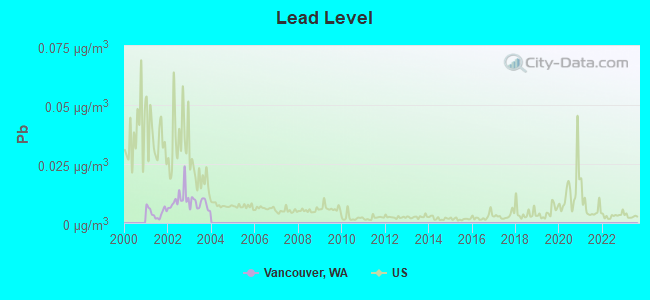
Lead (Pb) [µg/m3] level in 2003 was 0.00810. This is about average. Closest monitor was 1.3 miles away from the city center.
| City: | 0.00810 |
| U.S.: | 0.00931 |
Earthquake activity:
Vancouver-area historical earthquake activity is significantly above Washington state average. It is 1488% greater than the overall U.S. average.On 4/13/1949 at 19:55:42, a magnitude 7.0 (7.0 UK, Class: Major, Intensity: VIII - XII) earthquake occurred 111.9 miles away from the city center, causing $80,000,000 total damage
On 2/28/2001 at 18:54:32, a magnitude 6.8 (6.5 MB, 6.6 MS, 6.8 MW, Class: Strong, Intensity: VII - IX) earthquake occurred 100.7 miles away from Vancouver center, causing $2,000,000,000 total damage and $305,000,000 insured losses
On 2/28/2001 at 18:54:32, a magnitude 6.8 (6.8 MD, Depth: 32.2 mi) earthquake occurred 105.0 miles away from the city center
On 4/29/1965 at 15:28:43, a magnitude 6.6 (6.6 UK) earthquake occurred 117.1 miles away from Vancouver center, causing $28,000,000 total damage
On 1/31/1922 at 13:17:28, a magnitude 7.6 (7.6 UK) earthquake occurred 372.2 miles away from Vancouver center
On 11/8/1980 at 10:27:34, a magnitude 7.2 (6.2 MB, 7.2 MS, 7.2 MW, 7.0 ML) earthquake occurred 324.3 miles away from the city center
Magnitude types: body-wave magnitude (MB), duration magnitude (MD), local magnitude (ML), surface-wave magnitude (MS), moment magnitude (MW)
Natural disasters:
The number of natural disasters in Clark County (13) is near the US average (15).Major Disasters (Presidential) Declared: 12
Emergencies Declared: 1
Causes of natural disasters: Floods: 7, Mudslides: 4, Storms: 4, Winter Storms: 4, Landslides: 3, Winds: 2, Earthquake: 1, Heavy Rain: 1, Hurricane: 1, Snow: 1, Tornado: 1, Volcanic Eruption: 1, Other: 1 (Note: some incidents may be assigned to more than one category).

Main business address for: NAUTILUS, INC. ([3949]), RIVERVIEW BANCORP INC (SAVINGS INSTITUTION, FEDERALLY CHARTERED), WESTERN POWER & EQUIPMENT CORP (WHOLESALE-CONSTRUCTION & MINING (NO PETRO) MACHINERY & EQUIP).
Hospitals in Vancouver:
- HOSPICE OF CLARK COUNTY (316 E FOURTH PLAIN BLVD, SUITE B)
- HOSPICE SOUTHWEST (100 EAST 33RD ST STE 201)
- LEGACY SALMON CREEK MEDICAL CENTER (Voluntary non-profit - Private, provides emergency services, 2211 NE 139TH STREET)
- PEACEHEALTH SOUTHWEST MEDICAL CENTER (Voluntary non-profit - Private, 400 NE MOTHER JOSEPH PLACE)
- ST JOSEPH COMMUNITY HOSPITAL (600 N E 92ND AVENUE)
Nursing Homes in Vancouver:
- CASCADE PARK CARE CENTER (801 SOUTHEAST PARK CREST AVENUE)
- DISCOVERY NURSING AND REHAB OF VANCOUVER (5220 NORTHEAST HAZEL DELL AVENUE)
- EMERALD TERRACE NURSING CENTER (1015 N GARRISON RD)
- FORT VANCOUVER CONVALESCENT C (8507 NORTHEAST 8TH WAY)
- HERITAGE HEALTH AND REHABILITATION CENTER (3605 Y STREET)
- KINDRED TRANSITIONAL CARE AND REHAB CTR VANCOUVER (400 EAST 33RD STREET)
- MANORCARE HEALTH SERVICES - SALMON CREEK (2811 NE 139TH STREET)
- OREGON-WASHINGTON PYTHIAN HOME (3409 MAIN STREET)
- PACIFIC SPECIALTY AND REHAB CARE (1015 NORTH GARRISON ROAD)
- ROSE VISTA NURSING CENTER (5001 COLUMBIA VIEW DRIVE)
- WHISPERING PINES CARE CENTER (5220 HAZEL DELL AVE NE)
Dialysis Facilities in Vancouver:
- PNRS FT VANCOUVER (312 SE STONEMILL DR SUITE 150)
- PNRS SALMON CREEK (9105 HIGHWAY 99 STE 102)
- VANCOUVER DIALYSIS CENTER (9120 NE VANCOUVER MALL DR SUITE 160)
Home Health Centers in Vancouver:
Airports and heliports located in Vancouver:
- Pearson Field Airport (VUO) (Runways: 1, Air Taxi Ops: 100, Itinerant Ops: 34,125, Local Ops: 18,375, Military Ops: 500)
- Fly For Fun Airport (W56) (Runways: 1, Itinerant Ops: 2,800, Local Ops: 800)
- Evergreen North-South Airpark Airport (WA81) (Runways: 1)
- Green Mountain Airport (WA67) (Runways: 1)
- Robert L Delanoy Airport (28WA) (Runways: 1)
- Legacy Salmon Creek Hospital Heliport (1WA0)
- Ross Complex Heliport (WN38)
- Southwest Washington Medical Center Heliport (WN67)
- St Joseph Community Hospital Heliport (21WA)
Colleges/Universities in Vancouver:
- Clark College (Full-time enrollment: 9,330; Location: 1933 Fort Vancouver Way; Public; Website: www.clark.edu)
- International Air and Hospitality Academy (Full-time enrollment: 923; Location: 2901 E Mill Plain Blvd; Private, for-profit; Website: www.aha.edu)
- Everest College-Vancouver (Full-time enrollment: 465; Location: 120 NE 136th Ave Ste 130; Private, for-profit; Website: www.everest.edu/campus/vancouver)
- Emil Fries Piano Hospital and Training Center (Full-time enrollment: 6; Location: 2510 E Evergreen Blvd; Private, not-for-profit; Website: www.pianotuningschool.org)
- Everest College-Vancouver Massage Therapy (Location: 120 NE 136th Ave- Ste 220; Private, for-profit)
Other colleges/universities with over 2000 students near Vancouver:
- Concordia University-Portland (about 5 miles; Portland, OR; Full-time enrollment: 3,996)
- University of Portland (about 8 miles; Portland, OR; FT enrollment: 4,030)
- Portland State University (about 10 miles; Portland, OR; FT enrollment: 21,450)
- Mt Hood Community College (about 14 miles; Gresham, OR; FT enrollment: 11,847)
- Lewis & Clark College (about 14 miles; Portland, OR; FT enrollment: 2,864)
- Portland Community College (about 15 miles; Portland, OR; FT enrollment: 23,600)
- Clackamas Community College (about 22 miles; Oregon City, OR; FT enrollment: 4,261)
Biggest public high schools in Vancouver:
- CLARK COUNTY JUVENILE DETENTION SCHOOL (Location: 500 WEST 11TH ST, Grades: 3-12)
- WASHINGTON STATE SCHOOL FOR THE DEAF (Location: 611 GRAND BLVD, Grades: PK-12)
- WASHINGTON STATE SCHOOL FOR THE BLIND (Location: 2214 E. 13TH ST., Grades: PK-12)
- LEGACY HIGH SCHOOL (Location: 2205 E 138TH AVENUE, Grades: 9-12)
- EVERGREEN HIGH SCHOOL (Location: 14300 NE 18TH STREET, Grades: 9-12)
- 49TH STREET ACADEMY (Location: 14619B NE 49TH STREET, Grades: KG-12)
- MOUNTAIN VIEW HIGH SCHOOL (Location: 1500 SE BLAIRMONT DR, Grades: 9-12)
- CLARK COUNTY SKILLS CENTER (Location: 12200 NE 28TH STREET, Grades: 9-12)
- IQ ACADEMY WASHINGTON (Location: 9105 NE 9TH STREET, Grades: 7-12)
- HERITAGE HIGH SCHOOL (Location: 7825 NE 130TH AVENUE, Grades: 9-12)
Private high schools in Vancouver:
- KINGS WAY CHRISTIAN SCHOOLS (Students: 725, Location: 3300 NE 78TH ST, Grades: KG-12)
- SETON CATHOLIC COLLEGE PREPARATORY HIGH SCHOOL (Students: 118, Location: 811 NE 112TH AVE # 200, Grades: 9-12)
- VANCOUVER CHRISTIAN HIGH SCHOOL (Students: 90, Location: 8205 NE FOURTH PLAIN RD, Grades: 6-12)
- SKY VIEW BAPTIST ACADEMY (Students: 10, Location: 9914 SE 6TH ST, Grades: KG-10)
Biggest public elementary/middle schools in Vancouver:
- GLENWOOD HEIGHTS PRIMARY (Location: 9716 NE 134TH ST, Grades: KG-4)
- LAURIN MIDDLE SCHOOL (Location: 13601 NE 97TH AVE, Grades: 5-8)
- PLEASANT VALLEY MIDDLE (Location: 14320 NE 50TH AVE, Grades: 5-8)
- PLEASANT VALLEY PRIMARY (Location: 14320 NE 50TH AVE, Grades: KG-4)
- BURTON ELEMENTARY SCHOOL (Location: 14015 NE 28TH STREET, Grades: KG-5)
- CASCADE MIDDLE SCHOOL (Location: 13900 NE 18TH STREET, Grades: 6-8)
- COVINGTON MIDDLE SCHOOL (Location: 11200 NE ROSEWOOD RD, Grades: 6-8)
- CRESTLINE ELEMENTARY SCHOOL (Location: 13003 S E 7TH STREET, Grades: KG-5)
- ELLSWORTH ELEMENTARY SCHOOL (Location: 512 SE ELLSWORTH AVENUE, Grades: KG-5)
- FIRCREST ELEMENTARY SCHOOL (Location: 12001 NE NINTH STREET, Grades: KG-5)
Private elementary/middle schools in Vancouver:
- CORNERSTONE CHRISTIAN SCHOOL (Students: 474, Location: 7708 NE 78TH ST, Grades: PK-8)
- ST JOSEPH CATHOLIC SCHOOL (Students: 400, Location: 6500 HIGHLAND DR, Grades: PK-8)
- OUR LADY OF LOURDES SCHOOL (Students: 343, Location: 4701 NW FRANKLIN ST, Grades: PK-8)
- CHILDRENS VILLAGE SALMON CREEK (Students: 140, Location: 1900 NE 129TH ST, Grades: UG-7)
- HOSANNA CHRISTIAN SCHOOL (Students: 117, Location: 4120 NE ST JOHNS RD, Grades: PK-8)
- CASCADIA SCHOOL (Students: 85, Location: 10606 NE 14TH ST, Grades: 1-8)
- THE GARDNER SCHOOL (Students: 81, Location: 16413 NE 50TH AVE, Grades: PK-8)
- SKINNER ELEMENTARY MONTESSORI SCHOOL (Students: 73, Location: 5001 NE 66TH AVE, Grades: PK-6)
- LA ESCUELA / LANGUAGE ACADEMY (Students: 8, Location: 7703 NE 72ND AVE, Grades: PK-2)
Library in Vancouver:
- FORT VANCOUVER REGIONAL LIBRARY DISTRICT (Operating income: $16,985,797; Location: 1007 E. MILL PLAIN BLVD; 671,745 books; 48 e-books; 29,632 audio materials; 27,399 video materials; 25 local licensed databases; 11 state licensed databases; 1 other licensed databases; 2,266 print serial subscriptions)
User-submitted facts and corrections:
- Please add the following institutions for Vancouver, WA . Washington State University Vancouver, http://www.vancouver.wsu.edu/, 14204 NE Salmon Creek Avenue Vancouver, WA 98686-9600 . Legacy Salmon Creek Hospital http://www.legacyhealth.org/body.cfm?id=38&oTopID=38&PLinkID=21 2211 NE 139th Street Vancouver, Washington 98686 Main telephone: 360-487-1000
- Gaiser Middle School is at 3000 NE 99th Street Vancouver, WA 98665
- Hi! You show that Skinner Montessori is on Evergreen Blvd in Vancouver. They moved three years ago to 66th Street near the Van Mall. Here's their URL: http://www.skinnermontessori.com
Points of interest:
Notable locations in Vancouver: Port of Vancouver Terminal (A), Royal Oaks Country Club (B), Vancouver Bus Terminal (C), Port of Vancouver (D), Vancouver Square (E), Vancouver Plaza (F), Covington Cabin (G), Slocum House (H), Clark County Historical Museum (I), Hidden House (J), Harney Hill Youth Center (K), Marshall House (L), David A Johnston Cascades Volcano Observatory (M), City of Vancouver Fire Department Station 3 (N), City of Vancouver Fire Department Station 1 (O), City of Vancouver Fire Department Station 2 (P), City of Vancouver Fire Department Station 8 (Q), City of Vancouver Fire Department Station 9 (R), City of Vancouver Fire Department Station 6 (S). Display/hide their locations on the map
Shopping Centers: Columbia Square Shopping Center (1), Vancouver Market Center Shopping Center (2), Vancouver Park Place Shopping Center (3), Vancouver Plaza Shopping Center (4), Westfield Shoppingtown Shopping Center (5), Vancouver Mall (6), Vancouver Village Shopping Center (7), Tower Mall (8), Paulsons Shopping Center (9). Display/hide their locations on the map
Main business address in Vancouver include: NAUTILUS, INC. (A), RIVERVIEW BANCORP INC (B), WESTERN POWER & EQUIPMENT CORP (C). Display/hide their locations on the map
Churches in Vancouver include: Bethel Church of the Assemblies of God (A), Calvary Baptist Church (B), Calvary Chapel of Vancouver (C), Cascade Park Baptist Church (D), Cascade Park Church of the Nazarene (E), Central Church of the Nazarene (F), Chinese Evangelical Church of Vancouver (G), Columbia Ridge Baptist Church (H), Community African Methodist Episcopal Zion Church (I). Display/hide their locations on the map
Cemeteries: Park Hill Cemetery (1), Saint James Cemetery (2), Evergreen Memorial Gardens (3). Display/hide their locations on the map
Reservoirs and swamps: Biddle Lake (A), Vancouver Hatchery Pond (B), Mimsi Marsh (not official) (C). Display/hide their locations on the map
Creek: Love Creek (A). Display/hide its location on the map
Parks in Vancouver include: Evergreen Park (1), Fort Vancouver National Historical Site (2), Wintler Park (3), Hidden Park (4), Leverich Park (5), Arnold Park (6), Vancouver Lake Park (7), Carter Park (8), Short Park (9). Display/hide their locations on the map
Tourist attractions: Gallery Pianissimo (Museums; P.O. Box 308) (1), Hidden Farm (Cultural Attractions- Events- & Facilities; 701 Grand Boulevard) (2), Pearson Air Museum (Cultural Attractions- Events- & Facilities; 1115 East 5th Street) (3), United States Government - Parks and Recreation- National Park Service (Recreation Areas; 612 East Reserve Street) (4), Golden Skate (Amusement & Theme Parks; 4915 East Fourth Plain Boulevard) (5), Amf Timber Lanes (Amusement & Theme Parks; 2306 Northeast Andresen Road) (6), Kidspace (Amusement & Theme Parks; 5145 Northeast 94th Avenue) (7), Vancouver Speedway (Amusement & Theme Parks; 16303 Northeast 15th Street) (8), West Coast Darts Billiards (Amusement & Theme Parks; 5107 East Fourth Plain Boulevard) (9). Display/hide their approximate locations on the map
Hotels: Comfort Suites Vancouver (4714 Northeast 94th Avenue) (1), Homewood Suites Portland-Vancouver (701 Southeast Columbia Shores Boulevard) (2), Best Western Hotel and Suites Vacouver Mall Dr (9420 Northeast Vancouver Mall Drive) (3), Four Seasons Tire & Auto Service Center Location 5 (11415 Northeast 76th Street) (4), Absolute Marketing (205 Northest 176th Avenue) (5), Best Western Ferryman Inn (7901 Northeast 6th Avenue) (6), Kay's Motel (6700 Northeast Highway 99) (7), Four Seasons Tire & Auto Service Center Location 2 (9505 Northeast 15th Avenue) (8), Days Inn - Portland/Vancouver (221 Northeast Chkalov Drive) (9). Display/hide their approximate locations on the map
Courts: Federal Bureau Of Investigation (fbi) (500 West 8th Street) (1), Clark County - Restraining Orders General- Misdemeanors District Court- Traffic Violat (Po Box 9806) (2), Canyon Creek Court (2615 Neals) (3). Display/hide their approximate locations on the map
Birthplace of: Sarona Reiher - Professional wrestler and professional wrestling manager, Bobby Jaggers - Professional wrestler, Brandon Cantu - Poker player, Brett Pierce - 2005 NFL player (Dallas Cowboys, born: Jan 7, 1981), Dennis Heck - Politician, Ed Herman - Martial artist, Frances Yeend - Singer, Jack L. Tilley - Soilder, Michael Barratt (astronaut) - Astronaut, Randy Myers - Professional baseball player.
Drinking water stations with addresses in Vancouver and their reported violations in the past:
CLARK PUBLIC UTILITIES (Population served: 82,149, Groundwater):Past monitoring violations:LEWISVILLE PARK (Population served: 875, Groundwater):
- 130 regular monitoring violations
Past health violations:GLENWOOD LITTLE LEAGUE (Population served: 500, Groundwater):
- MCL, Monthly (TCR) - In SEP-2006, Contaminant: Coliform
Past monitoring violations:JOES PLACE FARMS (Population served: 390, Groundwater):
- 11 routine major monitoring violations
- One regular monitoring violation
Past monitoring violations:HARMONY SPORTS (Population served: 333, Groundwater):
- 4 routine major monitoring violations
Past health violations:WILLAMETTE SPEEDWAY (Serves OR, Population served: 270, Groundwater):
- MCL, Monthly (TCR) - In SEP-2006, Contaminant: Coliform
Past monitoring violations:FOREST LEARNING CENTER (Address: 4100 Main St. , Population served: 200, Groundwater):
- Monitoring, Repeat Major (TCR) - Between JUL-2005 and SEP-2005, Contaminant: Coliform (TCR). Follow-up actions: St Compliance achieved (APR-06-2006)
- 9 routine major monitoring violations
- 2 regular monitoring violations
Past monitoring violations:LUCIA FALLS PARK (Population served: 102, Groundwater):
- One routine major monitoring violation
Past monitoring violations:
- One routine major monitoring violation
Drinking water stations with addresses in Vancouver that have no violations reported:
- AMBOY CLARK PUBLIC UTILITIES (Population served: 991, Primary Water Source Type: Groundwater)
- CASCADE ESTATES SATELLITE (Population served: 40, Primary Water Source Type: Groundwater)
- FRENCHMANS BAR PARK (Population served: 32, Primary Water Source Type: Groundwater)
- BRIDGE ROAD (Population served: 25, Primary Water Source Type: Groundwater)
| This city: | 2.4 people |
| Washington: | 2.5 people |
| This city: | 61.3% |
| Whole state: | 64.4% |
| This city: | 8.6% |
| Whole state: | 7.7% |
Likely homosexual households (counted as self-reported same-sex unmarried-partner households)
- Lesbian couples: 0.5% of all households
- Gay men: 0.4% of all households
People in group quarters in Vancouver in 2010:
- 727 people in local jails and other municipal confinement facilities
- 429 people in nursing facilities/skilled-nursing facilities
- 291 people in group homes intended for adults
- 286 people in emergency and transitional shelters (with sleeping facilities) for people experiencing homelessness
- 225 people in workers' group living quarters and job corps centers
- 46 people in other noninstitutional facilities
- 18 people in in-patient hospice facilities
- 16 people in residential treatment centers for adults
- 14 people in hospitals with patients who have no usual home elsewhere
- 4 people in group homes for juveniles (non-correctional)
People in group quarters in Vancouver in 2000:
- 657 people in other noninstitutional group quarters
- 601 people in local jails and other confinement facilities (including police lockups)
- 597 people in nursing homes
- 108 people in hospitals/wards and hospices for chronically ill
- 108 people in other hospitals or wards for chronically ill
- 36 people in short-term care, detention or diagnostic centers for delinquent children
- 32 people in homes or halfway houses for drug/alcohol abuse
- 30 people in other nonhousehold living situations
- 14 people in other group homes
- 3 people in schools, hospitals, or wards for the intellectually disabled
- 3 people in military barracks, etc.
Banks with most branches in Vancouver (2011 data):
- JPMorgan Chase Bank, National Association: 14 branches. Info updated 2011/11/10: Bank assets: $1,811,678.0 mil, Deposits: $1,190,738.0 mil, headquarters in Columbus, OH, positive income, International Specialization, 5577 total offices, Holding Company: Jpmorgan Chase & Co.
- Sterling Savings Bank: 11 branches. Info updated 2012/03/21: Bank assets: $9,207.8 mil, Deposits: $6,454.1 mil, headquarters in Spokane, WA, positive income, Commercial Lending Specialization, 192 total offices, Holding Company: Sterling Financial Corporation
- U.S. Bank National Association: 11 branches. Info updated 2012/01/30: Bank assets: $330,470.8 mil, Deposits: $236,091.5 mil, headquarters in Cincinnati, OH, positive income, 3121 total offices, Holding Company: U.S. Bancorp
- Bank of America, National Association: 9 branches. Info updated 2009/11/18: Bank assets: $1,451,969.3 mil, Deposits: $1,077,176.8 mil, headquarters in Charlotte, NC, positive income, 5782 total offices, Holding Company: Bank Of America Corporation
- Wells Fargo Bank, National Association: 8 branches. Info updated 2011/04/05: Bank assets: $1,161,490.0 mil, Deposits: $905,653.0 mil, headquarters in Sioux Falls, SD, positive income, 6395 total offices, Holding Company: Wells Fargo & Company
- Riverview Community Bank: 7 branches. Info updated 2011/07/21: Bank assets: $850.8 mil, Deposits: $736.4 mil, local headquarters, negative income in the last year, Commercial Lending Specialization, 17 total offices
- Umpqua Bank: 7 branches. Info updated 2011/09/02: Bank assets: $11,556.7 mil, Deposits: $9,325.3 mil, headquarters in Roseburg, OR, positive income, Commercial Lending Specialization, 193 total offices, Holding Company: Umpqua Holdings Corporation
- KeyBank National Association: Cascade Park Branch, Hazel Dell Keycenter, Downtown Vancouver Branch, Columbia Tech Center Branch, Orchards Keycenter Branch. Info updated 2008/03/03: Bank assets: $86,198.8 mil, Deposits: $64,214.8 mil, headquarters in Cleveland, OH, positive income, Commercial Lending Specialization, 1067 total offices, Holding Company: Keycorp
- West Coast Bank: Salmon Creek Branch, Vancouver Branch, Orchards Branch. Info updated 2010/09/16: Bank assets: $2,424.8 mil, Deposits: $1,925.6 mil, headquarters in Lake Oswego, OR, positive income, Commercial Lending Specialization, 63 total offices, Holding Company: West Coast Bancorp
- 7 other banks with 8 local branches
For population 15 years and over in Vancouver:
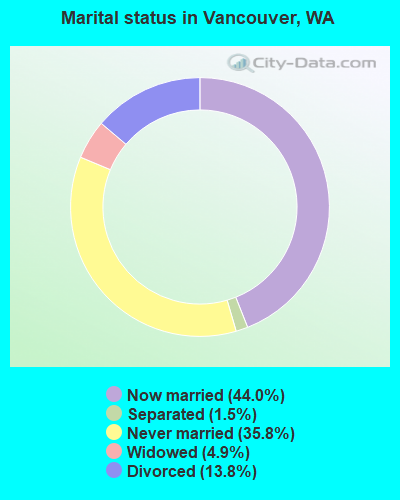
- Never married: 35.8%
- Now married: 44.0%
- Separated: 1.5%
- Widowed: 4.9%
- Divorced: 13.8%
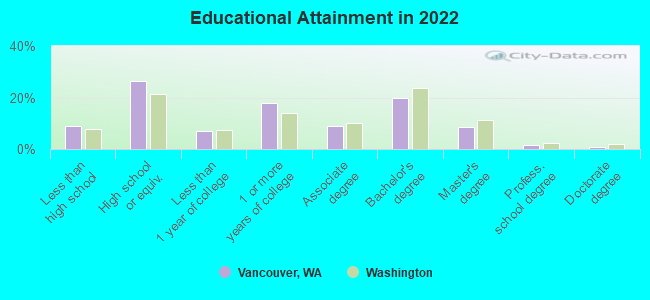
For population 25 years and over in Vancouver:
- High school or higher: 91.1%
- Bachelor's degree or higher: 31.2%
- Graduate or professional degree: 11.2%
- Unemployed: 6.6%
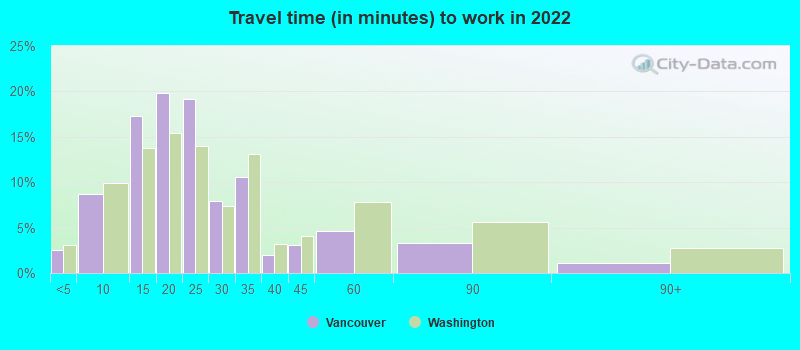
- Mean travel time to work (commute): 18.6 minutes
| Here: | 10.9 |
| Washington average: | 11.6 |

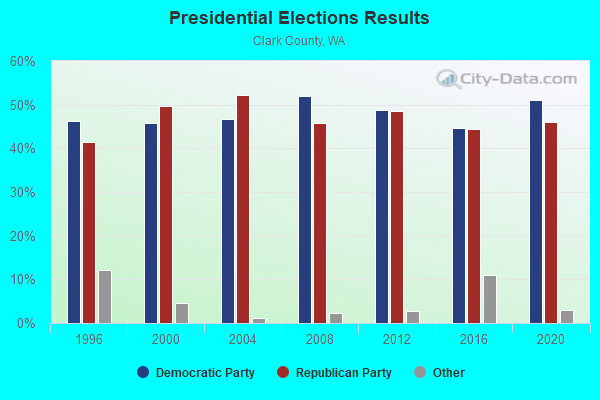
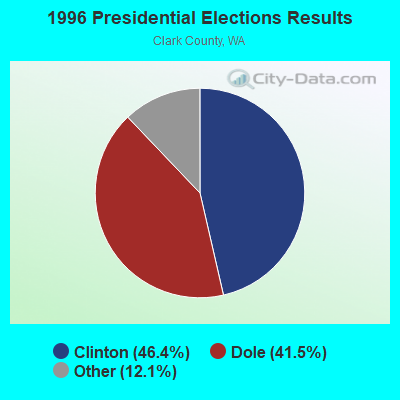
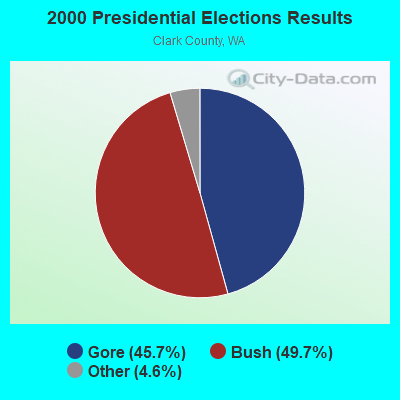
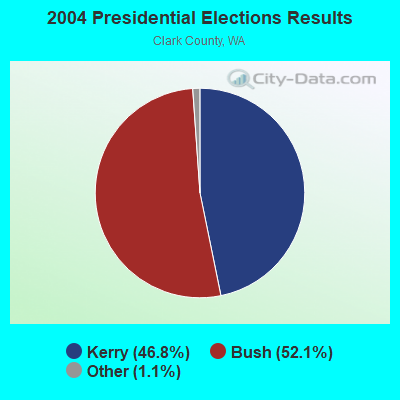
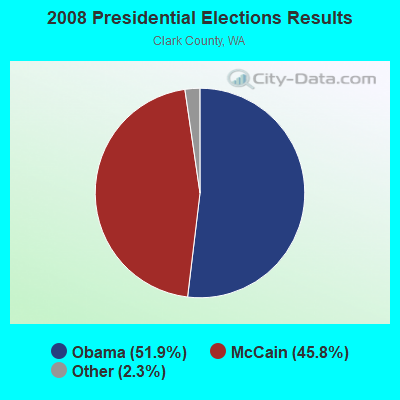
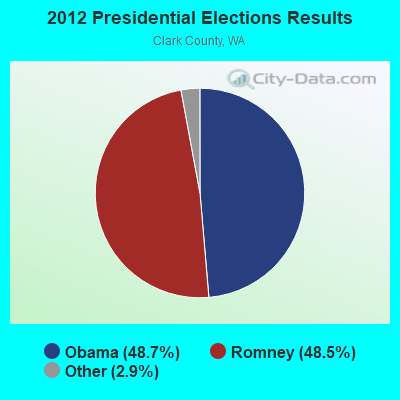
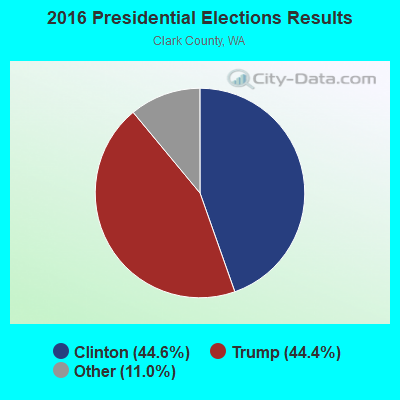
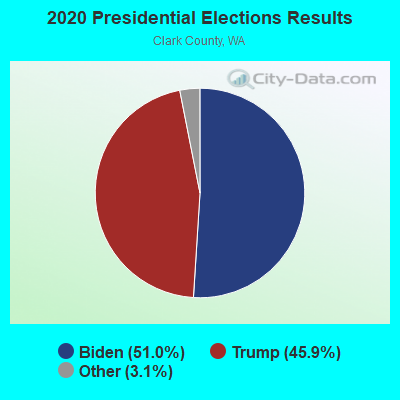
Graphs represent county-level data. Detailed 2008 Election Results
Neighborhoods in Vancouver:
(Vancouver, Washington Neighborhood Map)- 25th Ave Townhomes neighborhood
- 38th Street Terrace neighborhood
- Abbey Lane neighborhood
- Academy Square neighborhood
- Adelina Highlands neighborhood
- Adrianna's Place neighborhood
- Ahner Hall Mobile Estates neighborhood
- Airport Green neighborhood
- Airport Green Industrial Park neighborhood
- Airport Heights neighborhood
- Akabar Acres neighborhood
- Al-Mi Court neighborhood
- Alder Glen neighborhood
- Alexander Tracts neighborhood
- Alice Meadows neighborhood
- Alicias Glen neighborhood
- Allison Heights neighborhood
- Allman Park neighborhood
- Allum Acres neighborhood
- Allwood Estates neighborhood
- Allwood Manor neighborhood
- Allwood Terrace neighborhood
- Alpine Meadows neighborhood
- Alpine View neighborhood
- Alpine West neighborhood
- Alys Woods neighborhood
- Amhurst Commons neighborhood
- Ampere Acres neighborhood
- Ampere Heights neighborhood
- Amphere Heights neighborhood
- Andersen (St. John) neighborhood
- Andersons Capitol Hill neighborhood
- Andreas Meadow neighborhood
- Andresen Highland neighborhood
- Andrew John Estates neighborhood
- Andrews Court neighborhood
- Andys Acres neighborhood
- Ann Manor neighborhood
- Annies Acres neighborhood
- Apple Meadows neighborhood
- Arcadia Cedars neighborhood
- Arden neighborhood
- Arnada neighborhood
- Arnada Park neighborhood
- Arnada Park Annex neighborhood
- Ash neighborhood
- Ash Hollow neighborhood
- Ashford Lane neighborhood
- Ashley Cedars neighborhood
- Ashley Heights neighborhood
- Ashley Manor neighborhood
- Ashley Meadows neighborhood
- Ashton Acres neighborhood
- Autumn Chase neighborhood
- Autumn Ridge neighborhood
- Autumn Trace neighborhood
- Autumn Walk neighborhood
- Avalon neighborhood
- Avalon Court neighborhood
- Avalon Estates neighborhood
- Avalon Heights neighborhood
- Avalon Hills neighborhood
- Avalon Meadows neighborhood
- Avenues neighborhood
- Avery Estates neighborhood
- Axford Lane neighborhood
- Axtell Acres neighborhood
- Bacon Place neighborhood
- Bagley Downs neighborhood
- Bagley Downs Estates neighborhood
- Bagley Park neighborhood
- Banbury Place neighborhood
- Barbeau Estates neighborhood
- Barberton Industrial Park neighborhood
- Barg Acres neighborhood
- Barnes Addition neighborhood
- Barnes Crossing neighborhood
- Barringer Ridge Estates neighborhood
- Bay Berry Terrace neighborhood
- Beautiful Downtown Orchards neighborhood
- Beaver Garden Tracts neighborhood
- Beckinridge Infill neighborhood
- Beckridge neighborhood
- Bel-Air neighborhood
- Bella Terra neighborhood
- Bella Vista neighborhood
- Bella Vista Estates neighborhood
- Bella Vista Heights neighborhood
- Bella Vista Woods neighborhood
- Belle Ridge neighborhood
- Belmont Estates neighborhood
- Belmont Place neighborhood
- Ben-Hollow neighborhood
- Bennett Estates neighborhood
- Bennett Estates Foxcroft neighborhood
- Bennington neighborhood
- Berdie Acres neighborhood
- Berry Acres neighborhood
- Beverly Heights neighborhood
- Beverly Park neighborhood
- Biddles Landing neighborhood
- Biltmore Place neighborhood
- Birch Tree Cove neighborhood
- Birchwood Meadows neighborhood
- Blakesfield neighborhood
- Blandford Terrace neighborhood
- Blossomwood Farm neighborhood
- Blue Heron Estates neighborhood
- Blueberry Hill neighborhood
- Blueberry Homes neighborhood
- Blurock Homestead neighborhood
- Boardwalk Garden Homes neighborhood
- Bold Estates neighborhood
- Bonnies Vista neighborhood
- Bradleys Place neighborhood
- Braewood neighborhood
- Brandt Terrace neighborhood
- Brekke Farms neighborhood
- Brentwood neighborhood
- Brentwood South neighborhood
- Brentwood West neighborhood
- Brett Acres neighborhood
- Briarwood neighborhood
- Brickhaven neighborhood
- Bridge Creek Village neighborhood
- Bridlewood neighborhood
- Brier Tree neighborhood
- Brislawn neighborhood
- Bristol Manor neighborhood
- Brittany Court neighborhood
- Broad Acres neighborhood
- Broadmoor neighborhood
- Broadview neighborhood
- Brook Run neighborhood
- Brookside neighborhood
- Brookside Knoll neighborhood
- Browns Manor neighborhood
- Browns Place neighborhood
- Buckman Garden North neighborhood
- Buckman Garden Tracts neighborhood
- Buckman Heights neighborhood
- Buena Vista neighborhood
- Buena Vista Heights neighborhood
- Buena Vista Meadows neighborhood
- Burberry neighborhood
- Burlwood Estates neighborhood
- Burning Green neighborhood
- Burnt Bridge Creek neighborhood
- Burnt Bridge Crest neighborhood
- Burnt Bridge Vista neighborhood
- Burroughs Estates neighborhood
- Burton Evergreen neighborhood
- Burton Meadows neighborhood
- Burton Place neighborhood
- Burton Ridge neighborhood
- Bush Gardens neighborhood
- Buttercup Estates neighborhood
- Butternut Hill neighborhood
- Cabes Acres neighborhood
- Cady Court neighborhood
- Caitlin Glen neighborhood
- Cambridge Estates neighborhood
- Camelot Court neighborhood
- Camelot Crest neighborhood
- Camille Court neighborhood
- Camille Estates neighborhood
- Camino Village neighborhood
- Canaan Acres neighborhood
- Candlebrooke neighborhood
- Candlewood neighborhood
- Canter Wood neighborhood
- Canyon Crest neighborhood
- Canyon Ridge neighborhood
- Capitol Hills neighborhood
- Capri Hill neighborhood
- Capris Hill Terrace neighborhood
- Carlson Estates neighborhood
- Carlson Place neighborhood
- Carmina Estates neighborhood
- Carrell Estates neighborhood
- Carriage House Estates neighborhood
- Carson Heights neighborhood
- Carter Park neighborhood
- Casa Mia neighborhood
- Casandra Meadows neighborhood
- Cascade Business Center neighborhood
- Cascade East neighborhood
- Cascade Highlands neighborhood
- Cascade Landing Business Park neighborhood
- Cascade Lane neighborhood
- Cascade Manor neighborhood
- Cascade Meadows neighborhood
- Cascade Park Manor neighborhood
- Cascade Park Place neighborhood
- Cascade Park Terrace neighborhood
- Cascade Place neighborhood
- Cascade Rest neighborhood
- Cascade South East neighborhood
- Cascade Terrace neighborhood
- Cascade View Estates neighborhood
- Cascade View Terrace neighborhood
- Cascade Vista Estates neighborhood
- Cascade Woods neighborhood
- Cassady Court neighborhood
- Castle Glen neighborhood
- Castle Grande neighborhood
- Castle Tree neighborhood
- Castlewood East neighborhood
- Castlewood Estates neighborhood
- Cc Estates neighborhood
- Cedar neighborhood
- Cedar Bluff neighborhood
- Cedar Dell neighborhood
- Cedar Gate neighborhood
- Cedar Grove neighborhood
- Cedar Grove Place neighborhood
- Cedar Heights neighborhood
- Cedar Highlands neighborhood
- Cedar Place neighborhood
- Cedar View neighborhood
- Cedar Village neighborhood
- Cedarbrook neighborhood
- Cedarwood neighborhood
- Celia Meadows neighborhood
- Central Park neighborhood
- Central Pointe neighborhood
- Centre Point neighborhood
- Cerrero Estates neighborhood
- Chamberlainss Court neighborhood
- Channing Park neighborhood
- Chapman North neighborhood
- Charladen Fields neighborhood
- Chase Centre neighborhood
- Chateau Crest neighborhood
- Chateau Estates neighborhood
- Chateau Glen neighborhood
- Chelsea Manor (Columbia Manor) neighborhood
- Cherokee Meadows neighborhood
- Cherry Grove neighborhood
- Cherry Hill neighborhood
- Cherry Hollow neighborhood
- Cherry Lane neighborhood
- Cherry Lane Estates neighborhood
- Cherry Park neighborhood
- Cherry Valley neighborhood
- Chestnut Estates neighborhood
- Chinook Springs neighborhood
- Chris Crossing neighborhood
- Chumasero Heights neighborhood
- Cima-Real Terrace neighborhood
- Cimarron neighborhood
- Cindy Lea Park neighborhood
- Cindys Parkview neighborhood
- Cinnamon Crest neighborhood
- Cinnamon Meadow neighborhood
- Claires Corner neighborhood
- Claires Court neighborhood
- Claremont Crest neighborhood
- Clark Cluster neighborhood
- Clark County Properties neighborhood
- Clark Meadows neighborhood
- Clarks Ridge neighborhood
- Clearmeadows at Fishers Landing neighborhood
- Clomont Estates neighborhood
- Coach House Estates neighborhood
- Cobblestone neighborhood
- Codys Court neighborhood
- Cold Creek Court neighborhood
- Cold Creek Heights neighborhood
- Cold Creek Industrial Park neighborhood
- College neighborhood
- Collins Estates neighborhood
- Colony Crest neighborhood
- Columbia Crest neighborhood
- Columbia Crossing at Columbia Tech Center neighborhood
- Columbia Gardens neighborhood
- Columbia Harbor neighborhood
- Columbia Heights neighborhood
- Columbia Highlands neighborhood
- Columbia Homestead neighborhood
- Columbia Industrial Park neighborhood
- Columbia Orchard neighborhood
- Columbia Park neighborhood
- Columbia Place neighborhood
- Columbia River Crossing neighborhood
- Columbia River Estates neighborhood
- Columbia River Mobile Home Park neighborhood
- Columbia Shores neighborhood
- Columbia Square neighborhood
- Columbia Tech Center neighborhood
- Columbia Terrace neighborhood
- Colwood Terrace neighborhood
- Commerce Center neighborhood
- Concord neighborhood
- Concord Heights neighborhood
- Condos neighborhood
- Continental neighborhood
- Corys Place neighborhood
- Cottage Home Estates neighborhood
- Cottages neighborhood
- Cottages at Fishers Landing neighborhood
- Cotters Grove neighborhood
- Cougar Creek Estates neighborhood
- Cougar Creek Highlands neighborhood
- Cougar Creek Park neighborhood
- Cougar Creek Place neighborhood
- Cougar Creek Village neighborhood
- Cougar Creek West neighborhood
- Cougar Creek Woods neighborhood
- Cougar Crest neighborhood
- Cougar Meadows neighborhood
- Cougar Ridge neighborhood
- Country Breeze neighborhood
- Country Club Village neighborhood
- Country Dale neighborhood
- Country Home neighborhood
- Country Lane neighborhood
- Country Meadows neighborhood
- Countryside neighborhood
- Countryside Estates neighborhood
- Countryside Woods neighborhood
- County Properties East neighborhood
- Courtney Fields neighborhood
- Coventry Downs neighborhood
- Covington Crossing neighborhood
- Covington Manor neighborhood
- Covington Mobile Home neighborhood
- Covington Townhomes neighborhood
- Covington Village neighborhood
- Craigs Terrace neighborhood
- Cramer East neighborhood
- Cramer West neighborhood
- Creekside neighborhood
- Creekside Terrace neighborhood
- Creekview neighborhood
- Crestview Estates neighborhood
- Crestwood neighborhood
- Crosswater Townhomes neighborhood
- Crown Continental neighborhood
- Crown Estates neighborhood
- Crown Plaza neighborhood
- Cruz Estates neighborhood
- Crystal Court neighborhood
- Crystal Crossing neighborhood
- Crystal Glen neighborhood
- Crystal Terrace neighborhood
- Crystal View neighborhood
- Crystals Meadow neighborhood
- Cub Meadows neighborhood
- Curtin Creek neighborhood
- Damaari Terrace neighborhood
- Daniel Estates neighborhood
- Daphine Acres neighborhood
- Darrel Acres neighborhood
- Darwood Estates neighborhood
- Date Park neighborhood
- Davanna Terrace neighborhood
- Davy Acres neighborhood
- Dawns Morning neighborhood
- Dean Meadows neighborhood
- Deans Landing neighborhood
- Deer Meadow neighborhood
- Deer Run Meadow neighborhood
- Delia Acres neighborhood
- Dell Haven neighborhood
- Dell Vista neighborhood
- Dellhurst neighborhood
- Dellterra neighborhood
- Dellvilla neighborhood
- Dellwood neighborhood
- Dellwood South neighborhood
- Diamond Estates neighborhood
- Diamond Meadows neighborhood
- Diamond Willow neighborhood
- Dls Estates neighborhood
- Doe Run Glen neighborhood
- Dogwood Park neighborhood
- Dogwood Place neighborhood
- Donna-Sue Acres neighborhood
- Donovan Acres neighborhood
- Dotson Estates neighborhood
- Doty Estates neighborhood
- Douglas Acres neighborhood
- Dove Court neighborhood
- Dover Glen neighborhood
- Downs neighborhood
- Downtown (Downtown Vancouver) neighborhood
- Drasler Place neighborhood
- Dubois Park neighborhood
- Dvorak Tracts neighborhood
- Eagle Estates neighborhood
- Eagle Plain neighborhood
- Eagle Pointe neighborhood
- East Garden neighborhood
- East Hampton neighborhood
- East Heights neighborhood
- East Lake Village neighborhood
- East Manor Vista neighborhood
- East Meadow Estates neighborhood
- East Meadows neighborhood
- East Minehaha neighborhood
- East Park Meadows neighborhood
- East Ridge neighborhood
- East Sherwood Meadows neighborhood
- East Slope neighborhood
- East Vancouver neighborhood
- Eastbrook neighborhood
- Easterbrook Woods neighborhood
- Easterly Gayle neighborhood
- Eastgate neighborhood
- Eastview neighborhood
- Eastwood neighborhood
- Edgewood neighborhood
- Edgewood Court neighborhood
- Edgewood Park neighborhood
- Edgewood West neighborhood
- Edmund Woods neighborhood
- Edmunds Estates neighborhood
- Edna Park neighborhood
- Edwards Manor neighborhood
- Eileens Glen neighborhood
- El Dan Mar neighborhood
- El Mar neighborhood
- El-Wood neighborhood
- Elaine Park neighborhood
- Elliott Meadows neighborhood
- Ellsworth On The Park neighborhood
- Ellsworth Springs neighborhood
- Ellsworth Terrace neighborhood
- Embarcadero Estates neighborhood
- Emerald Crest neighborhood
- Emerald Estates neighborhood
- Emily Greg Court neighborhood
- Emily Highlands neighborhood
- Emma's Meadow neighborhood
- Emmas Place neighborhood
- Emmler Park neighborhood
- Emmy Acres neighborhood
- Enclave neighborhood
- Encore neighborhood
- English Ridge neighborhood
- Erics Manor neighborhood
- Erins Estates neighborhood
- Esther Short neighborhood
- Esther Short Commons neighborhood
- Esthers Place neighborhood
- Evening Song neighborhood
- Evergreen neighborhood
- Evergreen Acres neighborhood
- Evergreen Airpark neighborhood
- Evergreen East neighborhood
- Evergreen Estates neighborhood
- Evergreen Forest neighborhood
- Evergreen Heights neighborhood
- Evergreen Highlands neighborhood
- Evergreen Highlands (Wintler Acres) neighborhood
- Evergreen Manor neighborhood
- Evergreen Meadows neighborhood
- Evergreen Park neighborhood
- Evergreen Place neighborhood
- Evergreen Pointe neighborhood
- Evergreen Ridge neighborhood
- Evergreen Ridge Condominium Homes neighborhood
- Evergreen Springs neighborhood
- Evergreen Townhomes neighborhood
- Evergreen Village neighborhood
- Fair Haven Estates neighborhood
- Fair View neighborhood
- Fair View Annex neighborhood
- Fair View Homestead neighborhood
- Fairfield neighborhood
- Fairlawn neighborhood
- Fairview Homesites neighborhood
- Fairway (164th Avenue) neighborhood
- Fairway View neighborhood
- Falcon Crest neighborhood
- Falcon Prairie neighborhood
- Falcon Ridge neighborhood
- Falcons Landing neighborhood
- Falcons Rest neighborhood
- Falk Road Townhomes neighborhood
- Fallen Leaf neighborhood
- Far View Heights neighborhood
- Faraway Farms neighborhood
- Farmview Estates neighborhood
- Farnsworth Heights neighborhood
- Father Blanchet Park neighborhood
- Feldia Glen neighborhood
- Felida neighborhood
- Felida Estates neighborhood
- Felida Highlands neighborhood
- Felida Hills neighborhood
- Felida Knoll neighborhood
- Felida Knolls neighborhood
- Felida Manor neighborhood
- Felida Meadows neighborhood
- Felida Pointe neighborhood
- Felida Ridge (Steves Acres) neighborhood
- Felida View neighborhood
- Felida Village neighborhood
- Fernwood neighborhood
- Fieldstone neighborhood
- Fieldstone South neighborhood
- Fir Acres neighborhood
- Fir Garden neighborhood
- Fir Haven neighborhood
- Fir Park neighborhood
- Fir View Slope neighborhood
- Fircrest neighborhood
- Fircrest Gardens neighborhood
- Firdale neighborhood
- Firestone Estates neighborhood
- Firgrove neighborhood
- Firs at Towncenter neighborhood
- First Place neighborhood
- Firview Park neighborhood
- Firwood neighborhood
- Firwood Estates neighborhood
- Fisher Woods neighborhood
- Fisher's Creek neighborhood
- Fisher's Landing East neighborhood
- Fisher-Mill Plain neighborhood
- Fishers Grove South neighborhood
- Fishers Grove-North neighborhood
- Fishers Landing One Towncenter neighborhood
- Fishers Landing Six/Seven Towncenter neighborhood
- Fishers Meadow neighborhood
- Fishers Mill neighborhood
- Fishers Pointe neighborhood
- Fitzhugh Acres neighborhood
- Five Corners Meadows neighborhood
- Flaherty Woods neighborhood
- Fleetwood Court neighborhood
- Fleetwood Too neighborhood
- Fleming neighborhood
- Fontana Court neighborhood
- Forest Crest neighborhood
- Forest Glade neighborhood
- Forest Meadow Estates neighborhood
- Forest Park Estates neighborhood
- Forest Ridge neighborhood
- Forest Ridge Division neighborhood
- Forest Wood Estates neighborhood
- Forestwood neighborhood
- Fossis Homesites neighborhood
- Four Seasons neighborhood
- Fourth Plain Homestead neighborhood
- Fourth Plain Village neighborhood
- Fox Farms neighborhood
- Fox Run neighborhood
- Foxcroft neighborhood
- Franklin Meadows neighborhood
- Franklin Plaza neighborhood
- Franks Estates neighborhood
- French Glen neighborhood
- Friedel Acres neighborhood
- Fruit Valley neighborhood
- Fruit Valley Homes neighborhood
- Fruitlawn neighborhood
- Fruitvale Acreage neighborhood
- Gables at Hiddenbrook Terrace neighborhood
- Gaiser Ridge neighborhood
- Garden Acres neighborhood
- Garden Grove Homestead neighborhood
- Garden Isle Estates neighborhood
- Garden Terrace at The Mall neighborhood
- Garden View neighborhood
- Garden View A neighborhood
- Gardens at Fishers Landing neighborhood
- Garfield Park neighborhood
- Garrity Manor neighborhood
- Gaya Estates neighborhood
- Gayas Place neighborhood
- General Homes neighborhood
- General Industrial Park neighborhood
- Generation Place neighborhood
- George S Kelley Estates neighborhood
- Gibson Acres neighborhood
- Gibson Homesites neighborhood
- Gilbert Garden Tracts neighborhood
- Gilbert Place neighborhood
- Glad Tidings neighborhood
- Glen Field Estates neighborhood
- Glenmar neighborhood
- Glenn Acres neighborhood
- Glennhaven neighborhood
- Glenview neighborhood
- Glenwood neighborhood
- Glenwood Acres neighborhood
- Glenwood Glade neighborhood
- Glenwood Hills neighborhood
- Glimmermere neighborhood
- Goin Acres neighborhood
- Goldfinch Park neighborhood
- Golf Creek Terrace neighborhood
- Golfview neighborhood
- Goss Tracts neighborhood
- Graceland Acres neighborhood
- Granada neighborhood
- Grand Firs neighborhood
- Grandhaven Manor neighborhood
- Grandview neighborhood
- Grandview Commons (Grandview Townhomes) neighborhood
- Grassland Meadows neighborhood
- Gray Mare Crossing neighborhood
- Great Western Mobile Home Park neighborhood
- Grecian Estates neighborhood
- Green Gables neighborhood
- Green Garden North neighborhood
- Green Garden West neighborhood
- Green Manor neighborhood
- Green Meadows neighborhood
- Green Royal neighborhood
- Greenland Estates neighborhood
- Greens neighborhood
- Greens Annex neighborhood
- Greenway Estates neighborhood
- Greenway Park neighborhood
- Greenway Park Estates neighborhood
- Gregory Place neighborhood
- Greyhawk East neighborhood
- Greyhawk Ridge at Pleasant Valley neighborhood
- Grill Meadows neighborhood
- Grove Acres neighborhood
- Grove at Towncenter neighborhood
- Grove at Towncenter Condo neighborhood
- Groves neighborhood
- Guinn Acres neighborhood
- Habitat Estates neighborhood
- Hamlet at Fisher's Landing neighborhood
- Hammann Farm neighborhood
- Hampton Court neighborhood
- Hampton Downs Condominium neighborhood
- Hanna Acres neighborhood
- Hansen Meadows neighborhood
- Happy Hollow neighborhood
- Harding Farms neighborhood
- Hardman Meadows neighborhood
- Harlow Acres neighborhood
- Harmony Crest neighborhood
- Harmony Firs neighborhood
- Harmony Homes neighborhood
- Harmony Lane neighborhood
- Harmony Ridge neighborhood
- Harney Heights neighborhood
- Harney Homesites neighborhood
- Harney Terrace neighborhood
- Harvest Meadows neighborhood
- Hawk Ridge neighborhood
- Hawks Pointe neighborhood
- Hawks View neighborhood
- Hawthorne neighborhood
- Hazel Dell Crest neighborhood
- Hazel Dell Heights neighborhood
- Hazel Dell Heights Estates neighborhood
- Hazel Dell Home Colony neighborhood
- Hazel Hollow neighborhood
- Hazel Homes neighborhood
- Hazel Ridge Townhomes neighborhood
- Hazel View Terrace neighborhood
- Hazelcrest neighborhood
- Hazelnut Grove Estates Townhomes neighborhood
- Hearthwood neighborhood
- Hearthwood Crossing neighborhood
- Heathergate neighborhood
- Hendrickson Hideway neighborhood
- Heritage neighborhood
- Heritage Court at Fisher Landing neighborhood
- Heritage Estates neighborhood
- Heritage Farm Estates neighborhood
- Heritage Hills neighborhood
- Heritage Meadows neighborhood
- Heritage Place neighborhood
- Heritage Place at Fishers Landing neighborhood
- Heritage Reserve Fishers Landing neighborhood
- Heritage Reserve at Fishers Landing neighborhood
- Hermitage neighborhood
- Hermitage Springs neighborhood
- Heron Hills neighborhood
- Hiawatha neighborhood
- Hidden Garden Tracts neighborhood
- Hidden Glen neighborhood
- Hidden Homestead neighborhood
- Hidden Homestead Townhomes neighborhood
- Hidden Valley View neighborhood
- Hidden View neighborhood
- Hidden Village neighborhood
- Hiddenbrook neighborhood
- Hiddens neighborhood
- High Creek Estates neighborhood
- High Plains neighborhood
- Highland neighborhood
- Highland Glen neighborhood
- Highland Park neighborhood
- Highland Park at Pleasant Valley neighborhood
- Highland Ridge neighborhood
- Highland Ridge Meadow neighborhood
- Highland Village neighborhood
- Highland Village North neighborhood
- Highlands at Pleasant Valley neighborhood
- Hill Crest Terrace neighborhood
- Hill Manor neighborhood
- Hill-N-Dale neighborhood
- Hillcrest Vista neighborhood
- Hillond Tracts neighborhood
- Hirose Estates neighborhood
- Hisel Homesites neighborhood
- Hiway Crest neighborhood
- Ho-Ti Terrace neighborhood
- Hoffman Heights neighborhood
- Hofmann Industrial Park neighborhood
- Hokanson Estates neighborhood
- Holland Acres neighborhood
- Holly Acres neighborhood
- Holly Crest neighborhood
- Holly Lane Infill neighborhood
- Home neighborhood
- Home Acres neighborhood
- Home Crest neighborhood
- Homeland Estates neighborhood
- Homestead Acres neighborhood
- Homestead Meadows neighborhood
- Homestead Place at Fishers Landing neighborhood
- Hood View neighborhood
- Hood View Terrace neighborhood
- Horizon Homes neighborhood
- Horizon View neighborhood
- Horizon West neighborhood
- Hough neighborhood
- Howland Acres neighborhood
- Hudlicky Homes neighborhood
- Hudson's Bay neighborhood
- Hudsons Bay neighborhood
- Hunsinger Townhomes neighborhood
- Hunters Crest neighborhood
- Hyde Park neighborhood
- Hylen Homesites neighborhood
- Idylwood neighborhood
- Image neighborhood
- Image Terrace neighborhood
- Indian Hills neighborhood
- Indian Spring Village neighborhood
- Industrial Park neighborhood
- Ironwood neighborhood
- Ironwood Estates neighborhood
- Isaacs Knoll Estates neighborhood
- Island Park neighborhood
- Isslers Woodpark neighborhood
- Ja-Zee Estates neighborhood
- Jaggy Homestead neighborhood
- Jay Lee Terrace neighborhood
- Jeans Place neighborhood
- Jenkins Estates neighborhood
- Jennas Place neighborhood
- Jeremy Acres neighborhood
- Johnsons Homesites neighborhood
- Jonco Development neighborhood
- Jones Corner neighborhood
- Jordans Court neighborhood
- Julias Garden neighborhood
- Julies Court neighborhood
- Junes Estates neighborhood
- Kainyn Acres neighborhood
- Karalie Court neighborhood
- Karyssas Place neighborhood
- Kathys Court neighborhood
- Katie Lane neighborhood
- Kellies Landing neighborhood
- Kelly Crest neighborhood
- Kelseys Ridge neighborhood
- Kendalls Court neighborhood
- Kennedy Estates neighborhood
- Kennedy Manor neighborhood
- Kensington neighborhood
- Kensington Park neighborhood
- Kensington Square neighborhood
- Keri Heights neighborhood
- Kevana Park neighborhood
- Kevin Long James Sall neighborhood
- Kim-Sam Estates neighborhood
- Kimberly Villa neighborhood
- King Hill Acres neighborhood
- Kings Gate neighborhood
- Kings Land neighborhood
- Kingston Terrace neighborhood
- Klein Annex neighborhood
- Klein Homesites neighborhood
- Klineline Estates neighborhood
- Klineline Lake neighborhood
- Klodts Lane neighborhood
- Klossner Heights neighborhood
- Knoll Heights neighborhood
- Knollridge neighborhood
- Knollridge North neighborhood
- Knollridge West neighborhood
- Kodys Estates neighborhood
- Kosterman Acres neighborhood
- Kramers Place neighborhood
- Kramers Place South neighborhood
- Kristi Lane neighborhood
- Kristine Pointe neighborhood
- Kriston Acres neighborhood
- LB Estates neighborhood
- La Hacienda neighborhood
- Laberg Tracts neighborhood
- Laberg Tracts Annex neighborhood
- Lacavo neighborhood
- Lacollina neighborhood
- Lake Crest Estates neighborhood
- Lake Orchard Terrace neighborhood
- Lake Place neighborhood
- Lake River Terrace neighborhood
- Lake Shore neighborhood
- Lake View neighborhood
- Lake View Meadows neighborhood
- Lake View Terrace neighborhood
- Lakecrest neighborhood
- Lakes at Fishers Landing neighborhood
- Lakeshore Estates neighborhood
- Lakeshore Glade neighborhood
- Lakeshore Hills neighborhood
- Lakeshore Hills Townhouses neighborhood
- Lakeshore Manor neighborhood
- Lakeshore Meadows neighborhood
- Lakeshore Plaza neighborhood
- Lakeshore Ridge neighborhood
- Lakeshore Terrace neighborhood
- Lakeshore Village neighborhood
- Lakeview neighborhood
- Lakeview Estates neighborhood
- Lakeview Homestead neighborhood
- Lakeview Ridge neighborhood
- Lakewood Terrace neighborhood
- Lalondes Parkside neighborhood
- Lamarr Court neighborhood
- Lambrecht Estates neighborhood
- Landover Commons neighborhood
- Landover Court neighborhood
- Landover East neighborhood
- Landover-Sharmel (Sharmel) neighborhood
- Lands End neighborhood
- Langsdorf / Rolling neighborhood
- Larsens Homes neighborhood
- Larsons Landing neighborhood
- Lauracrest neighborhood
- Laurel Hills Estates neighborhood
- Laurel Terrace neighborhood
- Laurel Woods neighborhood
- Laurelwood neighborhood
- Lawn Haven neighborhood
- Lea View Terrace neighborhood
- Lechten Meadows neighborhood
- Leilani Lane neighborhood
- Lena Park neighborhood
- Lenas Manor neighborhood
- Lewis Clark Highlands neighborhood
- Lewis Clark Woods neighborhood
- Lewis and Clark Landing neighborhood
- Lexington Park neighborhood
- Liams Place neighborhood
- Lieser Crest neighborhood
- Lieser Homesites neighborhood
- Lieser Pointe neighborhood
- Lilac Lane neighborhood
- Lilac Terrace neighborhood
- Lincola Park neighborhood
- Lincola Park Annex neighborhood
- Lincoln neighborhood
- Lincoln Crest neighborhood
- Lincoln Estates neighborhood
- Lincoln Heights neighborhood
- Lincoln Manor neighborhood
- Lincoln Park neighborhood
- Lincoln Ridge Estates neighborhood
- Lincoln Villa neighborhood
- Lincoln Wood neighborhood
- Lincolnshire Farms neighborhood
- Lindsays Place neighborhood
- Linwood Heights neighborhood
- Lisa Acres neighborhood
- Little Mun Acres neighborhood
- Littler Homesites neighborhood
- Locust Knoll neighborhood
- Logans Glen neighborhood
- Logans Landing neighborhood
- Lois Park neighborhood
- Lone Birch neighborhood
- Lone Pine neighborhood
- Long Acres neighborhood
- Lorenas Estates neighborhood
- Loris Meadow neighborhood
- Lucas Condo Removed Mf neighborhood
- Lucas Estates neighborhood
- Ludlum Hill Terrace neighborhood
- Ludlum Hill Townhouse neighborhood
- Ludlum Hill View Terrace neighborhood
- Luokkala Industrial Park neighborhood
- Mabel Crest neighborhood
- Macarthur Estates neighborhood
- Mackenzie Manor neighborhood
- Madeline Meadows neighborhood
- Madera neighborhood
- Madrona Lane neighborhood
- Madrona Manor neighborhood
- Madrona Park neighborhood
- Madrona View Estates neighborhood
- Magno Pointe neighborhood
- Magnolia Court neighborhood
- Maiahs Meadow neighborhood
- Maitland Heights neighborhood
- Makayla Court neighborhood
- Mall Oaks neighborhood
- Mall Vista neighborhood
- Manning Estates neighborhood
- Manning Manor neighborhood
- Manor Highlands neighborhood
- Manor Hills neighborhood
- Manor Terrace neighborhood
- Manor View neighborhood
- Manor View Acres neighborhood
- Manor Vista neighborhood
- Maple Acres neighborhood
- Maple Crest neighborhood
- Maple Glen neighborhood
- Maple Grove neighborhood
- Maple Grove Estates neighborhood
- Maple Hollow neighborhood
- Maple Leaf Estates neighborhood
- Maple Place neighborhood
- Maple Terrace neighborhood
- Maple Tree neighborhood
- Maplecrest Estates neighborhood
- Maplecrest Glen neighborhood
- Maplecrest Woods neighborhood
- Maplegate neighborhood
- Mapleridge neighborhood
- Maplewood Meadows neighborhood
- Maplewood Terrace neighborhood
- Maplewood Village Commercial neighborhood
- Mar-Clare-Estates neighborhood
- Mariahs Place neighborhood
- Marins Manor neighborhood
- Marle Court neighborhood
- Marrion neighborhood
- Marrion Meadows neighborhood
- Maryhill neighborhood
- Marys Circle neighborhood
- Marywood neighborhood
- Matthew Meadow neighborhood
- Matthews Manor neighborhood
- Maxfield Estates neighborhood
- Maxwells Manor neighborhood
- Mayer Estates neighborhood
- Mayers Terrace neighborhood
- McGillivray Heights neighborhood
- McGillivray Highlands neighborhood
- Meadow neighborhood
- Meadow Brook neighborhood
- Meadow Creek neighborhood
- Meadow Dale neighborhood
- Meadow East neighborhood
- Meadow Estates neighborhood
- Meadow Grove Estates neighborhood
- Meadow Homes neighborhood
- Meadow Park neighborhood
- Meadow Terrace neighborhood
- Meadow Verde neighborhood
- Meadow View neighborhood
- Meadow at 51st Street neighborhood
- Meadowbrook Terrace neighborhood
- Meadowcharm neighborhood
- Meadowcrest neighborhood
- Meadowglen neighborhood
- Meadowlark Place neighborhood
- Meadows East neighborhood
- Meadows West neighborhood
- Meadows at Salmon Creek neighborhood
- Megans Meadows neighborhood
- Mels Manor neighborhood
- Merimar Estates neighborhood
- Meriwether Condominium neighborhood
- Merrifield Evergreen Acres neighborhood
- Merrifield Ten Acre Homes neighborhood
- Merrifields Acre Tracts neighborhood
- Merritts Hideaway neighborhood
- Mesa Verde neighborhood
- Messner Estates neighborhood
- Metropolitan Manor neighborhood
- Michaels Court neighborhood
- Michaelsen Infill neighborhood
- Michelles Meadow neighborhood
- Mid Terrace Estates neighborhood
- Mill Creek Forest neighborhood
- Mill Crest neighborhood
- Mill Plain Homestead neighborhood
- Mill Plain Orchards neighborhood
- Mill Plain Road neighborhood
- Mill Plain Terrain neighborhood
- Millbrook Townhomes neighborhood
- Miller Crest neighborhood
- Miller Estates neighborhood
- Miller Landing neighborhood
- Miller Pond Estates neighborhood
- Millers Edge neighborhood
- Mills neighborhood
- Milnik Acres neighborhood
- Minne Villa Terrace neighborhood
- Minnehaha Acres neighborhood
- Minnehaha Heights neighborhood
- Minnehaha Park neighborhood
- Mint Gardens neighborhood
- Mintview Terrace neighborhood
- Misty Dawn Estates neighborhood
- Misty Meadows Estates neighborhood
- Mockingbird Meadows neighborhood
- Modrall Homes neighborhood
- Monets Garden neighborhood
- Moongate neighborhood
- Moonlight Meadow neighborhood
- Moores Annex neighborhood
- Morgan Fields neighborhood
- Morgan Prairie neighborhood
- Morning Glenn neighborhood
- Morning Glory Hills neighborhood
- Morningside neighborhood
- Morningstar View neighborhood
- Morrow Glen neighborhood
- Morrow Heights neighborhood
- Morrow Terrace neighborhood
- Mortensen Meadows neighborhood
- Mount Vista neighborhood
- Mountain Glen neighborhood
- Mountain Peaks Meadow neighborhood
- Mountain View neighborhood
- Mountain View Center Rowhomes neighborhood
- Mountain View Estates neighborhood
- Mountain View Gardens neighborhood
- Mountain View Manor neighborhood
- Mountain View Meadows neighborhood
- Mountain View Terrace neighborhood
- Mountain View Village neighborhood
- Mountlake neighborhood
- Mountview Terrace neighborhood
- Moznette Manor neighborhood
- Myers Manor neighborhood
- Mynatt Place neighborhood
- Nathans Glen neighborhood
- Neals Crest neighborhood
- Neals Square neighborhood
- Neston Square neighborhood
- New Carissa neighborhood
- New Valley neighborhood
- Nicks Place neighborhood
- Nicole Meadows neighborhood
- Noahs Glen neighborhood
- Nob Hill neighborhood
- Nogal Terrace neighborhood
- Norelius Orchard Tracts neighborhood
- Norris Acre Tracts neighborhood
- Norse Estates neighborhood
- North Coast Company neighborhood
- North Coast Heights neighborhood
- North Columbia Gardens neighborhood
- North Garrison Heights neighborhood
- North Gate neighborhood
- North Hearthwood neighborhood
- North Image neighborhood
- North Irvington neighborhood
- North Lake neighborhood
- North Lake Annex neighborhood
- North Meadow Estates neighborhood
- North Pointe neighborhood
- North Ridge neighborhood
- North Shore neighborhood
- North Vancouver neighborhood
- Northcrest neighborhood
- Northeast Hazel Dell neighborhood
- Northfield neighborhood
- Northfield Condominium neighborhood
- Northfield at Fishers Landing neighborhood
- Northgate Estates neighborhood
- Northmoor Valley neighborhood
- Northshore neighborhood
- Northview neighborhood
- Northview Gardens neighborhood
- Northwest neighborhood
- Northwestern Home neighborhood
- Northwestmoor neighborhood
- Northwood neighborhood
- Northwood Estates neighborhood
- Northwood Park neighborhood
- Northwynd Condominums at Columbia Shores neighborhood
- Norvue Acres neighborhood
- Norwegian Meadows neighborhood
- Norwood Meadows neighborhood
- Norwood Villa neighborhood
- Oak Hills neighborhood
- Oak Landing Estates neighborhood
- Oak Leaf Terrace neighborhood
- Oak Meadow Place neighborhood
- Oak Run neighborhood
- Oak Tarry neighborhood
- Oak Tree Estates neighborhood
- Oak View Estates neighborhood
- Oakbrook neighborhood
- Oakdale Estates neighborhood
- Oakhurst neighborhood
- Oakhurst Annex neighborhood
- Oakhurst Park neighborhood
- Odyssey Acres neighborhood
- Ogden neighborhood
- Old Evergreen Highway neighborhood
- Olin Industrial Park neighborhood
- One Lake Place neighborhood
- One Towncenter neighborhood
- Opps Acres neighborhood
- Opus neighborhood
- Orchard Crest neighborhood
- Orchard Dell neighborhood
- Orchard Estates neighborhood
- Orchard Heights neighborhood
- Orchard Heights Estates neighborhood
- Orchard Hill neighborhood
- Orchard Lane neighborhood
- Orchard Terrace neighborhood
- Orchards neighborhood
- Orchards Center neighborhood
- Orchards Highlands neighborhood
- Orchards Meadows neighborhood
- Orchards Meadows Estates neighborhood
- Orchards Park neighborhood
- Orchards Place neighborhood
- Orchards Terrace neighborhood
- Orchards Town Center neighborhood
- Orion neighborhood
- Oro Vega neighborhood
- Orr-Lyda Acres neighborhood
- Oscars Ten neighborhood
- Owl Ridge neighborhood
- Pacific First Bank neighborhood
- Pacific Meadows neighborhood
- Pacific Nw Properties neighborhood
- Pacific Terrace neighborhood
- Padden Downs neighborhood
- Palace Courtyard neighborhood
- Para Los Nieto Infill neighborhood
- Park Crest Place neighborhood
- Park Estates neighborhood
- Park Lane Estates neighborhood
- Park Place neighborhood
- Park Place Business Center neighborhood
- Park Place Townhouse neighborhood
- Park Row Condominium neighborhood
- Park Terrace neighborhood
- Park View Estates neighborhood
- Parklane neighborhood
- Parkridge neighborhood
- Parkside neighborhood
- Parkside Manor neighborhood
- Parkside Meadows neighborhood
- Parkside Place neighborhood
- Parkside West neighborhood
- Parkside at Pleasant Valley neighborhood
- Parkview Estates at Pleasant Valley neighborhood
- Parkview Heights neighborhood
- Parkview Lane neighborhood
- Parkview Village neighborhood
- Parkview at Vancouvercenter neighborhood
- Parkway neighborhood
- Parkway East neighborhood
- Parkwood neighborhood
- Parkwood North neighborhood
- Parkwood West neighborhood
- Patricia Estates neighborhood
- Peaceful Meadows Infill neighborhood
- Peach Tree Estates neighborhood
- Peach Tree Meadows neighborhood
- Peach Tree Vista neighborhood
- Pebble Creek Farms neighborhood
- Pebble Creek Village neighborhood
- Pepper Ridge neighborhood
- Pepper Tree neighborhood
- Pheasant Grove neighborhood
- Pheasant Lane neighborhood
- Pheasant Ridge neighborhood
- Pheasant Run neighborhood
- Pheasant Woods neighborhood
- Pickwick Two neighborhood
- Pine Hollow neighborhood
- Pinebrook neighborhood
- Pinecrest Estates neighborhood
- Pinecrest Meadows neighborhood
- Pinecrest Terrace neighborhood
- Pinewood neighborhood
- Pioneer Meadows neighborhood
- Pleasant Meadows neighborhood
- Pleasant Plaza neighborhood
- Pleasant Valley neighborhood
- Pleasant Valley Acres neighborhood
- Pleasant Valley Infill neighborhood
- Pleasant View Terrace neighborhood
- Points West neighborhood
- Pomerville Grattan Business Park neighborhood
- Port View Estates neighborhood
- Portland neighborhood
- Portland Annex neighborhood
- Portland View Additon neighborhood
- Ports View Estates neighborhood
- Prairie Estates neighborhood
- Prairie Meadow neighborhood
- Prairie Park neighborhood
- Premier Acres neighborhood
- Presbyterg of the Cascade neighborhood
- Primrose Court neighborhood
- Princess Place neighborhood
- Promenade Park neighborhood
- Prospect Park neighborhood
- Prothero Acres neighborhood
- Quadrant Business Park neighborhood
- Quail Glen neighborhood
- Quail Park neighborhood
- Quail Run neighborhood
- Rachi Heights neighborhood
- Raemar Estates neighborhood
- Rainbow Terrace neighborhood
- Rainbows End neighborhood
- Raintree neighborhood
- Ramblin Creek neighborhood
- Rancho Grande neighborhood
- Raymond Place neighborhood
- Red Haven Estates neighborhood
- Redinger Estates neighborhood
- Redwing Village neighborhood
- Regal Way neighborhood
- Regents Hill neighborhood
- Renaissance neighborhood
- Renaissance at Hiddenbrook neighborhood
- Renaissance at Salmon Creek neighborhood
- Revelridge North neighborhood
- Revelridge South neighborhood
- Rhodehouse neighborhood
- Richland Estates neighborhood
- Richwood Estates neighborhood
- Ridge Creek neighborhood
- Ridge Creek Estates neighborhood
- Ridge Creek West neighborhood
- Ridgecrest neighborhood
- Ridgemont neighborhood
- Ridgeway Park neighborhood
- Ridgewood neighborhood
- Rio Linda neighborhood
- Rio Vista neighborhood
- Rivendel neighborhood
- River Estates neighborhood
- River View Heights neighborhood
- Rivercrest Estates neighborhood
- Riveridge neighborhood
- Rivermist neighborhood
- Riverridge Estates neighborhood
- Rivershore neighborhood
- Rivershore Landing neighborhood
- Riverside East neighborhood
- Riverside Pointe neighborhood
- Riverview neighborhood
- Riverwood neighborhood
- Roads End neighborhood
- Roads End Farm Estates neighborhood
- Roane Five Acre Tracts neighborhood
- Robb Homestead neighborhood
- Robbins Center neighborhood
- Robeck Acres neighborhood
- Robins Glen neighborhood
- Rock Creek neighborhood
- Rockmount neighborhood
- Rollin Hills neighborhood
- Rolling Creek neighborhood
- Rolling Village neighborhood
- Rose Briar Court neighborhood
- Rose Lawn neighborhood
- Rose Valley neighborhood
- Rose Village neighborhood
- Rosegarden neighborhood
- Rosemary Ridge neighborhood
- Rosemere neighborhood
- Rosemere Commons neighborhood
- Rosewood neighborhood
- Rossi Meadows neighborhood
- Rowland Heights neighborhood
- Royal neighborhood
- Royal Glen Rowhomes neighborhood
- Royal Greens neighborhood
- Royal Highlands neighborhood
- Royal Oaks neighborhood
- Royal Terrace neighborhood
- Royale Plains neighborhood
- Running Springs neighborhood
- Ryans Run neighborhood
- Ryerson Square neighborhood
- Ryerson Square Condominium neighborhood
- Saint Helens Park neighborhood
- Saint Helens Terrace neighborhood
- Saint Helens View neighborhood
- Saint James Place neighborhood
- Saint Johns Homestead neighborhood
- Saint Johns Plaza neighborhood
- Salmon Center neighborhood
- Salmon Creek Commons neighborhood
- Salmon Creek Estates neighborhood
- Salmon Creek Heights neighborhood
- Salmon Creek Landing neighborhood
- Salmon Creek Meadows neighborhood
- Salmon Creek Place neighborhood
- Salmon Creek Ventures neighborhood
- Salmon Creek Village neighborhood
- Samielle Park neighborhood
- Sammies Meadows neighborhood
- Sandcastle Heights neighborhood
- Sandy Slope neighborhood
- Sarah's Place neighborhood
- Scarborough Estates neighborhood
- Scotchbroom Acres neighborhood
- Scotts Landing neighborhood
- Sequoia Park neighborhood
- Sequoia View Estates neighborhood
- Serena Estates neighborhood
- Serencourt neighborhood
- Shadow Heights neighborhood
- Shadow Ridge neighborhood
- Shadow Wood neighborhood
- Shady Firs Estates neighborhood
- Shalako East neighborhood
- Shanako Ridge neighborhood
- Shannon Estates neighborhood
- Sharmel Slope neighborhood
- Sharps Homestead neighborhood
- Sharrick Manor neighborhood
- Shenandoah Townhomes neighborhood
- Shepherd Meadow neighborhood
- Sherwood neighborhood
- Sherwood Canyon neighborhood
- Sherwood East neighborhood
- Sherwood Forest neighborhood
- Sherwood Glen neighborhood
- Sherwood North neighborhood
- Sherwood Park neighborhood
- Sherwood Place neighborhood
- Sherwood Ridge neighborhood
- Shore Crest Estates neighborhood
- Shorecrest Terrace neighborhood
- Shorewood East neighborhood
- Shorewood West neighborhood
- Shumway neighborhood
- Sierra Rancho neighborhood
- Sierra Vista neighborhood
- Sifton neighborhood
- Sifton Commerce Center neighborhood
- Sifton Garden Annex neighborhood
- Sifton Garden Tracts neighborhood
- Sifton Meadows neighborhood
- Silver Crest Estates neighborhood
- Silver Oaks neighborhood
- Silver Pond Estates neighborhood
- Silver Springs Estates neighborhood
- Silver Star neighborhood
- Silver Star Estates neighborhood
- Silver Star Meadows neighborhood
- Silver Terrace neighborhood
- Sleret Highland neighborhood
- Sluman Road Estates neighborhood
- Snyders Country Place neighborhood
- Sohns Acres neighborhood
- Somerview neighborhood
- Songbird neighborhood
- Sonmar Heritage neighborhood
- Sorenson Heights neighborhood
- South Cliff neighborhood
- South Meadow neighborhood
- Southcrest Estates neighborhood
- Southeast Crestwood neighborhood
- Southridge neighborhood
- Southview Crest neighborhood
- Southview Terrace neighborhood
- Southwind neighborhood
- Southwood neighborhood
- Sparhawk Estates neighborhood
- Sparks Fairview neighborhood
- Spencer Park neighborhood
- Spring Creek neighborhood
- Springbrook Ridge neighborhood
- Springer Estates neighborhood
- Springhaven neighborhood
- Springwood neighborhood
- Stag Leap Canyon neighborhood
- Stardust Garden neighborhood
- Starlite Acres neighborhood
- Start Manor neighborhood
- Starwood neighborhood
- Steamboat Landing neighborhood
- Steamboat Landing Marina neighborhood
- Stein Estates neighborhood
- Stein Estates Rowhomes neighborhood
- Sterling Court neighborhood
- Sterling Meadows neighborhood
- Sterling North neighborhood
- Sterling Point neighborhood
- Stone Meadows neighborhood
- Stonebrook neighborhood
- Stonegate neighborhood
- Stonehenge Centre neighborhood
- Stonewall Terrace neighborhood
- Stonewall Townhomes neighborhood
- Stoney Meadows neighborhood
- Stoney Mist neighborhood
- Straight Homesites neighborhood
- Strawberry Hill neighborhood
- Strawberry Meadows neighborhood
- Strawberry Wine neighborhood
- Streissguth Estates neighborhood
- Suburban Home Tracts neighborhood
- Suburban Terrace neighborhood
- Summer Glen neighborhood
- Summerfield neighborhood
- Summerhill Estates neighborhood
- Summers Crossing neighborhood
- Summers Walk at Fishers Landing neighborhood
- Summerwood Village neighborhood
- Summit Park neighborhood
- Summit Ridge neighborhood
- Summit Springs neighborhood
- Sun Meadow Estates neighborhood
- Sun Prairie neighborhood
- Sun Quest Estates neighborhood
- Sun Ridge neighborhood
- Suncrest neighborhood
- Sundew Court neighborhood
- Sunflower Meadows neighborhood
- Sunhill neighborhood
- Sunny Acres neighborhood
- Sunny Glen neighborhood
- Sunny Meadow neighborhood
- Sunny Meadows neighborhood
- Sunny Meadows Estates neighborhood
- Sunnyside neighborhood
- Sunnyside Meadows neighborhood
- Sunridge neighborhood
- Sunrise Cove Townhomes neighborhood
- Sunrise Estates neighborhood
- Sunrise Glen neighborhood
- Sunrise Heights neighborhood
- Sunrise Meadows neighborhood
- Sunrise Place neighborhood
- Sunset Acres neighborhood
- Sunset Estates neighborhood
- Sunset Glen neighborhood
- Sunset Homes neighborhood
- Sunset Lane neighborhood
- Sunset Oaks neighborhood
- Sunset Strip neighborhood
- Sunset View Estates neighborhood
- Sunset Vista neighborhood
- Sunshien Meadows neighborhood
- Sunshine Estates neighborhood
- Sunshine View Estates neighborhood
- Sunview neighborhood
- Sunview Homes neighborhood
- Sunwood neighborhood
- Surveyors Place neighborhood
- Swan Homestead neighborhood
- Swans neighborhood
- Sylvan Terrace neighborhood
- Talarico Duplex neighborhood
- Tall Timbers neighborhood
- Tanglewood neighborhood
- Tay Terrace neighborhood
- Tay Terrace Supplement neighborhood
- Taylor Place neighborhood
- Teal Point neighborhood
- Teal Pointe Heights neighborhood
- Teal Pointe Ridge neighborhood
- Teammates Townhomes neighborhood
- Tenney Acres neighborhood
- Tenney Garden Tracts neighborhood
- Tenny Commons neighborhood
- Tenny Creek Park neighborhood
- Terris Terrace neighborhood
- The Bay Condo neighborhood
- The Bridge neighborhood
- The Colony neighborhood
- The Crown Continental neighborhood
- The Firs at Towncenter neighborhood
- The Maple Leaf neighborhood
- The Meadows neighborhood
- The Oaks neighborhood
- The Parkway neighborhood
- The Terrace neighborhood
- The Village at Cedar Ridge neighborhood
- Thera Mar neighborhood
- Thomas Meadows neighborhood
- Thompson Garden Tracts neighborhood
- Thompson Place neighborhood
- Thornton Springs neighborhood
- Three Acres neighborhood
- Three Firs neighborhood
- Three Fountains neighborhood
- Three Peaks Condominium neighborhood
- Three Pond Village See Pinebrook neighborhood
- Thunderbird Ridge neighborhood
- Tiare Hills neighborhood
- Tiare Place neighborhood
- Tibbets Meadows neighborhood
- Tidewater Cove neighborhood
- Tiffany Park neighborhood
- Tiger Tree neighborhood
- Timber Trail neighborhood
- Timberknoll neighborhood
- Timberlane neighborhood
- Timbers at Towne Center neighborhood
- Topper Landing neighborhood
- Totem Acres neighborhood
- Totem Two neighborhood
- Tower Crest neighborhood
- Tower Crest Meadow neighborhood
- Towncenter at Fishers Landing neighborhood
- Townhomes at Felida Park neighborhood
- Tracey Lane neighborhood
- Traders Green neighborhood
- Traditional Homes neighborhood
- Tranquivilla neighborhood
- Travis Estates neighborhood
- Triangle Estates neighborhood
- Trillium Court neighborhood
- Trillium Park neighborhood
- Truman neighborhood
- Tuscan Estates neighborhood
- Tuscany neighborhood
- Twin Firs neighborhood
- Twin Peaks neighborhood
- Tylers Glen neighborhood
- Tyrol Crest neighborhood
- U.S. Military Reservation neighborhood
- University Park neighborhood
- University Park Village neighborhood
- Updike Estates neighborhood
- Uptown Broadway neighborhood
- Uptown Villa neighborhood
- Uptown Village neighborhood
- Uptown Village 24th Street neighborhood
- Uptown Village 25th Street neighborhood
- Valley Glenn neighborhood
- Valley Meadow Estates neighborhood
- Valley View Court neighborhood
- Valley View Estates neighborhood
- Valleyridge neighborhood
- Valleywood neighborhood
- Van Mall Town Home neighborhood
- Vancalcar Acres neighborhood
- Vancouver Auto Mall neighborhood
- Vancouver Center neighborhood
- Vancouver Heights neighborhood
- Vancouver Mall (VanMall) neighborhood
- Vancouver Mall Square neighborhood
- Vancouver Plaza neighborhood
- Verda Vista neighborhood
- Vienna Woods neighborhood
- Viewcrest Terrace neighborhood
- Viewpoint at Vancouver Towncenter neighborhood
- Viewpoint at Vancouvercenter neighborhood
- Vilhauer Infill neighborhood
- Villa Canyon neighborhood
- Villa Hacienda neighborhood
- Villa Vue neighborhood
- Villa-Vue neighborhood
- Village Green neighborhood
- Village Hope neighborhood
- Village On The Ridge neighborhood
- Village Vista at Fishers Landing neighborhood
- Village at Cedar Ridge neighborhood
- Village at Columbia Shores neighborhood
- Village at Fisher's Landing neighborhood
- Village at The Park, Patio Homes neighborhood
- Vineyard Estates neighborhood
- Vineyards neighborhood
- Vintage Oaks neighborhood
- Violet Glen neighborhood
- Violet Place neighborhood
- Vision neighborhood
- Vista Creek neighborhood
- Vista Estates neighborhood
- Vista Heights neighborhood
- Vista Meadows neighborhood
- Vista Ridge Townhomes neighborhood
- Vista Robles neighborhood
- Vista Royale neighborhood
- Vista View Estates neighborhood
- Vista West neighborhood
- Vista Woods neighborhood
- Vue Park neighborhood
- Vuecrest neighborhood
- Wakefield neighborhood
- Wallace Heights neighborhood
- Wallace Homes neighborhood
- Wallingford Park neighborhood
- Walnut Estates neighborhood
- Walnut Grove East neighborhood
- Walnut Grove Estates neighborhood
- Walnut Grove Terrace neighborhood
- Walnut Heights neighborhood
- Walnut Manor neighborhood
- Walnut Meadows neighborhood
- Walnut Park neighborhood
- Walnut Place neighborhood
- Walnut Terrace neighborhood
- Walnut Village neighborhood
- Wanke Meadows neighborhood
- Wanke Wood neighborhood
- Wankwood neighborhood
- Warwick Townhouses neighborhood
- Washington Street Infill neighborhood
- Waterford Creek neighborhood
- Waters Edge neighborhood
- Wauna Vista neighborhood
- Webster Place neighborhood
- Wedgewood neighborhood
- Weona Terrace neighborhood
- Weona Vista neighborhood
- West Coast Bank Building neighborhood
- West Hazel Dell neighborhood
- West Meadows neighborhood
- West Minehaha neighborhood
- West Mt. Vista neighborhood
- West Pointe neighborhood
- West Side Park neighborhood
- West Vancouver neighborhood
- West of Westmoor neighborhood
- Westfield Park neighborhood
- Westfield Place Townhomes neighborhood
- Westgate neighborhood
- Westminister Walk neighborhood
- Westmont Place neighborhood
- Westmoor neighborhood
- Westons Annex neighborhood
- Westridge neighborhood
- Westside Terrace neighborhood
- Westview Meadows neighborhood
- Westvue neighborhood
- Westwood neighborhood
- Whipple Court neighborhood
- Whipple Creek Business Park neighborhood
- Whipple Creek Estates neighborhood
- Whipple Creek Meadows neighborhood
- Whipple Creek Place neighborhood
- Whispering Firs neighborhood
- Whispering Lane Meadow neighborhood
- Wiebold Heights neighborhood
- Wil Har Terrace neighborhood
- Wilar Terrace neighborhood
- Wild Cherry Court neighborhood
- Wild Dogwood neighborhood
- Wildflower Glen neighborhood
- Wilding Park Estates neighborhood
- Wildrose Terrace neighborhood
- Wildrose Terrace East neighborhood
- Wildwood neighborhood
- Wildwood Estates neighborhood
- Willo-Wood neighborhood
- Willowmist neighborhood
- Willowtree Estates neighborhood
- Wilmington Meadows neighborhood
- Wilson Hill neighborhood
- Windemere neighborhood
- Windfield Meadows neighborhood
- Windmill Terrace neighborhood
- Windsor Downs neighborhood
- Windwood Terrace neighborhood
- Winfields Woods neighborhood
- Winter Acres neighborhood
- Winter Vista neighborhood
- Wintergreen neighborhood
- Wolf Creek neighborhood
- Woodcreek neighborhood
- Woodcrest neighborhood
- Wooded Acres neighborhood
- Woodhaven neighborhood
- Woodlands neighborhood
- Woodmount Estates neighborhood
- Woods of Royal Oaks neighborhood
- Woodshire Glen neighborhood
- Woodside Hills neighborhood
- Woodview Terrace neighborhood
- Wright Homestead neighborhood
- Wubben Industrial Park neighborhood
- Wy East Meadows neighborhood
- Yearout Business Park neighborhood
- Yorkfield neighborhood
- Yorktown neighborhood
- Youngers Infill neighborhood
- Yvonne Manor neighborhood
- Zachary Landing neighborhood
Religion statistics for Vancouver, WA (based on Clark County data)
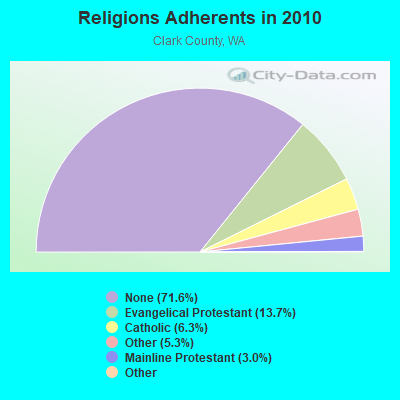
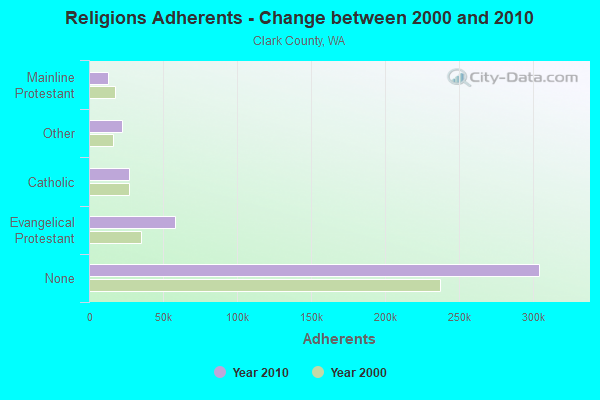
| Religion | Adherents | Congregations |
|---|---|---|
| Evangelical Protestant | 58,413 | 191 |
| Catholic | 26,886 | 9 |
| Other | 22,590 | 60 |
| Mainline Protestant | 12,633 | 37 |
| Black Protestant | 378 | 2 |
| Orthodox | 61 | 1 |
| None | 304,402 | - |
Food Environment Statistics:
| This county: | 1.10 / 10,000 pop. |
| Washington: | 2.06 / 10,000 pop. |
| This county: | 0.26 / 10,000 pop. |
| State: | 0.19 / 10,000 pop. |
| Clark County: | 0.94 / 10,000 pop. |
| Washington: | 1.18 / 10,000 pop. |
| This county: | 2.23 / 10,000 pop. |
| Washington: | 2.67 / 10,000 pop. |
| Clark County: | 5.74 / 10,000 pop. |
| Washington: | 8.26 / 10,000 pop. |
| Clark County: | 8.2% |
| Washington: | 7.7% |
| Clark County: | 27.6% |
| Washington: | 25.7% |
| Clark County: | 13.7% |
| State: | 13.9% |
Health and Nutrition:
| Vancouver: | 49.1% |
| Washington: | 49.9% |
| Vancouver: | 46.2% |
| Washington: | 47.2% |
| Vancouver: | 28.4 |
| Washington: | 28.4 |
| This city: | 21.3% |
| State: | 20.9% |
| Here: | 10.4% |
| State: | 10.5% |
| Vancouver: | 6.8 |
| Washington: | 6.8 |
| Vancouver: | 31.9% |
| Washington: | 32.8% |
| Vancouver: | 56.6% |
| Washington: | 56.8% |
| Vancouver: | 79.6% |
| Washington: | 79.4% |
More about Health and Nutrition of Vancouver, WA Residents
| Local government employment and payroll (March 2022) | |||||
| Function | Full-time employees | Monthly full-time payroll | Average yearly full-time wage | Part-time employees | Monthly part-time payroll |
|---|---|---|---|---|---|
| Police Protection - Officers | 211 | $2,168,134 | $123,306 | 0 | $0 |
| Firefighters | 195 | $2,387,982 | $146,953 | 0 | $0 |
| Water Supply | 131 | $1,076,259 | $98,589 | 0 | $0 |
| Sewerage | 93 | $631,894 | $81,535 | 0 | $0 |
| Housing and Community Development (Local) | 82 | $626,665 | $91,707 | 0 | $0 |
| Financial Administration | 76 | $662,756 | $104,646 | 0 | $0 |
| Other Government Administration | 56 | $451,702 | $96,793 | 4 | $5,279 |
| Streets and Highways | 55 | $418,661 | $91,344 | 0 | $0 |
| Police - Other | 50 | $314,798 | $75,552 | 0 | $0 |
| Parks and Recreation | 41 | $264,353 | $77,372 | 134 | $93,106 |
| Natural Resources | 34 | $214,826 | $75,821 | 7 | $16,532 |
| Judicial and Legal | 33 | $301,171 | $109,517 | 0 | $0 |
| Other and Unallocable | 19 | $122,939 | $77,646 | 0 | $0 |
| Fire - Other | 9 | $58,708 | $78,277 | 0 | $0 |
| Solid Waste Management | 4 | $28,033 | $84,099 | 0 | $0 |
| Airports | 1 | $10,760 | $129,120 | 0 | $0 |
| Totals for Government | 1,090 | $9,739,642 | $107,225 | 145 | $114,916 |
Vancouver government finances - Expenditure in 2021 (per resident):
- Construction - Regular Highways: $14,756,000 ($75.86)
Water Utilities: $13,973,000 ($71.84)
Sewerage: $13,425,000 ($69.02)
Parks and Recreation: $2,981,000 ($15.33)
Local Fire Protection: $2,517,000 ($12.94)
General - Other: $339,000 ($1.74)
Housing and Community Development: $62,000 ($0.32)
- Current Operations - Police Protection: $56,529,000 ($290.62)
Local Fire Protection: $45,651,000 ($234.70)
Sewerage: $41,849,000 ($215.15)
Water Utilities: $38,630,000 ($198.60)
General - Other: $21,578,000 ($110.93)
Regular Highways: $13,924,000 ($71.58)
Parks and Recreation: $11,596,000 ($59.62)
General Public Buildings: $10,652,000 ($54.76)
Central Staff Services: $10,647,000 ($54.74)
Housing and Community Development: $7,173,000 ($36.88)
Judicial and Legal Services: $6,281,000 ($32.29)
Protective Inspection and Regulation - Other: $4,263,000 ($21.92)
Parking Facilities: $2,163,000 ($11.12)
Solid Waste Management: $1,893,000 ($9.73)
Health - Other: $779,000 ($4.00)
Air Transportation: $544,000 ($2.80)
Miscellaneous Commercial Activities - Other: $3,000 ($0.02)
- General - Interest on Debt: $5,106,000 ($26.25)
- Intergovernmental to Local - Other - Solid Waste Management: $5,000 ($0.03)
- Intergovernmental to State - General - Other: $184,000 ($0.95)
- Other Capital Outlay - Regular Highways: $2,810,000 ($14.45)
Local Fire Protection: $1,975,000 ($10.15)
General - Other: $856,000 ($4.40)
- Total Salaries and Wages: $151,303,000 ($777.86)
- Water Utilities - Interest on Debt: $432,000 ($2.22)
Vancouver government finances - Revenue in 2021 (per resident):
- Charges - Sewerage: $67,213,000 ($345.55)
Other: $27,124,000 ($139.45)
Parking Facilities: $3,737,000 ($19.21)
Solid Waste Management: $1,799,000 ($9.25)
Parks and Recreation: $1,704,000 ($8.76)
Air Transportation: $708,000 ($3.64)
Regular Highways: $507,000 ($2.61)
Miscellaneous Commercial Activities: $177,000 ($0.91)
- Federal Intergovernmental - Highways: $2,936,000 ($15.09)
Other: $2,189,000 ($11.25)
- Local Intergovernmental - Other: $17,175,000 ($88.30)
- Miscellaneous - Special Assessments: $9,765,000 ($50.20)
General Revenue - Other: $4,003,000 ($20.58)
Rents: $3,867,000 ($19.88)
Sale of Property: $3,435,000 ($17.66)
Interest Earnings: $2,842,000 ($14.61)
Fines and Forfeits: $1,725,000 ($8.87)
Donations From Private Sources: $1,202,000 ($6.18)
- Revenue - Water Utilities: $44,809,000 ($230.37)
- State Intergovernmental - Other: $16,571,000 ($85.19)
Highways: $3,937,000 ($20.24)
General Local Government Support: $3,176,000 ($16.33)
Housing and Community Development: $446,000 ($2.29)
Health and Hospitals: $7,000 ($0.04)
- Tax - Property: $57,097,000 ($293.54)
Public Utilities Sales: $56,248,000 ($289.17)
General Sales and Gross Receipts: $48,542,000 ($249.56)
Documentary and Stock Transfer: $9,879,000 ($50.79)
Other License: $6,908,000 ($35.51)
Motor Vehicle License: $5,856,000 ($30.11)
Occupation and Business License - Other: $5,695,000 ($29.28)
Other Selective Sales: $2,019,000 ($10.38)
Vancouver government finances - Debt in 2021 (per resident):
- Long Term Debt - Beginning Outstanding - Unspecified Public Purpose: $181,920,000 ($935.26)
Outstanding Unspecified Public Purpose: $168,135,000 ($864.39)
Retired Unspecified Public Purpose: $25,488,000 ($131.04)
Issue, Unspecified Public Purpose: $11,702,000 ($60.16)
Vancouver government finances - Cash and Securities in 2021 (per resident):
- Bond Funds - Cash and Securities: $24,934,000 ($128.19)
- Other Funds - Cash and Securities: $380,478,000 ($1956.06)
- Sinking Funds - Cash and Securities: $19,673,000 ($101.14)
7.99% of this county's 2021 resident taxpayers lived in other counties in 2020 ($91,627 average adjusted gross income)
| Here: | 7.99% |
| Washington average: | 7.53% |
0.03% of residents moved from foreign countries ($212 average AGI)
Clark County: 0.03% Washington average: 0.05%
Top counties from which taxpayers relocated into this county between 2020 and 2021:
| from Multnomah County, OR | |
| from Washington County, OR | |
| from Clackamas County, OR |
6.69% of this county's 2020 resident taxpayers moved to other counties in 2021 ($81,466 average adjusted gross income)
| Here: | 6.69% |
| Washington average: | 7.40% |
0.01% of residents moved to foreign countries ($99 average AGI)
Clark County: 0.01% Washington average: 0.04%
Top counties to which taxpayers relocated from this county between 2020 and 2021:
| to Multnomah County, OR | |
| to Cowlitz County, WA | |
| to Washington County, OR |
| Businesses in Vancouver, WA | ||||
| Name | Count | Name | Count | |
|---|---|---|---|---|
| 24 Hour Fitness | 3 | Lane Bryant | 1 | |
| 7-Eleven | 11 | Lane Furniture | 4 | |
| AT&T | 5 | LensCrafters | 1 | |
| Ace Hardware | 3 | Little Caesars Pizza | 4 | |
| Aeropostale | 1 | Lowe's | 2 | |
| Albertsons | 3 | Macy's | 1 | |
| American Eagle Outfitters | 1 | Marriott | 2 | |
| Applebee's | 4 | MasterBrand Cabinets | 4 | |
| Arby's | 2 | Mazda | 1 | |
| AutoZone | 2 | McDonald's | 12 | |
| Baja Fresh Mexican Grill | 1 | Motel 6 | 1 | |
| Barnes & Noble | 1 | Motherhood Maternity | 1 | |
| Baskin-Robbins | 5 | New Balance | 8 | |
| Bath & Body Works | 1 | New York & Co | 1 | |
| Bed Bath & Beyond | 3 | Nike | 10 | |
| Best Western | 2 | Nissan | 1 | |
| Blockbuster | 7 | Nordstrom | 1 | |
| Budget Car Rental | 1 | Office Depot | 2 | |
| Buffalo Wild Wings | 1 | OfficeMax | 2 | |
| Burger King | 5 | Old Navy | 1 | |
| Carl\s Jr. | 4 | Olive Garden | 2 | |
| Catherines | 1 | On The Border | 1 | |
| Charlotte Russe | 1 | Outback | 1 | |
| Chevrolet | 1 | Outback Steakhouse | 1 | |
| Chipotle | 1 | Pac Sun | 1 | |
| Chuck E. Cheese's | 1 | Panda Express | 6 | |
| Cold Stone Creamery | 2 | Panera Bread | 1 | |
| Comfort Inn | 1 | Papa John's Pizza | 3 | |
| Comfort Suites | 1 | Payless | 4 | |
| Costco | 1 | Penske | 3 | |
| Cricket Wireless | 7 | PetSmart | 3 | |
| Curves | 5 | Pier 1 Imports | 1 | |
| DHL | 6 | Pizza Hut | 4 | |
| Dairy Queen | 6 | Plato's Closet | 1 | |
| Days Inn | 2 | Quality | 1 | |
| Decora Cabinetry | 2 | Quiznos | 7 | |
| Discount Tire | 1 | RadioShack | 5 | |
| Domino's Pizza | 5 | Red Lobster | 1 | |
| DressBarn | 1 | Red Robin | 2 | |
| Dressbarn | 1 | Rite Aid | 3 | |
| Econo Lodge | 1 | Rodeway Inn | 1 | |
| Extended Stay America | 1 | Ruby Tuesday | 1 | |
| Famous Footwear | 2 | SONIC Drive-In | 1 | |
| Fashion Bug | 1 | Safeway | 8 | |
| FedEx | 36 | Sears | 2 | |
| Firestone Complete Auto Care | 2 | Sephora | 2 | |
| Foot Locker | 1 | Spencer Gifts | 1 | |
| Ford | 1 | Sprint Nextel | 3 | |
| Forever 21 | 1 | Starbucks | 26 | |
| Fredericks Of Hollywood | 1 | Subaru | 1 | |
| GNC | 5 | Subway | 31 | |
| GameStop | 5 | T-Mobile | 12 | |
| Goodwill | 2 | T.J.Maxx | 1 | |
| Gymboree | 1 | Taco Bell | 8 | |
| H&R Block | 12 | Target | 3 | |
| Hilton | 2 | The Room Place | 2 | |
| Holiday Inn | 3 | Torrid | 1 | |
| Hollister Co. | 1 | Toyota | 1 | |
| Home Depot | 2 | Toys"R"Us | 1 | |
| HomeTown Buffet | 1 | Trader Joe's | 1 | |
| Honda | 1 | True Value | 2 | |
| Hot Topic | 1 | U-Haul | 11 | |
| IHOP | 2 | UPS | 40 | |
| JCPenney | 2 | Vans | 6 | |
| Jack In The Box | 6 | Verizon Wireless | 6 | |
| Jamba Juice | 2 | Victoria's Secret | 1 | |
| Jones New York | 2 | Volkswagen | 1 | |
| Journeys | 1 | Vons | 8 | |
| Justice | 1 | Walgreens | 10 | |
| KFC | 4 | Walmart | 3 | |
| Kincaid | 2 | Wendy's | 7 | |
| Kohl's | 2 | Wet Seal | 1 | |
| Kroger | 14 | Whole Foods Market | 1 | |
| LA Fitness | 2 | YMCA | 1 | |
| La Quinta | 1 | |||
Strongest AM radio stations in Vancouver:
- KKGT (1150 AM; 5 kW; PORTLAND, OR; Owner: WESTERN BROADCASTING COMPANY)
- KPAM (860 AM; 50 kW; TROUTDALE, OR; Owner: PAMPLIN BROADCASTING-OREGON, INC.)
- KKAD (1550 AM; 50 kW; VANCOUVER, WA; Owner: PAMPLIN BROADCASTING-WASHINGTON, INC)
- KOTK (1080 AM; 50 kW; PORTLAND, OR; Owner: FISHER BROADCASTING - PORTLAND RADIO, L.L.C.)
- KPOJ (620 AM; 50 kW; PORTLAND, OR; Owner: CITICASTERS LICENSES, L.P.)
- KFXX (910 AM; 10 kW; VANCOUVER, WA; Owner: ENTERCOM PORTLAND LICENSE, LLC (DE))
- KXL (750 AM; 50 kW; PORTLAND, OR; Owner: ROSE CITY RADIO CORPORATION)
- KEX (1190 AM; 50 kW; PORTLAND, OR; Owner: CITICASTERS LICENSES, L.P.)
- KKSN (1520 AM; 50 kW; OREGON CITY, OR; Owner: ENTERCOM PORTLAND LICENSE, LLC)
- KUPL (970 AM; 5 kW; PORTLAND, OR; Owner: INFINITY RADIO OPERATIONS INC.)
- KBMS (1480 AM; 2 kW; VANCOUVER, WA; Owner: CHRISTOPHER H. BENNETT B/CING OF WA)
- KDZR (1640 AM; 10 kW; LAKE OSWEGO, OR; Owner: ABC, INC.)
- KKSL (1290 AM; 10 kW; LAKE OSWEGO, OR; Owner: ABC, INC.)
Strongest FM radio stations in Vancouver:
- KRVO (105.9 FM; VANCOUVER, WA; Owner: CITICASTERS LICENSES, L.P.)
- KINK (101.9 FM; PORTLAND, OR; Owner: INFINITY RADIO OPERATIONS INC.)
- KKCW (103.3 FM; BEAVERTON, OR; Owner: CITICASTERS LICENSES, L.P.)
- KOPB-FM (91.5 FM; PORTLAND, OR; Owner: OREGON PUBLIC BROADCASTING)
- KPDQ-FM (93.7 FM; PORTLAND, OR; Owner: SALEM MEDIA OF OREGON, INC.)
- KKRZ (100.3 FM; PORTLAND, OR; Owner: CITICASTERS LICENSES, L.P.)
- KUFO-FM (101.1 FM; PORTLAND, OR; Owner: INFINITY RADIO OPERATIONS INC.)
- KMHD (89.1 FM; GRESHAM, OR; Owner: MT. HOOD COMMUNITY COLLEGE DISTRICT)
- KVMX (107.5 FM; BANKS, OR; Owner: INFINITY RADIO OPERATIONS INC.)
- KLTH (106.7 FM; LAKE OSWEGO, OR; Owner: INIFINITY RADIO OF PORTLAND INC.)
- KUPL-FM (98.7 FM; PORTLAND, OR; Owner: INFINITY RADIO OF PORTLAND INC.)
- KBVM (88.3 FM; PORTLAND, OR; Owner: CATHOLIC BROADCASTING NORTHWEST, INC)
- KBPS-FM (89.9 FM; PORTLAND, OR; Owner: SCHOOL DISTRICT #1, MULTNOMAH COUNTY, OR)
- KNRK (94.7 FM; CAMAS, WA; Owner: ENTERCOM PORTLAND LICENSE, LLC (DE))
- KFIS (104.1 FM; SCAPPOOSE, OR; Owner: CARON BROADCASTING, INC.)
- KBOO (90.7 FM; PORTLAND, OR; Owner: THE KBOO FOUNDATION)
- KWJJ-FM (99.5 FM; PORTLAND, OR; Owner: FISHER BROADCASTING - PORTLAND RADIO, L.L.C.)
- KGON (92.3 FM; PORTLAND, OR; Owner: ENTERCOM PORTLAND LICENSE, LLC (DE))
- KKSN-FM (97.1 FM; PORTLAND, OR; Owner: ENTERCOM PORTLAND LICENSE, LLC (DE))
- KXJM (95.5 FM; PORTLAND, OR; Owner: ROSE CITY RADIO CORPORATION)
TV broadcast stations around Vancouver:
- KATU (Channel 2; PORTLAND, OR; Owner: FISHER BROADCASTING - PORTLAND TV, L.L.C.)
- KPDX (Channel 49; VANCOUVER, WA; Owner: MEREDITH CORPORATION)
- KPTV (Channel 12; PORTLAND, OR; Owner: MEREDITH CORPORATION)
- K57IF (Channel 57; SALEM, OR; Owner: LaGRANDE BROADCASTING, INC.)
- KOIN (Channel 6; PORTLAND, OR; Owner: EMMIS TELEVISION LICENSE CORPORATION)
- KNMT (Channel 24; PORTLAND, OR; Owner: NATIONAL MINORITY T.V., INC.)
- KGW (Channel 8; PORTLAND, OR; Owner: KING BROADCASTING COMPANY)
- KOPB-TV (Channel 10; PORTLAND, OR; Owner: OREGON PUBLIC BROADCASTING)
- KPXG-LP (Channel 54; PORTLAND, OR; Owner: PAXSON COMMUNICATIONS LICENSE COMPANY, LLC)
- K14HN (Channel 14; VANCOUVER/CAMAS, WA; Owner: MEREDITH CORPORATION)
- KWBP-LP (Channel 4; PORTLAND, OR; Owner: TRIBUNE BROADCASTING HOLDINGS, INC.)
- KORK-CA (Channel 35; PORTLAND, OR; Owner: WATCHTV, INC.)
- K18EL (Channel 18; NEWBERG/TIGARD, OR; Owner: MEREDITH CORPORATION)
- K58CO (Channel 58; PORTLAND, OR; Owner: NORTHWEST CHRISTIAN BROADCASTING)
- K16CB (Channel 16; HAPPY VALLEY, OR; Owner: MEREDITH CORPORATION)
- KKEI-CA (Channel 56; PORTLAND, OR; Owner: WATCHTV, INC.)
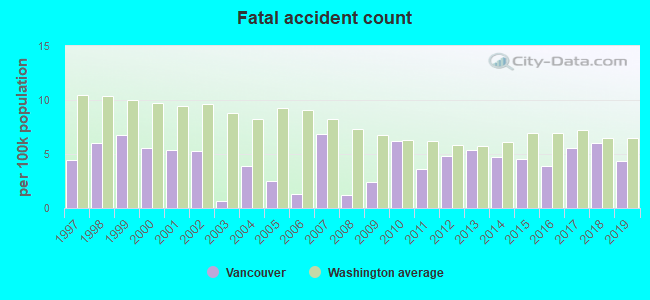
- National Bridge Inventory (NBI) Statistics
- 117Number of bridges
- 3,524ft / 1,074mTotal length
- $968,850,000Total costs
- 4,641,551Total average daily traffic
- 326,284Total average daily truck traffic
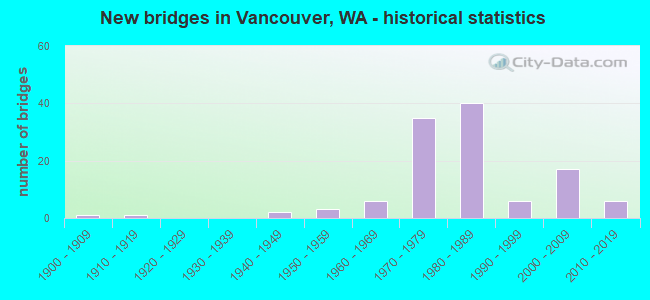
- New bridges - historical statistics
- 11900-1909
- 11910-1919
- 21940-1949
- 31950-1959
- 61960-1969
- 351970-1979
- 401980-1989
- 61990-1999
- 172000-2009
- 62010-2019
FCC Registered Antenna Towers: 977 (See the full list of FCC Registered Antenna Towers)
FCC Registered Commercial Land Mobile Towers: 2 (See the full list of FCC Registered Commercial Land Mobile Towers in Vancouver, WA)
FCC Registered Private Land Mobile Towers: 4 (See the full list of FCC Registered Private Land Mobile Towers)
FCC Registered Broadcast Land Mobile Towers: 150 (See the full list of FCC Registered Broadcast Land Mobile Towers)
FCC Registered Microwave Towers: 101 (See the full list of FCC Registered Microwave Towers in this town)
FCC Registered Paging Towers: 12 (See the full list of FCC Registered Paging Towers)
FCC Registered Maritime Coast & Aviation Ground Towers: 7 (See the full list of FCC Registered Maritime Coast & Aviation Ground Towers)
FCC Registered Amateur Radio Licenses: 2,505 (See the full list of FCC Registered Amateur Radio Licenses in Vancouver)
FAA Registered Aircraft: 248 (See the full list of FAA Registered Aircraft in Vancouver)
| Home Mortgage Disclosure Act Aggregated Statistics For Year 2009 (Based on 29 full and 9 partial tracts) | ||||||||||||||
| A) FHA, FSA/RHS & VA Home Purchase Loans | B) Conventional Home Purchase Loans | C) Refinancings | D) Home Improvement Loans | E) Loans on Dwellings For 5+ Families | F) Non-occupant Loans on < 5 Family Dwellings (A B C & D) | G) Loans On Manufactured Home Dwelling (A B C & D) | ||||||||
|---|---|---|---|---|---|---|---|---|---|---|---|---|---|---|
| Number | Average Value | Number | Average Value | Number | Average Value | Number | Average Value | Number | Average Value | Number | Average Value | Number | Average Value | |
| LOANS ORIGINATED | 738 | $186,112 | 561 | $182,112 | 3,189 | $187,880 | 97 | $90,644 | 13 | $3,482,128 | 311 | $160,968 | 15 | $99,008 |
| APPLICATIONS APPROVED, NOT ACCEPTED | 41 | $179,937 | 72 | $170,079 | 459 | $192,738 | 25 | $103,568 | 0 | $0 | 47 | $131,437 | 7 | $60,580 |
| APPLICATIONS DENIED | 105 | $181,626 | 112 | $183,745 | 1,217 | $196,061 | 85 | $69,282 | 2 | $349,500 | 143 | $170,861 | 16 | $80,286 |
| APPLICATIONS WITHDRAWN | 94 | $177,456 | 100 | $212,066 | 705 | $201,168 | 24 | $85,138 | 3 | $11,927,403 | 74 | $154,174 | 2 | $135,660 |
| FILES CLOSED FOR INCOMPLETENESS | 12 | $179,453 | 17 | $198,209 | 138 | $200,466 | 7 | $123,690 | 0 | $0 | 14 | $120,411 | 1 | $13,340 |
Detailed mortgage data for all 38 tracts in Vancouver, WA
| Private Mortgage Insurance Companies Aggregated Statistics For Year 2009 (Based on 27 full and 9 partial tracts) | ||||||
| A) Conventional Home Purchase Loans | B) Refinancings | C) Non-occupant Loans on < 5 Family Dwellings (A & B) | ||||
|---|---|---|---|---|---|---|
| Number | Average Value | Number | Average Value | Number | Average Value | |
| LOANS ORIGINATED | 75 | $209,351 | 64 | $218,306 | 2 | $313,000 |
| APPLICATIONS APPROVED, NOT ACCEPTED | 25 | $212,773 | 44 | $210,545 | 4 | $215,210 |
| APPLICATIONS DENIED | 22 | $188,116 | 17 | $235,294 | 1 | $417,000 |
| APPLICATIONS WITHDRAWN | 7 | $198,311 | 12 | $205,412 | 0 | $0 |
| FILES CLOSED FOR INCOMPLETENESS | 2 | $160,500 | 2 | $209,665 | 1 | $175,000 |
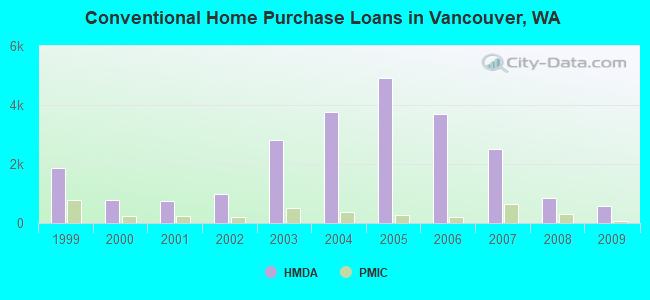
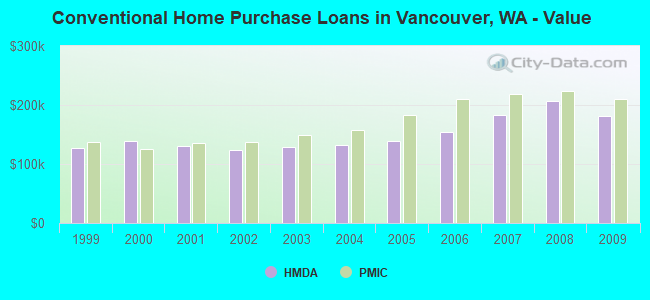
2002 - 2018 National Fire Incident Reporting System (NFIRS) incidents
- Fire incident types reported to NFIRS in Vancouver, WA
- 6,94551.2%Outside Fires
- 3,87128.5%Structure Fires
- 1,95514.4%Mobile Property/Vehicle Fires
- 7955.9%Other
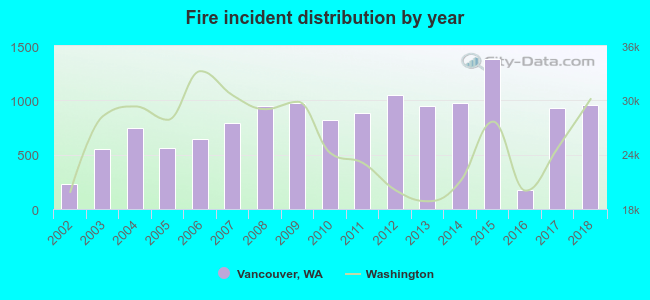 Based on the data from the years 2002 - 2018 the average number of fires per year is 798. The highest number of reported fires - 1,381 took place in 2015, and the least - 174 in 2016. The data has a rising trend.
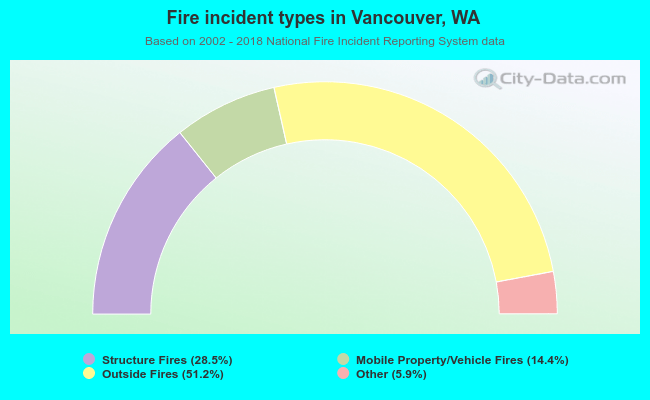 When looking into fire subcategories, the most reports belonged to: Outside Fires (51.2%), and Structure Fires (28.5%).
Fire-safe hotels and motels in Vancouver, Washington:
- Quality Inn & Conference Center, 221 NE Chkalov, Vancouver, Washington 98684 , Phone: (360) 253-8900, Fax: (360) 256-1231
- The Guest House Motel, 11504 Ne 2ND St, Vancouver, Washington 98684 , Phone: (360) 254-4511, Fax: (360) 254-7274
- Sonesta ES Suites Portland - Vancouver, 8005 NE Pkwy Dr, Vancouver, Washington 98662 , Phone: (360) 253-4800
- Vancouver Comfort Inn and Suites, 401 E 13TH St, Vancouver, Washington 98660 , Phone: (360) 696-0411, Fax: (360) 750-0933
- Comfort Suites, 4714 NE 94TH Ave, Vancouver, Washington 98662 , Phone: (360) 253-3100, Fax: (360) 253-7998
- Ramada Inn, 9107 NE Vancouver Mall Dr, Vancouver, Washington 98662 , Phone: (360) 253-5000, Fax: (360) 253-3137
- Red Lion Hotel At The Quay, 100 Columbia St, Vancouver, Washington 98660 , Phone: (360) 694-8341, Fax: (360) 694-2023
- Quality Inn & Suites, 13207 NE 20th Ave, Vancouver, Washington 98686 , Phone: (360) 574-6000, Fax: (360) 816-0571
- 16 other hotels and motels
| Most common first names in Vancouver, WA among deceased individuals | ||
| Name | Count | Lived (average) |
|---|---|---|
| John | 923 | 75.0 years |
| Robert | 878 | 70.4 years |
| William | 822 | 74.4 years |
| Mary | 687 | 78.5 years |
| James | 672 | 71.1 years |
| George | 525 | 77.1 years |
| Charles | 497 | 74.7 years |
| Helen | 415 | 80.7 years |
| Dorothy | 393 | 78.3 years |
| Richard | 382 | 68.2 years |
| Most common last names in Vancouver, WA among deceased individuals | ||
| Last name | Count | Lived (average) |
|---|---|---|
| Smith | 385 | 74.3 years |
| Johnson | 384 | 76.8 years |
| Miller | 247 | 76.0 years |
| Anderson | 237 | 77.1 years |
| Brown | 232 | 76.2 years |
| Jones | 186 | 74.2 years |
| Davis | 183 | 76.0 years |
| Wilson | 183 | 76.7 years |
| Nelson | 177 | 74.5 years |
| Williams | 161 | 74.7 years |
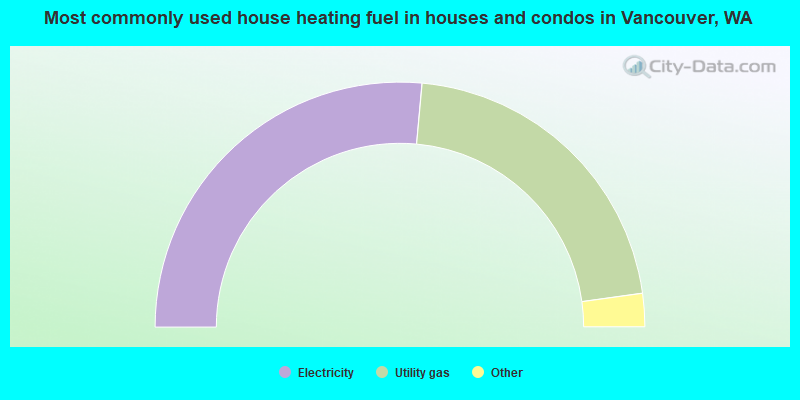
- 52.9%Electricity
- 42.7%Utility gas
- 2.0%Wood
- 0.8%Fuel oil, kerosene, etc.
- 0.7%Bottled, tank, or LP gas
- 0.6%Other fuel
- 0.3%No fuel used
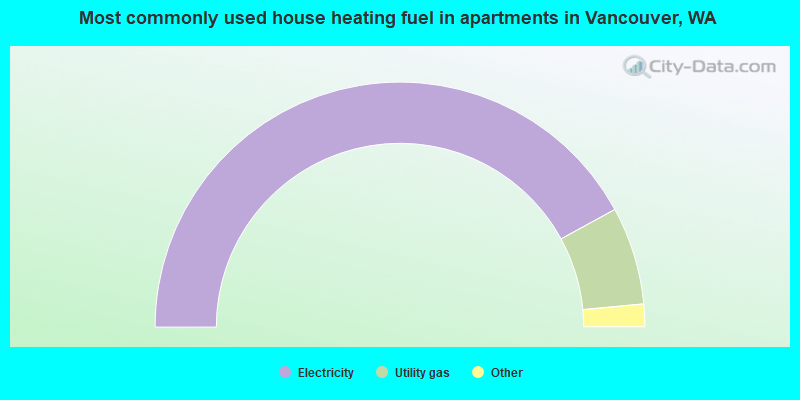
- 84.1%Electricity
- 12.9%Utility gas
- 1.2%Bottled, tank, or LP gas
- 1.1%No fuel used
- 0.4%Wood
- 0.2%Other fuel
- 0.1%Fuel oil, kerosene, etc.
Vancouver compared to Washington state average:
- Unemployed percentage below state average.
Vancouver, WA compared to other similar cities:
Vancouver on our top lists:
- #10 on the list of "Top 101 cities with largest percentage population increases in the 1990s) (population 50,000+)"
- #25 on the list of "Top 101 cities with the lowest minimum monthly sunshine amount (population 50,000+)"
- #29 on the list of "Top 101 cities with the most people born in other U.S. states (population 50,000+)"
- #35 on the list of "Top 101 cities with the lowest cost per building permit (population 50,000+)"
- #45 on the list of "Top 101 cities with the lowest average sunshine amount (population 50,000+)"
- #66 on the list of "Top 101 cities with the highest number of auto thefts per 100,000 residents, excludes tourist destinations and others with a lot of outsiders visiting based on city industries data (population 50,000+)"
- #79 on the list of "Top 101 cities with the largest city-data.com crime index per police officer (population 50,000+)"
- #79 on the list of "Top 101 cities with largest percentage of males in industries: transportation and warehousing (population 50,000+)"
- #80 on the list of "Top 101 cities with largest percentage of females in occupations: food preparation and serving related occupations (population 50,000+)"
- #82 on the list of "Top 101 cities with the highest ratio of rapes to murders between 2002 and 2012 (population 50,000+)"
- #92 on the list of "Top 101 cities with the largest sunshine amount differences during a year (population 50,000+)"
- #98 on the list of "Top 101 cities with the largest racial income disparity between any two races with at least 200 householders"
- #101 on the list of "Top 101 cities with the lowest number of police officers per 1000 residents (population 50,000+)"
- #82 (98684) on the list of "Top 101 zip codes with the largest percentage of Ukrainian first ancestries (pop 5,000+)"
- #9 on the list of "Top 101 counties with the largest increase in the number of infant deaths per 1000 residents 2000-2006 to 2007-2013 (pop. 50,000+)"
- #26 on the list of "Top 101 counties with the highest average weight of females"
- #45 on the list of "Top 101 counties with the highest percentage of residents that exercised in the past month"
- #59 on the list of "Top 101 counties with the lowest Ozone (1-hour) air pollution readings in 2012 (ppm)"
- #62 on the list of "Top 101 counties with the highest ground withdrawal of fresh water for public supply"

|
|
Total of 2658 patent applications in 2008-2024.