Estimated zip code population in 2022: 31,902
Zip code population in 2010: 30,832
Zip code population in 2000: 28,210
Houses and condos: 14,395
Renter-occupied apartments: 5,981
% of renters here:
43%State:
36%
March 2022 cost of living index in zip code 98683: 105.0
(near average, U.S. average is 100)
Land area: 7.3
sq. mi.
Water area: 0.5
sq. mi.
Population density: 4,394 people per square mile (average).
OSM Map
General Map
Google Map
MSN Map
OSM Map
General Map
Google Map
MSN Map
OSM Map
General Map
Google Map
MSN Map
OSM Map
General Map
Google Map
MSN Map
Please wait while loading the map...
Real estate property taxes paid for housing units in 2022:
This zip code:
0.8% ($4,350)Washington:
0.8% ($4,283)
Median real estate property taxes paid for housing units with mortgages in 2022: $4,412 (0.8%)
Median real estate property taxes paid for housing units with no mortgage in 2022: $4,251 (0.8%)
Profiles of local businesses
Business Search - 14 Million verified businesses
Males: 15,671 Females: 16,230
For population 25 years and over in 98683:
High school or higher: 93.2%Bachelor's degree or higher: 41.4%Graduate or professional degree: 16.6%Unemployed: 4.8%Mean travel time to work (commute): 23.3 minutes
For population 15 years and over in 98683:
Never married: 29.4%Now married: 49.5%Separated: 1.3%Widowed: 6.9%Divorced: 12.9%
Zip code 98683 compared to state average:
Black race population percentage below state average. Median age above state average. Length of stay since moving in significantly above state average. House age below state average. 21,566 67.6% White 4,186 13.1% Hispanic or Latino 3,270 10.3% Asian 2,047 6.4% Two or more races 559 1.8% Black 119 0.4% American Indian 77 0.2% Native Hawaiian and Other 73 0.2% Some other race
Data:
Median household income ($)
Median household income (% change since 2000)
Household income diversity
Ratio of average income to average house value (%)
Ratio of average income to average rent
Median household income ($) - White
Median household income ($) - Black or African American
Median household income ($) - Asian
Median household income ($) - Hispanic or Latino
Median household income ($) - American Indian and Alaska Native
Median household income ($) - Multirace
Median household income ($) - Other Race
Median household income for houses/condos with a mortgage ($)
Median household income for apartments without a mortgage ($)
Races - White alone (%)
Races - White alone (% change since 2000)
Races - Black alone (%)
Races - Black alone (% change since 2000)
Races - American Indian alone (%)
Races - American Indian alone (% change since 2000)
Races - Asian alone (%)
Races - Asian alone (% change since 2000)
Races - Hispanic (%)
Races - Hispanic (% change since 2000)
Races - Native Hawaiian and Other Pacific Islander alone (%)
Races - Native Hawaiian and Other Pacific Islander alone (% change since 2000)
Races - Two or more races (%)
Races - Two or more races (% change since 2000)
Races - Other race alone (%)
Races - Other race alone (% change since 2000)
Racial diversity
Unemployment (%)
Unemployment (% change since 2000)
Unemployment (%) - White
Unemployment (%) - Black or African American
Unemployment (%) - Asian
Unemployment (%) - Hispanic or Latino
Unemployment (%) - American Indian and Alaska Native
Unemployment (%) - Multirace
Unemployment (%) - Other Race
Population density (people per square mile)
Population - Males (%)
Population - Females (%)
Population - Males (%) - White
Population - Males (%) - Black or African American
Population - Males (%) - Asian
Population - Males (%) - Hispanic or Latino
Population - Males (%) - American Indian and Alaska Native
Population - Males (%) - Multirace
Population - Males (%) - Other Race
Population - Females (%) - White
Population - Females (%) - Black or African American
Population - Females (%) - Asian
Population - Females (%) - Hispanic or Latino
Population - Females (%) - American Indian and Alaska Native
Population - Females (%) - Multirace
Population - Females (%) - Other Race
Coronavirus confirmed cases (Apr 27, 2024)
Deaths caused by coronavirus (Apr 27, 2024)
Coronavirus confirmed cases (per 100k population) (Apr 27, 2024)
Deaths caused by coronavirus (per 100k population) (Apr 27, 2024)
Daily increase in number of cases (Apr 27, 2024)
Weekly increase in number of cases (Apr 27, 2024)
Cases doubled (in days) (Apr 27, 2024)
Hospitalized patients (Apr 18, 2022)
Negative test results (Apr 18, 2022)
Total test results (Apr 18, 2022)
COVID Vaccine doses distributed (per 100k population) (Sep 19, 2023)
COVID Vaccine doses administered (per 100k population) (Sep 19, 2023)
COVID Vaccine doses distributed (Sep 19, 2023)
COVID Vaccine doses administered (Sep 19, 2023)
Likely homosexual households (%)
Likely homosexual households (% change since 2000)
Likely homosexual households - Lesbian couples (%)
Likely homosexual households - Lesbian couples (% change since 2000)
Likely homosexual households - Gay men (%)
Likely homosexual households - Gay men (% change since 2000)
Cost of living index
Median gross rent ($)
Median contract rent ($)
Median monthly housing costs ($)
Median house or condo value ($)
Median house or condo value ($ change since 2000)
Mean house or condo value by units in structure - 1, detached ($)
Mean house or condo value by units in structure - 1, attached ($)
Mean house or condo value by units in structure - 2 ($)
Mean house or condo value by units in structure by units in structure - 3 or 4 ($)
Mean house or condo value by units in structure - 5 or more ($)
Mean house or condo value by units in structure - Boat, RV, van, etc. ($)
Mean house or condo value by units in structure - Mobile home ($)
Median house or condo value ($) - White
Median house or condo value ($) - Black or African American
Median house or condo value ($) - Asian
Median house or condo value ($) - Hispanic or Latino
Median house or condo value ($) - American Indian and Alaska Native
Median house or condo value ($) - Multirace
Median house or condo value ($) - Other Race
Median resident age
Resident age diversity
Median resident age - Males
Median resident age - Females
Median resident age - White
Median resident age - Black or African American
Median resident age - Asian
Median resident age - Hispanic or Latino
Median resident age - American Indian and Alaska Native
Median resident age - Multirace
Median resident age - Other Race
Median resident age - Males - White
Median resident age - Males - Black or African American
Median resident age - Males - Asian
Median resident age - Males - Hispanic or Latino
Median resident age - Males - American Indian and Alaska Native
Median resident age - Males - Multirace
Median resident age - Males - Other Race
Median resident age - Females - White
Median resident age - Females - Black or African American
Median resident age - Females - Asian
Median resident age - Females - Hispanic or Latino
Median resident age - Females - American Indian and Alaska Native
Median resident age - Females - Multirace
Median resident age - Females - Other Race
Commute - mean travel time to work (minutes)
Travel time to work - Less than 5 minutes (%)
Travel time to work - Less than 5 minutes (% change since 2000)
Travel time to work - 5 to 9 minutes (%)
Travel time to work - 5 to 9 minutes (% change since 2000)
Travel time to work - 10 to 19 minutes (%)
Travel time to work - 10 to 19 minutes (% change since 2000)
Travel time to work - 20 to 29 minutes (%)
Travel time to work - 20 to 29 minutes (% change since 2000)
Travel time to work - 30 to 39 minutes (%)
Travel time to work - 30 to 39 minutes (% change since 2000)
Travel time to work - 40 to 59 minutes (%)
Travel time to work - 40 to 59 minutes (% change since 2000)
Travel time to work - 60 to 89 minutes (%)
Travel time to work - 60 to 89 minutes (% change since 2000)
Travel time to work - 90 or more minutes (%)
Travel time to work - 90 or more minutes (% change since 2000)
Marital status - Never married (%)
Marital status - Now married (%)
Marital status - Separated (%)
Marital status - Widowed (%)
Marital status - Divorced (%)
Median family income ($)
Median family income (% change since 2000)
Median non-family income ($)
Median non-family income (% change since 2000)
Median per capita income ($)
Median per capita income (% change since 2000)
Median family income ($) - White
Median family income ($) - Black or African American
Median family income ($) - Asian
Median family income ($) - Hispanic or Latino
Median family income ($) - American Indian and Alaska Native
Median family income ($) - Multirace
Median family income ($) - Other Race
Median year house/condo built
Median year apartment built
Year house built - Built 2005 or later (%)
Year house built - Built 2000 to 2004 (%)
Year house built - Built 1990 to 1999 (%)
Year house built - Built 1980 to 1989 (%)
Year house built - Built 1970 to 1979 (%)
Year house built - Built 1960 to 1969 (%)
Year house built - Built 1950 to 1959 (%)
Year house built - Built 1940 to 1949 (%)
Year house built - Built 1939 or earlier (%)
Average household size
Household density (households per square mile)
Average household size - White
Average household size - Black or African American
Average household size - Asian
Average household size - Hispanic or Latino
Average household size - American Indian and Alaska Native
Average household size - Multirace
Average household size - Other Race
Occupied housing units (%)
Vacant housing units (%)
Owner occupied housing units (%)
Renter occupied housing units (%)
Vacancy status - For rent (%)
Vacancy status - For sale only (%)
Vacancy status - Rented or sold, not occupied (%)
Vacancy status - For seasonal, recreational, or occasional use (%)
Vacancy status - For migrant workers (%)
Vacancy status - Other vacant (%)
Residents with income below the poverty level (%)
Residents with income below 50% of the poverty level (%)
Children below poverty level (%)
Poor families by family type - Married-couple family (%)
Poor families by family type - Male, no wife present (%)
Poor families by family type - Female, no husband present (%)
Poverty status for native-born residents (%)
Poverty status for foreign-born residents (%)
Poverty among high school graduates not in families (%)
Poverty among people who did not graduate high school not in families (%)
Residents with income below the poverty level (%) - White
Residents with income below the poverty level (%) - Black or African American
Residents with income below the poverty level (%) - Asian
Residents with income below the poverty level (%) - Hispanic or Latino
Residents with income below the poverty level (%) - American Indian and Alaska Native
Residents with income below the poverty level (%) - Multirace
Residents with income below the poverty level (%) - Other Race
Air pollution - Air Quality Index (AQI)
Air pollution - CO
Air pollution - NO2
Air pollution - SO2
Air pollution - Ozone
Air pollution - PM10
Air pollution - PM25
Air pollution - Pb
Crime - Murders per 100,000 population
Crime - Rapes per 100,000 population
Crime - Robberies per 100,000 population
Crime - Assaults per 100,000 population
Crime - Burglaries per 100,000 population
Crime - Thefts per 100,000 population
Crime - Auto thefts per 100,000 population
Crime - Arson per 100,000 population
Crime - City-data.com crime index
Crime - Violent crime index
Crime - Property crime index
Crime - Murders per 100,000 population (5 year average)
Crime - Rapes per 100,000 population (5 year average)
Crime - Robberies per 100,000 population (5 year average)
Crime - Assaults per 100,000 population (5 year average)
Crime - Burglaries per 100,000 population (5 year average)
Crime - Thefts per 100,000 population (5 year average)
Crime - Auto thefts per 100,000 population (5 year average)
Crime - Arson per 100,000 population (5 year average)
Crime - City-data.com crime index (5 year average)
Crime - Violent crime index (5 year average)
Crime - Property crime index (5 year average)
1996 Presidential Elections Results (%) - Democratic Party (Clinton)
1996 Presidential Elections Results (%) - Republican Party (Dole)
1996 Presidential Elections Results (%) - Other
2000 Presidential Elections Results (%) - Democratic Party (Gore)
2000 Presidential Elections Results (%) - Republican Party (Bush)
2000 Presidential Elections Results (%) - Other
2004 Presidential Elections Results (%) - Democratic Party (Kerry)
2004 Presidential Elections Results (%) - Republican Party (Bush)
2004 Presidential Elections Results (%) - Other
2008 Presidential Elections Results (%) - Democratic Party (Obama)
2008 Presidential Elections Results (%) - Republican Party (McCain)
2008 Presidential Elections Results (%) - Other
2012 Presidential Elections Results (%) - Democratic Party (Obama)
2012 Presidential Elections Results (%) - Republican Party (Romney)
2012 Presidential Elections Results (%) - Other
2016 Presidential Elections Results (%) - Democratic Party (Clinton)
2016 Presidential Elections Results (%) - Republican Party (Trump)
2016 Presidential Elections Results (%) - Other
2020 Presidential Elections Results (%) - Democratic Party (Biden)
2020 Presidential Elections Results (%) - Republican Party (Trump)
2020 Presidential Elections Results (%) - Other
Ancestries Reported - Arab (%)
Ancestries Reported - Czech (%)
Ancestries Reported - Danish (%)
Ancestries Reported - Dutch (%)
Ancestries Reported - English (%)
Ancestries Reported - French (%)
Ancestries Reported - French Canadian (%)
Ancestries Reported - German (%)
Ancestries Reported - Greek (%)
Ancestries Reported - Hungarian (%)
Ancestries Reported - Irish (%)
Ancestries Reported - Italian (%)
Ancestries Reported - Lithuanian (%)
Ancestries Reported - Norwegian (%)
Ancestries Reported - Polish (%)
Ancestries Reported - Portuguese (%)
Ancestries Reported - Russian (%)
Ancestries Reported - Scotch-Irish (%)
Ancestries Reported - Scottish (%)
Ancestries Reported - Slovak (%)
Ancestries Reported - Subsaharan African (%)
Ancestries Reported - Swedish (%)
Ancestries Reported - Swiss (%)
Ancestries Reported - Ukrainian (%)
Ancestries Reported - United States (%)
Ancestries Reported - Welsh (%)
Ancestries Reported - West Indian (%)
Ancestries Reported - Other (%)
Educational Attainment - No schooling completed (%)
Educational Attainment - Less than high school (%)
Educational Attainment - High school or equivalent (%)
Educational Attainment - Less than 1 year of college (%)
Educational Attainment - 1 or more years of college (%)
Educational Attainment - Associate degree (%)
Educational Attainment - Bachelor's degree (%)
Educational Attainment - Master's degree (%)
Educational Attainment - Professional school degree (%)
Educational Attainment - Doctorate degree (%)
School Enrollment - Nursery, preschool (%)
School Enrollment - Kindergarten (%)
School Enrollment - Grade 1 to 4 (%)
School Enrollment - Grade 5 to 8 (%)
School Enrollment - Grade 9 to 12 (%)
School Enrollment - College undergrad (%)
School Enrollment - Graduate or professional (%)
School Enrollment - Not enrolled in school (%)
School enrollment - Public schools (%)
School enrollment - Private schools (%)
School enrollment - Not enrolled (%)
Median number of rooms in houses and condos
Median number of rooms in apartments
Housing units lacking complete plumbing facilities (%)
Housing units lacking complete kitchen facilities (%)
Density of houses
Urban houses (%)
Rural houses (%)
Households with people 60 years and over (%)
Households with people 65 years and over (%)
Households with people 75 years and over (%)
Households with one or more nonrelatives (%)
Households with no nonrelatives (%)
Population in households (%)
Family households (%)
Nonfamily households (%)
Population in families (%)
Family households with own children (%)
Median number of bedrooms in owner occupied houses
Mean number of bedrooms in owner occupied houses
Median number of bedrooms in renter occupied houses
Mean number of bedrooms in renter occupied houses
Median number of vehichles in owner occupied houses
Mean number of vehichles in owner occupied houses
Median number of vehichles in renter occupied houses
Mean number of vehichles in renter occupied houses
Mortgage status - with mortgage (%)
Mortgage status - with second mortgage (%)
Mortgage status - with home equity loan (%)
Mortgage status - with both second mortgage and home equity loan (%)
Mortgage status - without a mortgage (%)
Average family size
Average family size - White
Average family size - Black or African American
Average family size - Asian
Average family size - Hispanic or Latino
Average family size - American Indian and Alaska Native
Average family size - Multirace
Average family size - Other Race
Geographical mobility - Same house 1 year ago (%)
Geographical mobility - Moved within same county (%)
Geographical mobility - Moved from different county within same state (%)
Geographical mobility - Moved from different state (%)
Geographical mobility - Moved from abroad (%)
Place of birth - Born in state of residence (%)
Place of birth - Born in other state (%)
Place of birth - Native, outside of US (%)
Place of birth - Foreign born (%)
Housing units in structures - 1, detached (%)
Housing units in structures - 1, attached (%)
Housing units in structures - 2 (%)
Housing units in structures - 3 or 4 (%)
Housing units in structures - 5 to 9 (%)
Housing units in structures - 10 to 19 (%)
Housing units in structures - 20 to 49 (%)
Housing units in structures - 50 or more (%)
Housing units in structures - Mobile home (%)
Housing units in structures - Boat, RV, van, etc. (%)
House/condo owner moved in on average (years ago)
Renter moved in on average (years ago)
Year householder moved into unit - Moved in 1999 to March 2000 (%)
Year householder moved into unit - Moved in 1995 to 1998 (%)
Year householder moved into unit - Moved in 1990 to 1994 (%)
Year householder moved into unit - Moved in 1980 to 1989 (%)
Year householder moved into unit - Moved in 1970 to 1979 (%)
Year householder moved into unit - Moved in 1969 or earlier (%)
Means of transportation to work - Drove car alone (%)
Means of transportation to work - Carpooled (%)
Means of transportation to work - Public transportation (%)
Means of transportation to work - Bus or trolley bus (%)
Means of transportation to work - Streetcar or trolley car (%)
Means of transportation to work - Subway or elevated (%)
Means of transportation to work - Railroad (%)
Means of transportation to work - Ferryboat (%)
Means of transportation to work - Taxicab (%)
Means of transportation to work - Motorcycle (%)
Means of transportation to work - Bicycle (%)
Means of transportation to work - Walked (%)
Means of transportation to work - Other means (%)
Working at home (%)
Industry diversity
Most Common Industries - Agriculture, forestry, fishing and hunting, and mining (%)
Most Common Industries - Agriculture, forestry, fishing and hunting (%)
Most Common Industries - Mining, quarrying, and oil and gas extraction (%)
Most Common Industries - Construction (%)
Most Common Industries - Manufacturing (%)
Most Common Industries - Wholesale trade (%)
Most Common Industries - Retail trade (%)
Most Common Industries - Transportation and warehousing, and utilities (%)
Most Common Industries - Transportation and warehousing (%)
Most Common Industries - Utilities (%)
Most Common Industries - Information (%)
Most Common Industries - Finance and insurance, and real estate and rental and leasing (%)
Most Common Industries - Finance and insurance (%)
Most Common Industries - Real estate and rental and leasing (%)
Most Common Industries - Professional, scientific, and management, and administrative and waste management services (%)
Most Common Industries - Professional, scientific, and technical services (%)
Most Common Industries - Management of companies and enterprises (%)
Most Common Industries - Administrative and support and waste management services (%)
Most Common Industries - Educational services, and health care and social assistance (%)
Most Common Industries - Educational services (%)
Most Common Industries - Health care and social assistance (%)
Most Common Industries - Arts, entertainment, and recreation, and accommodation and food services (%)
Most Common Industries - Arts, entertainment, and recreation (%)
Most Common Industries - Accommodation and food services (%)
Most Common Industries - Other services, except public administration (%)
Most Common Industries - Public administration (%)
Occupation diversity
Most Common Occupations - Management, business, science, and arts occupations (%)
Most Common Occupations - Management, business, and financial occupations (%)
Most Common Occupations - Management occupations (%)
Most Common Occupations - Business and financial operations occupations (%)
Most Common Occupations - Computer, engineering, and science occupations (%)
Most Common Occupations - Computer and mathematical occupations (%)
Most Common Occupations - Architecture and engineering occupations (%)
Most Common Occupations - Life, physical, and social science occupations (%)
Most Common Occupations - Education, legal, community service, arts, and media occupations (%)
Most Common Occupations - Community and social service occupations (%)
Most Common Occupations - Legal occupations (%)
Most Common Occupations - Education, training, and library occupations (%)
Most Common Occupations - Arts, design, entertainment, sports, and media occupations (%)
Most Common Occupations - Healthcare practitioners and technical occupations (%)
Most Common Occupations - Health diagnosing and treating practitioners and other technical occupations (%)
Most Common Occupations - Health technologists and technicians (%)
Most Common Occupations - Service occupations (%)
Most Common Occupations - Healthcare support occupations (%)
Most Common Occupations - Protective service occupations (%)
Most Common Occupations - Fire fighting and prevention, and other protective service workers including supervisors (%)
Most Common Occupations - Law enforcement workers including supervisors (%)
Most Common Occupations - Food preparation and serving related occupations (%)
Most Common Occupations - Building and grounds cleaning and maintenance occupations (%)
Most Common Occupations - Personal care and service occupations (%)
Most Common Occupations - Sales and office occupations (%)
Most Common Occupations - Sales and related occupations (%)
Most Common Occupations - Office and administrative support occupations (%)
Most Common Occupations - Natural resources, construction, and maintenance occupations (%)
Most Common Occupations - Farming, fishing, and forestry occupations (%)
Most Common Occupations - Construction and extraction occupations (%)
Most Common Occupations - Installation, maintenance, and repair occupations (%)
Most Common Occupations - Production, transportation, and material moving occupations (%)
Most Common Occupations - Production occupations (%)
Most Common Occupations - Transportation occupations (%)
Most Common Occupations - Material moving occupations (%)
People in Group quarters - Institutionalized population (%)
People in Group quarters - Correctional institutions (%)
People in Group quarters - Federal prisons and detention centers (%)
People in Group quarters - Halfway houses (%)
People in Group quarters - Local jails and other confinement facilities (including police lockups) (%)
People in Group quarters - Military disciplinary barracks (%)
People in Group quarters - State prisons (%)
People in Group quarters - Other types of correctional institutions (%)
People in Group quarters - Nursing homes (%)
People in Group quarters - Hospitals/wards, hospices, and schools for the handicapped (%)
People in Group quarters - Hospitals/wards and hospices for chronically ill (%)
People in Group quarters - Hospices or homes for chronically ill (%)
People in Group quarters - Military hospitals or wards for chronically ill (%)
People in Group quarters - Other hospitals or wards for chronically ill (%)
People in Group quarters - Hospitals or wards for drug/alcohol abuse (%)
People in Group quarters - Mental (Psychiatric) hospitals or wards (%)
People in Group quarters - Schools, hospitals, or wards for the mentally retarded (%)
People in Group quarters - Schools, hospitals, or wards for the physically handicapped (%)
People in Group quarters - Institutions for the deaf (%)
People in Group quarters - Institutions for the blind (%)
People in Group quarters - Orthopedic wards and institutions for the physically handicapped (%)
People in Group quarters - Wards in general hospitals for patients who have no usual home elsewhere (%)
People in Group quarters - Wards in military hospitals for patients who have no usual home elsewhere (%)
People in Group quarters - Juvenile institutions (%)
People in Group quarters - Long-term care (%)
People in Group quarters - Homes for abused, dependent, and neglected children (%)
People in Group quarters - Residential treatment centers for emotionally disturbed children (%)
People in Group quarters - Training schools for juvenile delinquents (%)
People in Group quarters - Short-term care, detention or diagnostic centers for delinquent children (%)
People in Group quarters - Type of juvenile institution unknown (%)
People in Group quarters - Noninstitutionalized population (%)
People in Group quarters - College dormitories (includes college quarters off campus) (%)
People in Group quarters - Military quarters (%)
People in Group quarters - On base (%)
People in Group quarters - Barracks, unaccompanied personnel housing (UPH), (Enlisted/Officer), ;and similar group living quarters for military personnel (%)
People in Group quarters - Transient quarters for temporary residents (%)
People in Group quarters - Military ships (%)
People in Group quarters - Group homes (%)
People in Group quarters - Homes or halfway houses for drug/alcohol abuse (%)
People in Group quarters - Homes for the mentally ill (%)
People in Group quarters - Homes for the mentally retarded (%)
People in Group quarters - Homes for the physically handicapped (%)
People in Group quarters - Other group homes (%)
People in Group quarters - Religious group quarters (%)
People in Group quarters - Dormitories (%)
People in Group quarters - Agriculture workers' dormitories on farms (%)
People in Group quarters - Job Corps and vocational training facilities (%)
People in Group quarters - Other workers' dormitories (%)
People in Group quarters - Crews of maritime vessels (%)
People in Group quarters - Other nonhousehold living situations (%)
People in Group quarters - Other noninstitutional group quarters (%)
Residents speaking English at home (%)
Residents speaking English at home - Born in the United States (%)
Residents speaking English at home - Native, born elsewhere (%)
Residents speaking English at home - Foreign born (%)
Residents speaking Spanish at home (%)
Residents speaking Spanish at home - Born in the United States (%)
Residents speaking Spanish at home - Native, born elsewhere (%)
Residents speaking Spanish at home - Foreign born (%)
Residents speaking other language at home (%)
Residents speaking other language at home - Born in the United States (%)
Residents speaking other language at home - Native, born elsewhere (%)
Residents speaking other language at home - Foreign born (%)
Class of Workers - Employee of private company (%)
Class of Workers - Self-employed in own incorporated business (%)
Class of Workers - Private not-for-profit wage and salary workers (%)
Class of Workers - Local government workers (%)
Class of Workers - State government workers (%)
Class of Workers - Federal government workers (%)
Class of Workers - Self-employed workers in own not incorporated business and Unpaid family workers (%)
House heating fuel used in houses and condos - Utility gas (%)
House heating fuel used in houses and condos - Bottled, tank, or LP gas (%)
House heating fuel used in houses and condos - Electricity (%)
House heating fuel used in houses and condos - Fuel oil, kerosene, etc. (%)
House heating fuel used in houses and condos - Coal or coke (%)
House heating fuel used in houses and condos - Wood (%)
House heating fuel used in houses and condos - Solar energy (%)
House heating fuel used in houses and condos - Other fuel (%)
House heating fuel used in houses and condos - No fuel used (%)
House heating fuel used in apartments - Utility gas (%)
House heating fuel used in apartments - Bottled, tank, or LP gas (%)
House heating fuel used in apartments - Electricity (%)
House heating fuel used in apartments - Fuel oil, kerosene, etc. (%)
House heating fuel used in apartments - Coal or coke (%)
House heating fuel used in apartments - Wood (%)
House heating fuel used in apartments - Solar energy (%)
House heating fuel used in apartments - Other fuel (%)
House heating fuel used in apartments - No fuel used (%)
Armed forces status - In Armed Forces (%)
Armed forces status - Civilian (%)
Armed forces status - Civilian - Veteran (%)
Armed forces status - Civilian - Nonveteran (%)
Fatal accidents locations in years 2005-2021
Fatal accidents locations in 2005
Fatal accidents locations in 2006
Fatal accidents locations in 2007
Fatal accidents locations in 2008
Fatal accidents locations in 2009
Fatal accidents locations in 2010
Fatal accidents locations in 2011
Fatal accidents locations in 2012
Fatal accidents locations in 2013
Fatal accidents locations in 2014
Fatal accidents locations in 2015
Fatal accidents locations in 2016
Fatal accidents locations in 2017
Fatal accidents locations in 2018
Fatal accidents locations in 2019
Fatal accidents locations in 2020
Fatal accidents locations in 2021
Alcohol use - People drinking some alcohol every month (%)
Alcohol use - People not drinking at all (%)
Alcohol use - Average days/month drinking alcohol
Alcohol use - Average drinks/week
Alcohol use - Average days/year people drink much
Audiometry - Average condition of hearing (%)
Audiometry - People that can hear a whisper from across a quiet room (%)
Audiometry - People that can hear normal voice from across a quiet room (%)
Audiometry - Ears ringing, roaring, buzzing (%)
Audiometry - Had a job exposure to loud noise (%)
Audiometry - Had off-work exposure to loud noise (%)
Blood Pressure & Cholesterol - Has high blood pressure (%)
Blood Pressure & Cholesterol - Checking blood pressure at home (%)
Blood Pressure & Cholesterol - Frequently checking blood cholesterol (%)
Blood Pressure & Cholesterol - Has high cholesterol level (%)
Consumer Behavior - Money monthly spent on food at supermarket/grocery store
Consumer Behavior - Money monthly spent on food at other stores
Consumer Behavior - Money monthly spent on eating out
Consumer Behavior - Money monthly spent on carryout/delivered foods
Consumer Behavior - Income spent on food at supermarket/grocery store (%)
Consumer Behavior - Income spent on food at other stores (%)
Consumer Behavior - Income spent on eating out (%)
Consumer Behavior - Income spent on carryout/delivered foods (%)
Current Health Status - General health condition (%)
Current Health Status - Blood donors (%)
Current Health Status - Has blood ever tested for HIV virus (%)
Current Health Status - Left-handed people (%)
Dermatology - People using sunscreen (%)
Diabetes - Diabetics (%)
Diabetes - Had a blood test for high blood sugar (%)
Diabetes - People taking insulin (%)
Diet Behavior & Nutrition - Diet health (%)
Diet Behavior & Nutrition - Milk product consumption (# of products/month)
Diet Behavior & Nutrition - Meals not home prepared (#/week)
Diet Behavior & Nutrition - Meals from fast food or pizza place (#/week)
Diet Behavior & Nutrition - Ready-to-eat foods (#/month)
Diet Behavior & Nutrition - Frozen meals/pizza (#/month)
Drug Use - People that ever used marijuana or hashish (%)
Drug Use - Ever used hard drugs (%)
Drug Use - Ever used any form of cocaine (%)
Drug Use - Ever used heroin (%)
Drug Use - Ever used methamphetamine (%)
Health Insurance - People covered by health insurance (%)
Kidney Conditions-Urology - Avg. # of times urinating at night
Medical Conditions - People with asthma (%)
Medical Conditions - People with anemia (%)
Medical Conditions - People with psoriasis (%)
Medical Conditions - People with overweight (%)
Medical Conditions - Elderly people having difficulties in thinking or remembering (%)
Medical Conditions - People who ever received blood transfusion (%)
Medical Conditions - People having trouble seeing even with glass/contacts (%)
Medical Conditions - People with arthritis (%)
Medical Conditions - People with gout (%)
Medical Conditions - People with congestive heart failure (%)
Medical Conditions - People with coronary heart disease (%)
Medical Conditions - People with angina pectoris (%)
Medical Conditions - People who ever had heart attack (%)
Medical Conditions - People who ever had stroke (%)
Medical Conditions - People with emphysema (%)
Medical Conditions - People with thyroid problem (%)
Medical Conditions - People with chronic bronchitis (%)
Medical Conditions - People with any liver condition (%)
Medical Conditions - People who ever had cancer or malignancy (%)
Mental Health - People who have little interest in doing things (%)
Mental Health - People feeling down, depressed, or hopeless (%)
Mental Health - People who have trouble sleeping or sleeping too much (%)
Mental Health - People feeling tired or having little energy (%)
Mental Health - People with poor appetite or overeating (%)
Mental Health - People feeling bad about themself (%)
Mental Health - People who have trouble concentrating on things (%)
Mental Health - People moving or speaking slowly or too fast (%)
Mental Health - People having thoughts they would be better off dead (%)
Oral Health - Average years since last visit a dentist
Oral Health - People embarrassed because of mouth (%)
Oral Health - People with gum disease (%)
Oral Health - General health of teeth and gums (%)
Oral Health - Average days a week using dental floss/device
Oral Health - Average days a week using mouthwash for dental problem
Oral Health - Average number of teeth
Pesticide Use - Households using pesticides to control insects (%)
Pesticide Use - Households using pesticides to kill weeds (%)
Physical Activity - People doing vigorous-intensity work activities (%)
Physical Activity - People doing moderate-intensity work activities (%)
Physical Activity - People walking or bicycling (%)
Physical Activity - People doing vigorous-intensity recreational activities (%)
Physical Activity - People doing moderate-intensity recreational activities (%)
Physical Activity - Average hours a day doing sedentary activities
Physical Activity - Average hours a day watching TV or videos
Physical Activity - Average hours a day using computer
Physical Functioning - People having limitations keeping them from working (%)
Physical Functioning - People limited in amount of work they can do (%)
Physical Functioning - People that need special equipment to walk (%)
Physical Functioning - People experiencing confusion/memory problems (%)
Physical Functioning - People requiring special healthcare equipment (%)
Prescription Medications - Average number of prescription medicines taking
Preventive Aspirin Use - Adults 40+ taking low-dose aspirin (%)
Reproductive Health - Vaginal deliveries (%)
Reproductive Health - Cesarean deliveries (%)
Reproductive Health - Deliveries resulted in a live birth (%)
Reproductive Health - Pregnancies resulted in a delivery (%)
Reproductive Health - Women breastfeeding newborns (%)
Reproductive Health - Women that had a hysterectomy (%)
Reproductive Health - Women that had both ovaries removed (%)
Reproductive Health - Women that have ever taken birth control pills (%)
Reproductive Health - Women taking birth control pills (%)
Reproductive Health - Women that have ever used Depo-Provera or injectables (%)
Reproductive Health - Women that have ever used female hormones (%)
Sexual Behavior - People 18+ that ever had sex (vaginal, anal, or oral) (%)
Sexual Behavior - Males 18+ that ever had vaginal sex with a woman (%)
Sexual Behavior - Males 18+ that ever performed oral sex on a woman (%)
Sexual Behavior - Males 18+ that ever had anal sex with a woman (%)
Sexual Behavior - Males 18+ that ever had any sex with a man (%)
Sexual Behavior - Females 18+ that ever had vaginal sex with a man (%)
Sexual Behavior - Females 18+ that ever performed oral sex on a man (%)
Sexual Behavior - Females 18+ that ever had anal sex with a man (%)
Sexual Behavior - Females 18+ that ever had any kind of sex with a woman (%)
Sexual Behavior - Average age people first had sex
Sexual Behavior - Average number of female sex partners in lifetime (males 18+)
Sexual Behavior - Average number of female vaginal sex partners in lifetime (males 18+)
Sexual Behavior - Average age people first performed oral sex on a woman (18+)
Sexual Behavior - Average number of woman performed oral sex on in lifetime (18+)
Sexual Behavior - Average number of male sex partners in lifetime (males 18+)
Sexual Behavior - Average number of male anal sex partners in lifetime (males 18+)
Sexual Behavior - Average age people first performed oral sex on a man (18+)
Sexual Behavior - Average number of male oral sex partners in lifetime (18+)
Sexual Behavior - People using protection when performing oral sex (%)
Sexual Behavior - Average number of times people have vaginal or anal sex a year
Sexual Behavior - People having sex without condom (%)
Sexual Behavior - Average number of male sex partners in lifetime (females 18+)
Sexual Behavior - Average number of male vaginal sex partners in lifetime (females 18+)
Sexual Behavior - Average number of female sex partners in lifetime (females 18+)
Sexual Behavior - Circumcised males 18+ (%)
Sleep Disorders - Average hours sleeping at night
Sleep Disorders - People that has trouble sleeping (%)
Smoking-Cigarette Use - People smoking cigarettes (%)
Taste & Smell - People 40+ having problems with smell (%)
Taste & Smell - People 40+ having problems with taste (%)
Taste & Smell - People 40+ that ever had wisdom teeth removed (%)
Taste & Smell - People 40+ that ever had tonsils teeth removed (%)
Taste & Smell - People 40+ that ever had a loss of consciousness because of a head injury (%)
Taste & Smell - People 40+ that ever had a broken nose or other serious injury to face or skull (%)
Taste & Smell - People 40+ that ever had two or more sinus infections (%)
Weight - Average height (inches)
Weight - Average weight (pounds)
Weight - Average BMI
Weight - People that are obese (%)
Weight - People that ever were obese (%)
Weight - People trying to lose weight (%)
100%
urban population.
Estimated median house/condo value in 2022: $557,470
98683:
$557,470Washington:
$569,500
According to our research of Washington and other state lists, there were 19 registered sex offenders living in 98683 zip code as of April 27, 2024 . The ratio of all residents to sex offenders in zip code 98683 is 1,797 to 1.The ratio of registered sex offenders to all residents in this zip code is lower than the state average.
Median resident age: This zip code:
43.1 yearsWashington median age:
38.4 years
Average household size: This zip code:
2.3 peopleWashington:
2.5 people
Averages for the 2020 tax year for zip code 98683, filed in 2021:
Average Adjusted Gross Income (AGI) in 2020: $86,047 (Individual Income Tax Returns) Here:
$86,047State:
$99,264
Salary/wage: $66,169 (reported on 76.6% of returns )Here:
$66,169State:
$80,347
(% of AGI for various income ranges: 1153.0% for AGIs below $25k , 3498.3% for AGIs $25k-50k , 6217.4% for AGIs $50k-75k , 9462.2% for AGIs $75k-100k , 17455.7% for AGIs $100k-200k , 68048.3% for AGIs over 200k ) Taxable interest for individuals: $2,715 (reported on 34.9% of returns )This zip code:
$2,715Washington:
$2,077
(% of AGI for various income ranges: 27.8% for AGIs below $25k , 30.7% for AGIs $25k-50k , 62.3% for AGIs $50k-75k , 87.2% for AGIs $75k-100k , 257.7% for AGIs $100k-200k , 2672.1% for AGIs over 200k ) Ordinary dividends: $9,883 (reported on 25.7% of returns )(% of AGI for various income ranges: 52.5% for AGIs below $25k , 71.1% for AGIs $25k-50k , 182.4% for AGIs $50k-75k , 272.1% for AGIs $75k-100k , 592.1% for AGIs $100k-200k , 7813.1% for AGIs over 200k ) Net capital gain/loss in AGI: +$23,216 (reported on 24.0% of returns )Here:
+$23,216State:
+$40,092
(% of AGI for various income ranges: 9.4% for AGIs below $25k , 52.5% for AGIs $25k-50k , 105.7% for AGIs $50k-75k , 232.6% for AGIs $75k-100k , 833.5% for AGIs $100k-200k , 25205.5% for AGIs over 200k ) Profit/loss from business: +$15,819 (reported on 13.2% of returns )Here:
+$15,819State:
+$18,312
(% of AGI for various income ranges: 109.6% for AGIs below $25k , 143.2% for AGIs $25k-50k , 275.8% for AGIs $50k-75k , 351.8% for AGIs $75k-100k , 550.5% for AGIs $100k-200k , 3230.3% for AGIs over 200k ) Taxable individual retirement arrangement distribution: $24,728 (reported on 12.6% of returns )98683:
$24,728Washington:
$24,221
(% of AGI for various income ranges: 93.9% for AGIs below $25k , 129.5% for AGIs $25k-50k , 311.8% for AGIs $50k-75k , 600.7% for AGIs $75k-100k , 1149.5% for AGIs $100k-200k , 4872.1% for AGIs over 200k ) Self-employed (Keogh) retirement plans: $16,738 (reported on 0.5% of returns )98683:
$16,738Washington:
$24,166
(% of AGI for various income ranges: 6.1% for AGIs below $25k , 23.3% for AGIs $100k-200k , 270.0% for AGIs over 200k ) Total itemized deductions: $34,657 (reported on 11.2% of returns )Here:
$34,657State:
$39,068
(% of AGI for various income ranges: 104.2% for AGIs below $25k , 127.1% for AGIs $25k-50k , 399.2% for AGIs $50k-75k , 681.5% for AGIs $75k-100k , 1129.5% for AGIs $100k-200k , 8303.1% for AGIs over 200k ) Charity contributions: $12,223 (reported on 8.7% of returns )Here:
$12,223State:
$15,331
(% of AGI for various income ranges: 7.0% for AGIs below $25k , 11.5% for AGIs $25k-50k , 50.2% for AGIs $50k-75k , 91.4% for AGIs $75k-100k , 271.8% for AGIs $100k-200k , 3697.2% for AGIs over 200k ) Taxes paid: $7,041 (reported on 11.0% of returns )(% of AGI for various income ranges: 16.2% for AGIs below $25k , 23.3% for AGIs $25k-50k , 85.2% for AGIs $50k-75k , 182.4% for AGIs $75k-100k , 270.3% for AGIs $100k-200k , 1254.5% for AGIs over 200k ) Earned income credit: $1,996 (reported on 9.0% of returns )(% of AGI for various income ranges: 58.5% for AGIs below $25k , 43.3% for AGIs $25k-50k , 0.6% for AGIs $50k-75k ) Percentage of individuals using paid preparers for their 2020 taxes: 92.2%(% for various income ranges: 90.6% for AGIs below $25k , 92.6% for AGIs $25k-50k , 92.1% for AGIs $50k-75k , 92.7% for AGIs $75k-100k , 93.2% for AGIs $100k-200k , 93.1% for AGIs over 200k )
Averages for the 2012 tax year for zip code 98683, filed in 2013:
Average Adjusted Gross Income (AGI) in 2012: $67,184 (Individual Income Tax Returns) Here:
$67,184State:
$69,533
Salary/wage: $54,721 (reported on 78.8% of returns )Here:
$54,721State:
$57,267
(% of AGI for various income ranges: 71.0% for AGIs below $25k , 74.2% for AGIs $25k-50k , 72.6% for AGIs $50k-75k , 71.3% for AGIs $75k-100k , 72.9% for AGIs $100k-200k , 38.6% for AGIs over 200k ) Taxable interest for individuals: $2,455 (reported on 37.5% of returns )This zip code:
$2,455Washington:
$1,816
(% of AGI for various income ranges: 1.5% for AGIs below $25k , 0.9% for AGIs $25k-50k , 0.9% for AGIs $50k-75k , 1.0% for AGIs $75k-100k , 0.9% for AGIs $100k-200k , 2.5% for AGIs over 200k ) Ordinary dividends: $7,891 (reported on 24.6% of returns )(% of AGI for various income ranges: 2.9% for AGIs below $25k , 1.6% for AGIs $25k-50k , 1.8% for AGIs $50k-75k , 1.9% for AGIs $75k-100k , 2.3% for AGIs $100k-200k , 5.5% for AGIs over 200k ) Net capital gain/loss in AGI: +$19,215 (reported on 21.4% of returns )Here:
+$19,215State:
+$21,568
(% of AGI for various income ranges: 0.4% for AGIs $50k-75k , 0.9% for AGIs $75k-100k , 2.0% for AGIs $100k-200k , 21.9% for AGIs over 200k ) Profit/loss from business: +$12,344 (reported on 12.2% of returns )Here:
+$12,344State:
+$16,521
(% of AGI for various income ranges: 5.5% for AGIs below $25k , 2.5% for AGIs $25k-50k , 2.5% for AGIs $50k-75k , 2.1% for AGIs $75k-100k , 1.7% for AGIs $100k-200k , 1.9% for AGIs over 200k ) Taxable individual retirement arrangement distribution: $18,089 (reported on 14.2% of returns )98683:
$18,089Washington:
$18,648
(% of AGI for various income ranges: 4.3% for AGIs below $25k , 3.6% for AGIs $25k-50k , 4.0% for AGIs $50k-75k , 4.2% for AGIs $75k-100k , 4.3% for AGIs $100k-200k , 2.9% for AGIs over 200k ) Self-employment retirement plans: $14,133 (reported on 0.4% of returns )98683:
$14,133Washington:
$20,087
Total itemized deductions: $22,763 (20% of AGI, reported on 38.8% of returns )Here:
$22,763State:
$23,872
Here:
20.1% of AGIState:
18.2% of AGI
(% of AGI for various income ranges: 14.4% for AGIs below $25k , 11.7% for AGIs $25k-50k , 14.5% for AGIs $50k-75k , 15.6% for AGIs $75k-100k , 14.2% for AGIs $100k-200k , 10.1% for AGIs over 200k ) Charity contributions: $4,050 (reported on 32.6% of returns )(% of AGI for various income ranges: 1.1% for AGIs below $25k , 1.3% for AGIs $25k-50k , 1.7% for AGIs $50k-75k , 2.1% for AGIs $75k-100k , 2.2% for AGIs $100k-200k , 2.4% for AGIs over 200k ) Taxes paid: $7,317 (reported on 38.2% of returns )(% of AGI for various income ranges: 2.6% for AGIs below $25k , 2.6% for AGIs $25k-50k , 4.0% for AGIs $50k-75k , 4.7% for AGIs $75k-100k , 4.9% for AGIs $100k-200k , 4.3% for AGIs over 200k ) Earned income credit: $2,202 (reported on 13.1% of returns )(% of AGI for various income ranges: 5.1% for AGIs below $25k , 0.9% for AGIs $25k-50k ) Percentage of individuals using paid preparers for their 2012 taxes: 44.0%(% for various income ranges: 37.1% for AGIs below $25k , 42.0% for AGIs $25k-50k , 46.7% for AGIs $50k-75k , 47.3% for AGIs $75k-100k , 51.0% for AGIs $100k-200k , 70.0% for AGIs over 200k )
Averages for the 2004 tax year for zip code 98683, filed in 2005:
Average Adjusted Gross Income (AGI) in 2004: $59,164 (Individual Income Tax Returns) Here:
$59,164State:
$54,331
Salary/wage: $49,317 (reported on 81.2% of returns )Here:
$49,317State:
$45,761
(% of AGI for various income ranges: 172.1% for AGIs below $10k , 72.0% for AGIs $10k-25k , 78.2% for AGIs $25k-50k , 77.0% for AGIs $50k-75k , 78.3% for AGIs $75k-100k , 54.3% for AGIs over 100k ) Taxable interest for individuals: $3,032 (reported on 49.0% of returns )This zip code:
$3,032Washington:
$2,110
(% of AGI for various income ranges: 14.1% for AGIs below $10k , 3.4% for AGIs $10k-25k , 2.1% for AGIs $25k-50k , 1.5% for AGIs $50k-75k , 1.5% for AGIs $75k-100k , 3.1% for AGIs over 100k ) Taxable dividends: $4,226 (reported on 29.8% of returns )(% of AGI for various income ranges: 9.5% for AGIs below $10k , 2.5% for AGIs $10k-25k , 1.9% for AGIs $25k-50k , 1.5% for AGIs $50k-75k , 1.7% for AGIs $75k-100k , 2.5% for AGIs over 100k ) Net capital gain/loss: +$13,142 (reported on 26.3% of returns )Here:
+$13,142State:
+$15,835
(% of AGI for various income ranges: -6.5% for AGIs below $10k , -0.8% for AGIs $10k-25k , 0.6% for AGIs $25k-50k , 0.8% for AGIs $50k-75k , 1.6% for AGIs $75k-100k , 12.4% for AGIs over 100k ) Profit/loss from business: +$11,861 (reported on 13.3% of returns )Here:
+$11,861State:
+$13,994
(% of AGI for various income ranges: 1.5% for AGIs below $10k , 4.1% for AGIs $10k-25k , 2.5% for AGIs $25k-50k , 1.9% for AGIs $50k-75k , 1.8% for AGIs $75k-100k , 3.2% for AGIs over 100k ) IRA payment deduction: $3,184 (reported on 2.6% of returns )98683:
$3,184Washington:
$3,001
(% of AGI for various income ranges: 0.2% for AGIs $10k-25k , 0.3% for AGIs $25k-50k , 0.2% for AGIs $50k-75k , 0.1% for AGIs $75k-100k , 0.1% for AGIs over 100k ) Self-employed pension: $13,316 (reported on 0.8% of returns )Here:
$13,316Washington:
$14,244
(% of AGI for various income ranges: 0.1% for AGIs $25k-50k , 0.1% for AGIs $50k-75k , 0.1% for AGIs $75k-100k , 0.3% for AGIs over 100k ) Total itemized deductions: $19,694 (22% of AGI, reported on 45.9% of returns )Here:
$19,694State:
$19,669
Here:
21.6% of AGIState:
20.7% of AGI
(% of AGI for various income ranges: 44.5% for AGIs below $10k , 15.2% for AGIs $10k-25k , 15.8% for AGIs $25k-50k , 18.5% for AGIs $50k-75k , 17.8% for AGIs $75k-100k , 12.5% for AGIs over 100k ) Charity contributions deductions: $3,559 (4% of AGI, reported on 40.5% of returns )Here:
3.7% of AGIState:
3.5% of AGI
(% of AGI for various income ranges: 2.4% for AGIs below $10k , 1.4% for AGIs $10k-25k , 1.7% for AGIs $25k-50k , 2.3% for AGIs $50k-75k , 2.3% for AGIs $75k-100k , 2.9% for AGIs over 100k ) Total tax: $9,592 (reported on 80.4% of returns )(% of AGI for various income ranges: 4.8% for AGIs below $10k , 4.2% for AGIs $10k-25k , 6.9% for AGIs $25k-50k , 8.7% for AGIs $50k-75k , 10.2% for AGIs $75k-100k , 19.4% for AGIs over 100k ) Earned income credit: $1,645 (reported on 10.5% of returns )Percentage of individuals using paid preparers for their 2004 taxes: 51.6%(% for various income ranges: 44.0% for AGIs below $10k , 51.5% for AGIs $10k-25k , 49.7% for AGIs $25k-50k , 54.1% for AGIs $50k-75k , 50.5% for AGIs $75k-100k , 61.9% for AGIs over 100k )
Estimated median household income in 2022: This zip code:
$81,825Washington:
$91,306
Nearest zip codes: 98684 ,
97230 ,
98664 ,
97220 ,
98682 ,
97024 .
Vancouver Zip Code Map
Percentage of family households: This zip code:
40.0%Washington:
45.0%
Percentage of households with unmarried partners: This zip code:
7.6%Washington:
48.7%
Likely homosexual households (counted as self-reported same-sex unmarried-partner households)
Lesbian couples: 0.2% of all households Gay men: 0.1% of all households
Household received Food Stamps/SNAP in the past 12 months: 1,221Household did not receive Food Stamps/SNAP in the past 12 months: 12,590
Women who had a birth in the past 12 months: 340 (252 now married , 85 unmarried) Women who did not have a birth in the past 12 months: 6,638 (2,798 now married , 3,844 unmarried)
Housing units in zip code 98683 with a mortgage: 4,789 (500
second mortgage , 472
both second mortgage and home equity loan )
Houses without a mortgage: 135
Median monthly owner costs for units with a mortgage: $2,032
Median monthly owner costs for units without a mortgage: $630
Residents with income below the poverty level in 2022:
This zip code:
11.4%Whole state:
10.0%
Residents with income below 50% of the poverty level in 2022:
This zip code:
5.0%Whole state:
4.6%
Median number of rooms in houses and condos: Median number of rooms in apartments:
Year house built (houses)
63 2020 or later1,056 2010 to 20192,115 2000 to 20094,513 1990 to 19993,090 1980 to 19892,277 1970 to 1979236 1960 to 1969181 1950 to 1959166 1940 to 1949197 1939 or earlier
Zip code 98683 household income distribution in 2022 876 Less than $10,000390 $10,000 to $14,999165 $15,000 to $19,999258 $20,000 to $24,999270 $25,000 to $29,999271 $30,000 to $34,999434 $35,000 to $39,999341 $40,000 to $44,999520 $45,000 to $49,9991,250 $50,000 to $59,9991,475 $60,000 to $74,9992,096 $75,000 to $99,9991,656 $100,000 to $124,9991,359 $125,000 to $149,9991,190 $150,000 to $199,9991,256 $200,000 or moreEstimate of home value of owner-occupied houses/condos in 2022 in zip code 98683 36 Less than $10,00010 $20,000 to $24,9998 $35,000 to $39,99949 $40,000 to $49,99922 $60,000 to $69,99914 $80,000 to $89,9996 $90,000 to $99,99929 $100,000 to $124,99918 $125,000 to $149,99938 $150,000 to $174,99920 $175,000 to $199,99975 $200,000 to $249,999110 $250,000 to $299,9991,239 $300,000 to $399,9992,358 $400,000 to $499,9993,126 $500,000 to $749,999353 $750,000 to $999,99977 $1,000,000 to $1,499,99974 $2,000,000 or moreRent paid by renters in 2022 in zip code 98683 6 $250 to $29911 $400 to $44910 $550 to $59915 $600 to $64914 $750 to $799114 $800 to $89935 $900 to $999996 $1,000 to $1,2491,421 $1,250 to $1,4992,578 $1,500 to $1,999387 $2,000 to $2,49990 $2,500 to $2,999159 $3,000 to $3,499126 $3,500 or more229 No cash rent
Median gross rent in 2022: $1,717.
Median price asked for vacant for-sale houses and condos in 2022: $687,313.
Estimated median house (or condo) value in 2022 for: White Non-Hispanic householders: $574,071Black or African American householders: $617,566American Indian or Alaska Native householders: $523,935Asian householders: $579,383Some other race householders: $485,752Two or more races householders: $560,790Hispanic or Latino householders: $522,607Estimated median house or condo value in 2022: $557,470
98683:
$557,470Washington:
$569,500
Lower value quartile - upper value quartile: $457,182 - $691,484
Mean price in 2022: Detached houses: $585,359Here:
$585,359State:
$734,307
Townhouses or other attached units: $426,226Here:
$426,226State:
$657,697
In 3-to-4-unit structures: $343,630Here:
$343,630State:
$510,239
In 5-or-more-unit structures: $341,013Here:
$341,013State:
$503,183
Mobile homes: $134,161Here:
$134,161State:
$218,362
Housing units in structures:
One, detached: 8,156One, attached: 835Two: 2053 or 4: 7675 to 9: 1,52710 to 19: 83320 to 49: 32550 or more: 1,604Mobile homes: 219Unemployment : 4.8%
Means of transportation to work in zip code 98683 63.8% 9,586 Drove a car alone7.6% 1,148 Carpooled1.6% 236 Bus or trolley bus0.2% 23 Streetcar or trolley car0.5% 68 Railroad0.3% 42 Motorcycle0.2% 30 Bicycle1.8% 270 Walked1.1% 163 Other means24.8% 3,722 Worked at homeTravel time to work (commute) in zip code 98683 338 Less than 5 minutes1,403 5 to 9 minutes1,395 10 to 14 minutes2,195 15 to 19 minutes1,598 20 to 24 minutes899 25 to 29 minutes1,593 30 to 34 minutes353 35 to 39 minutes383 40 to 44 minutes647 45 to 59 minutes382 60 to 89 minutes305 90 or more minutes
Neighborhoods in zip code 98683: Percentage of zip code residents living and working in this county: 69.8%
Household type by relationship:
Households: 31,902
Male householders: 6,760 (1,651 living alone ), Female householders: 7,069 (2,650 living alone )6,178 spouses (5,926 opposite-sex spouses ), 1,462 unmarried partners , (1,378 opposite-sex unmarried partners ), 7,759 children (7,284 natural , 37 adopted , 445 stepchildren ), 302 grandchildren , 215 brothers or sisters , 434 parents , 15 foster children , 268 other relatives , 1,105 non-relatives In group quarters: 435 (-1 institutionalized population )
Size of family households: 4,104 2-persons , 1,977 3-persons , 1,186 4-persons , 459 5-persons , 288 6-persons , 127 7-or-more-persons
Size of nonfamily households: 4,301 1-person , 1,362 2-persons , 64 3-persons , 5 4-persons
3,981 married couples with children. single-parent households (518 men , 1,044 women ).
79.7% of residents of 98683 zip code speak English at home. of residents speak Spanish at home (62% very well, 17% well, 15% not well, 6% not at all ).of residents speak other Indo-European language at home (54% very well, 29% well, 14% not well, 3% not at all ).of residents speak Asian or Pacific Island language at home (51% very well, 20% well, 25% not well, 4% not at all ).of residents speak other language at home (72% very well, 20% well, 4% not well, 3% not at all ).
Foreign born population: 4,885 (15.3%)
(61.8%
of them are naturalized citizens )
This zip code:
15.3%Whole state:
15.3%
20% Honduras 8% Bhutan 5% Japan 5% Hong Kong 4% Serbia 3% China, excluding Hong Kong and Taiwan 3% Malaysia 8% German 7% English 7% American 5% Irish 4% European 3% Swedish 2% Italian
Year of entry for the foreign-born population
1,286 2010 or later 1,210 2000 to 2009 989 1990 to 1999 1,734 Before 1990
There are
263 Other Medical Specialists in Zip Code 98683.
Facilities with environmental interests located in this zip code:
COLUMBIA VISTA CORP (18637 SE EVERGREEN HWY in VANCOUVER, WA)
COMPLIANCE ACTIVITY (Tracking inspections of insecticide, fungicide, and rodenticide, and toxic substances) PERFORMANCE TRACK (National Environmental Performance Track) National Pollutant Discharge Elimination System NON-MAJOR (Tracking pollutant discharge elimination systems) - permit STATE MASTER (Washington State Department of Ecology's Facility/Site identification system) - TOXICS-7507, UNDERGROUND STORAGE TANK PROGRAM, WATQUAL-SO3002161, NPDES STORMWATER PERMIT Business SIC classification: WOOD PRODUCTS
CHEVRON 204998 (16406 SE 26TH ST in VANCOUVER, WA)
(Resource Conservation and Recovery Act (tracking hazardous waste)) STATE MASTER (Washington State Department of Ecology's Facility/Site identification system) - TOXICS-400466, UNDERGROUND STORAGE TANK PROGRAM, HAZWASTE-WAH000017236, HAZARDOUS WASTE PROGRAM Business SIC classification: GASOLINE SERVICE STATIONSOrganizations: CHEVRON PRODUCTS CO (CONTACT/OWNER)
Alternative names: FISHERS LANDING CHEVRON & CAR WASH
500 FT W 19909 SE EVERGREEN HWY (19909 SE EVERGREEN HWY in VANCOUVER, WA)
(Resource Conservation and Recovery Act (tracking hazardous waste)) Organizations: WA ECY (CONTACT/OWNER)
Housing units lacking complete plumbing facilities: 0.4%
Housing units lacking complete kitchen facilities: 3.7%
58.0% Electricity 40.5% Utility gas 0.6% Wood
Place of birth for U.S.-born residents:
This state: 7,178Northeast: 1,763Midwest: 2,433South: 1,658West: 13,564
34% of the 98683 zip code residents lived in the same house 5 years ago.
Out of people who lived in different houses, 43% lived in this county.
Out of people who lived in different counties, 50% lived in Washington.
82% of the 98683 zip code residents lived in the same house 1 year ago.
Out of people who lived in different houses, 44% moved from this county.
Out of people who lived in different houses, 7% moved from different county within same state.
Out of people who lived in different houses, 46% moved from different state.
Out of people who lived in different houses, 4% moved from abroad.
Private vs. public school enrollment:
Students in private schools in grades 1 to 8 (elementary and middle school): 398
Here:
14.4%Washington:
12.4%
Students in private schools in grades 9 to 12 (high school): 39
Students in private undergraduate colleges: 215
Here:
22.4%Washington:
16.5%
Occupation by median earnings in the past 12 months ($)
124,105 Legal occupations 113,895 Architecture and engineering occupations 81,547 Computer and mathematical occupations 76,520 Management occupations 75,401 Health diagnosing and treating practitioners and other technical occupations 69,810 Law enforcement workers including supervisors
Companies with federal contracts located in this zip code:
MICRO SHARP INC (1201 SE TECH CENTER DRIVE in VANCOUVER, WA; small business)
$33,971 with Navy for ADP Central Processing Unit (CPU, Computer), Analog. Signed on 2001-09-24. Completion date: 2001-09-30.
UMD TECHNOLOGY INC (1499 SE TECH CTR PL STE 14 in VANCOUVER, WA; small business)
$6,600 with Navy for Other Professional Services. Signed on 2006-04-19. Completion date: 2006-05-19.
C A E S Y EDUCATION SYSTEMS, (1201 SE TECH CENTER DR #11 in VANCOUVER, WA; small business)
$4,999 with Air Force for ADPE System Configuration. Taking place in SC. Signed on 2003-09-29. Completion date: 2003-10-20.
Top industries in this zip code by the number of employees in 2005:
Professional, Scientific, and Technical Services: Research and Development in the Physical, Engineering, and Life Sciences (over 1000 employees: 1 establishment)Accommodation and Food Services: Full-Service Restaurants (100-249: 1, 50-99: 3, 20-49: 4, 10-19: 1, 5-9: 2, 1-4: 9)Finance and Insurance: Real Estate Credit (250-499: 1, 20-49: 2, 10-19: 1, 5-9: 1, 1-4: 4)Administrative and Support and Waste Management and Remediation Services: Temporary Help Services (250-499: 1, 50-99: 1, 5-9: 1, 1-4: 2)Management of Companies and Enterprises: Corporate, Subsidiary, and Regional Managing Offices (250-499: 1, 50-99: 1, 1-4: 2)Health Care and Social Assistance: Offices of Dentists (100-249: 1, 20-49: 1, 10-19: 10, 5-9: 10, 1-4: 7)Accommodation and Food Services: Limited-Service Restaurants (50-99: 1, 20-49: 5, 10-19: 2, 5-9: 2, 1-4: 2)Arts, Entertainment, and Recreation: Fitness and Recreational Sports Centers (50-99: 2, 20-49: 2, 10-19: 2, 5-9: 2, 1-4: 1)Health Care and Social Assistance: Home Health Care Services (100-249: 1, 50-99: 1, 1-4: 1)
People in group quarters in 2010:
115 people in group homes intended for adults
70 people in workers' group living quarters and job corps centers
31 people in nursing facilities/skilled-nursing facilities
People in group quarters in 2000:
161 people in nursing homes
23 people in other noninstitutional group quarters
3 people in schools, hospitals, or wards for the intellectually disabled
Fatal accident statistics in 2014:
Fatal accident count: 1Vehicles involved in fatal accidents: 1Fatal accidents caused by drunken drivers: 1Fatalities: 1Persons involved in fatal accidents: 6Pedestrians involved in fatal accidents: 0
Fatal accident statistics in 2013:
Fatal accident count: 2Vehicles involved in fatal accidents: 2Fatal accidents caused by drunken drivers: 1Fatalities: 3Persons involved in fatal accidents: 4Pedestrians involved in fatal accidents: 0
Home Mortgage Disclosure Act Aggregated Statistics For Year 2009(Based on 4 full and 8 partial tracts) A) FHA, FSA/RHS & VA B) Conventional C) Refinancings D) Home Improvement Loans E) Loans on Dwellings For 5+ Families F) Non-occupant Loans on G) Loans On Manufactured Number Average Value Number Average Value Number Average Value Number Average Value Number Average Value Number Average Value Number Average Value
LOANS ORIGINATED 222 $218,096 265 $209,295 1,493 $203,803 41 $140,707 0 $0 92 $166,179 7 $72,736 APPLICATIONS APPROVED, NOT ACCEPTED 5 $205,422 32 $155,525 179 $215,056 5 $139,892 0 $0 17 $162,765 5 $70,886 APPLICATIONS DENIED 25 $200,502 46 $198,478 426 $223,645 19 $76,368 0 $0 27 $218,883 9 $69,753 APPLICATIONS WITHDRAWN 26 $197,340 40 $283,028 270 $230,564 10 $101,477 1 $266,560 17 $177,236 0 $0 FILES CLOSED FOR INCOMPLETENESS 4 $225,112 8 $240,439 54 $223,960 1 $139,630 0 $0 0 $0 0 $0
Aggregated Statistics For Year 2008(Based on 4 full and 8 partial tracts) A) FHA, FSA/RHS & VA B) Conventional C) Refinancings D) Home Improvement Loans F) Non-occupant Loans on G) Loans On Manufactured Number Average Value Number Average Value Number Average Value Number Average Value Number Average Value Number Average Value
LOANS ORIGINATED 140 $250,679 363 $259,542 810 $219,516 56 $92,982 81 $187,640 1 $25,390 APPLICATIONS APPROVED, NOT ACCEPTED 13 $246,425 49 $236,296 198 $233,376 14 $48,260 20 $251,320 1 $108,100 APPLICATIONS DENIED 31 $260,639 63 $263,803 419 $241,879 50 $104,406 40 $235,422 11 $84,918 APPLICATIONS WITHDRAWN 18 $265,209 49 $279,989 223 $223,576 7 $90,544 18 $164,252 3 $36,777 FILES CLOSED FOR INCOMPLETENESS 1 $325,580 9 $285,464 39 $233,739 7 $101,280 4 $365,092 0 $0
Aggregated Statistics For Year 2007(Based on 4 full and 8 partial tracts) A) FHA, FSA/RHS & VA B) Conventional C) Refinancings D) Home Improvement Loans E) Loans on Dwellings For 5+ Families F) Non-occupant Loans on G) Loans On Manufactured Number Average Value Number Average Value Number Average Value Number Average Value Number Average Value Number Average Value Number Average Value
LOANS ORIGINATED 24 $251,497 861 $208,928 1,062 $209,607 103 $99,308 2 $6,331,440 176 $181,346 5 $84,880 APPLICATIONS APPROVED, NOT ACCEPTED 3 $272,257 144 $183,896 255 $224,993 23 $151,188 0 $0 26 $143,377 2 $70,300 APPLICATIONS DENIED 4 $240,472 200 $201,942 584 $243,048 79 $125,011 0 $0 54 $212,822 9 $31,001 APPLICATIONS WITHDRAWN 3 $183,987 123 $221,582 265 $270,161 27 $70,478 0 $0 30 $265,919 1 $635,900 FILES CLOSED FOR INCOMPLETENESS 1 $274,370 8 $279,160 46 $233,100 6 $136,693 0 $0 2 $145,940 0 $0
Aggregated Statistics For Year 2006(Based on 4 full and 8 partial tracts) A) FHA, FSA/RHS & VA B) Conventional C) Refinancings D) Home Improvement Loans E) Loans on Dwellings For 5+ Families F) Non-occupant Loans on G) Loans On Manufactured Number Average Value Number Average Value Number Average Value Number Average Value Number Average Value Number Average Value Number Average Value
LOANS ORIGINATED 45 $230,168 1,278 $182,519 1,355 $193,029 156 $98,748 8 $6,125,548 224 $172,714 1 $31,240 APPLICATIONS APPROVED, NOT ACCEPTED 0 $0 199 $163,938 267 $210,836 14 $84,614 0 $0 41 $174,768 4 $118,482 APPLICATIONS DENIED 4 $231,758 251 $175,187 552 $207,567 58 $80,438 0 $0 46 $188,934 7 $50,059 APPLICATIONS WITHDRAWN 4 $242,000 157 $194,134 294 $202,369 17 $98,343 0 $0 40 $177,887 0 $0 FILES CLOSED FOR INCOMPLETENESS 2 $214,915 27 $233,878 92 $213,563 2 $82,505 0 $0 5 $362,488 0 $0
Aggregated Statistics For Year 2005(Based on 4 full and 8 partial tracts) A) FHA, FSA/RHS & VA B) Conventional C) Refinancings D) Home Improvement Loans E) Loans on Dwellings For 5+ Families F) Non-occupant Loans on G) Loans On Manufactured Number Average Value Number Average Value Number Average Value Number Average Value Number Average Value Number Average Value Number Average Value
LOANS ORIGINATED 30 $247,902 1,735 $172,801 1,842 $179,335 142 $99,890 4 $1,881,080 376 $155,990 1 $41,010 APPLICATIONS APPROVED, NOT ACCEPTED 9 $189,126 276 $158,340 284 $172,088 22 $75,237 0 $0 41 $164,020 11 $44,251 APPLICATIONS DENIED 2 $254,260 312 $187,058 534 $197,578 69 $76,644 0 $0 78 $193,068 15 $50,725 APPLICATIONS WITHDRAWN 1 $264,530 248 $155,779 514 $181,330 49 $157,587 0 $0 46 $158,308 0 $0 FILES CLOSED FOR INCOMPLETENESS 0 $0 39 $145,651 187 $192,838 8 $82,484 0 $0 13 $120,262 0 $0
Aggregated Statistics For Year 2004(Based on 4 full and 8 partial tracts) A) FHA, FSA/RHS & VA B) Conventional C) Refinancings D) Home Improvement Loans E) Loans on Dwellings For 5+ Families F) Non-occupant Loans on G) Loans On Manufactured Number Average Value Number Average Value Number Average Value Number Average Value Number Average Value Number Average Value Number Average Value
LOANS ORIGINATED 76 $156,399 1,508 $160,543 1,480 $164,235 89 $70,812 6 $6,057,267 248 $149,043 5 $34,704 APPLICATIONS APPROVED, NOT ACCEPTED 9 $174,620 211 $172,102 273 $169,110 16 $71,146 0 $0 20 $151,988 2 $119,220 APPLICATIONS DENIED 28 $144,740 242 $134,554 555 $183,090 54 $36,708 0 $0 34 $127,910 11 $67,060 APPLICATIONS WITHDRAWN 11 $148,997 162 $181,990 448 $162,393 22 $27,625 0 $0 44 $110,553 1 $100,470 FILES CLOSED FOR INCOMPLETENESS 1 $184,410 23 $154,537 79 $226,193 9 $33,030 0 $0 4 $154,115 0 $0
Aggregated Statistics For Year 2003(Based on 4 full and 8 partial tracts) A) FHA, FSA/RHS & VA B) Conventional C) Refinancings D) Home Improvement Loans E) Loans on Dwellings For 5+ Families F) Non-occupant Loans on Number Average Value Number Average Value Number Average Value Number Average Value Number Average Value Number Average Value
LOANS ORIGINATED 171 $158,941 1,239 $152,469 3,994 $147,168 61 $33,218 4 $3,706,715 310 $118,573 APPLICATIONS APPROVED, NOT ACCEPTED 13 $163,977 126 $146,926 431 $150,811 6 $11,505 0 $0 30 $120,264 APPLICATIONS DENIED 23 $155,633 149 $128,581 668 $152,987 48 $35,154 0 $0 55 $106,064 APPLICATIONS WITHDRAWN 10 $152,412 110 $154,681 504 $152,853 9 $41,109 0 $0 24 $135,382 FILES CLOSED FOR INCOMPLETENESS 5 $136,190 26 $144,794 88 $170,823 4 $23,400 0 $0 5 $162,266
Aggregated Statistics For Year 2002(Based on 2 full and 2 partial tracts) A) FHA, FSA/RHS & VA B) Conventional C) Refinancings D) Home Improvement Loans F) Non-occupant Loans on Number Average Value Number Average Value Number Average Value Number Average Value Number Average Value
LOANS ORIGINATED 46 $169,262 330 $153,649 846 $168,828 24 $35,220 46 $145,929 APPLICATIONS APPROVED, NOT ACCEPTED 0 $0 29 $166,124 128 $153,191 2 $4,200 5 $141,924 APPLICATIONS DENIED 6 $147,170 22 $127,073 181 $147,391 17 $44,972 5 $127,986 APPLICATIONS WITHDRAWN 8 $114,842 42 $151,467 170 $165,518 2 $122,610 11 $93,143 FILES CLOSED FOR INCOMPLETENESS 0 $0 7 $131,320 40 $243,431 0 $0 0 $0
Aggregated Statistics For Year 2001(Based on 2 full and 2 partial tracts) A) FHA, FSA/RHS & VA B) Conventional C) Refinancings D) Home Improvement Loans E) Loans on Dwellings For 5+ Families F) Non-occupant Loans on Number Average Value Number Average Value Number Average Value Number Average Value Number Average Value Number Average Value
LOANS ORIGINATED 65 $152,512 280 $163,952 610 $152,014 28 $23,405 2 $4,138,260 30 $139,052 APPLICATIONS APPROVED, NOT ACCEPTED 5 $145,118 31 $132,742 93 $145,539 8 $40,518 0 $0 2 $63,060 APPLICATIONS DENIED 2 $135,210 29 $231,138 145 $134,883 22 $27,641 0 $0 8 $146,965 APPLICATIONS WITHDRAWN 11 $149,854 14 $430,827 97 $136,464 2 $1,091,740 2 $4,138,260 9 $134,714 FILES CLOSED FOR INCOMPLETENESS 2 $155,675 9 $78,181 16 $155,345 5 $156,202 0 $0 2 $152,720
Aggregated Statistics For Year 2000(Based on 2 full and 2 partial tracts) A) FHA, FSA/RHS & VA B) Conventional C) Refinancings D) Home Improvement Loans E) Loans on Dwellings For 5+ Families F) Non-occupant Loans on Number Average Value Number Average Value Number Average Value Number Average Value Number Average Value Number Average Value
LOANS ORIGINATED 72 $152,770 388 $154,612 126 $143,548 48 $34,807 2 $2,525,325 40 $187,486 APPLICATIONS APPROVED, NOT ACCEPTED 7 $149,741 58 $151,793 29 $92,012 8 $28,391 0 $0 13 $120,783 APPLICATIONS DENIED 15 $137,937 57 $116,661 104 $129,093 42 $23,360 0 $0 7 $124,129 APPLICATIONS WITHDRAWN 7 $130,197 35 $135,806 48 $149,534 7 $44,724 0 $0 5 $158,542 FILES CLOSED FOR INCOMPLETENESS 2 $117,250 11 $109,140 4 $70,472 0 $0 2 $4,138,260 2 $73,900
Aggregated Statistics For Year 1999(Based on 2 full and 2 partial tracts) A) FHA, FSA/RHS & VA B) Conventional C) Refinancings D) Home Improvement Loans E) Loans on Dwellings For 5+ Families F) Non-occupant Loans on Number Average Value Number Average Value Number Average Value Number Average Value Number Average Value Number Average Value
LOANS ORIGINATED 147 $143,288 565 $140,502 424 $153,006 62 $27,408 4 $2,894,782 95 $114,186 APPLICATIONS APPROVED, NOT ACCEPTED 12 $148,478 60 $157,856 73 $127,178 15 $17,312 0 $0 9 $116,053 APPLICATIONS DENIED 26 $140,496 89 $140,437 131 $169,161 31 $20,342 1 $3,441,340 8 $108,365 APPLICATIONS WITHDRAWN 12 $133,998 43 $156,970 93 $126,693 7 $22,737 2 $3,119,660 4 $99,558 FILES CLOSED FOR INCOMPLETENESS 3 $134,303 12 $131,298 26 $110,828 1 $43,180 0 $0 5 $99,002
Private Mortgage Insurance Companies Aggregated Statistics For Year 2009(Based on 4 full and 8 partial tracts) A) Conventional B) Refinancings C) Non-occupant Loans on Number Average Value Number Average Value Number Average Value
LOANS ORIGINATED 40 $222,508 29 $218,726 0 $0 APPLICATIONS APPROVED, NOT ACCEPTED 2 $301,685 18 $242,509 3 $231,053 APPLICATIONS DENIED 6 $196,905 5 $341,824 0 $0 APPLICATIONS WITHDRAWN 1 $198,210 4 $302,172 0 $0 FILES CLOSED FOR INCOMPLETENESS 4 $149,490 0 $0 0 $0
Aggregated Statistics For Year 2008(Based on 4 full and 8 partial tracts) A) Conventional B) Refinancings C) Non-occupant Loans on Number Average Value Number Average Value Number Average Value
LOANS ORIGINATED 107 $247,227 62 $256,442 1 $326,120 APPLICATIONS APPROVED, NOT ACCEPTED 25 $231,431 41 $265,468 2 $301,500 APPLICATIONS DENIED 4 $243,368 7 $299,459 5 $191,340 APPLICATIONS WITHDRAWN 10 $242,933 10 $279,211 1 $311,470 FILES CLOSED FOR INCOMPLETENESS 2 $254,205 2 $284,690 2 $254,205
Aggregated Statistics For Year 2007(Based on 4 full and 8 partial tracts) A) Conventional B) Refinancings C) Non-occupant Loans on Number Average Value Number Average Value Number Average Value
LOANS ORIGINATED 158 $259,033 70 $281,718 11 $239,966 APPLICATIONS APPROVED, NOT ACCEPTED 16 $315,043 13 $278,965 0 $0 APPLICATIONS DENIED 2 $246,835 2 $403,975 0 $0 APPLICATIONS WITHDRAWN 7 $256,656 8 $338,032 0 $0 FILES CLOSED FOR INCOMPLETENESS 1 $339,790 2 $267,895 0 $0
Aggregated Statistics For Year 2006(Based on 4 full and 8 partial tracts) A) Conventional B) Refinancings C) Non-occupant Loans on Number Average Value Number Average Value Number Average Value
LOANS ORIGINATED 43 $247,234 31 $255,759 3 $189,343 APPLICATIONS APPROVED, NOT ACCEPTED 8 $274,319 15 $229,949 2 $355,695 APPLICATIONS DENIED 0 $0 0 $0 0 $0 APPLICATIONS WITHDRAWN 2 $282,175 4 $185,148 2 $282,175 FILES CLOSED FOR INCOMPLETENESS 0 $0 1 $286,160 0 $0
Aggregated Statistics For Year 2005(Based on 4 full and 8 partial tracts) A) Conventional B) Refinancings C) Non-occupant Loans on Number Average Value Number Average Value Number Average Value
LOANS ORIGINATED 90 $217,317 46 $216,535 21 $174,327 APPLICATIONS APPROVED, NOT ACCEPTED 19 $223,784 16 $216,582 4 $193,315 APPLICATIONS DENIED 6 $362,463 1 $194,590 0 $0 APPLICATIONS WITHDRAWN 11 $259,933 5 $203,248 0 $0 FILES CLOSED FOR INCOMPLETENESS 1 $368,820 0 $0 0 $0
Aggregated Statistics For Year 2004(Based on 4 full and 8 partial tracts) A) Conventional B) Refinancings C) Non-occupant Loans on Number Average Value Number Average Value Number Average Value
LOANS ORIGINATED 138 $186,041 95 $177,341 13 $156,171 APPLICATIONS APPROVED, NOT ACCEPTED 27 $218,854 33 $196,414 0 $0 APPLICATIONS DENIED 2 $247,750 0 $0 0 $0 APPLICATIONS WITHDRAWN 4 $180,368 7 $258,514 2 $195,280 FILES CLOSED FOR INCOMPLETENESS 1 $189,500 0 $0 0 $0
Aggregated Statistics For Year 2003(Based on 4 full and 8 partial tracts) A) Conventional B) Refinancings C) Non-occupant Loans on Number Average Value Number Average Value Number Average Value
LOANS ORIGINATED 209 $172,792 333 $162,043 16 $147,468 APPLICATIONS APPROVED, NOT ACCEPTED 28 $193,947 67 $166,171 3 $141,063 APPLICATIONS DENIED 3 $262,070 7 $159,056 0 $0 APPLICATIONS WITHDRAWN 14 $177,076 4 $147,670 0 $0 FILES CLOSED FOR INCOMPLETENESS 0 $0 0 $0 0 $0
Aggregated Statistics For Year 2002(Based on 2 full and 2 partial tracts) A) Conventional B) Refinancings C) Non-occupant Loans on Number Average Value Number Average Value Number Average Value
LOANS ORIGINATED 47 $167,846 53 $167,353 5 $143,430 APPLICATIONS APPROVED, NOT ACCEPTED 0 $0 19 $177,281 0 $0 APPLICATIONS DENIED 0 $0 5 $241,782 0 $0 APPLICATIONS WITHDRAWN 5 $308,952 4 $174,890 0 $0 FILES CLOSED FOR INCOMPLETENESS 0 $0 0 $0 0 $0
Aggregated Statistics For Year 2001(Based on 2 full and 2 partial tracts) A) Conventional B) Refinancings C) Non-occupant Loans on Number Average Value Number Average Value Number Average Value
LOANS ORIGINATED 67 $179,237 47 $179,045 0 $0 APPLICATIONS APPROVED, NOT ACCEPTED 6 $146,153 14 $182,431 4 $124,640 APPLICATIONS DENIED 0 $0 2 $196,515 0 $0 APPLICATIONS WITHDRAWN 0 $0 0 $0 0 $0 FILES CLOSED FOR INCOMPLETENESS 0 $0 2 $117,570 0 $0
Aggregated Statistics For Year 2000(Based on 2 full and 2 partial tracts) A) Conventional B) Refinancings C) Non-occupant Loans on Number Average Value Number Average Value Number Average Value
LOANS ORIGINATED 72 $163,549 11 $140,672 2 $94,590 APPLICATIONS APPROVED, NOT ACCEPTED 3 $130,450 2 $262,090 0 $0 APPLICATIONS DENIED 9 $179,004 2 $154,690 0 $0 APPLICATIONS WITHDRAWN 0 $0 2 $199,030 0 $0 FILES CLOSED FOR INCOMPLETENESS 2 $114,215 0 $0 0 $0
Aggregated Statistics For Year 1999(Based on 2 full and 2 partial tracts) A) Conventional B) Refinancings C) Non-occupant Loans on Number Average Value Number Average Value Number Average Value
LOANS ORIGINATED 242 $155,657 62 $144,737 3 $139,857 APPLICATIONS APPROVED, NOT ACCEPTED 15 $141,561 12 $139,753 0 $0 APPLICATIONS DENIED 5 $126,522 3 $123,330 1 $116,600 APPLICATIONS WITHDRAWN 5 $137,206 7 $171,664 0 $0 FILES CLOSED FOR INCOMPLETENESS 2 $152,170 1 $97,880 0 $0
2003 - 2018 National Fire Incident Reporting System (NFIRS) incidents See full 2006 National Fire Incident Reporting System statistics for zip code 98683, Washington
Most common first names in zip code 98683 among deceased individuals Name Count Lived (average)
Robert 68 77.1 years John 53 81.4 years Mary 45 81.0 years James 36 77.7 years William 34 78.8 years Richard 31 78.3 years Donald 29 76.0 years Dorothy 28 85.5 years Ruth 28 86.4 years Helen 25 88.4 years
Most common last names in zip code 98683 among deceased individuals Last name Count Lived (average)
Johnson 19 82.8 years Smith 17 86.9 years Martin 13 79.4 years Miller 12 84.8 years Williams 11 75.4 years Davis 11 83.3 years Taylor 10 78.6 years Brown 10 78.1 years Lee 8 80.9 years Nelson 8 79.7 years
Businesses in zip code 98683
Name Count Name Count
24 Hour Fitness 1 Panda Express 1 Baskin-Robbins 1 Panera Bread 1 Blockbuster 2 Payless 1 Carl\s Jr. 1 PetSmart 1 Chipotle 1 Quiznos 3 DHL 1 RadioShack 1 FedEx 2 Red Robin 1 GNC 1 Ruby Tuesday 1 H&R Block 1 SONIC Drive-In 1 Home Depot 1 Sephora 1 IHOP 1 Sprint Nextel 1 JCPenney 1 Starbucks 5 Jack In The Box 1 Subway 4 Jamba Juice 1 T-Mobile 3 Kroger 3 Taco Bell 1 Little Caesars Pizza 1 Trader Joe's 1 Lowe's 1 UPS 4 Marriott 1 Verizon Wireless 2 McDonald's 2 Walgreens 1 New Balance 2 Walmart 1 OfficeMax 1 Wendy's 1 Olive Garden 1 Whole Foods Market 1 On The Border 1

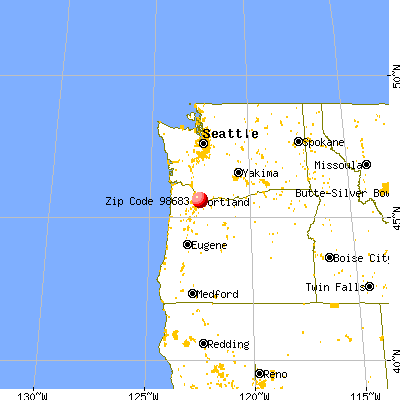


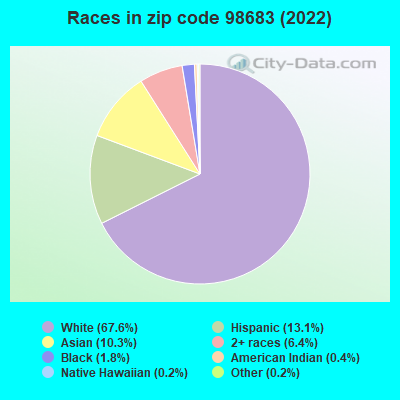


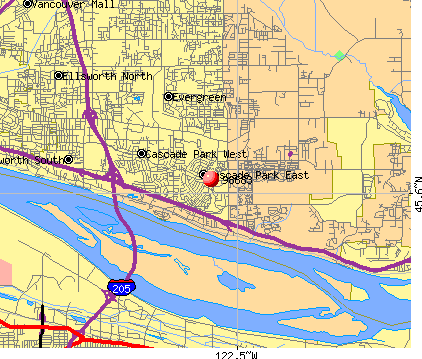 Nearest zip codes: 98684, 97230, 98664, 97220, 98682, 97024.
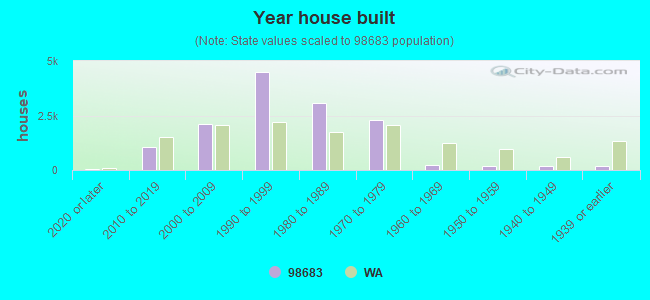

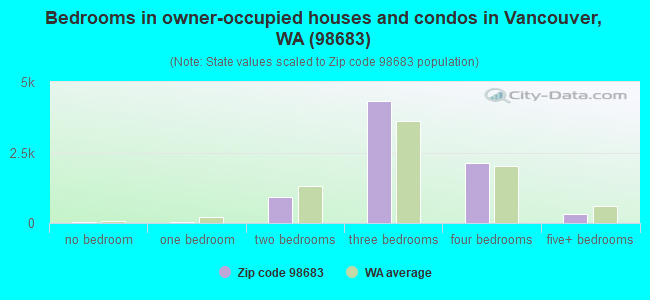
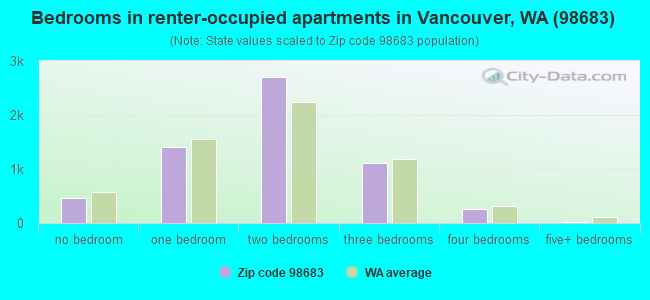
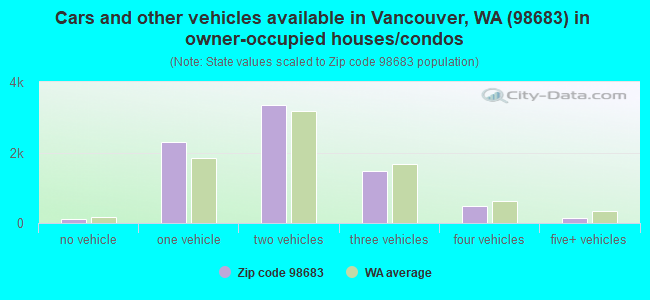
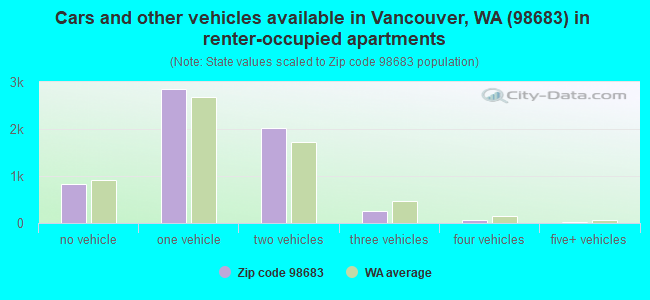


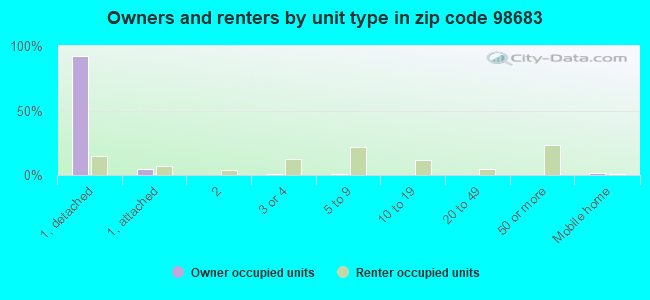


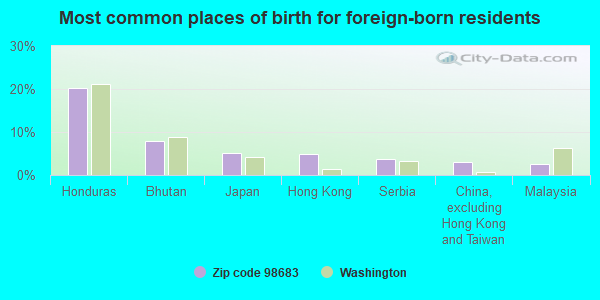
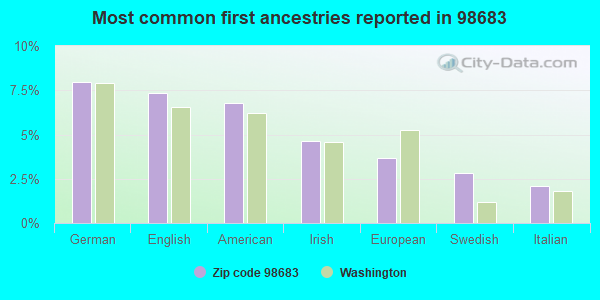
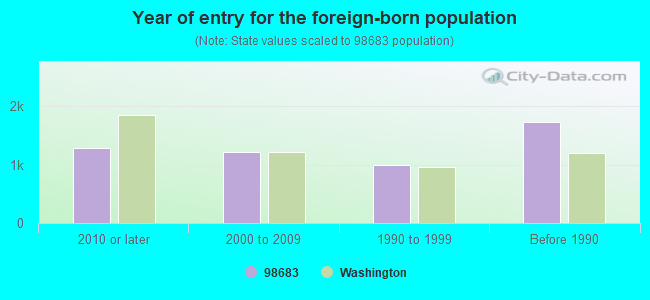


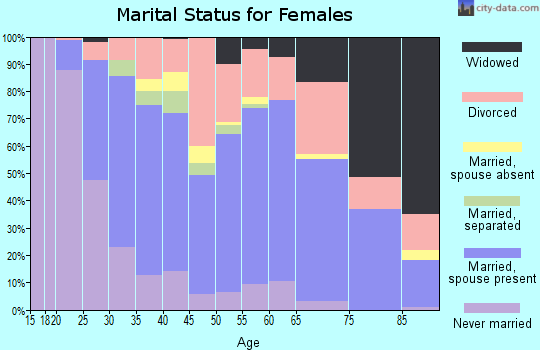
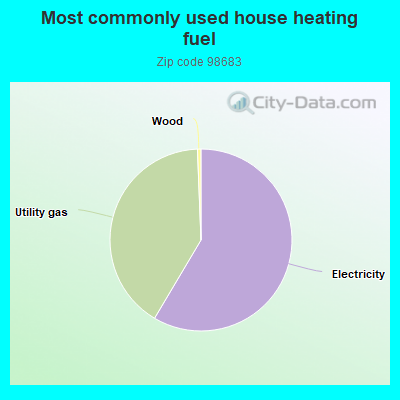
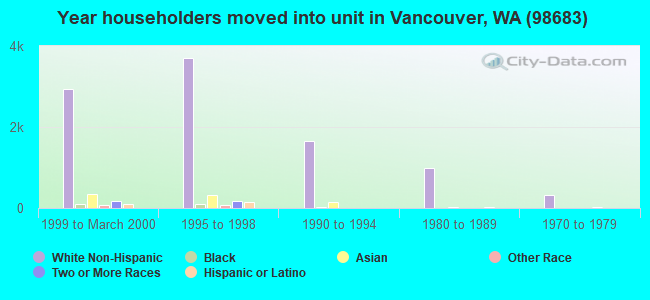
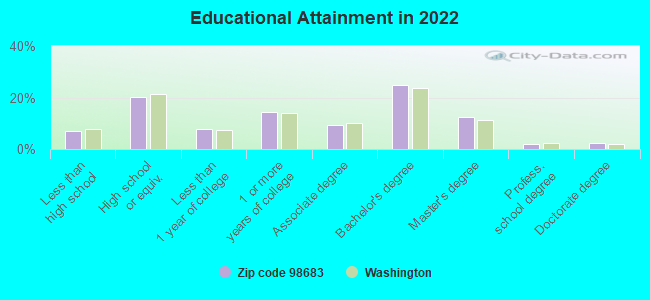
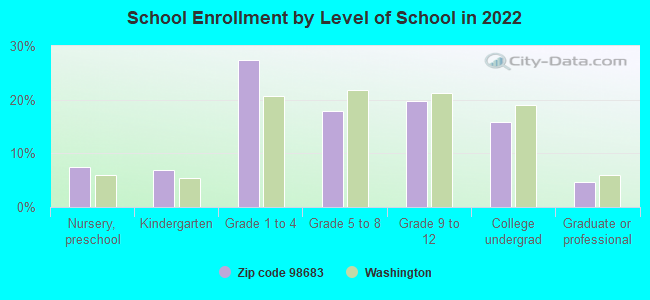
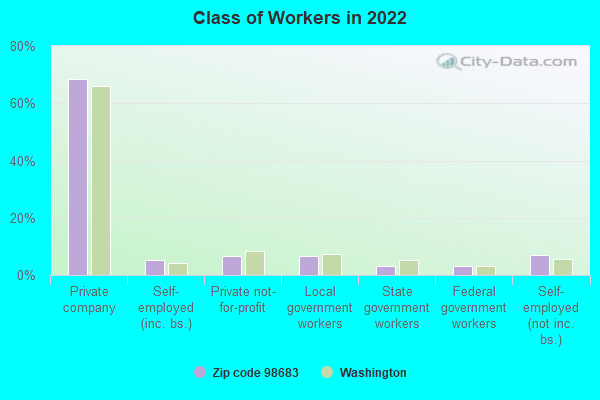
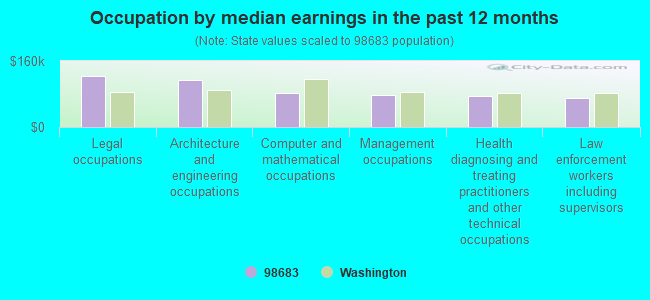
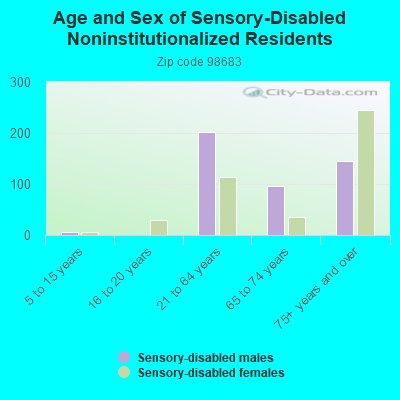

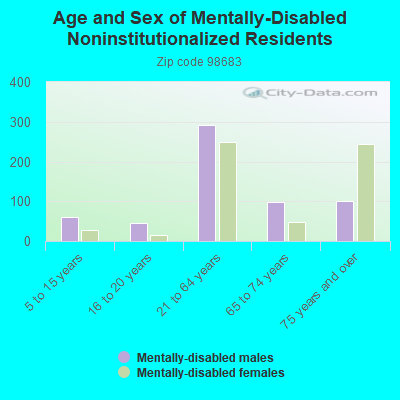
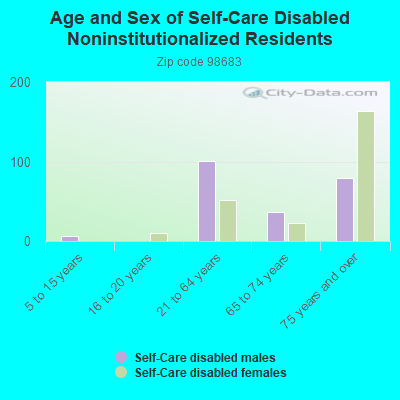
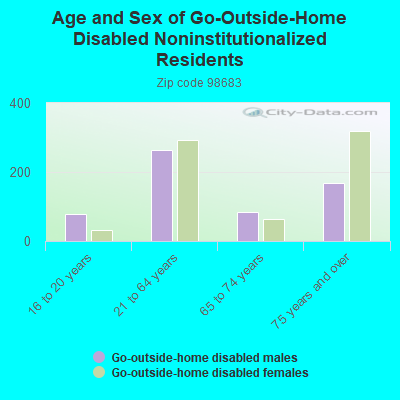
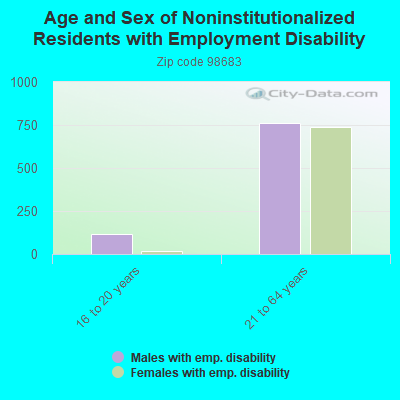
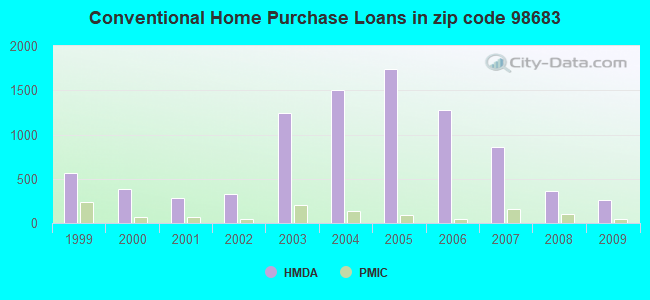
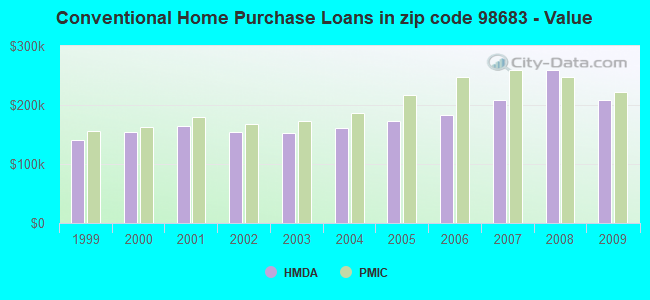
 Based on the data from the years 2003 - 2018 the average number of fires per year is 64. The highest number of reported fire incidents - 115 took place in 2015, and the least - 9 in 2016. The data has a growing trend.
 When looking into fire subcategories, the most incidents belonged to: Outside Fires (49.2%), and Structure Fires (29.6%).