Estimated zip code population in 2022: 23,690 Zip code population in 2010: 21,771 Zip code population in 2000: 20,403
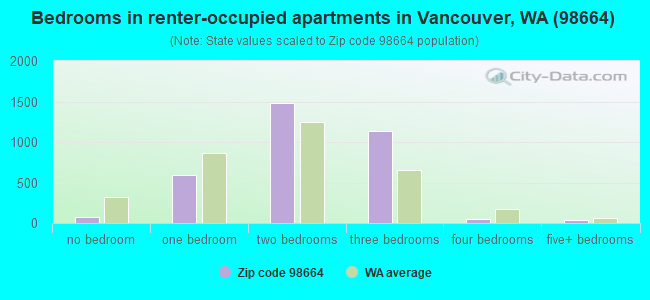
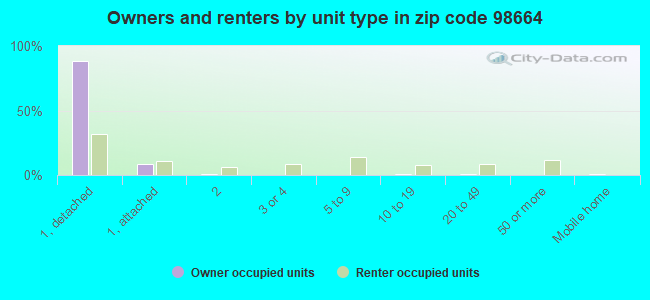
Houses and condos: 9,852 Renter-occupied apartments: 3,383
% of renters here:
35%
State:
36%
March 2022 cost of living index in zip code 98664: 103.8 (near average, U.S. average is 100)
Land area: 5.3 sq. mi. Water area: 0.3 sq. mi.
Population density: 4,506 people per square mile
(average).
OSM Map
General Map
Google Map
MSN Map
OSM Map
General Map
Google Map
MSN Map
OSM Map
General Map
Google Map
MSN Map
OSM Map
General Map
Google Map
MSN Map
Please wait while loading the map...
Real estate property taxes paid for housing units in 2022:
This zip code:
0.7% ($3,609)
Washington:
0.8% ($4,283)
Median real estate property taxes paid for housing units with mortgages in 2022: $3,645 (0.7%) Median real estate property taxes paid for housing units with no mortgage in 2022: $3,572 (0.8%)
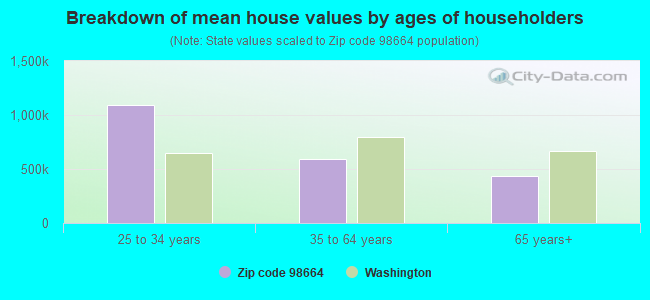
Estimated median house/condo value in 2022: $487,576
98664:
$487,576
Washington:
$569,500
According to our research of Washington and other state lists, there were 7 registered sex offenders living in 98664 zip code as of April 27, 2024. The ratio of all residents to sex offenders in zip code 98664 is 3,190 to 1. The ratio of registered sex offenders to all residents in this zip code is much lower than the state average.
Median resident age:
This zip code:
41.6 years
Washington median age:
38.4 years
Average household size:
This zip code:
2.4 people
Washington:
2.5 people
Averages for the 2020 tax year for zip code 98664, filed in 2021:
Average Adjusted Gross Income (AGI) in 2020: $97,009 (Individual Income Tax Returns)
Here:
$97,009
State:
$99,264
Salary/wage: $59,977 (reported on 80.5% of returns)
Here:
$59,977
State:
$80,347
(% of AGI for various income ranges: 1195.6% for AGIs below $25k, 3588.0% for AGIs $25k-50k, 6557.7% for AGIs $50k-75k, 9677.5% for AGIs $75k-100k, 17783.6% for AGIs $100k-200k, 79873.3% for AGIs over 200k)
Taxable interest for individuals: $4,970 (reported on 28.0% of returns)
This zip code:
$4,970
Washington:
$2,077
(% of AGI for various income ranges: 16.0% for AGIs below $25k, 18.5% for AGIs $25k-50k, 28.2% for AGIs $50k-75k, 62.5% for AGIs $75k-100k, 135.5% for AGIs $100k-200k, 8840.0% for AGIs over 200k)
Ordinary dividends: $16,249 (reported on 18.7% of returns)
Here:
$16,249
State:
$10,013
(% of AGI for various income ranges: 36.1% for AGIs below $25k, 41.7% for AGIs $25k-50k, 68.6% for AGIs $50k-75k, 140.6% for AGIs $75k-100k, 364.5% for AGIs $100k-200k, 18776.7% for AGIs over 200k)
Net capital gain/loss in AGI: +$64,300 (reported on 17.9% of returns)
Here:
+$64,300
State:
+$40,092
(% of AGI for various income ranges: 3.0% for AGIs below $25k, 23.7% for AGIs $25k-50k, 63.7% for AGIs $50k-75k, 189.9% for AGIs $75k-100k, 772.1% for AGIs $100k-200k, 82650.7% for AGIs over 200k)
Profit/loss from business: +$17,878 (reported on 13.4% of returns)
Here:
+$17,878
State:
+$18,312
(% of AGI for various income ranges: 143.2% for AGIs below $25k, 173.6% for AGIs $25k-50k, 256.5% for AGIs $50k-75k, 257.6% for AGIs $75k-100k, 561.6% for AGIs $100k-200k, 6588.7% for AGIs over 200k)
Taxable individual retirement arrangement distribution: $23,584 (reported on 9.6% of returns)
98664:
$23,584
Washington:
$24,221
(% of AGI for various income ranges: 70.5% for AGIs below $25k, 95.8% for AGIs $25k-50k, 183.4% for AGIs $50k-75k, 362.5% for AGIs $75k-100k, 899.3% for AGIs $100k-200k, 5955.3% for AGIs over 200k)
Self-employed (Keogh) retirement plans: $28,625 (reported on 0.3% of returns)
98664:
$28,625
Washington:
$24,166
(% of AGI for various income ranges: 133.1% for AGIs $100k-200k)
Total itemized deductions: $55,752 (reported on 9.4% of returns)
Here:
$55,752
State:
$39,068
(% of AGI for various income ranges: 56.9% for AGIs below $25k, 105.2% for AGIs $25k-50k, 353.0% for AGIs $50k-75k, 516.5% for AGIs $75k-100k, 1003.4% for AGIs $100k-200k, 26040.0% for AGIs over 200k)
Charity contributions: $21,102 (reported on 6.9% of returns)
Here:
$21,102
State:
$15,331
(% of AGI for various income ranges: 4.6% for AGIs below $25k, 13.5% for AGIs $25k-50k, 36.5% for AGIs $50k-75k, 69.8% for AGIs $75k-100k, 246.7% for AGIs $100k-200k, 8822.0% for AGIs over 200k)
Taxes paid: $7,111 (reported on 9.3% of returns)
98664:
$7,111
State:
$7,774
(% of AGI for various income ranges: 11.1% for AGIs below $25k, 21.9% for AGIs $25k-50k, 90.6% for AGIs $50k-75k, 144.9% for AGIs $75k-100k, 261.5% for AGIs $100k-200k, 1448.7% for AGIs over 200k)
Earned income credit: $2,016 (reported on 11.5% of returns)
Here:
$2,016
State:
$2,020
(% of AGI for various income ranges: 73.5% for AGIs below $25k, 42.8% for AGIs $25k-50k)
Percentage of individuals using paid preparers for their 2020 taxes: 91.8%
Here:
92%
State:
93%
(% for various income ranges: 89.8% for AGIs below $25k, 92.0% for AGIs $25k-50k, 92.3% for AGIs $50k-75k, 92.7% for AGIs $75k-100k, 93.2% for AGIs $100k-200k, 94.4% for AGIs over 200k)
Averages for the 2012 tax year for zip code 98664, filed in 2013:
Average Adjusted Gross Income (AGI) in 2012: $66,707 (Individual Income Tax Returns)
Here:
$66,707
State:
$69,533
Salary/wage: $45,955 (reported on 81.8% of returns)
Here:
$45,955
State:
$57,267
(% of AGI for various income ranges: 73.8% for AGIs below $25k, 79.1% for AGIs $25k-50k, 76.3% for AGIs $50k-75k, 74.1% for AGIs $75k-100k, 70.9% for AGIs $100k-200k, 21.8% for AGIs over 200k)
Taxable interest for individuals: $4,617 (reported on 30.0% of returns)
This zip code:
$4,617
Washington:
$1,816
(% of AGI for various income ranges: 1.1% for AGIs below $25k, 0.7% for AGIs $25k-50k, 0.5% for AGIs $50k-75k, 0.7% for AGIs $75k-100k, 1.1% for AGIs $100k-200k, 4.4% for AGIs over 200k)
Ordinary dividends: $16,990 (reported on 18.5% of returns)
Here:
$16,990
State:
$8,163
(% of AGI for various income ranges: 1.8% for AGIs below $25k, 1.2% for AGIs $25k-50k, 0.9% for AGIs $50k-75k, 1.5% for AGIs $75k-100k, 2.0% for AGIs $100k-200k, 10.8% for AGIs over 200k)
Net capital gain/loss in AGI: +$36,362 (reported on 15.4% of returns)
Here:
+$36,362
State:
+$21,568
(% of AGI for various income ranges: 0.2% for AGIs $25k-50k, 0.4% for AGIs $50k-75k, 0.9% for AGIs $75k-100k, 2.0% for AGIs $100k-200k, 22.6% for AGIs over 200k)
Profit/loss from business: +$11,555 (reported on 11.7% of returns)
Here:
+$11,555
State:
+$16,521
(% of AGI for various income ranges: 6.1% for AGIs below $25k, 2.5% for AGIs $25k-50k, 2.1% for AGIs $50k-75k, 2.3% for AGIs $75k-100k, 2.1% for AGIs $100k-200k, 0.8% for AGIs over 200k)
Taxable individual retirement arrangement distribution: $18,543 (reported on 11.1% of returns)
98664:
$18,543
Washington:
$18,648
(% of AGI for various income ranges: 3.5% for AGIs below $25k, 2.7% for AGIs $25k-50k, 2.6% for AGIs $50k-75k, 3.1% for AGIs $75k-100k, 5.6% for AGIs $100k-200k, 2.2% for AGIs over 200k)
Self-employment retirement plans: $16,625 (reported on 0.4% of returns)
98664:
$16,625
Washington:
$20,087
Total itemized deductions: $25,555 (19% of AGI, reported on 32.5% of returns)
Here:
$25,555
State:
$23,872
Here:
19.1% of AGI
State:
18.2% of AGI
(% of AGI for various income ranges: 10.6% for AGIs below $25k, 10.3% for AGIs $25k-50k, 12.9% for AGIs $50k-75k, 14.2% for AGIs $75k-100k, 14.8% for AGIs $100k-200k, 11.9% for AGIs over 200k)
Charity contributions: $7,176 (reported on 25.7% of returns)
Here:
$7,176
State:
$4,465
(% of AGI for various income ranges: 0.9% for AGIs below $25k, 1.0% for AGIs $25k-50k, 1.5% for AGIs $50k-75k, 2.0% for AGIs $75k-100k, 2.5% for AGIs $100k-200k, 4.9% for AGIs over 200k)
Taxes paid: $7,841 (reported on 32.1% of returns)
98664:
$7,841
State:
$6,400
(% of AGI for various income ranges: 2.1% for AGIs below $25k, 2.5% for AGIs $25k-50k, 3.5% for AGIs $50k-75k, 4.3% for AGIs $75k-100k, 4.9% for AGIs $100k-200k, 4.1% for AGIs over 200k)
Earned income credit: $2,083 (reported on 15.4% of returns)
Here:
$2,083
State:
$2,073
(% of AGI for various income ranges: 4.9% for AGIs below $25k, 0.8% for AGIs $25k-50k)
Percentage of individuals using paid preparers for their 2012 taxes: 43.9%
Here:
44%
State:
43%
(% for various income ranges: 37.7% for AGIs below $25k, 40.8% for AGIs $25k-50k, 46.6% for AGIs $50k-75k, 51.1% for AGIs $75k-100k, 55.7% for AGIs $100k-200k, 80.0% for AGIs over 200k)
Averages for the 2004 tax year for zip code 98664, filed in 2005:
Average Adjusted Gross Income (AGI) in 2004: $56,764 (Individual Income Tax Returns)
Here:
$56,764
State:
$54,331
Salary/wage: $41,295 (reported on 83.5% of returns)
Here:
$41,295
State:
$45,761
(% of AGI for various income ranges: 197.7% for AGIs below $10k, 74.0% for AGIs $10k-25k, 81.6% for AGIs $25k-50k, 80.8% for AGIs $50k-75k, 78.7% for AGIs $75k-100k, 36.6% for AGIs over 100k)
Taxable interest for individuals: $3,963 (reported on 43.8% of returns)
This zip code:
$3,963
Washington:
$2,110
(% of AGI for various income ranges: 38.0% for AGIs below $10k, 2.3% for AGIs $10k-25k, 1.1% for AGIs $25k-50k, 1.4% for AGIs $50k-75k, 1.4% for AGIs $75k-100k, 4.5% for AGIs over 100k)
Taxable dividends: $8,425 (reported on 23.2% of returns)
Here:
$8,425
State:
$5,879
(% of AGI for various income ranges: 8.6% for AGIs below $10k, 1.5% for AGIs $10k-25k, 0.9% for AGIs $25k-50k, 1.0% for AGIs $50k-75k, 1.1% for AGIs $75k-100k, 6.2% for AGIs over 100k)
Net capital gain/loss: +$21,807 (reported on 20.2% of returns)
Here:
+$21,807
State:
+$15,835
(% of AGI for various income ranges: 21.0% for AGIs below $10k, 0.1% for AGIs $10k-25k, 0.2% for AGIs $25k-50k, 0.9% for AGIs $50k-75k, 2.0% for AGIs $75k-100k, 15.9% for AGIs over 100k)
Profit/loss from business: +$11,640 (reported on 11.9% of returns)
Here:
+$11,640
State:
+$13,994
(% of AGI for various income ranges: 13.2% for AGIs below $10k, 3.9% for AGIs $10k-25k, 2.6% for AGIs $25k-50k, 2.1% for AGIs $50k-75k, 3.2% for AGIs $75k-100k, 1.9% for AGIs over 100k)
IRA payment deduction: $3,138 (reported on 2.7% of returns)
98664:
$3,138
Washington:
$3,001
(% of AGI for various income ranges: 0.2% for AGIs $10k-25k, 0.2% for AGIs $25k-50k, 0.2% for AGIs $50k-75k, 0.2% for AGIs $75k-100k, 0.1% for AGIs over 100k)
Self-employed pension: $12,889 (reported on 0.8% of returns)
Here:
$12,889
Washington:
$14,244
(% of AGI for various income ranges: 0.1% for AGIs $10k-25k, 0.1% for AGIs $50k-75k, 0.2% for AGIs $75k-100k, 0.3% for AGIs over 100k)
Total itemized deductions: $20,198 (19% of AGI, reported on 38.2% of returns)
Here:
$20,198
State:
$19,669
Here:
19.5% of AGI
State:
20.7% of AGI
(% of AGI for various income ranges: 34.3% for AGIs below $10k, 9.9% for AGIs $10k-25k, 12.8% for AGIs $25k-50k, 16.9% for AGIs $50k-75k, 17.2% for AGIs $75k-100k, 12.1% for AGIs over 100k)
Charity contributions deductions: $5,093 (5% of AGI, reported on 32.9% of returns)
Here:
$5,093
State:
$3,569
Here:
4.6% of AGI
State:
3.5% of AGI
(% of AGI for various income ranges: 2.2% for AGIs below $10k, 1.0% for AGIs $10k-25k, 1.3% for AGIs $25k-50k, 2.2% for AGIs $50k-75k, 2.4% for AGIs $75k-100k, 4.4% for AGIs over 100k)
Total tax: $9,430 (reported on 78.1% of returns)
98664:
$9,430
State:
$9,065
(% of AGI for various income ranges: 5.2% for AGIs below $10k, 4.1% for AGIs $10k-25k, 7.2% for AGIs $25k-50k, 9.2% for AGIs $50k-75k, 10.7% for AGIs $75k-100k, 18.8% for AGIs over 100k)
Earned income credit: $1,634 (reported on 13.7% of returns)
Here:
$1,634
State:
$1,607
Percentage of individuals using paid preparers for their 2004 taxes: 52.3%
Here:
52%
State:
49%
(% for various income ranges: 46.2% for AGIs below $10k, 52.9% for AGIs $10k-25k, 48.1% for AGIs $25k-50k, 54.6% for AGIs $50k-75k, 55.7% for AGIs $75k-100k, 67.1% for AGIs over 100k)
Likely homosexual households (counted as self-reported same-sex unmarried-partner households)
Lesbian couples: 0.1% of all households
Gay men: 0.3% of all households
Household received Food Stamps/SNAP in the past 12 months: 1,440 Household did not receive Food Stamps/SNAP in the past 12 months: 8,123
Women who had a birth in the past 12 months: 380 (343 now married, 42 unmarried) Women who did not have a birth in the past 12 months: 5,126 (2,289 now married, 2,837 unmarried)
Housing units in zip code 98664 with a mortgage: 3,788 (463 second mortgage, 18 home equity loan, 439 both second mortgage and home equity loan) Houses without a mortgage: 52
Median monthly owner costs for units with a mortgage: $1,815 Median monthly owner costs for units without a mortgage: $588
Residents with income below the poverty level in 2022:
This zip code:
6.8%
Whole state:
10.0%
Residents with income below 50% of the poverty level in 2022:
This zip code:
3.1%
Whole state:
4.6%
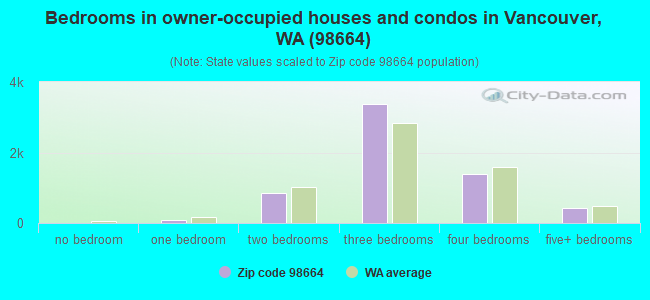
Median number of rooms in houses and condos:
Here:
6.4
State:
6.5
Median number of rooms in apartments:
Here:
4.4
State:
3.9
Notable locations in this zip code not listed on our city pages
Churches in zip code 98664 include: Central Church of the Nazarene (A), Chinese Evangelical Church of Vancouver (B), Columbia Ridge Baptist Church (C), Evergreen Bible Church (D), Life Center Open Bible Church (E), MacArthur Boulevard Christian Church (F), Peoples Church (G), Shiloh Fellowship Church (H), Grace Lutheran Church (I). Display/hide their locations on the map
In group quarters: 387 (-1 institutionalized population)
Size of family households: 2,875 2-persons, 1,526 3-persons, 956 4-persons, 546 5-persons, 100 6-persons, 246 7-or-more-persons
Size of nonfamily households: 2,764 1-person, 446 2-persons, 92 3-persons
3,484 married couples with children.
1,359 single-parent households (213 men, 1,146 women).
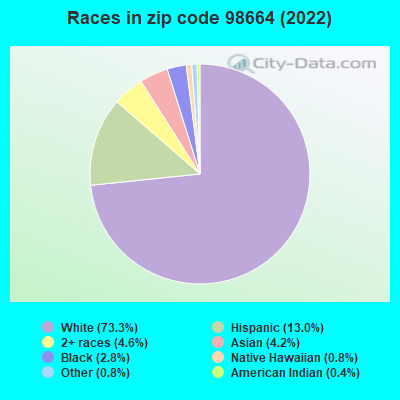
84.1% of residents of 98664 zip code speak English at home.
9.4% of residents speak Spanish at home (60% very well, 20% well, 20% not well).
3.8% of residents speak other Indo-European language at home (51% very well, 37% well, 9% not well, 4% not at all).
2.5% of residents speak Asian or Pacific Island language at home (35% very well, 26% well, 37% not well, 2% not at all).
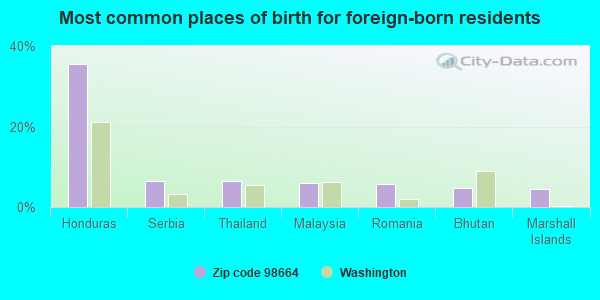
Foreign born population: 2,933 (12.4%) (58.5% of them are naturalized citizens)
Facilities with environmental interests located in this zip code:
ARCO SS 4185 (7609 MACARTHUR BLVD in VANCOUVER, WA)
(Resource Conservation and Recovery Act (tracking hazardous waste)) STATE MASTER (Washington State Department of Ecology's Facility/Site identification system) - TOXICS-8747, LEAKING STORAGE TANK, UNDERGROUND STORAGE TANK PROGRAM, HAZWASTE-WAD988516050, EPCRA, TOXICS-, REMEDIAL ACTION PLAN MONITORING Business SIC classification: GASOLINE SERVICE STATIONS Alternative names: ARCO 04185
ARCO 5893 PSI 5423 (10314 SE MILL PLAIN RD in VANCOUVER, WA)
Conditionally Exempt Small Quantity Generators, less than 100 kg/month of hazardous waste (Resource Conservation and Recovery Act (tracking hazardous waste)) - notification STATE MASTER (Washington State Department of Ecology's Facility/Site identification system) - TOXICS-102275, UNDERGROUND STORAGE TANK PROGRAM, HAZWASTE-WA0000137489, LQG, EPCRA Business SIC classification: GASOLINE SERVICE STATIONS Organizations: BP WEST COAST PRODUCTS LLC (CONTACT/OPERATOR)
Alternative names: ARCO 05893
Housing units lacking complete plumbing facilities: 0.8% Housing units lacking complete kitchen facilities: 2.1%
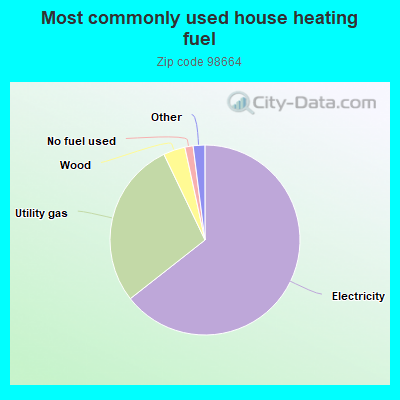
64.4%Electricity
28.5%Utility gas
3.7%Wood
1.4%No fuel used
0.8%Other fuel
0.8%Bottled, tank, or LP gas
Population in 1990: 17,179. Population change in the 1990s: +3,224 (+18.8%).
Place of birth for U.S.-born residents:
This state: 7,821
Northeast: 622
Midwest: 1,809
South: 1,349
West: 8,831
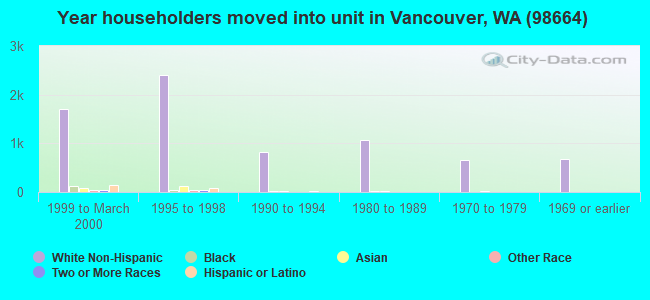
45% of the 98664 zip code residents lived in the same house 5 years ago. Out of people who lived in different houses, 54% lived in this county. Out of people who lived in different counties, 50% lived in Washington.
89% of the 98664 zip code residents lived in the same house 1 year ago. Out of people who lived in different houses, 45% moved from this county. Out of people who lived in different houses, 11% moved from different county within same state. Out of people who lived in different houses, 46% moved from different state. Out of people who lived in different houses, 1% moved from abroad.
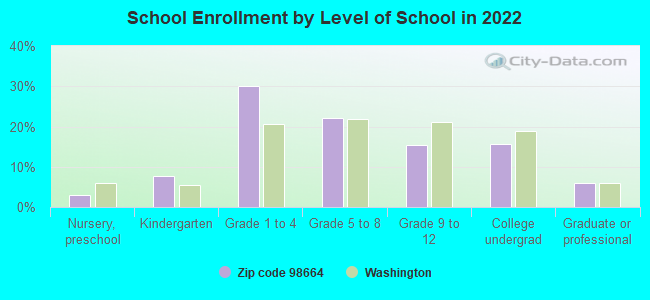
Private vs. public school enrollment:
Students in private schools in grades 1 to 8 (elementary and middle school): 686
Here:
26.7%
Washington:
12.4%
Students in private schools in grades 9 to 12 (high school): 73
Here:
9.7%
Washington:
9.2%
Students in private undergraduate colleges: 46
Here:
6.0%
Washington:
16.5%
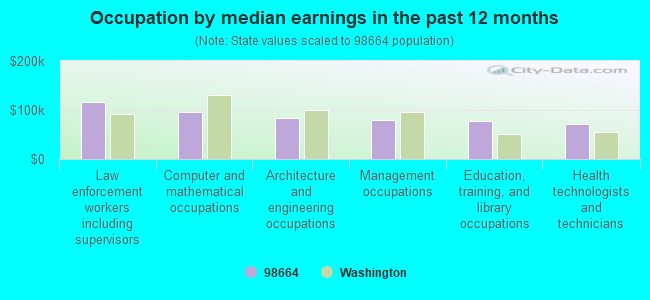
Occupation by median earnings in the past 12 months ($)
116,498Law enforcement workers including supervisors
95,850Computer and mathematical occupations
83,698Architecture and engineering occupations
79,337Management occupations
77,465Education, training, and library occupations
71,777Health technologists and technicians
Companies with federal contracts located in this zip code:
SHIELA K OSHEROFF (7513 ALABAMA DR in VANCOUVER, WA; small business) : $97,927 in 22 contractsfrom 2001 to 2005
Contracts for Library Services by Army, U.S. Army Corps of Engineers - civil program financing only Signed by year:2000: $0; 2001: $12,099; 2002: $17,731; 2003: $9,412; 2004: $578; 2005: $58,107; 2006: $0.
Biggest contracts:
$18,215 with Army for Library Services. Taking place in OR. Signed on 2005-10-26. Completion date: 2006-03-31.
$15,947 with U.S. Army Corps of Engineers - civil program financing only for Library Services. Taking place in OR. Signed on 2005-03-30. Completion date: 2006-03-31.
$15,947 with Army for Library Services. Taking place in OR. Signed on 2005-03-30. Completion date: 2006-03-31.
$11,999 with U.S. Army Corps of Engineers - civil program financing only for Library Services. Taking place in OR. Signed on 2002-01-15. Completion date: 1999-10-01.
PEGLER AUTOMATION, INC (10117 NE 21ST ST in VANCOUVER, WA; small business) : $53,600 in 3 contractsin 2003
$50,000 with Navy for Installation of Equipment -- Maintenance and Repair Shop Equipment. Taking place in CA. Signed on 2003-02-19. Completion date: 2003-02-06.
$3,600, same as above.Signed on 2003-04-07. Completion date: 2003-02-06.
$0, same as above.Signed on 2003-04-07. Completion date: 2003-02-06.
NAVIGATION SOLUTIONS (1904 NE BRIDGECREEK AVE, # in VANCOUVER, WA; small business)
$7,000 with U.S. Army Corps of Engineers - civil program financing only for Navigational Instruments. Signed on 2003-01-07. Completion date: 2003-01-31.
Top industries in this zip code by the number of employees in 2005:
Health Care and Social Assistance: General Medical and Surgical Hospitals (over 1000 employees: 1 establishment)
Health Care and Social Assistance: Offices of Physicians (except Mental Health Specialists) (250-499: 1, 100-249: 1, 50-99: 2, 20-49: 10, 10-19: 1, 5-9: 7, 1-4: 8)
Professional, Scientific, and Technical Services: Administrative Management and General Management Consulting Services (250-499: 1, 1-4: 3)
Health Care and Social Assistance: HMO Medical Centers (250-499: 1)
Health Care and Social Assistance: Nursing Care Facilities (100-249: 2)
2003 - 2018 National Fire Incident Reporting System (NFIRS) incidents
According to the data from the years 2003 - 2018 the average number of fire incidents per year is 44. The highest number of fire incidents - 83 took place in 2015, and the least - 0 in 2016. The data has a rising trend.
When looking into fire subcategories, the most incidents belonged to: Outside Fires (49.9%), and Structure Fires (29.7%).
Fire incident types reported to NFIRS in Zip Code 98664

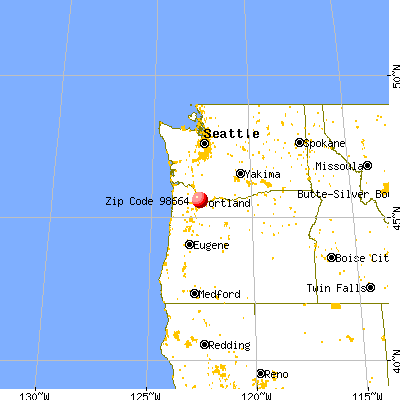


 Nearest zip codes: 97218, 98661, 98684, 98683, 98662, 97211.


 According to the data from the years 2003 - 2018 the average number of fire incidents per year is 44. The highest number of fire incidents - 83 took place in 2015, and the least - 0 in 2016. The data has a rising trend.
 When looking into fire subcategories, the most incidents belonged to: Outside Fires (49.9%), and Structure Fires (29.7%).