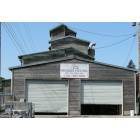
Orchards, Washington Submit your own pictures of this place and show them to the world
OSM Map
General Map
Google Map
MSN Map
OSM Map
General Map
Google Map
MSN Map
OSM Map
General Map
Google Map
MSN Map
OSM Map
General Map
Google Map
MSN Map
Please wait while loading the map...
Population in 2010: 19,556. Population change since 2000: +9.5%Males: 10,043 Females: 9,513
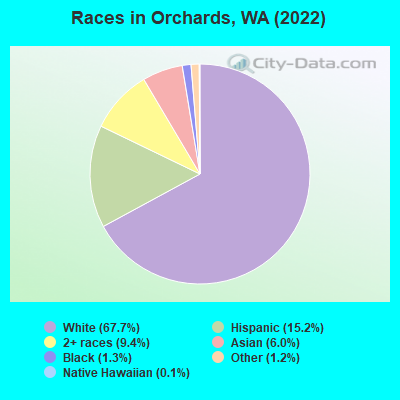
March 2022 cost of living index in Orchards: 103.4 (near average, U.S. average is 100) Percentage of residents living in poverty in 2022: 11.9%for White Non-Hispanic residents , 34.8% for Black residents , 19.7% for Hispanic or Latino residents , 37.5% for American Indian residents , 17.3% for other race residents , 8.3% for two or more races residents )Business Search - 14 Million verified businesses
Data:
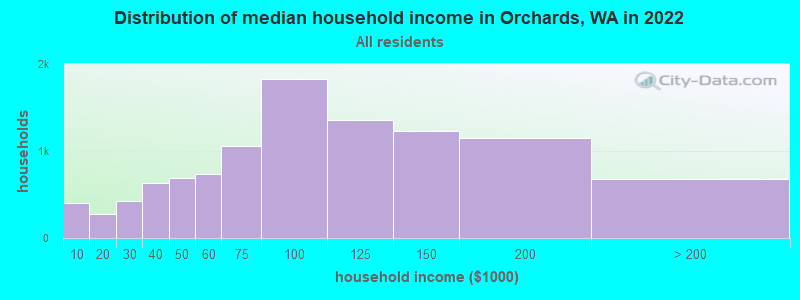
Median household income ($)
Median household income (% change since 2000)
Household income diversity
Ratio of average income to average house value (%)
Ratio of average income to average rent
Median household income ($) - White
Median household income ($) - Black or African American
Median household income ($) - Asian
Median household income ($) - Hispanic or Latino
Median household income ($) - American Indian and Alaska Native
Median household income ($) - Multirace
Median household income ($) - Other Race
Median household income for houses/condos with a mortgage ($)
Median household income for apartments without a mortgage ($)
Races - White alone (%)
Races - White alone (% change since 2000)
Races - Black alone (%)
Races - Black alone (% change since 2000)
Races - American Indian alone (%)
Races - American Indian alone (% change since 2000)
Races - Asian alone (%)
Races - Asian alone (% change since 2000)
Races - Hispanic (%)
Races - Hispanic (% change since 2000)
Races - Native Hawaiian and Other Pacific Islander alone (%)
Races - Native Hawaiian and Other Pacific Islander alone (% change since 2000)
Races - Two or more races (%)
Races - Two or more races (% change since 2000)
Races - Other race alone (%)
Races - Other race alone (% change since 2000)
Racial diversity
Unemployment (%)
Unemployment (% change since 2000)
Unemployment (%) - White
Unemployment (%) - Black or African American
Unemployment (%) - Asian
Unemployment (%) - Hispanic or Latino
Unemployment (%) - American Indian and Alaska Native
Unemployment (%) - Multirace
Unemployment (%) - Other Race
Population density (people per square mile)
Population - Males (%)
Population - Females (%)
Population - Males (%) - White
Population - Males (%) - Black or African American
Population - Males (%) - Asian
Population - Males (%) - Hispanic or Latino
Population - Males (%) - American Indian and Alaska Native
Population - Males (%) - Multirace
Population - Males (%) - Other Race
Population - Females (%) - White
Population - Females (%) - Black or African American
Population - Females (%) - Asian
Population - Females (%) - Hispanic or Latino
Population - Females (%) - American Indian and Alaska Native
Population - Females (%) - Multirace
Population - Females (%) - Other Race
Coronavirus confirmed cases (Apr 27, 2024)
Deaths caused by coronavirus (Apr 27, 2024)
Coronavirus confirmed cases (per 100k population) (Apr 27, 2024)
Deaths caused by coronavirus (per 100k population) (Apr 27, 2024)
Daily increase in number of cases (Apr 27, 2024)
Weekly increase in number of cases (Apr 27, 2024)
Cases doubled (in days) (Apr 27, 2024)
Hospitalized patients (Apr 18, 2022)
Negative test results (Apr 18, 2022)
Total test results (Apr 18, 2022)
COVID Vaccine doses distributed (per 100k population) (Sep 19, 2023)
COVID Vaccine doses administered (per 100k population) (Sep 19, 2023)
COVID Vaccine doses distributed (Sep 19, 2023)
COVID Vaccine doses administered (Sep 19, 2023)
Likely homosexual households (%)
Likely homosexual households (% change since 2000)
Likely homosexual households - Lesbian couples (%)
Likely homosexual households - Lesbian couples (% change since 2000)
Likely homosexual households - Gay men (%)
Likely homosexual households - Gay men (% change since 2000)
Cost of living index
Median gross rent ($)
Median contract rent ($)
Median monthly housing costs ($)
Median house or condo value ($)
Median house or condo value ($ change since 2000)
Mean house or condo value by units in structure - 1, detached ($)
Mean house or condo value by units in structure - 1, attached ($)
Mean house or condo value by units in structure - 2 ($)
Mean house or condo value by units in structure by units in structure - 3 or 4 ($)
Mean house or condo value by units in structure - 5 or more ($)
Mean house or condo value by units in structure - Boat, RV, van, etc. ($)
Mean house or condo value by units in structure - Mobile home ($)
Median house or condo value ($) - White
Median house or condo value ($) - Black or African American
Median house or condo value ($) - Asian
Median house or condo value ($) - Hispanic or Latino
Median house or condo value ($) - American Indian and Alaska Native
Median house or condo value ($) - Multirace
Median house or condo value ($) - Other Race
Median resident age
Resident age diversity
Median resident age - Males
Median resident age - Females
Median resident age - White
Median resident age - Black or African American
Median resident age - Asian
Median resident age - Hispanic or Latino
Median resident age - American Indian and Alaska Native
Median resident age - Multirace
Median resident age - Other Race
Median resident age - Males - White
Median resident age - Males - Black or African American
Median resident age - Males - Asian
Median resident age - Males - Hispanic or Latino
Median resident age - Males - American Indian and Alaska Native
Median resident age - Males - Multirace
Median resident age - Males - Other Race
Median resident age - Females - White
Median resident age - Females - Black or African American
Median resident age - Females - Asian
Median resident age - Females - Hispanic or Latino
Median resident age - Females - American Indian and Alaska Native
Median resident age - Females - Multirace
Median resident age - Females - Other Race
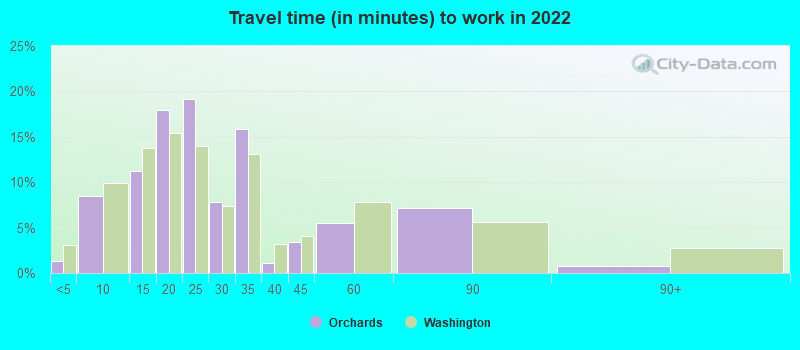
Commute - mean travel time to work (minutes)
Travel time to work - Less than 5 minutes (%)
Travel time to work - Less than 5 minutes (% change since 2000)
Travel time to work - 5 to 9 minutes (%)
Travel time to work - 5 to 9 minutes (% change since 2000)
Travel time to work - 10 to 19 minutes (%)
Travel time to work - 10 to 19 minutes (% change since 2000)
Travel time to work - 20 to 29 minutes (%)
Travel time to work - 20 to 29 minutes (% change since 2000)
Travel time to work - 30 to 39 minutes (%)
Travel time to work - 30 to 39 minutes (% change since 2000)
Travel time to work - 40 to 59 minutes (%)
Travel time to work - 40 to 59 minutes (% change since 2000)
Travel time to work - 60 to 89 minutes (%)
Travel time to work - 60 to 89 minutes (% change since 2000)
Travel time to work - 90 or more minutes (%)
Travel time to work - 90 or more minutes (% change since 2000)
Marital status - Never married (%)
Marital status - Now married (%)
Marital status - Separated (%)
Marital status - Widowed (%)
Marital status - Divorced (%)
Median family income ($)
Median family income (% change since 2000)
Median non-family income ($)
Median non-family income (% change since 2000)
Median per capita income ($)
Median per capita income (% change since 2000)
Median family income ($) - White
Median family income ($) - Black or African American
Median family income ($) - Asian
Median family income ($) - Hispanic or Latino
Median family income ($) - American Indian and Alaska Native
Median family income ($) - Multirace
Median family income ($) - Other Race
Median year house/condo built
Median year apartment built
Year house built - Built 2005 or later (%)
Year house built - Built 2000 to 2004 (%)
Year house built - Built 1990 to 1999 (%)
Year house built - Built 1980 to 1989 (%)
Year house built - Built 1970 to 1979 (%)
Year house built - Built 1960 to 1969 (%)
Year house built - Built 1950 to 1959 (%)
Year house built - Built 1940 to 1949 (%)
Year house built - Built 1939 or earlier (%)
Average household size
Household density (households per square mile)
Average household size - White
Average household size - Black or African American
Average household size - Asian
Average household size - Hispanic or Latino
Average household size - American Indian and Alaska Native
Average household size - Multirace
Average household size - Other Race
Occupied housing units (%)
Vacant housing units (%)
Owner occupied housing units (%)
Renter occupied housing units (%)
Vacancy status - For rent (%)
Vacancy status - For sale only (%)
Vacancy status - Rented or sold, not occupied (%)
Vacancy status - For seasonal, recreational, or occasional use (%)
Vacancy status - For migrant workers (%)
Vacancy status - Other vacant (%)
Residents with income below the poverty level (%)
Residents with income below 50% of the poverty level (%)
Children below poverty level (%)
Poor families by family type - Married-couple family (%)
Poor families by family type - Male, no wife present (%)
Poor families by family type - Female, no husband present (%)
Poverty status for native-born residents (%)
Poverty status for foreign-born residents (%)
Poverty among high school graduates not in families (%)
Poverty among people who did not graduate high school not in families (%)
Residents with income below the poverty level (%) - White
Residents with income below the poverty level (%) - Black or African American
Residents with income below the poverty level (%) - Asian
Residents with income below the poverty level (%) - Hispanic or Latino
Residents with income below the poverty level (%) - American Indian and Alaska Native
Residents with income below the poverty level (%) - Multirace
Residents with income below the poverty level (%) - Other Race
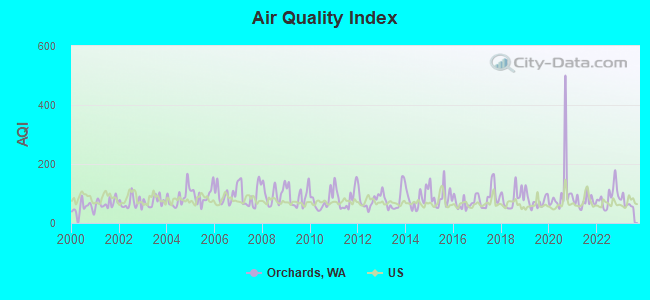
Air pollution - Air Quality Index (AQI)
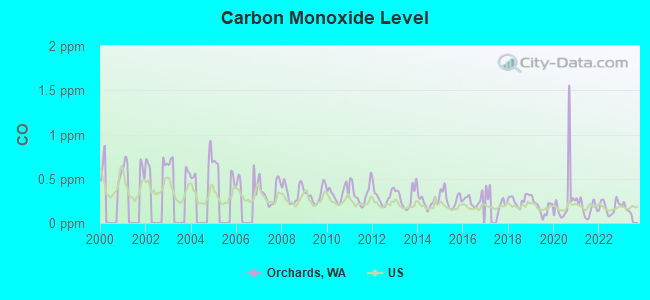
Air pollution - CO
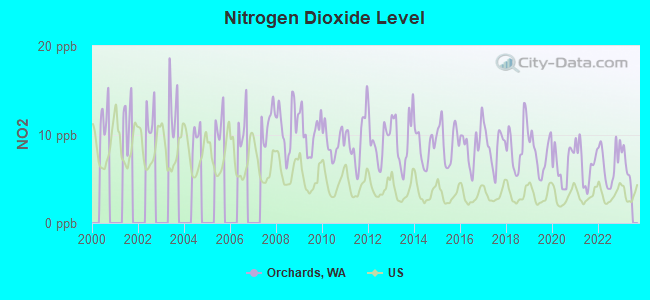
Air pollution - NO2
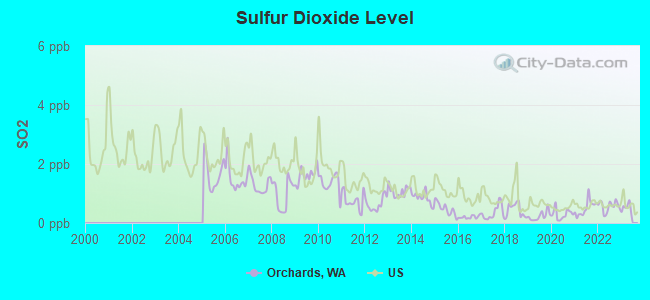
Air pollution - SO2
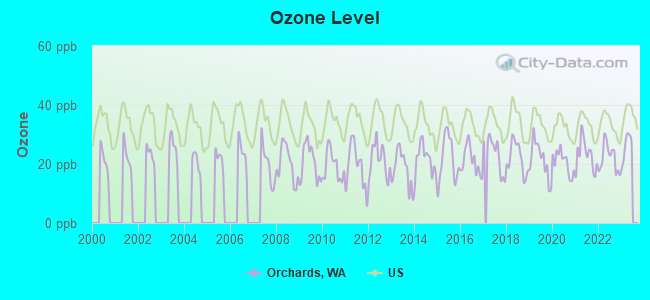
Air pollution - Ozone
Air pollution - PM10
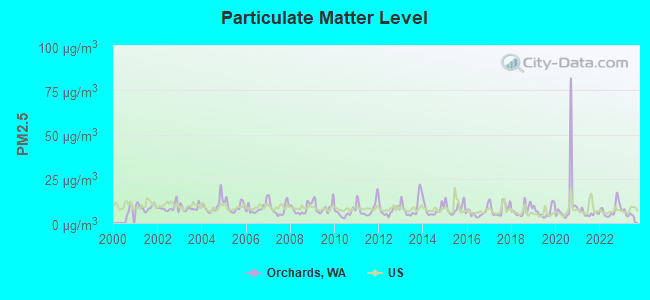
Air pollution - PM25
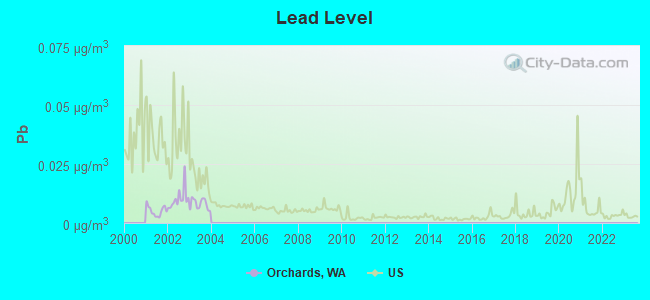
Air pollution - Pb
Crime - Murders per 100,000 population
Crime - Rapes per 100,000 population
Crime - Robberies per 100,000 population
Crime - Assaults per 100,000 population
Crime - Burglaries per 100,000 population
Crime - Thefts per 100,000 population
Crime - Auto thefts per 100,000 population
Crime - Arson per 100,000 population
Crime - City-data.com crime index
Crime - Violent crime index
Crime - Property crime index
Crime - Murders per 100,000 population (5 year average)
Crime - Rapes per 100,000 population (5 year average)
Crime - Robberies per 100,000 population (5 year average)
Crime - Assaults per 100,000 population (5 year average)
Crime - Burglaries per 100,000 population (5 year average)
Crime - Thefts per 100,000 population (5 year average)
Crime - Auto thefts per 100,000 population (5 year average)
Crime - Arson per 100,000 population (5 year average)
Crime - City-data.com crime index (5 year average)
Crime - Violent crime index (5 year average)
Crime - Property crime index (5 year average)
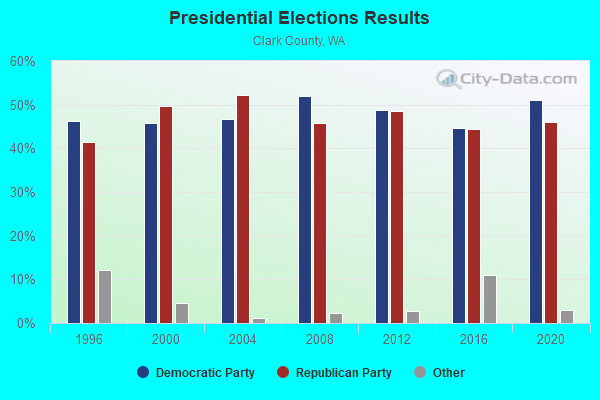
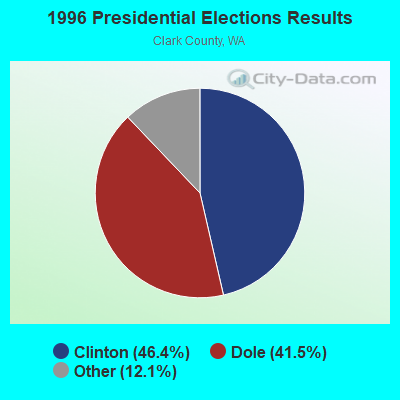
1996 Presidential Elections Results (%) - Democratic Party (Clinton)
1996 Presidential Elections Results (%) - Republican Party (Dole)
1996 Presidential Elections Results (%) - Other
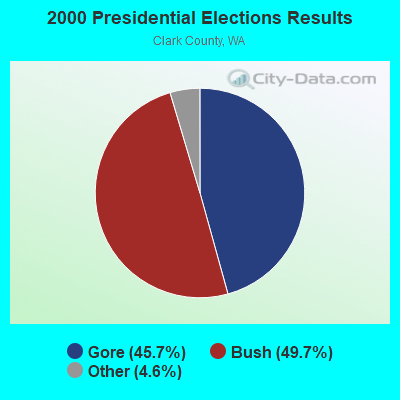
2000 Presidential Elections Results (%) - Democratic Party (Gore)
2000 Presidential Elections Results (%) - Republican Party (Bush)
2000 Presidential Elections Results (%) - Other
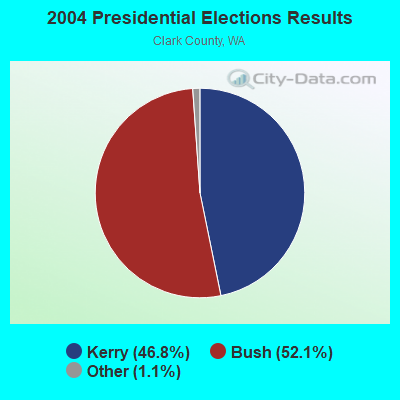
2004 Presidential Elections Results (%) - Democratic Party (Kerry)
2004 Presidential Elections Results (%) - Republican Party (Bush)
2004 Presidential Elections Results (%) - Other
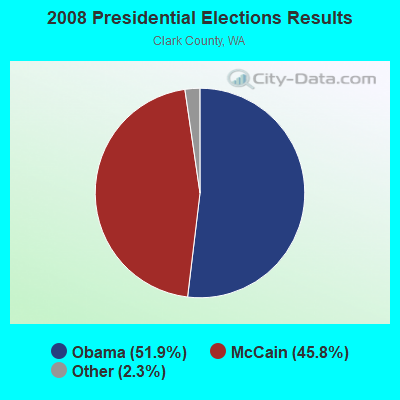
2008 Presidential Elections Results (%) - Democratic Party (Obama)
2008 Presidential Elections Results (%) - Republican Party (McCain)
2008 Presidential Elections Results (%) - Other
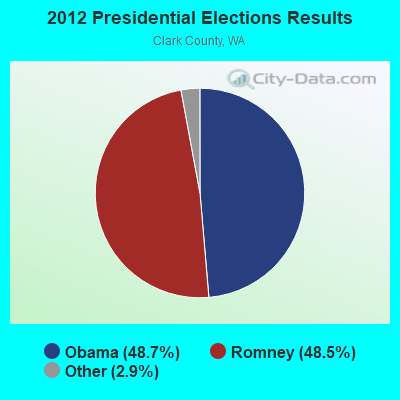
2012 Presidential Elections Results (%) - Democratic Party (Obama)
2012 Presidential Elections Results (%) - Republican Party (Romney)
2012 Presidential Elections Results (%) - Other
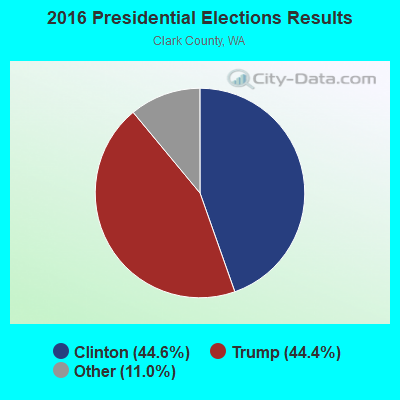
2016 Presidential Elections Results (%) - Democratic Party (Clinton)
2016 Presidential Elections Results (%) - Republican Party (Trump)
2016 Presidential Elections Results (%) - Other
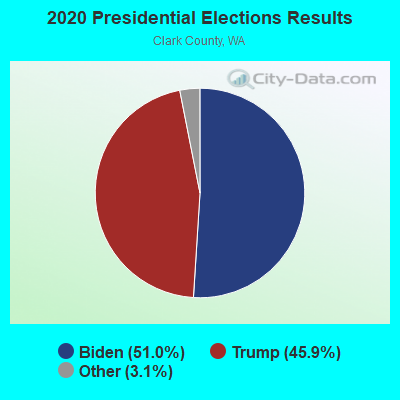
2020 Presidential Elections Results (%) - Democratic Party (Biden)
2020 Presidential Elections Results (%) - Republican Party (Trump)
2020 Presidential Elections Results (%) - Other
Ancestries Reported - Arab (%)
Ancestries Reported - Czech (%)
Ancestries Reported - Danish (%)
Ancestries Reported - Dutch (%)
Ancestries Reported - English (%)
Ancestries Reported - French (%)
Ancestries Reported - French Canadian (%)
Ancestries Reported - German (%)
Ancestries Reported - Greek (%)
Ancestries Reported - Hungarian (%)
Ancestries Reported - Irish (%)
Ancestries Reported - Italian (%)
Ancestries Reported - Lithuanian (%)
Ancestries Reported - Norwegian (%)
Ancestries Reported - Polish (%)
Ancestries Reported - Portuguese (%)
Ancestries Reported - Russian (%)
Ancestries Reported - Scotch-Irish (%)
Ancestries Reported - Scottish (%)
Ancestries Reported - Slovak (%)
Ancestries Reported - Subsaharan African (%)
Ancestries Reported - Swedish (%)
Ancestries Reported - Swiss (%)
Ancestries Reported - Ukrainian (%)
Ancestries Reported - United States (%)
Ancestries Reported - Welsh (%)
Ancestries Reported - West Indian (%)
Ancestries Reported - Other (%)
Educational Attainment - No schooling completed (%)
Educational Attainment - Less than high school (%)
Educational Attainment - High school or equivalent (%)
Educational Attainment - Less than 1 year of college (%)
Educational Attainment - 1 or more years of college (%)
Educational Attainment - Associate degree (%)
Educational Attainment - Bachelor's degree (%)
Educational Attainment - Master's degree (%)
Educational Attainment - Professional school degree (%)
Educational Attainment - Doctorate degree (%)
School Enrollment - Nursery, preschool (%)
School Enrollment - Kindergarten (%)
School Enrollment - Grade 1 to 4 (%)
School Enrollment - Grade 5 to 8 (%)
School Enrollment - Grade 9 to 12 (%)
School Enrollment - College undergrad (%)
School Enrollment - Graduate or professional (%)
School Enrollment - Not enrolled in school (%)
School enrollment - Public schools (%)
School enrollment - Private schools (%)
School enrollment - Not enrolled (%)
Median number of rooms in houses and condos
Median number of rooms in apartments
Housing units lacking complete plumbing facilities (%)
Housing units lacking complete kitchen facilities (%)
Density of houses
Urban houses (%)
Rural houses (%)
Households with people 60 years and over (%)
Households with people 65 years and over (%)
Households with people 75 years and over (%)
Households with one or more nonrelatives (%)
Households with no nonrelatives (%)
Population in households (%)
Family households (%)
Nonfamily households (%)
Population in families (%)
Family households with own children (%)
Median number of bedrooms in owner occupied houses
Mean number of bedrooms in owner occupied houses
Median number of bedrooms in renter occupied houses
Mean number of bedrooms in renter occupied houses
Median number of vehichles in owner occupied houses
Mean number of vehichles in owner occupied houses
Median number of vehichles in renter occupied houses
Mean number of vehichles in renter occupied houses
Mortgage status - with mortgage (%)
Mortgage status - with second mortgage (%)
Mortgage status - with home equity loan (%)
Mortgage status - with both second mortgage and home equity loan (%)
Mortgage status - without a mortgage (%)
Average family size
Average family size - White
Average family size - Black or African American
Average family size - Asian
Average family size - Hispanic or Latino
Average family size - American Indian and Alaska Native
Average family size - Multirace
Average family size - Other Race
Geographical mobility - Same house 1 year ago (%)
Geographical mobility - Moved within same county (%)
Geographical mobility - Moved from different county within same state (%)
Geographical mobility - Moved from different state (%)
Geographical mobility - Moved from abroad (%)
Place of birth - Born in state of residence (%)
Place of birth - Born in other state (%)
Place of birth - Native, outside of US (%)
Place of birth - Foreign born (%)
Housing units in structures - 1, detached (%)
Housing units in structures - 1, attached (%)
Housing units in structures - 2 (%)
Housing units in structures - 3 or 4 (%)
Housing units in structures - 5 to 9 (%)
Housing units in structures - 10 to 19 (%)
Housing units in structures - 20 to 49 (%)
Housing units in structures - 50 or more (%)
Housing units in structures - Mobile home (%)
Housing units in structures - Boat, RV, van, etc. (%)
House/condo owner moved in on average (years ago)
Renter moved in on average (years ago)
Year householder moved into unit - Moved in 1999 to March 2000 (%)
Year householder moved into unit - Moved in 1995 to 1998 (%)
Year householder moved into unit - Moved in 1990 to 1994 (%)
Year householder moved into unit - Moved in 1980 to 1989 (%)
Year householder moved into unit - Moved in 1970 to 1979 (%)
Year householder moved into unit - Moved in 1969 or earlier (%)
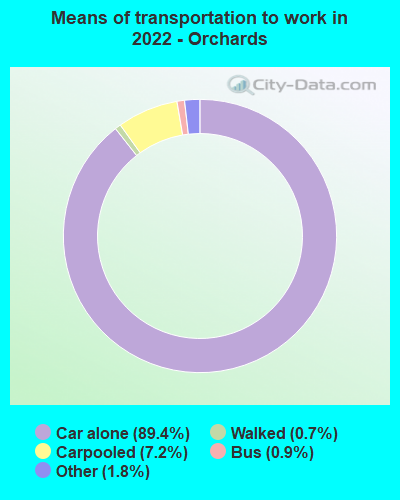
Means of transportation to work - Drove car alone (%)
Means of transportation to work - Carpooled (%)
Means of transportation to work - Public transportation (%)
Means of transportation to work - Bus or trolley bus (%)
Means of transportation to work - Streetcar or trolley car (%)
Means of transportation to work - Subway or elevated (%)
Means of transportation to work - Railroad (%)
Means of transportation to work - Ferryboat (%)
Means of transportation to work - Taxicab (%)
Means of transportation to work - Motorcycle (%)
Means of transportation to work - Bicycle (%)
Means of transportation to work - Walked (%)
Means of transportation to work - Other means (%)
Working at home (%)
Industry diversity
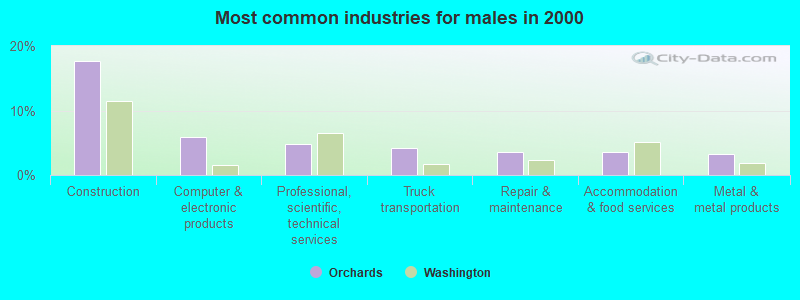
Most Common Industries - Agriculture, forestry, fishing and hunting, and mining (%)
Most Common Industries - Agriculture, forestry, fishing and hunting (%)
Most Common Industries - Mining, quarrying, and oil and gas extraction (%)
Most Common Industries - Construction (%)
Most Common Industries - Manufacturing (%)
Most Common Industries - Wholesale trade (%)
Most Common Industries - Retail trade (%)
Most Common Industries - Transportation and warehousing, and utilities (%)
Most Common Industries - Transportation and warehousing (%)
Most Common Industries - Utilities (%)
Most Common Industries - Information (%)
Most Common Industries - Finance and insurance, and real estate and rental and leasing (%)
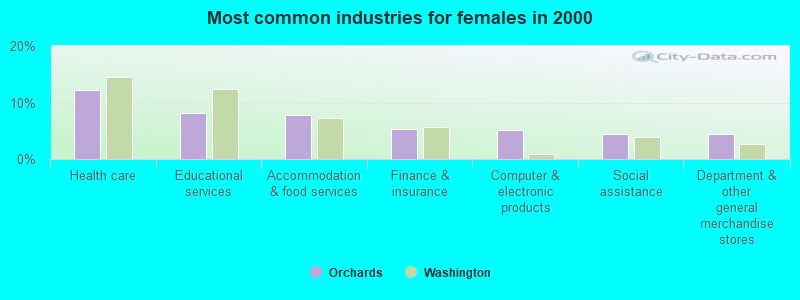
Most Common Industries - Finance and insurance (%)
Most Common Industries - Real estate and rental and leasing (%)
Most Common Industries - Professional, scientific, and management, and administrative and waste management services (%)
Most Common Industries - Professional, scientific, and technical services (%)
Most Common Industries - Management of companies and enterprises (%)
Most Common Industries - Administrative and support and waste management services (%)
Most Common Industries - Educational services, and health care and social assistance (%)
Most Common Industries - Educational services (%)
Most Common Industries - Health care and social assistance (%)
Most Common Industries - Arts, entertainment, and recreation, and accommodation and food services (%)
Most Common Industries - Arts, entertainment, and recreation (%)
Most Common Industries - Accommodation and food services (%)
Most Common Industries - Other services, except public administration (%)
Most Common Industries - Public administration (%)
Occupation diversity
Most Common Occupations - Management, business, science, and arts occupations (%)
Most Common Occupations - Management, business, and financial occupations (%)
Most Common Occupations - Management occupations (%)
Most Common Occupations - Business and financial operations occupations (%)
Most Common Occupations - Computer, engineering, and science occupations (%)
Most Common Occupations - Computer and mathematical occupations (%)
Most Common Occupations - Architecture and engineering occupations (%)
Most Common Occupations - Life, physical, and social science occupations (%)
Most Common Occupations - Education, legal, community service, arts, and media occupations (%)
Most Common Occupations - Community and social service occupations (%)
Most Common Occupations - Legal occupations (%)
Most Common Occupations - Education, training, and library occupations (%)
Most Common Occupations - Arts, design, entertainment, sports, and media occupations (%)
Most Common Occupations - Healthcare practitioners and technical occupations (%)
Most Common Occupations - Health diagnosing and treating practitioners and other technical occupations (%)
Most Common Occupations - Health technologists and technicians (%)
Most Common Occupations - Service occupations (%)
Most Common Occupations - Healthcare support occupations (%)
Most Common Occupations - Protective service occupations (%)
Most Common Occupations - Fire fighting and prevention, and other protective service workers including supervisors (%)
Most Common Occupations - Law enforcement workers including supervisors (%)
Most Common Occupations - Food preparation and serving related occupations (%)
Most Common Occupations - Building and grounds cleaning and maintenance occupations (%)
Most Common Occupations - Personal care and service occupations (%)
Most Common Occupations - Sales and office occupations (%)
Most Common Occupations - Sales and related occupations (%)
Most Common Occupations - Office and administrative support occupations (%)
Most Common Occupations - Natural resources, construction, and maintenance occupations (%)
Most Common Occupations - Farming, fishing, and forestry occupations (%)
Most Common Occupations - Construction and extraction occupations (%)
Most Common Occupations - Installation, maintenance, and repair occupations (%)
Most Common Occupations - Production, transportation, and material moving occupations (%)
Most Common Occupations - Production occupations (%)
Most Common Occupations - Transportation occupations (%)
Most Common Occupations - Material moving occupations (%)
People in Group quarters - Institutionalized population (%)
People in Group quarters - Correctional institutions (%)
People in Group quarters - Federal prisons and detention centers (%)
People in Group quarters - Halfway houses (%)
People in Group quarters - Local jails and other confinement facilities (including police lockups) (%)
People in Group quarters - Military disciplinary barracks (%)
People in Group quarters - State prisons (%)
People in Group quarters - Other types of correctional institutions (%)
People in Group quarters - Nursing homes (%)
People in Group quarters - Hospitals/wards, hospices, and schools for the handicapped (%)
People in Group quarters - Hospitals/wards and hospices for chronically ill (%)
People in Group quarters - Hospices or homes for chronically ill (%)
People in Group quarters - Military hospitals or wards for chronically ill (%)
People in Group quarters - Other hospitals or wards for chronically ill (%)
People in Group quarters - Hospitals or wards for drug/alcohol abuse (%)
People in Group quarters - Mental (Psychiatric) hospitals or wards (%)
People in Group quarters - Schools, hospitals, or wards for the mentally retarded (%)
People in Group quarters - Schools, hospitals, or wards for the physically handicapped (%)
People in Group quarters - Institutions for the deaf (%)
People in Group quarters - Institutions for the blind (%)
People in Group quarters - Orthopedic wards and institutions for the physically handicapped (%)
People in Group quarters - Wards in general hospitals for patients who have no usual home elsewhere (%)
People in Group quarters - Wards in military hospitals for patients who have no usual home elsewhere (%)
People in Group quarters - Juvenile institutions (%)
People in Group quarters - Long-term care (%)
People in Group quarters - Homes for abused, dependent, and neglected children (%)
People in Group quarters - Residential treatment centers for emotionally disturbed children (%)
People in Group quarters - Training schools for juvenile delinquents (%)
People in Group quarters - Short-term care, detention or diagnostic centers for delinquent children (%)
People in Group quarters - Type of juvenile institution unknown (%)
People in Group quarters - Noninstitutionalized population (%)
People in Group quarters - College dormitories (includes college quarters off campus) (%)
People in Group quarters - Military quarters (%)
People in Group quarters - On base (%)
People in Group quarters - Barracks, unaccompanied personnel housing (UPH), (Enlisted/Officer), ;and similar group living quarters for military personnel (%)
People in Group quarters - Transient quarters for temporary residents (%)
People in Group quarters - Military ships (%)
People in Group quarters - Group homes (%)
People in Group quarters - Homes or halfway houses for drug/alcohol abuse (%)
People in Group quarters - Homes for the mentally ill (%)
People in Group quarters - Homes for the mentally retarded (%)
People in Group quarters - Homes for the physically handicapped (%)
People in Group quarters - Other group homes (%)
People in Group quarters - Religious group quarters (%)
People in Group quarters - Dormitories (%)
People in Group quarters - Agriculture workers' dormitories on farms (%)
People in Group quarters - Job Corps and vocational training facilities (%)
People in Group quarters - Other workers' dormitories (%)
People in Group quarters - Crews of maritime vessels (%)
People in Group quarters - Other nonhousehold living situations (%)
People in Group quarters - Other noninstitutional group quarters (%)
Residents speaking English at home (%)
Residents speaking English at home - Born in the United States (%)
Residents speaking English at home - Native, born elsewhere (%)
Residents speaking English at home - Foreign born (%)
Residents speaking Spanish at home (%)
Residents speaking Spanish at home - Born in the United States (%)
Residents speaking Spanish at home - Native, born elsewhere (%)
Residents speaking Spanish at home - Foreign born (%)
Residents speaking other language at home (%)
Residents speaking other language at home - Born in the United States (%)
Residents speaking other language at home - Native, born elsewhere (%)
Residents speaking other language at home - Foreign born (%)
Class of Workers - Employee of private company (%)
Class of Workers - Self-employed in own incorporated business (%)
Class of Workers - Private not-for-profit wage and salary workers (%)
Class of Workers - Local government workers (%)
Class of Workers - State government workers (%)
Class of Workers - Federal government workers (%)
Class of Workers - Self-employed workers in own not incorporated business and Unpaid family workers (%)
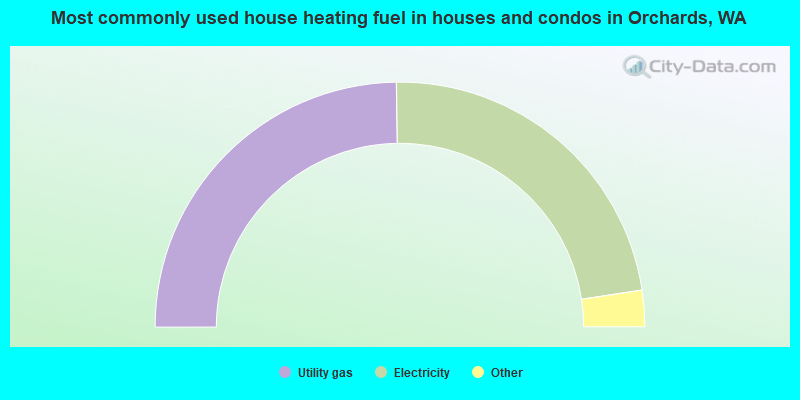
House heating fuel used in houses and condos - Utility gas (%)
House heating fuel used in houses and condos - Bottled, tank, or LP gas (%)
House heating fuel used in houses and condos - Electricity (%)
House heating fuel used in houses and condos - Fuel oil, kerosene, etc. (%)
House heating fuel used in houses and condos - Coal or coke (%)
House heating fuel used in houses and condos - Wood (%)
House heating fuel used in houses and condos - Solar energy (%)
House heating fuel used in houses and condos - Other fuel (%)
House heating fuel used in houses and condos - No fuel used (%)
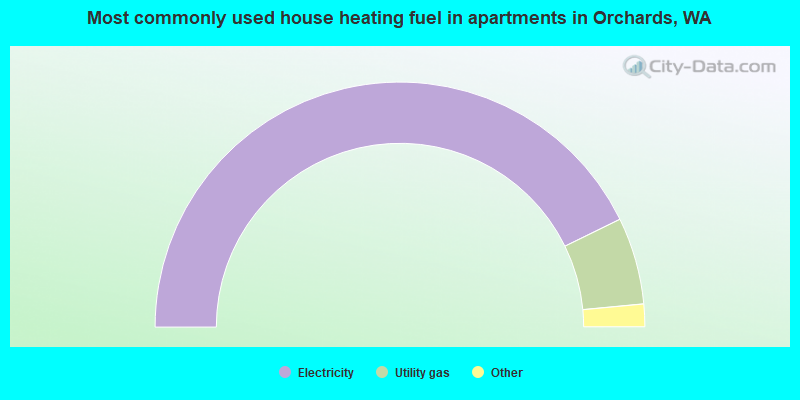
House heating fuel used in apartments - Utility gas (%)
House heating fuel used in apartments - Bottled, tank, or LP gas (%)
House heating fuel used in apartments - Electricity (%)
House heating fuel used in apartments - Fuel oil, kerosene, etc. (%)
House heating fuel used in apartments - Coal or coke (%)
House heating fuel used in apartments - Wood (%)
House heating fuel used in apartments - Solar energy (%)
House heating fuel used in apartments - Other fuel (%)
House heating fuel used in apartments - No fuel used (%)
Armed forces status - In Armed Forces (%)
Armed forces status - Civilian (%)
Armed forces status - Civilian - Veteran (%)
Armed forces status - Civilian - Nonveteran (%)
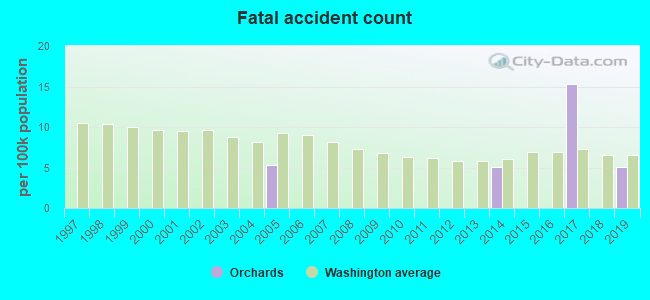
Fatal accidents locations in years 2005-2021
Fatal accidents locations in 2005
Fatal accidents locations in 2006
Fatal accidents locations in 2007
Fatal accidents locations in 2008
Fatal accidents locations in 2009
Fatal accidents locations in 2010
Fatal accidents locations in 2011
Fatal accidents locations in 2012
Fatal accidents locations in 2013
Fatal accidents locations in 2014
Fatal accidents locations in 2015
Fatal accidents locations in 2016
Fatal accidents locations in 2017
Fatal accidents locations in 2018
Fatal accidents locations in 2019
Fatal accidents locations in 2020
Fatal accidents locations in 2021
Alcohol use - People drinking some alcohol every month (%)
Alcohol use - People not drinking at all (%)
Alcohol use - Average days/month drinking alcohol
Alcohol use - Average drinks/week
Alcohol use - Average days/year people drink much
Audiometry - Average condition of hearing (%)
Audiometry - People that can hear a whisper from across a quiet room (%)
Audiometry - People that can hear normal voice from across a quiet room (%)
Audiometry - Ears ringing, roaring, buzzing (%)
Audiometry - Had a job exposure to loud noise (%)
Audiometry - Had off-work exposure to loud noise (%)
Blood Pressure & Cholesterol - Has high blood pressure (%)
Blood Pressure & Cholesterol - Checking blood pressure at home (%)
Blood Pressure & Cholesterol - Frequently checking blood cholesterol (%)
Blood Pressure & Cholesterol - Has high cholesterol level (%)
Consumer Behavior - Money monthly spent on food at supermarket/grocery store
Consumer Behavior - Money monthly spent on food at other stores
Consumer Behavior - Money monthly spent on eating out
Consumer Behavior - Money monthly spent on carryout/delivered foods
Consumer Behavior - Income spent on food at supermarket/grocery store (%)
Consumer Behavior - Income spent on food at other stores (%)
Consumer Behavior - Income spent on eating out (%)
Consumer Behavior - Income spent on carryout/delivered foods (%)
Current Health Status - General health condition (%)
Current Health Status - Blood donors (%)
Current Health Status - Has blood ever tested for HIV virus (%)
Current Health Status - Left-handed people (%)
Dermatology - People using sunscreen (%)
Diabetes - Diabetics (%)
Diabetes - Had a blood test for high blood sugar (%)
Diabetes - People taking insulin (%)
Diet Behavior & Nutrition - Diet health (%)
Diet Behavior & Nutrition - Milk product consumption (# of products/month)
Diet Behavior & Nutrition - Meals not home prepared (#/week)
Diet Behavior & Nutrition - Meals from fast food or pizza place (#/week)
Diet Behavior & Nutrition - Ready-to-eat foods (#/month)
Diet Behavior & Nutrition - Frozen meals/pizza (#/month)
Drug Use - People that ever used marijuana or hashish (%)
Drug Use - Ever used hard drugs (%)
Drug Use - Ever used any form of cocaine (%)
Drug Use - Ever used heroin (%)
Drug Use - Ever used methamphetamine (%)
Health Insurance - People covered by health insurance (%)
Kidney Conditions-Urology - Avg. # of times urinating at night
Medical Conditions - People with asthma (%)
Medical Conditions - People with anemia (%)
Medical Conditions - People with psoriasis (%)
Medical Conditions - People with overweight (%)
Medical Conditions - Elderly people having difficulties in thinking or remembering (%)
Medical Conditions - People who ever received blood transfusion (%)
Medical Conditions - People having trouble seeing even with glass/contacts (%)
Medical Conditions - People with arthritis (%)
Medical Conditions - People with gout (%)
Medical Conditions - People with congestive heart failure (%)
Medical Conditions - People with coronary heart disease (%)
Medical Conditions - People with angina pectoris (%)
Medical Conditions - People who ever had heart attack (%)
Medical Conditions - People who ever had stroke (%)
Medical Conditions - People with emphysema (%)
Medical Conditions - People with thyroid problem (%)
Medical Conditions - People with chronic bronchitis (%)
Medical Conditions - People with any liver condition (%)
Medical Conditions - People who ever had cancer or malignancy (%)
Mental Health - People who have little interest in doing things (%)
Mental Health - People feeling down, depressed, or hopeless (%)
Mental Health - People who have trouble sleeping or sleeping too much (%)
Mental Health - People feeling tired or having little energy (%)
Mental Health - People with poor appetite or overeating (%)
Mental Health - People feeling bad about themself (%)
Mental Health - People who have trouble concentrating on things (%)
Mental Health - People moving or speaking slowly or too fast (%)
Mental Health - People having thoughts they would be better off dead (%)
Oral Health - Average years since last visit a dentist
Oral Health - People embarrassed because of mouth (%)
Oral Health - People with gum disease (%)
Oral Health - General health of teeth and gums (%)
Oral Health - Average days a week using dental floss/device
Oral Health - Average days a week using mouthwash for dental problem
Oral Health - Average number of teeth
Pesticide Use - Households using pesticides to control insects (%)
Pesticide Use - Households using pesticides to kill weeds (%)
Physical Activity - People doing vigorous-intensity work activities (%)
Physical Activity - People doing moderate-intensity work activities (%)
Physical Activity - People walking or bicycling (%)
Physical Activity - People doing vigorous-intensity recreational activities (%)
Physical Activity - People doing moderate-intensity recreational activities (%)
Physical Activity - Average hours a day doing sedentary activities
Physical Activity - Average hours a day watching TV or videos
Physical Activity - Average hours a day using computer
Physical Functioning - People having limitations keeping them from working (%)
Physical Functioning - People limited in amount of work they can do (%)
Physical Functioning - People that need special equipment to walk (%)
Physical Functioning - People experiencing confusion/memory problems (%)
Physical Functioning - People requiring special healthcare equipment (%)
Prescription Medications - Average number of prescription medicines taking
Preventive Aspirin Use - Adults 40+ taking low-dose aspirin (%)
Reproductive Health - Vaginal deliveries (%)
Reproductive Health - Cesarean deliveries (%)
Reproductive Health - Deliveries resulted in a live birth (%)
Reproductive Health - Pregnancies resulted in a delivery (%)
Reproductive Health - Women breastfeeding newborns (%)
Reproductive Health - Women that had a hysterectomy (%)
Reproductive Health - Women that had both ovaries removed (%)
Reproductive Health - Women that have ever taken birth control pills (%)
Reproductive Health - Women taking birth control pills (%)
Reproductive Health - Women that have ever used Depo-Provera or injectables (%)
Reproductive Health - Women that have ever used female hormones (%)
Sexual Behavior - People 18+ that ever had sex (vaginal, anal, or oral) (%)
Sexual Behavior - Males 18+ that ever had vaginal sex with a woman (%)
Sexual Behavior - Males 18+ that ever performed oral sex on a woman (%)
Sexual Behavior - Males 18+ that ever had anal sex with a woman (%)
Sexual Behavior - Males 18+ that ever had any sex with a man (%)
Sexual Behavior - Females 18+ that ever had vaginal sex with a man (%)
Sexual Behavior - Females 18+ that ever performed oral sex on a man (%)
Sexual Behavior - Females 18+ that ever had anal sex with a man (%)
Sexual Behavior - Females 18+ that ever had any kind of sex with a woman (%)
Sexual Behavior - Average age people first had sex
Sexual Behavior - Average number of female sex partners in lifetime (males 18+)
Sexual Behavior - Average number of female vaginal sex partners in lifetime (males 18+)
Sexual Behavior - Average age people first performed oral sex on a woman (18+)
Sexual Behavior - Average number of woman performed oral sex on in lifetime (18+)
Sexual Behavior - Average number of male sex partners in lifetime (males 18+)
Sexual Behavior - Average number of male anal sex partners in lifetime (males 18+)
Sexual Behavior - Average age people first performed oral sex on a man (18+)
Sexual Behavior - Average number of male oral sex partners in lifetime (18+)
Sexual Behavior - People using protection when performing oral sex (%)
Sexual Behavior - Average number of times people have vaginal or anal sex a year
Sexual Behavior - People having sex without condom (%)
Sexual Behavior - Average number of male sex partners in lifetime (females 18+)
Sexual Behavior - Average number of male vaginal sex partners in lifetime (females 18+)
Sexual Behavior - Average number of female sex partners in lifetime (females 18+)
Sexual Behavior - Circumcised males 18+ (%)
Sleep Disorders - Average hours sleeping at night
Sleep Disorders - People that has trouble sleeping (%)
Smoking-Cigarette Use - People smoking cigarettes (%)
Taste & Smell - People 40+ having problems with smell (%)
Taste & Smell - People 40+ having problems with taste (%)
Taste & Smell - People 40+ that ever had wisdom teeth removed (%)
Taste & Smell - People 40+ that ever had tonsils teeth removed (%)
Taste & Smell - People 40+ that ever had a loss of consciousness because of a head injury (%)
Taste & Smell - People 40+ that ever had a broken nose or other serious injury to face or skull (%)
Taste & Smell - People 40+ that ever had two or more sinus infections (%)
Weight - Average height (inches)
Weight - Average weight (pounds)
Weight - Average BMI
Weight - People that are obese (%)
Weight - People that ever were obese (%)
Weight - People trying to lose weight (%)
Latest news from Orchards, WA collected exclusively by city-data.com from local newspapers, TV, and radio stations
Ancestries: American (8.7%), German (8.0%), Ukrainian (6.4%), Russian (6.2%), English (5.6%), Irish (5.0%).
Current Local Time:
Land area: 6.86 square miles.
Population density: 2,850 people per square mile (average).
3,782 residents are foreign born (5.6% Europe , 4.1% Asia , 2.4% Latin America ).
This place:
12.6%Washington:
14.9%
Median real estate property taxes paid for housing units with mortgages in 2022: $3,562 (0.8%)Median real estate property taxes paid for housing units with no mortgage in 2022: $3,282 (0.8%)
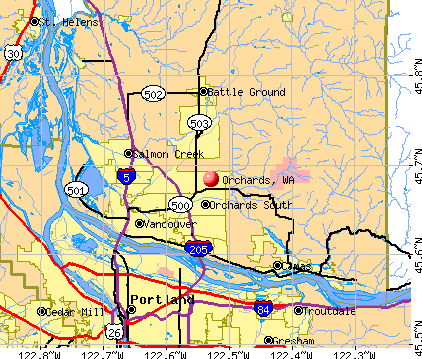
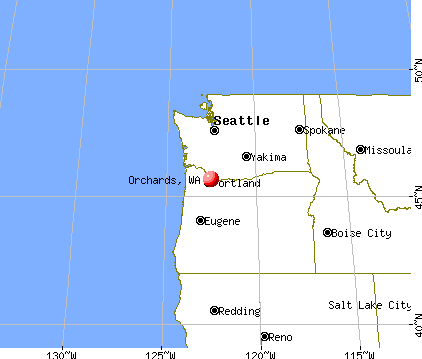
Nearest city with pop. 50,000+: Vancouver, WA
Nearest city with pop. 200,000+: Portland, OR
Nearest city with pop. 1,000,000+: Los Angeles, CA
Nearest cities:
Latitude: 45.68 N, Longitude: 122.53 W
Daytime population change due to commuting: -7,723 (-25.8%)Workers who live and work in this place: 2,518 (17.4%)
Area code commonly used in this area: 360
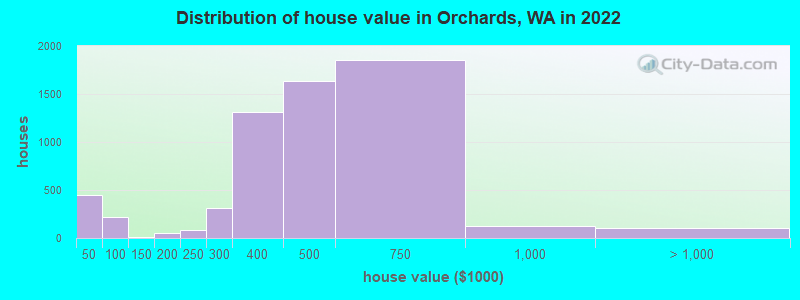
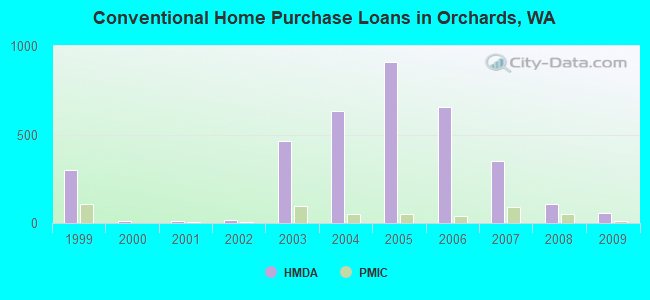
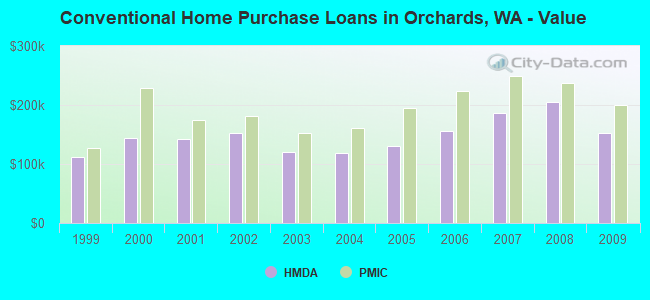
Property values in Orchards, WA
Unemployment in December 2023:
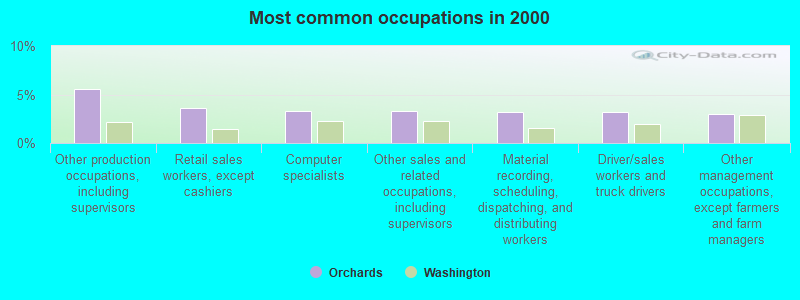
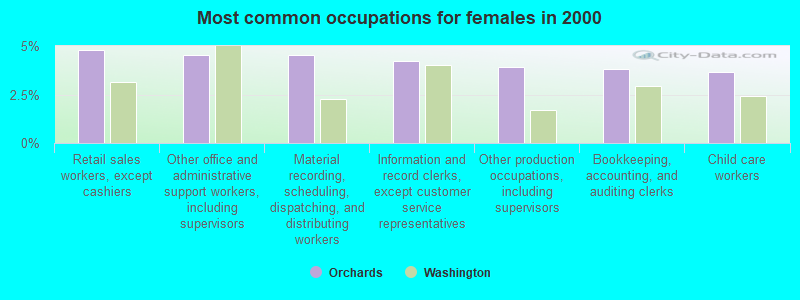
Most common occupations in Orchards, WA (%)
Both Males Females
Other production occupations, including supervisors (5.5%)
Retail sales workers, except cashiers (3.6%)
Computer specialists (3.3%)
Other sales and related occupations, including supervisors (3.3%)
Material recording, scheduling, dispatching, and distributing workers (3.2%)
Driver/sales workers and truck drivers (3.2%)
Other management occupations, except farmers and farm managers (3.0%)
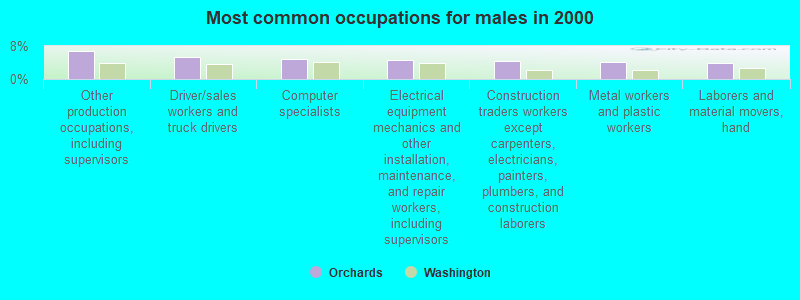
Other production occupations, including supervisors (6.9%)
Driver/sales workers and truck drivers (5.4%)
Computer specialists (4.8%)
Electrical equipment mechanics and other installation, maintenance, and repair workers, including supervisors (4.5%)
Construction traders workers except carpenters, electricians, painters, plumbers, and construction laborers (4.3%)
Metal workers and plastic workers (4.2%)
Laborers and material movers, hand (3.9%)
Retail sales workers, except cashiers (4.8%)
Other office and administrative support workers, including supervisors (4.6%)
Material recording, scheduling, dispatching, and distributing workers (4.6%)
Information and record clerks, except customer service representatives (4.2%)
Other production occupations, including supervisors (3.9%)
Bookkeeping, accounting, and auditing clerks (3.8%)
Child care workers (3.7%)
Earthquake activity:
Orchards-area historical earthquake activity is significantly above Washington state average. It is 1499% greater than the overall U.S. average. On 4/13/1949 at 19:55:42, a magnitude 7.0 (7.0 UK, Class: Major, Intensity: VIII - XII) earthquake occurred 108.3 miles away from the city center, causing $80,000,000 total damage On 2/28/2001 at 18:54:32, a magnitude 6.8 (6.5 MB, 6.6 MS, 6.8 MW, Class: Strong, Intensity: VII - IX) earthquake occurred 97.3 miles away from the city center, causing $2,000,000,000 total damage and $305,000,000 insured lossesOn 2/28/2001 at 18:54:32, a magnitude 6.8 (6.8 MD, Depth: 32.2 mi) earthquake occurred 101.8 miles away from Orchards center On 4/29/1965 at 15:28:43, a magnitude 6.6 (6.6 UK) earthquake occurred 113.3 miles away from Orchards center, causing $28,000,000 total damage On 1/31/1922 at 13:17:28, a magnitude 7.6 (7.6 UK) earthquake occurred 376.9 miles away from the city center On 11/8/1980 at 10:27:34, a magnitude 7.2 (6.2 MB, 7.2 MS, 7.2 MW, 7.0 ML) earthquake occurred 328.6 miles away from Orchards center Magnitude types: body-wave magnitude (MB), duration magnitude (MD), local magnitude (ML), surface-wave magnitude (MS), moment magnitude (MW) Natural disasters: The number of natural disasters in Clark County (13) is near the US average (15).Major Disasters (Presidential) Declared: 12Emergencies Declared: 1Floods: 7, Mudslides: 4, Storms: 4, Winter Storms: 4, Landslides: 3, Winds: 2, Earthquake: 1, Heavy Rain: 1, Hurricane: 1, Snow: 1, Tornado: 1, Volcanic Eruption: 1, Other: 1 (Note: some incidents may be assigned to more than one category). Hospitals and medical centers near Orchards: VANCOUVER DIALYSIS CENTER (Dialysis Facility, about 3 miles away; VANCOUVER, WA)
FORT VANCOUVER CONVALESCENT C (Nursing Home, about 5 miles away; VANCOUVER, WA)
PEACEHEALTH SOUTHWEST MEDICAL CENTER (about 5 miles away; VANCOUVER, WA)
EMERALD TERRACE NURSING CENTER (Nursing Home, about 5 miles away; VANCOUVER, WA)
PACIFIC SPECIALTY AND REHAB CARE (Nursing Home, about 5 miles away; VANCOUVER, WA)
CASCADE PARK CARE CENTER (Nursing Home, about 5 miles away; VANCOUVER, WA)
MEADOW GLADE MANOR (Nursing Home, about 6 miles away; BATTLE GROUND, WA)
Amtrak stations near Orchards: 9 miles: VANCOUVER (FOOT OF W. 11TH ST.) Services: ticket office, fully wheelchair accessible, enclosed waiting area, public restrooms, public payphones, vending machines, free short-term parking, free long-term parking, call for taxi service.
13 miles: PORTLAND (800 NW 6TH AVE.) Services: ticket office, fully wheelchair accessible, enclosed waiting area, public restrooms, public payphones, full-service food facilities, paid short-term parking, paid long-term parking, call for car rental service, taxi stand, intercity bus service, public transit connection.
Colleges/universities with over 2000 students nearest to Orchards:
Clark College (about 7 miles; Vancouver, WA ; Full-time enrollment: 9,330)
Concordia University-Portland (about 10 miles; Portland, OR ; FT enrollment: 3,996)
University of Portland (about 13 miles; Portland, OR ; FT enrollment: 4,030)
Mt Hood Community College (about 14 miles; Gresham, OR ; FT enrollment: 11,847)
Portland State University (about 15 miles; Portland, OR ; FT enrollment: 21,450)
Lewis & Clark College (about 18 miles; Portland, OR ; FT enrollment: 2,864)
Portland Community College (about 20 miles; Portland, OR ; FT enrollment: 23,600)
Public elementary/middle school in Orchards:
See full list of schools located in Orchards Clark County has a predicted average indoor radon screening level greater than 4 pCi/L (pico curies per liter) - Highest Potential Average household size: This place:
3.0 peopleWashington:
2.5 people
Percentage of family households: This place:
77.1%Whole state:
64.4%
Percentage of households with unmarried partners: This place:
8.2%Whole state:
7.7%
Likely homosexual households (counted as self-reported same-sex unmarried-partner households)
Lesbian couples: 0.4% of all households Gay men: 0.3% of all households
People in group quarters in Orchards in 2010:
55 people in group homes intended for adults
36 people in workers' group living quarters and job corps centers
7 people in in-patient hospice facilities
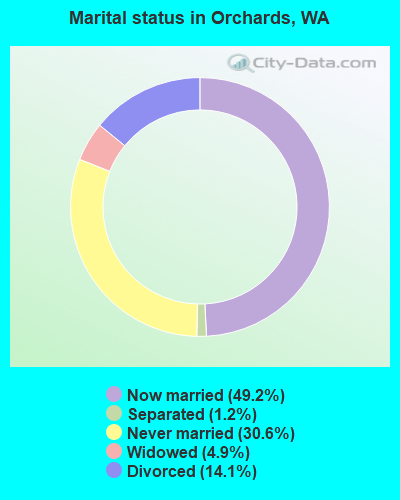
For population 15 years and over in Orchards:
Never married: 30.6%Now married: 49.2%Separated: 1.2%Widowed: 4.9%Divorced: 14.1% For population 25 years and over in Orchards:
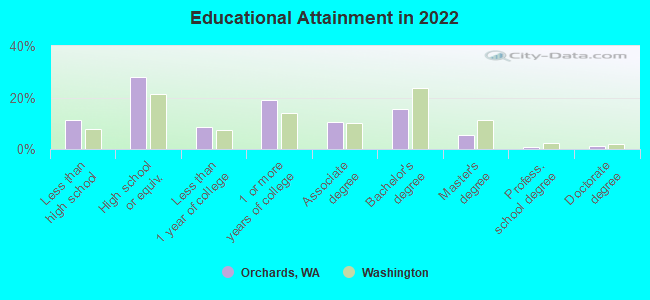
High school or higher: 89.8%Bachelor's degree or higher: 22.8%Graduate or professional degree: 7.2%Unemployed: 6.2%Mean travel time to work (commute): 21.8 minutes
Education Gini index (Inequality in education) Here:
12.0Washington average:
11.6
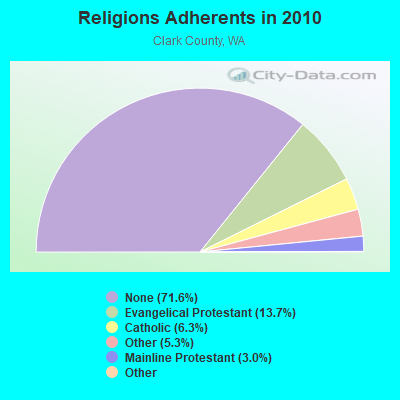
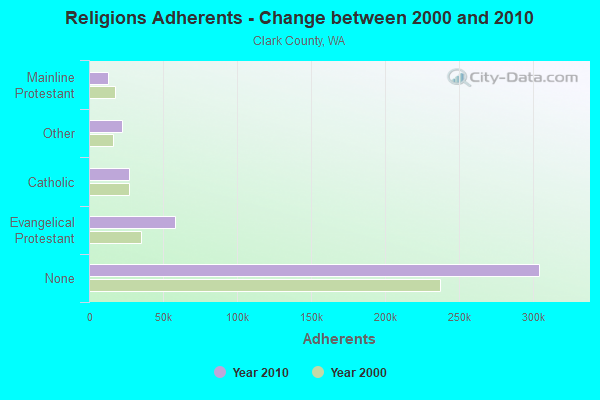
Religion statistics for Orchards, WA (based on Clark County data)
Religion Adherents Congregations Evangelical Protestant 58,413 191 Catholic 26,886 9 Other 22,590 60 Mainline Protestant 12,633 37 Black Protestant 378 2 Orthodox 61 1 None 304,402 -
Source: Clifford Grammich, Kirk Hadaway, Richard Houseal, Dale E.Jones, Alexei Krindatch, Richie Stanley and Richard H.Taylor. 2012. 2010 U.S.Religion Census: Religious Congregations & Membership Study. Association of Statisticians of American Religious Bodies. Jones, Dale E., et al. 2002. Congregations and Membership in the United States 2000. Nashville, TN: Glenmary Research Center. Graphs represent county-level data
Food Environment Statistics: Number of grocery stores : 46This county :
1.10 / 10,000 pop.Washington :
2.06 / 10,000 pop.
Number of supercenters and club stores : 11Clark County :
0.26 / 10,000 pop.Washington :
0.19 / 10,000 pop.
Number of convenience stores (no gas) : 39Here :
0.94 / 10,000 pop.Washington :
1.18 / 10,000 pop.
Number of convenience stores (with gas) : 93Clark County :
2.23 / 10,000 pop.State :
2.67 / 10,000 pop.
Number of full-service restaurants : 239Clark County :
5.74 / 10,000 pop.Washington :
8.26 / 10,000 pop.
Adult diabetes rate : This county :
8.2%Washington :
7.7%
Adult obesity rate : Clark County :
27.6%State :
25.7%
Low-income preschool obesity rate : Clark County :
13.7%Washington :
13.9%
Health and Nutrition: Healthy diet rate : This city:
48.7%Washington:
49.9%
Average overall health of teeth and gums : Orchards:
46.7%State:
47.2%
Average BMI : Orchards:
28.7Washington:
28.4
People feeling badly about themselves : Orchards:
21.3%Washington:
20.9%
People not drinking alcohol at all : Orchards:
10.0%Washington:
10.5%
Average hours sleeping at night : Orchards:
6.8Washington:
6.8
Overweight people : This city:
32.7%Washington:
32.8%
General health condition : Here:
57.7%Washington:
56.8%
Average condition of hearing : Orchards:
81.3%Washington:
79.4%
More about Health and Nutrition of Orchards, WA Residents
7.99% of this county's 2021 resident taxpayers lived in other counties in 2020 ($91,627 average adjusted gross income )
Here:
7.99%Washington average:
7.53%
0.03% of residents moved from foreign countries ($212 average AGI )Clark County:
0.03%Washington average:
0.05%
Top counties from which taxpayers relocated into this county between 2020 and 2021:
6.69% of this county's 2020 resident taxpayers moved to other counties in 2021 ($81,466 average adjusted gross income )
Here:
6.69%Washington average:
7.40%
0.01% of residents moved to foreign countries ($99 average AGI )Clark County:
0.01%Washington average:
0.04%
Top counties to which taxpayers relocated from this county between 2020 and 2021: Businesses in Orchards, WA
Baskin-Robbins: 1KFC: 1UPS: 1 Strongest AM radio stations in Orchards:
KPAM (860 AM; 50 kW; TROUTDALE, OR; Owner: PAMPLIN BROADCASTING-OREGON, INC.)
KKAD (1550 AM; 50 kW; VANCOUVER, WA; Owner: PAMPLIN BROADCASTING-WASHINGTON, INC)
KOTK (1080 AM; 50 kW; PORTLAND, OR; Owner: FISHER BROADCASTING - PORTLAND RADIO, L.L.C.)
KPOJ (620 AM; 50 kW; PORTLAND, OR; Owner: CITICASTERS LICENSES, L.P.)
KKGT (1150 AM; 5 kW; PORTLAND, OR; Owner: WESTERN BROADCASTING COMPANY)
KXL (750 AM; 50 kW; PORTLAND, OR; Owner: ROSE CITY RADIO CORPORATION)
KFXX (910 AM; 10 kW; VANCOUVER, WA; Owner: ENTERCOM PORTLAND LICENSE, LLC (DE))
KEX (1190 AM; 50 kW; PORTLAND, OR; Owner: CITICASTERS LICENSES, L.P.)
KKSN (1520 AM; 50 kW; OREGON CITY, OR; Owner: ENTERCOM PORTLAND LICENSE, LLC)
KDZR (1640 AM; 10 kW; LAKE OSWEGO, OR; Owner: ABC, INC.)
KUPL (970 AM; 5 kW; PORTLAND, OR; Owner: INFINITY RADIO OPERATIONS INC.)
KKSL (1290 AM; 10 kW; LAKE OSWEGO, OR; Owner: ABC, INC.)
KGUY (1010 AM; daytime; 4 kW; MILWAUKIE, OR; Owner: NORTHWEST RADIO BROADCASTING COMPANY)
Strongest FM radio stations in Orchards:
KRVO (105.9 FM; VANCOUVER, WA; Owner: CITICASTERS LICENSES, L.P.)
KINK (101.9 FM; PORTLAND, OR; Owner: INFINITY RADIO OPERATIONS INC.)
KKCW (103.3 FM; BEAVERTON, OR; Owner: CITICASTERS LICENSES, L.P.)
KOPB-FM (91.5 FM; PORTLAND, OR; Owner: OREGON PUBLIC BROADCASTING)
KPDQ-FM (93.7 FM; PORTLAND, OR; Owner: SALEM MEDIA OF OREGON, INC.)
KKRZ (100.3 FM; PORTLAND, OR; Owner: CITICASTERS LICENSES, L.P.)
KUFO-FM (101.1 FM; PORTLAND, OR; Owner: INFINITY RADIO OPERATIONS INC.)
KMHD (89.1 FM; GRESHAM, OR; Owner: MT. HOOD COMMUNITY COLLEGE DISTRICT)
KVMX (107.5 FM; BANKS, OR; Owner: INFINITY RADIO OPERATIONS INC.)
KLTH (106.7 FM; LAKE OSWEGO, OR; Owner: INIFINITY RADIO OF PORTLAND INC.)
KUPL-FM (98.7 FM; PORTLAND, OR; Owner: INFINITY RADIO OF PORTLAND INC.)
KBVM (88.3 FM; PORTLAND, OR; Owner: CATHOLIC BROADCASTING NORTHWEST, INC)
KBPS-FM (89.9 FM; PORTLAND, OR; Owner: SCHOOL DISTRICT #1, MULTNOMAH COUNTY, OR)
KNRK (94.7 FM; CAMAS, WA; Owner: ENTERCOM PORTLAND LICENSE, LLC (DE))
KFIS (104.1 FM; SCAPPOOSE, OR; Owner: CARON BROADCASTING, INC.)
KBOO (90.7 FM; PORTLAND, OR; Owner: THE KBOO FOUNDATION)
KWJJ-FM (99.5 FM; PORTLAND, OR; Owner: FISHER BROADCASTING - PORTLAND RADIO, L.L.C.)
KGON (92.3 FM; PORTLAND, OR; Owner: ENTERCOM PORTLAND LICENSE, LLC (DE))
KKSN-FM (97.1 FM; PORTLAND, OR; Owner: ENTERCOM PORTLAND LICENSE, LLC (DE))
KXJM (95.5 FM; PORTLAND, OR; Owner: ROSE CITY RADIO CORPORATION)
TV broadcast stations around Orchards:
KATU (Channel 2; PORTLAND, OR; Owner: FISHER BROADCASTING - PORTLAND TV, L.L.C.)
KPDX (Channel 49; VANCOUVER, WA; Owner: MEREDITH CORPORATION)
KPTV (Channel 12; PORTLAND, OR; Owner: MEREDITH CORPORATION)
K57IF (Channel 57; SALEM, OR; Owner: LaGRANDE BROADCASTING, INC.)
KOIN (Channel 6; PORTLAND, OR; Owner: EMMIS TELEVISION LICENSE CORPORATION)
KNMT (Channel 24; PORTLAND, OR; Owner: NATIONAL MINORITY T.V., INC.)
KGW (Channel 8; PORTLAND, OR; Owner: KING BROADCASTING COMPANY)
KOPB-TV (Channel 10; PORTLAND, OR; Owner: OREGON PUBLIC BROADCASTING)
KPXG-LP (Channel 54; PORTLAND, OR; Owner: PAXSON COMMUNICATIONS LICENSE COMPANY, LLC)
K14HN (Channel 14; VANCOUVER/CAMAS, WA; Owner: MEREDITH CORPORATION)
KWBP-LP (Channel 4; PORTLAND, OR; Owner: TRIBUNE BROADCASTING HOLDINGS, INC.)
KOXI-CA (Channel 19; CAMAS, WA; Owner: WATCHTV, INC.)
KORK-CA (Channel 35; PORTLAND, OR; Owner: WATCHTV, INC.)
K58CO (Channel 58; PORTLAND, OR; Owner: NORTHWEST CHRISTIAN BROADCASTING)
National Bridge Inventory (NBI) Statistics 4 Number of bridges23ft / 6.8m Total length $5,293,000 Total costs44,394 Total average daily traffic2,106 Total average daily truck traffic
FCC Registered Antenna Towers: 4
Terry C Miller, Orchards (Lat: 45.660278 Lon: -122.559444), Type: 91.4, Overall height: 91.4 m, Registrant: Washington State Department Of Transportation, Millert@wsdot.Wa.Gov, , 47359 Olymp-ia, Phone: (360) 705-7001 Terry C Miller, Orchards (Lat: 45.660278 Lon: -122.559444), Type: 91.4, Overall height: 91.4 m, Registrant: Washington State Department Of Transportation, Millert@wsdot.Wa.Gov, , 47359 Olymp-ia, Phone: (360) 705-7019 Terry C Miller, Orchards (Lat: 45.660278 Lon: -122.559444), Type: 91.4, Overall height: 91.4 m, Registrant: Washington State Department Of Transportation, Radio_operations@wsdot.Wa.Gov, , 47359 Olymp-ia, Phone: (360) 705-7019 Timothy S McDowell, Orchards (Lat: 45.660278 Lon: -122.559444), Type: 91.4, Structure height: 53011 m, Overall height: 91.4 m, Registrant: State Of; Department Of Transportation Washington, Radio_operations@wsdot.Wa.Gov, , 47359 Tumwa-ter, Phone: (360) 705-7028 FCC Registered Microwave Towers: 4
Orchards, Orchards (Lat: 45.660278 Lon: -122.559444), Type: Tower, Structure height: 91.4 m, Call Sign: WPVT228, Licensee ID: L00007876, Assigned Frequencies: 943.375 MHz, 943.175 MHz, 942.975 MHz, Grant Date: 08/14/2002, Expiration Date: 08/14/2012, Cancellation Date: 07/19/2006, Certifier: Terry C Miller, Registrant: Washington, State; Dept. Of Transportation, 724 Quince Street Se, Olympia, WA 98504-7359, Phone: (360) 705-7001, Fax: (360) 705-6873, Email:
OR-POR333A, 12511 Ne 4th Plain (Lat: 45.668222 Lon: -122.544611), Type: Pole, Structure height: 45.1 m, Call Sign: WQIR618, Assigned Frequencies: 23075.0 MHz, 19525.0 MHz, 19575.0 MHz, 23175.0 MHz, 19625.0 MHz, 19675.0 MHz, Grant Date: 04/23/2008, Expiration Date: 04/23/2018, Cancellation Date: 10/27/2017, Certifier: Nadja S Sodos-Wallace, Registrant: Sprint Corporation, 12502 Sunrise Valley Drive, M/S: Varesa0209, Reston, VA 20196, Phone: (800) 572-8256, Fax: (703) 433-4483, Email:
AERODROME, 12414 Ne 99th Street (Lat: 45.693694 Lon: -122.544056), Type: Pole, Structure height: 34 m, Call Sign: WQQW332, Assigned Frequencies: 6004.50 MHz, 6063.80 MHz, 6004.50 MHz, 6004.50 MHz, 6004.50 MHz, 6004.50 MHz, 6004.50 MHz, 6063.80 MHz, 6063.80 MHz, 6063.80 MHz, 6063.80 MHz, 6063.80 MHz, Grant Date: 02/07/2023, Expiration Date: 03/13/2033, Certifier: Gregory M Romano, Registrant: Verizon, 5055 Northpointe Pkwy, Alpharetta, GA 30022, Phone: (770) 797-1070, Email:
WSP DOT, Orchards (Lat: 45.660278 Lon: -122.559444), Type: Mast, Structure height: 91.4 m, Call Sign: WQWW942, Assigned Frequencies: 11055.0 MHz, 6123.10 MHz, Grant Date: 12/14/2015, Expiration Date: 12/14/2025, Certifier: Dave Fuller, Registrant: Adcomm Engineering Company, 3929 184th Place Se, Bothell, WA 98012, Phone: (425) 821-8827, Fax: (425) 488-3952, Email:
Home Mortgage Disclosure Act Aggregated Statistics For Year 2009(Based on 2 full and 3 partial tracts) A) FHA, FSA/RHS & VA B) Conventional C) Refinancings D) Home Improvement Loans F) Non-occupant Loans on G) Loans On Manufactured Number Average Value Number Average Value Number Average Value Number Average Value Number Average Value Number Average Value
LOANS ORIGINATED 126 $194,143 58 $151,994 472 $176,690 10 $110,065 29 $141,950 6 $108,368 APPLICATIONS APPROVED, NOT ACCEPTED 6 $198,293 8 $178,448 64 $183,049 5 $45,682 4 $144,745 1 $114,070 APPLICATIONS DENIED 25 $182,735 27 $179,515 212 $182,347 18 $66,856 13 $140,933 7 $63,669 APPLICATIONS WITHDRAWN 14 $180,256 6 $182,712 128 $189,218 3 $85,377 7 $154,771 1 $121,080 FILES CLOSED FOR INCOMPLETENESS 2 $218,335 1 $111,750 23 $162,820 1 $359,820 1 $183,240 1 $51,770
Aggregated Statistics For Year 2008(Based on 2 full and 3 partial tracts) A) FHA, FSA/RHS & VA B) Conventional C) Refinancings D) Home Improvement Loans F) Non-occupant Loans on G) Loans On Manufactured Number Average Value Number Average Value Number Average Value Number Average Value Number Average Value Number Average Value
LOANS ORIGINATED 120 $216,700 107 $205,825 372 $186,129 27 $99,600 51 $179,047 7 $129,036 APPLICATIONS APPROVED, NOT ACCEPTED 8 $218,291 25 $219,415 105 $190,754 8 $160,305 14 $196,366 4 $41,765 APPLICATIONS DENIED 24 $219,372 39 $190,371 374 $203,677 27 $77,174 21 $153,912 9 $101,527 APPLICATIONS WITHDRAWN 17 $208,719 16 $214,316 107 $188,327 7 $79,806 8 $179,839 2 $72,005 FILES CLOSED FOR INCOMPLETENESS 2 $195,685 2 $164,535 22 $229,197 1 $118,520 2 $177,955 2 $105,105
Aggregated Statistics For Year 2007(Based on 2 full and 3 partial tracts) A) FHA, FSA/RHS & VA B) Conventional C) Refinancings D) Home Improvement Loans E) Loans on Dwellings For 5+ Families F) Non-occupant Loans on G) Loans On Manufactured Number Average Value Number Average Value Number Average Value Number Average Value Number Average Value Number Average Value Number Average Value
LOANS ORIGINATED 26 $220,767 348 $185,990 582 $175,673 54 $99,622 2 $11,940,000 91 $186,801 14 $117,354 APPLICATIONS APPROVED, NOT ACCEPTED 2 $273,230 73 $165,313 163 $177,897 8 $167,784 0 $0 21 $159,643 8 $91,511 APPLICATIONS DENIED 2 $332,990 109 $190,570 427 $194,805 54 $109,769 0 $0 37 $190,913 14 $89,758 APPLICATIONS WITHDRAWN 1 $220,000 43 $184,592 185 $190,605 13 $121,083 0 $0 19 $204,746 1 $241,150 FILES CLOSED FOR INCOMPLETENESS 0 $0 4 $213,168 45 $214,049 4 $47,770 0 $0 1 $335,040 0 $0
Aggregated Statistics For Year 2006(Based on 2 full and 3 partial tracts) A) FHA, FSA/RHS & VA B) Conventional C) Refinancings D) Home Improvement Loans F) Non-occupant Loans on G) Loans On Manufactured Number Average Value Number Average Value Number Average Value Number Average Value Number Average Value Number Average Value
LOANS ORIGINATED 31 $214,485 657 $156,453 876 $159,182 75 $92,899 156 $177,348 10 $112,007 APPLICATIONS APPROVED, NOT ACCEPTED 2 $300,725 115 $148,544 191 $161,319 14 $97,720 25 $174,994 6 $78,973 APPLICATIONS DENIED 5 $189,126 177 $148,359 401 $175,994 55 $90,373 43 $184,643 15 $133,212 APPLICATIONS WITHDRAWN 3 $218,683 95 $152,239 234 $174,574 18 $113,577 22 $132,395 2 $145,165 FILES CLOSED FOR INCOMPLETENESS 1 $172,000 16 $168,198 72 $179,816 0 $0 3 $162,303 1 $172,000
Aggregated Statistics For Year 2005(Based on 2 full and 3 partial tracts) A) FHA, FSA/RHS & VA B) Conventional C) Refinancings D) Home Improvement Loans F) Non-occupant Loans on G) Loans On Manufactured Number Average Value Number Average Value Number Average Value Number Average Value Number Average Value Number Average Value
LOANS ORIGINATED 48 $186,149 910 $130,032 989 $142,787 49 $108,985 165 $139,118 13 $92,674 APPLICATIONS APPROVED, NOT ACCEPTED 4 $174,812 164 $124,463 171 $136,074 20 $73,927 23 $134,601 9 $100,402 APPLICATIONS DENIED 2 $171,115 203 $123,059 479 $149,750 76 $60,801 51 $138,508 19 $81,429 APPLICATIONS WITHDRAWN 5 $204,616 138 $135,656 345 $145,398 36 $143,023 41 $122,443 2 $125,545 FILES CLOSED FOR INCOMPLETENESS 1 $271,780 18 $118,450 129 $160,140 3 $84,353 5 $118,896 1 $113,630
Aggregated Statistics For Year 2004(Based on 2 full and 3 partial tracts) A) FHA, FSA/RHS & VA B) Conventional C) Refinancings D) Home Improvement Loans E) Loans on Dwellings For 5+ Families F) Non-occupant Loans on G) Loans On Manufactured Number Average Value Number Average Value Number Average Value Number Average Value Number Average Value Number Average Value Number Average Value
LOANS ORIGINATED 94 $162,873 634 $118,228 803 $130,414 35 $66,663 1 $266,000 102 $120,224 11 $83,412 APPLICATIONS APPROVED, NOT ACCEPTED 11 $161,331 92 $127,296 187 $132,333 11 $29,735 0 $0 12 $183,405 7 $57,411 APPLICATIONS DENIED 14 $147,726 102 $104,755 373 $138,505 70 $38,791 0 $0 15 $106,383 12 $101,909 APPLICATIONS WITHDRAWN 7 $141,399 64 $115,071 325 $132,620 20 $61,376 0 $0 15 $118,811 4 $92,022 FILES CLOSED FOR INCOMPLETENESS 1 $163,290 15 $140,904 62 $145,970 3 $31,077 0 $0 3 $164,720 0 $0
Aggregated Statistics For Year 2003(Based on 2 full and 3 partial tracts) A) FHA, FSA/RHS & VA B) Conventional C) Refinancings D) Home Improvement Loans F) Non-occupant Loans on Number Average Value Number Average Value Number Average Value Number Average Value Number Average Value
LOANS ORIGINATED 147 $149,690 462 $120,079 1,512 $124,477 38 $25,443 124 $104,673 APPLICATIONS APPROVED, NOT ACCEPTED 12 $138,222 58 $113,864 207 $124,398 12 $22,956 17 $114,282 APPLICATIONS DENIED 15 $140,835 76 $111,498 436 $126,009 47 $33,251 28 $104,219 APPLICATIONS WITHDRAWN 7 $149,029 46 $120,569 301 $132,203 13 $23,804 20 $107,450 FILES CLOSED FOR INCOMPLETENESS 0 $0 14 $108,571 57 $126,477 3 $18,770 4 $103,128
Aggregated Statistics For Year 2002(Based on 1 partial tract) A) FHA, FSA/RHS & VA B) Conventional C) Refinancings D) Home Improvement Loans F) Non-occupant Loans on Number Average Value Number Average Value Number Average Value Number Average Value Number Average Value
LOANS ORIGINATED 5 $161,792 15 $153,184 41 $158,111 1 $42,160 3 $105,877 APPLICATIONS APPROVED, NOT ACCEPTED 0 $0 2 $172,440 5 $168,838 1 $13,050 0 $0 APPLICATIONS DENIED 0 $0 2 $93,325 11 $126,577 1 $15,020 1 $113,650 APPLICATIONS WITHDRAWN 0 $0 1 $168,170 9 $169,361 0 $0 0 $0 FILES CLOSED FOR INCOMPLETENESS 0 $0 1 $78,770 2 $228,920 0 $0 0 $0
Aggregated Statistics For Year 2001(Based on 1 partial tract) A) FHA, FSA/RHS & VA B) Conventional C) Refinancings D) Home Improvement Loans F) Non-occupant Loans on Number Average Value Number Average Value Number Average Value Number Average Value Number Average Value
LOANS ORIGINATED 6 $155,675 12 $142,373 31 $155,038 4 $25,265 1 $201,780 APPLICATIONS APPROVED, NOT ACCEPTED 1 $123,700 1 $257,680 4 $131,122 0 $0 0 $0 APPLICATIONS DENIED 1 $95,520 1 $129,590 8 $146,295 1 $10,160 0 $0 APPLICATIONS WITHDRAWN 0 $0 1 $219,220 6 $151,363 0 $0 0 $0 FILES CLOSED FOR INCOMPLETENESS 0 $0 0 $0 1 $115,380 0 $0 0 $0
Aggregated Statistics For Year 2000(Based on 1 partial tract) A) FHA, FSA/RHS & VA B) Conventional C) Refinancings D) Home Improvement Loans F) Non-occupant Loans on Number Average Value Number Average Value Number Average Value Number Average Value Number Average Value
LOANS ORIGINATED 2 $183,355 13 $143,353 7 $143,121 2 $31,185 1 $115,270 APPLICATIONS APPROVED, NOT ACCEPTED 0 $0 3 $104,797 3 $128,207 1 $11,550 0 $0 APPLICATIONS DENIED 0 $0 2 $90,785 4 $111,052 1 $54,980 0 $0 APPLICATIONS WITHDRAWN 0 $0 1 $254,680 2 $165,685 0 $0 0 $0 FILES CLOSED FOR INCOMPLETENESS 0 $0 0 $0 0 $0 0 $0 0 $0
Aggregated Statistics For Year 1999(Based on 1 full and 3 partial tracts) A) FHA, FSA/RHS & VA B) Conventional C) Refinancings D) Home Improvement Loans E) Loans on Dwellings For 5+ Families F) Non-occupant Loans on Number Average Value Number Average Value Number Average Value Number Average Value Number Average Value Number Average Value
LOANS ORIGINATED 221 $128,515 298 $111,122 433 $98,522 67 $19,316 4 $245,298 62 $85,948 APPLICATIONS APPROVED, NOT ACCEPTED 9 $134,738 37 $95,892 83 $88,884 29 $20,029 4 $110,990 8 $91,402 APPLICATIONS DENIED 17 $130,365 66 $96,619 186 $98,080 68 $19,247 1 $119,590 10 $96,857 APPLICATIONS WITHDRAWN 16 $124,345 48 $112,202 140 $93,425 14 $54,525 1 $61,530 3 $94,357 FILES CLOSED FOR INCOMPLETENESS 0 $0 6 $82,295 45 $103,481 0 $0 2 $93,865 2 $92,130
Detailed HMDA statistics for the following Tracts:
0407.02
, 0407.05 , 0407.06 , 0413.12 , 0413.15
Private Mortgage Insurance Companies Aggregated Statistics For Year 2009(Based on 2 full and 3 partial tracts) A) Conventional B) Refinancings C) Non-occupant Loans on Number Average Value Number Average Value Number Average Value
LOANS ORIGINATED 10 $200,585 10 $185,323 1 $156,000 APPLICATIONS APPROVED, NOT ACCEPTED 6 $260,543 8 $209,184 0 $0 APPLICATIONS DENIED 5 $184,010 1 $262,570 0 $0 APPLICATIONS WITHDRAWN 0 $0 2 $233,720 0 $0 FILES CLOSED FOR INCOMPLETENESS 0 $0 0 $0 0 $0
Aggregated Statistics For Year 2008(Based on 2 full and 3 partial tracts) A) Conventional B) Refinancings C) Non-occupant Loans on Number Average Value Number Average Value Number Average Value
LOANS ORIGINATED 50 $237,834 49 $206,037 6 $197,390 APPLICATIONS APPROVED, NOT ACCEPTED 24 $243,205 23 $232,826 1 $282,300 APPLICATIONS DENIED 5 $208,872 7 $240,330 3 $187,320 APPLICATIONS WITHDRAWN 4 $273,302 3 $304,667 0 $0 FILES CLOSED FOR INCOMPLETENESS 1 $303,920 5 $215,800 1 $216,000
Aggregated Statistics For Year 2007(Based on 2 full and 3 partial tracts) A) Conventional B) Refinancings C) Non-occupant Loans on Number Average Value Number Average Value Number Average Value
LOANS ORIGINATED 91 $248,362 55 $232,301 4 $197,330 APPLICATIONS APPROVED, NOT ACCEPTED 14 $241,151 9 $243,974 1 $203,000 APPLICATIONS DENIED 3 $315,393 5 $261,034 0 $0 APPLICATIONS WITHDRAWN 2 $274,345 9 $233,093 1 $302,930 FILES CLOSED FOR INCOMPLETENESS 2 $199,915 1 $229,840 0 $0
Aggregated Statistics For Year 2006(Based on 2 full and 3 partial tracts) A) Conventional B) Refinancings C) Non-occupant Loans on Number Average Value Number Average Value Number Average Value
LOANS ORIGINATED 37 $223,875 22 $212,411 7 $240,087 APPLICATIONS APPROVED, NOT ACCEPTED 8 $257,969 9 $189,697 2 $262,500 APPLICATIONS DENIED 0 $0 0 $0 0 $0 APPLICATIONS WITHDRAWN 3 $226,967 2 $171,810 1 $410,200 FILES CLOSED FOR INCOMPLETENESS 0 $0 1 $167,000 1 $167,000
Aggregated Statistics For Year 2005(Based on 2 full and 3 partial tracts) A) Conventional B) Refinancings C) Non-occupant Loans on D) Loans On Manufactured Number Average Value Number Average Value Number Average Value Number Average Value
LOANS ORIGINATED 51 $194,807 41 $177,225 5 $176,302 1 $195,000 APPLICATIONS APPROVED, NOT ACCEPTED 7 $186,819 5 $195,932 2 $202,450 0 $0 APPLICATIONS DENIED 0 $0 6 $157,450 2 $164,500 0 $0 APPLICATIONS WITHDRAWN 2 $190,865 2 $159,000 1 $134,740 0 $0 FILES CLOSED FOR INCOMPLETENESS 0 $0 2 $143,275 0 $0 0 $0
Aggregated Statistics For Year 2004(Based on 2 full and 3 partial tracts) A) Conventional B) Refinancings C) Non-occupant Loans on D) Loans On Manufactured Number Average Value Number Average Value Number Average Value Number Average Value
LOANS ORIGINATED 51 $161,055 46 $150,392 6 $152,377 1 $126,000 APPLICATIONS APPROVED, NOT ACCEPTED 7 $155,869 22 $147,065 3 $172,383 1 $137,000 APPLICATIONS DENIED 2 $217,850 1 $152,000 0 $0 0 $0 APPLICATIONS WITHDRAWN 2 $193,625 1 $167,440 1 $126,000 0 $0 FILES CLOSED FOR INCOMPLETENESS 0 $0 0 $0 0 $0 0 $0
Aggregated Statistics For Year 2003(Based on 2 full and 3 partial tracts) A) Conventional B) Refinancings C) Non-occupant Loans on Number Average Value Number Average Value Number Average Value
LOANS ORIGINATED 96 $152,574 166 $144,282 11 $113,232 APPLICATIONS APPROVED, NOT ACCEPTED 10 $134,202 31 $148,923 3 $108,667 APPLICATIONS DENIED 2 $176,640 1 $195,110 0 $0 APPLICATIONS WITHDRAWN 1 $125,790 3 $156,237 1 $130,900 FILES CLOSED FOR INCOMPLETENESS 0 $0 0 $0 0 $0
Aggregated Statistics For Year 2002(Based on 1 partial tract) A) Conventional B) Refinancings Number Average Value Number Average Value
LOANS ORIGINATED 3 $180,757 3 $147,647 APPLICATIONS APPROVED, NOT ACCEPTED 0 $0 1 $144,140 APPLICATIONS DENIED 0 $0 0 $0 APPLICATIONS WITHDRAWN 0 $0 0 $0 FILES CLOSED FOR INCOMPLETENESS 0 $0 0 $0
Aggregated Statistics For Year 2001(Based on 1 partial tract) A) Conventional B) Refinancings Number Average Value Number Average Value
LOANS ORIGINATED 4 $174,348 3 $187,727 APPLICATIONS APPROVED, NOT ACCEPTED 1 $126,010 0 $0 APPLICATIONS DENIED 0 $0 0 $0 APPLICATIONS WITHDRAWN 0 $0 0 $0 FILES CLOSED FOR INCOMPLETENESS 0 $0 0 $0
Aggregated Statistics For Year 2000(Based on 1 partial tract) A) Conventional Number Average Value
LOANS ORIGINATED 1 $228,460 APPLICATIONS APPROVED, NOT ACCEPTED 0 $0 APPLICATIONS DENIED 0 $0 APPLICATIONS WITHDRAWN 0 $0 FILES CLOSED FOR INCOMPLETENESS 0 $0
Aggregated Statistics For Year 1999(Based on 1 full and 3 partial tracts) A) Conventional B) Refinancings C) Non-occupant Loans on Number Average Value Number Average Value Number Average Value
LOANS ORIGINATED 106 $127,122 61 $123,718 4 $111,190 APPLICATIONS APPROVED, NOT ACCEPTED 12 $126,106 13 $123,322 0 $0 APPLICATIONS DENIED 6 $130,760 5 $126,346 3 $92,167 APPLICATIONS WITHDRAWN 3 $114,967 7 $118,117 0 $0 FILES CLOSED FOR INCOMPLETENESS 0 $0 2 $113,525 0 $0
Detailed PMIC statistics for the following Tracts:
0407.02
, 0407.05 , 0407.06 , 0413.12 , 0413.15 Orchards compared to Washington state average:
Unemployed percentage below state average. Black race population percentage below state average. Hispanic race population percentage above state average. Length of stay since moving in significantly above state average. House age significantly below state average.
#12 on the list of "Top 101 cities with the most residents born in Russia (population 500+)"
#30 on the list of "Top 101 cities with the most residents born in Other South Central Asia (population 500+)"
#71 on the list of "Top 101 cities with the most residents born in Ukraine (population 500+)"
#95 on the list of "Top 101 cities with the most residents born in Eastern Europe (population 500+)"
#97 on the list of "Top 101 cities with largest percentage of females in industries: management of companies and enterprises (population 5,000+)"
#9 on the list of "Top 101 counties with the largest increase in the number of infant deaths per 1000 residents 2000-2006 to 2007-2013 (pop. 50,000+)"
#26 on the list of "Top 101 counties with the highest average weight of females"
#45 on the list of "Top 101 counties with the highest percentage of residents that exercised in the past month"
#59 on the list of "Top 101 counties with the lowest Ozone (1-hour) air pollution readings in 2012 (ppm)"
#62 on the list of "Top 101 counties with the highest ground withdrawal of fresh water for public supply"


 Recent articles from our blog. Our writers, many of them Ph.D. graduates or candidates, create easy-to-read articles on a wide variety of topics.

 (5.0 miles