Brush Prairie, Washington Submit your own pictures of this place and show them to the world
OSM Map
General Map
Google Map
MSN Map
OSM Map
General Map
Google Map
MSN Map
OSM Map
General Map
Google Map
MSN Map
OSM Map
General Map
Google Map
MSN Map
Please wait while loading the map...
Population in 2010: 2,652. Population change since 2000: +11.2%Males: 1,280 Females: 1,372
March 2022 cost of living index in Brush Prairie: 102.2 (near average, U.S. average is 100) Percentage of residents living in poverty in 2022: 7.0%
Profiles of local businesses
Business Search - 14 Million verified businesses
Data:
Median household income ($)
Median household income (% change since 2000)
Household income diversity
Ratio of average income to average house value (%)
Ratio of average income to average rent
Median household income ($) - White
Median household income ($) - Black or African American
Median household income ($) - Asian
Median household income ($) - Hispanic or Latino
Median household income ($) - American Indian and Alaska Native
Median household income ($) - Multirace
Median household income ($) - Other Race
Median household income for houses/condos with a mortgage ($)
Median household income for apartments without a mortgage ($)
Races - White alone (%)
Races - White alone (% change since 2000)
Races - Black alone (%)
Races - Black alone (% change since 2000)
Races - American Indian alone (%)
Races - American Indian alone (% change since 2000)
Races - Asian alone (%)
Races - Asian alone (% change since 2000)
Races - Hispanic (%)
Races - Hispanic (% change since 2000)
Races - Native Hawaiian and Other Pacific Islander alone (%)
Races - Native Hawaiian and Other Pacific Islander alone (% change since 2000)
Races - Two or more races (%)
Races - Two or more races (% change since 2000)
Races - Other race alone (%)
Races - Other race alone (% change since 2000)
Racial diversity
Unemployment (%)
Unemployment (% change since 2000)
Unemployment (%) - White
Unemployment (%) - Black or African American
Unemployment (%) - Asian
Unemployment (%) - Hispanic or Latino
Unemployment (%) - American Indian and Alaska Native
Unemployment (%) - Multirace
Unemployment (%) - Other Race
Population density (people per square mile)
Population - Males (%)
Population - Females (%)
Population - Males (%) - White
Population - Males (%) - Black or African American
Population - Males (%) - Asian
Population - Males (%) - Hispanic or Latino
Population - Males (%) - American Indian and Alaska Native
Population - Males (%) - Multirace
Population - Males (%) - Other Race
Population - Females (%) - White
Population - Females (%) - Black or African American
Population - Females (%) - Asian
Population - Females (%) - Hispanic or Latino
Population - Females (%) - American Indian and Alaska Native
Population - Females (%) - Multirace
Population - Females (%) - Other Race
Coronavirus confirmed cases (Apr 27, 2024)
Deaths caused by coronavirus (Apr 27, 2024)
Coronavirus confirmed cases (per 100k population) (Apr 27, 2024)
Deaths caused by coronavirus (per 100k population) (Apr 27, 2024)
Daily increase in number of cases (Apr 27, 2024)
Weekly increase in number of cases (Apr 27, 2024)
Cases doubled (in days) (Apr 27, 2024)
Hospitalized patients (Apr 18, 2022)
Negative test results (Apr 18, 2022)
Total test results (Apr 18, 2022)
COVID Vaccine doses distributed (per 100k population) (Sep 19, 2023)
COVID Vaccine doses administered (per 100k population) (Sep 19, 2023)
COVID Vaccine doses distributed (Sep 19, 2023)
COVID Vaccine doses administered (Sep 19, 2023)
Likely homosexual households (%)
Likely homosexual households (% change since 2000)
Likely homosexual households - Lesbian couples (%)
Likely homosexual households - Lesbian couples (% change since 2000)
Likely homosexual households - Gay men (%)
Likely homosexual households - Gay men (% change since 2000)
Cost of living index
Median gross rent ($)
Median contract rent ($)
Median monthly housing costs ($)
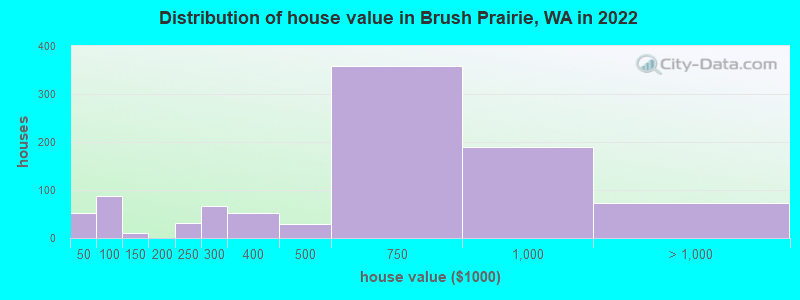
Median house or condo value ($)
Median house or condo value ($ change since 2000)
Mean house or condo value by units in structure - 1, detached ($)
Mean house or condo value by units in structure - 1, attached ($)
Mean house or condo value by units in structure - 2 ($)
Mean house or condo value by units in structure by units in structure - 3 or 4 ($)
Mean house or condo value by units in structure - 5 or more ($)
Mean house or condo value by units in structure - Boat, RV, van, etc. ($)
Mean house or condo value by units in structure - Mobile home ($)
Median house or condo value ($) - White
Median house or condo value ($) - Black or African American
Median house or condo value ($) - Asian
Median house or condo value ($) - Hispanic or Latino
Median house or condo value ($) - American Indian and Alaska Native
Median house or condo value ($) - Multirace
Median house or condo value ($) - Other Race
Median resident age
Resident age diversity
Median resident age - Males
Median resident age - Females
Median resident age - White
Median resident age - Black or African American
Median resident age - Asian
Median resident age - Hispanic or Latino
Median resident age - American Indian and Alaska Native
Median resident age - Multirace
Median resident age - Other Race
Median resident age - Males - White
Median resident age - Males - Black or African American
Median resident age - Males - Asian
Median resident age - Males - Hispanic or Latino
Median resident age - Males - American Indian and Alaska Native
Median resident age - Males - Multirace
Median resident age - Males - Other Race
Median resident age - Females - White
Median resident age - Females - Black or African American
Median resident age - Females - Asian
Median resident age - Females - Hispanic or Latino
Median resident age - Females - American Indian and Alaska Native
Median resident age - Females - Multirace
Median resident age - Females - Other Race
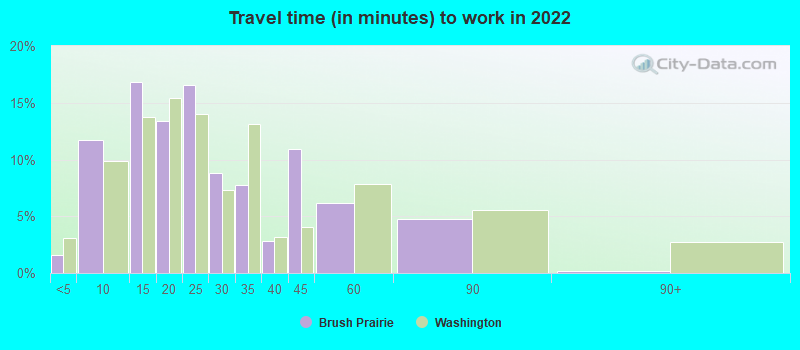
Commute - mean travel time to work (minutes)
Travel time to work - Less than 5 minutes (%)
Travel time to work - Less than 5 minutes (% change since 2000)
Travel time to work - 5 to 9 minutes (%)
Travel time to work - 5 to 9 minutes (% change since 2000)
Travel time to work - 10 to 19 minutes (%)
Travel time to work - 10 to 19 minutes (% change since 2000)
Travel time to work - 20 to 29 minutes (%)
Travel time to work - 20 to 29 minutes (% change since 2000)
Travel time to work - 30 to 39 minutes (%)
Travel time to work - 30 to 39 minutes (% change since 2000)
Travel time to work - 40 to 59 minutes (%)
Travel time to work - 40 to 59 minutes (% change since 2000)
Travel time to work - 60 to 89 minutes (%)
Travel time to work - 60 to 89 minutes (% change since 2000)
Travel time to work - 90 or more minutes (%)
Travel time to work - 90 or more minutes (% change since 2000)
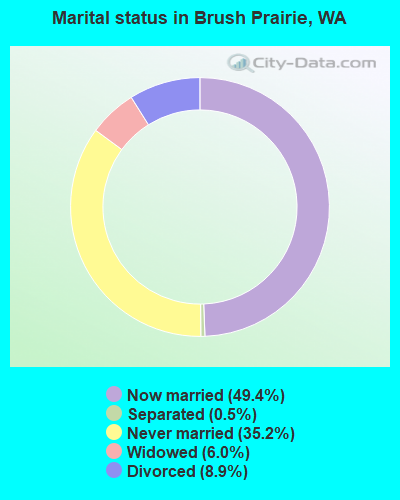
Marital status - Never married (%)
Marital status - Now married (%)
Marital status - Separated (%)
Marital status - Widowed (%)
Marital status - Divorced (%)
Median family income ($)
Median family income (% change since 2000)
Median non-family income ($)
Median non-family income (% change since 2000)
Median per capita income ($)
Median per capita income (% change since 2000)
Median family income ($) - White
Median family income ($) - Black or African American
Median family income ($) - Asian
Median family income ($) - Hispanic or Latino
Median family income ($) - American Indian and Alaska Native
Median family income ($) - Multirace
Median family income ($) - Other Race
Median year house/condo built
Median year apartment built
Year house built - Built 2005 or later (%)
Year house built - Built 2000 to 2004 (%)
Year house built - Built 1990 to 1999 (%)
Year house built - Built 1980 to 1989 (%)
Year house built - Built 1970 to 1979 (%)
Year house built - Built 1960 to 1969 (%)
Year house built - Built 1950 to 1959 (%)
Year house built - Built 1940 to 1949 (%)
Year house built - Built 1939 or earlier (%)
Average household size
Household density (households per square mile)
Average household size - White
Average household size - Black or African American
Average household size - Asian
Average household size - Hispanic or Latino
Average household size - American Indian and Alaska Native
Average household size - Multirace
Average household size - Other Race
Occupied housing units (%)
Vacant housing units (%)
Owner occupied housing units (%)
Renter occupied housing units (%)
Vacancy status - For rent (%)
Vacancy status - For sale only (%)
Vacancy status - Rented or sold, not occupied (%)
Vacancy status - For seasonal, recreational, or occasional use (%)
Vacancy status - For migrant workers (%)
Vacancy status - Other vacant (%)
Residents with income below the poverty level (%)
Residents with income below 50% of the poverty level (%)
Children below poverty level (%)
Poor families by family type - Married-couple family (%)
Poor families by family type - Male, no wife present (%)
Poor families by family type - Female, no husband present (%)
Poverty status for native-born residents (%)
Poverty status for foreign-born residents (%)
Poverty among high school graduates not in families (%)
Poverty among people who did not graduate high school not in families (%)
Residents with income below the poverty level (%) - White
Residents with income below the poverty level (%) - Black or African American
Residents with income below the poverty level (%) - Asian
Residents with income below the poverty level (%) - Hispanic or Latino
Residents with income below the poverty level (%) - American Indian and Alaska Native
Residents with income below the poverty level (%) - Multirace
Residents with income below the poverty level (%) - Other Race
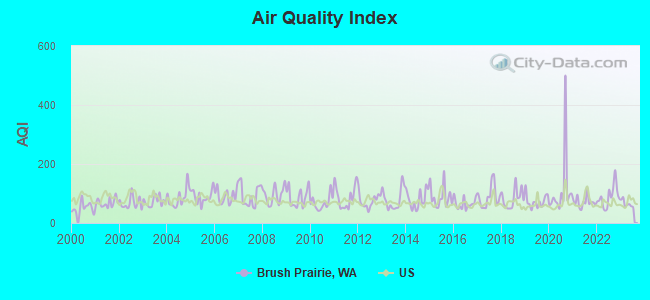
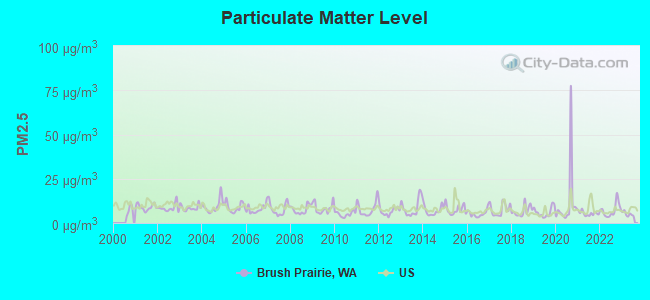
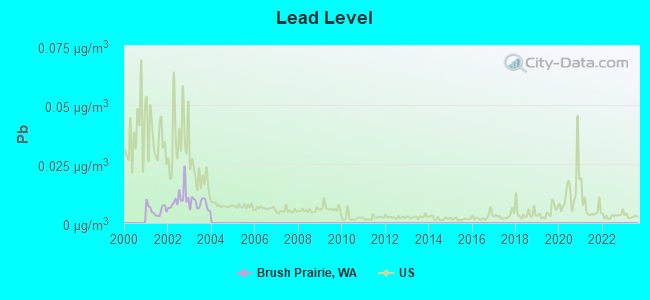
Air pollution - Air Quality Index (AQI)
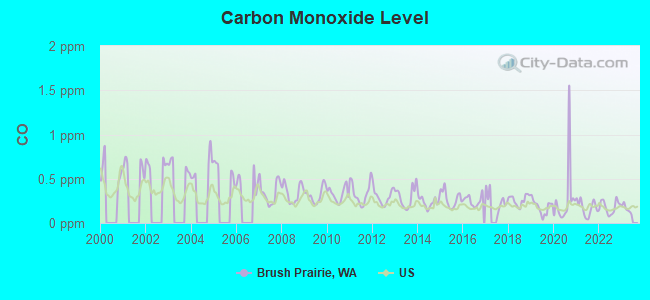
Air pollution - CO
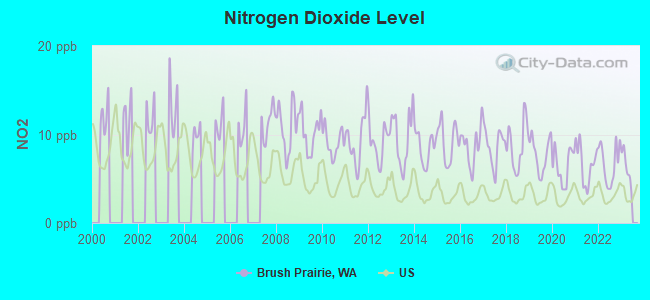
Air pollution - NO2
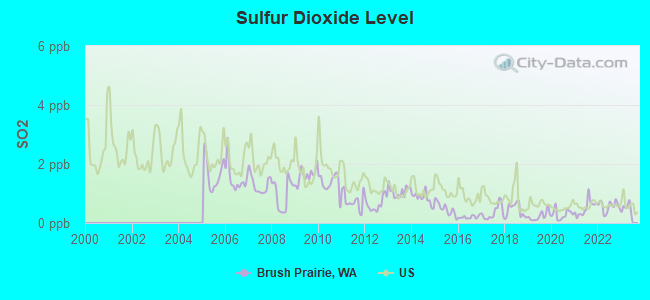
Air pollution - SO2
Air pollution - Ozone
Air pollution - PM10
Air pollution - PM25
Air pollution - Pb
Crime - Murders per 100,000 population
Crime - Rapes per 100,000 population
Crime - Robberies per 100,000 population
Crime - Assaults per 100,000 population
Crime - Burglaries per 100,000 population
Crime - Thefts per 100,000 population
Crime - Auto thefts per 100,000 population
Crime - Arson per 100,000 population
Crime - City-data.com crime index
Crime - Violent crime index
Crime - Property crime index
Crime - Murders per 100,000 population (5 year average)
Crime - Rapes per 100,000 population (5 year average)
Crime - Robberies per 100,000 population (5 year average)
Crime - Assaults per 100,000 population (5 year average)
Crime - Burglaries per 100,000 population (5 year average)
Crime - Thefts per 100,000 population (5 year average)
Crime - Auto thefts per 100,000 population (5 year average)
Crime - Arson per 100,000 population (5 year average)
Crime - City-data.com crime index (5 year average)
Crime - Violent crime index (5 year average)
Crime - Property crime index (5 year average)
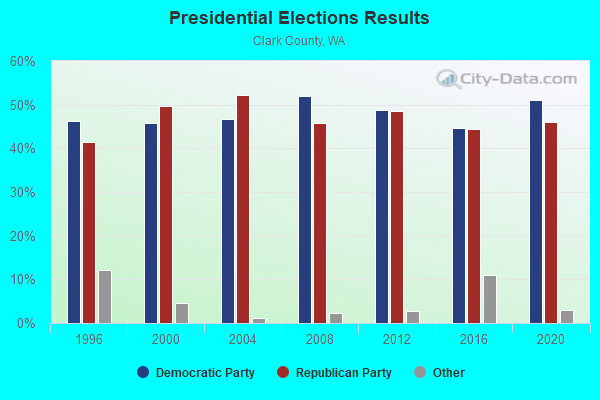
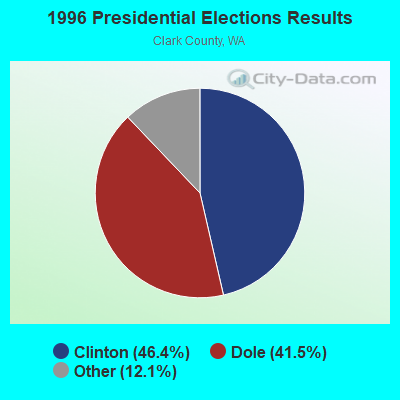
1996 Presidential Elections Results (%) - Democratic Party (Clinton)
1996 Presidential Elections Results (%) - Republican Party (Dole)
1996 Presidential Elections Results (%) - Other
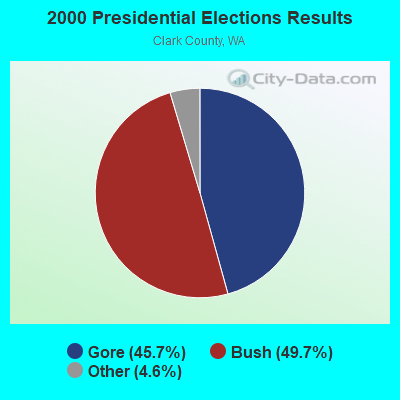
2000 Presidential Elections Results (%) - Democratic Party (Gore)
2000 Presidential Elections Results (%) - Republican Party (Bush)
2000 Presidential Elections Results (%) - Other
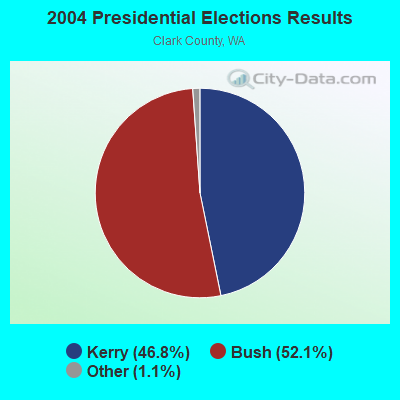
2004 Presidential Elections Results (%) - Democratic Party (Kerry)
2004 Presidential Elections Results (%) - Republican Party (Bush)
2004 Presidential Elections Results (%) - Other
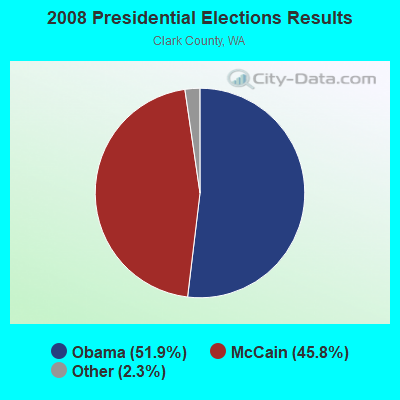
2008 Presidential Elections Results (%) - Democratic Party (Obama)
2008 Presidential Elections Results (%) - Republican Party (McCain)
2008 Presidential Elections Results (%) - Other
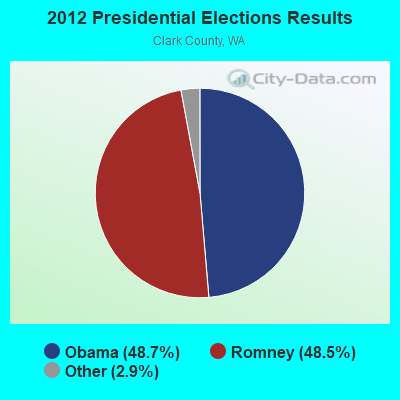
2012 Presidential Elections Results (%) - Democratic Party (Obama)
2012 Presidential Elections Results (%) - Republican Party (Romney)
2012 Presidential Elections Results (%) - Other
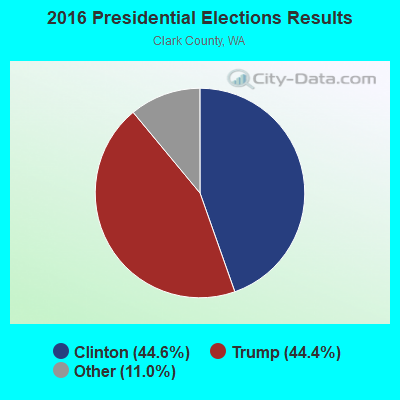
2016 Presidential Elections Results (%) - Democratic Party (Clinton)
2016 Presidential Elections Results (%) - Republican Party (Trump)
2016 Presidential Elections Results (%) - Other
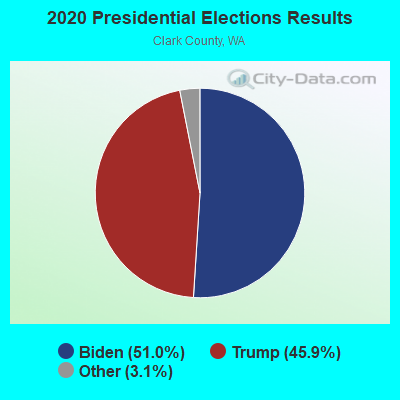
2020 Presidential Elections Results (%) - Democratic Party (Biden)
2020 Presidential Elections Results (%) - Republican Party (Trump)
2020 Presidential Elections Results (%) - Other
Ancestries Reported - Arab (%)
Ancestries Reported - Czech (%)
Ancestries Reported - Danish (%)
Ancestries Reported - Dutch (%)
Ancestries Reported - English (%)
Ancestries Reported - French (%)
Ancestries Reported - French Canadian (%)
Ancestries Reported - German (%)
Ancestries Reported - Greek (%)
Ancestries Reported - Hungarian (%)
Ancestries Reported - Irish (%)
Ancestries Reported - Italian (%)
Ancestries Reported - Lithuanian (%)
Ancestries Reported - Norwegian (%)
Ancestries Reported - Polish (%)
Ancestries Reported - Portuguese (%)
Ancestries Reported - Russian (%)
Ancestries Reported - Scotch-Irish (%)
Ancestries Reported - Scottish (%)
Ancestries Reported - Slovak (%)
Ancestries Reported - Subsaharan African (%)
Ancestries Reported - Swedish (%)
Ancestries Reported - Swiss (%)
Ancestries Reported - Ukrainian (%)
Ancestries Reported - United States (%)
Ancestries Reported - Welsh (%)
Ancestries Reported - West Indian (%)
Ancestries Reported - Other (%)
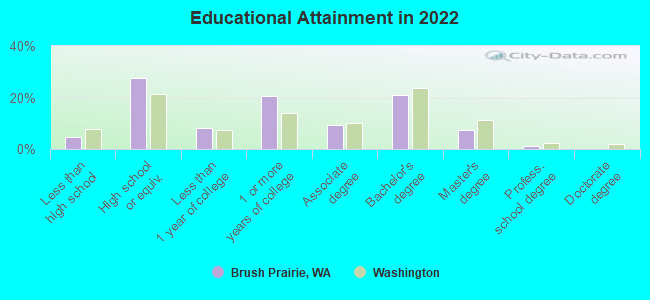
Educational Attainment - No schooling completed (%)
Educational Attainment - Less than high school (%)
Educational Attainment - High school or equivalent (%)
Educational Attainment - Less than 1 year of college (%)
Educational Attainment - 1 or more years of college (%)
Educational Attainment - Associate degree (%)
Educational Attainment - Bachelor's degree (%)
Educational Attainment - Master's degree (%)
Educational Attainment - Professional school degree (%)
Educational Attainment - Doctorate degree (%)
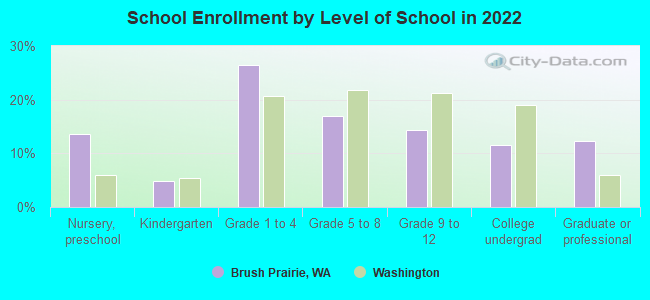
School Enrollment - Nursery, preschool (%)
School Enrollment - Kindergarten (%)
School Enrollment - Grade 1 to 4 (%)
School Enrollment - Grade 5 to 8 (%)
School Enrollment - Grade 9 to 12 (%)
School Enrollment - College undergrad (%)
School Enrollment - Graduate or professional (%)
School Enrollment - Not enrolled in school (%)
School enrollment - Public schools (%)
School enrollment - Private schools (%)
School enrollment - Not enrolled (%)
Median number of rooms in houses and condos
Median number of rooms in apartments
Housing units lacking complete plumbing facilities (%)
Housing units lacking complete kitchen facilities (%)
Density of houses
Urban houses (%)
Rural houses (%)
Households with people 60 years and over (%)
Households with people 65 years and over (%)
Households with people 75 years and over (%)
Households with one or more nonrelatives (%)
Households with no nonrelatives (%)
Population in households (%)
Family households (%)
Nonfamily households (%)
Population in families (%)
Family households with own children (%)
Median number of bedrooms in owner occupied houses
Mean number of bedrooms in owner occupied houses
Median number of bedrooms in renter occupied houses
Mean number of bedrooms in renter occupied houses
Median number of vehichles in owner occupied houses
Mean number of vehichles in owner occupied houses
Median number of vehichles in renter occupied houses
Mean number of vehichles in renter occupied houses
Mortgage status - with mortgage (%)
Mortgage status - with second mortgage (%)
Mortgage status - with home equity loan (%)
Mortgage status - with both second mortgage and home equity loan (%)
Mortgage status - without a mortgage (%)
Average family size
Average family size - White
Average family size - Black or African American
Average family size - Asian
Average family size - Hispanic or Latino
Average family size - American Indian and Alaska Native
Average family size - Multirace
Average family size - Other Race
Geographical mobility - Same house 1 year ago (%)
Geographical mobility - Moved within same county (%)
Geographical mobility - Moved from different county within same state (%)
Geographical mobility - Moved from different state (%)
Geographical mobility - Moved from abroad (%)
Place of birth - Born in state of residence (%)
Place of birth - Born in other state (%)
Place of birth - Native, outside of US (%)
Place of birth - Foreign born (%)
Housing units in structures - 1, detached (%)
Housing units in structures - 1, attached (%)
Housing units in structures - 2 (%)
Housing units in structures - 3 or 4 (%)
Housing units in structures - 5 to 9 (%)
Housing units in structures - 10 to 19 (%)
Housing units in structures - 20 to 49 (%)
Housing units in structures - 50 or more (%)
Housing units in structures - Mobile home (%)
Housing units in structures - Boat, RV, van, etc. (%)
House/condo owner moved in on average (years ago)
Renter moved in on average (years ago)
Year householder moved into unit - Moved in 1999 to March 2000 (%)
Year householder moved into unit - Moved in 1995 to 1998 (%)
Year householder moved into unit - Moved in 1990 to 1994 (%)
Year householder moved into unit - Moved in 1980 to 1989 (%)
Year householder moved into unit - Moved in 1970 to 1979 (%)
Year householder moved into unit - Moved in 1969 or earlier (%)
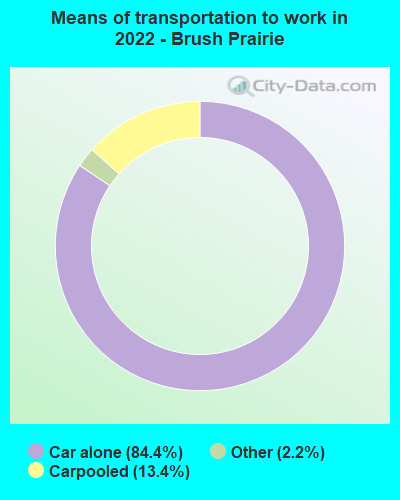
Means of transportation to work - Drove car alone (%)
Means of transportation to work - Carpooled (%)
Means of transportation to work - Public transportation (%)
Means of transportation to work - Bus or trolley bus (%)
Means of transportation to work - Streetcar or trolley car (%)
Means of transportation to work - Subway or elevated (%)
Means of transportation to work - Railroad (%)
Means of transportation to work - Ferryboat (%)
Means of transportation to work - Taxicab (%)
Means of transportation to work - Motorcycle (%)
Means of transportation to work - Bicycle (%)
Means of transportation to work - Walked (%)
Means of transportation to work - Other means (%)
Working at home (%)
Industry diversity
Most Common Industries - Agriculture, forestry, fishing and hunting, and mining (%)
Most Common Industries - Agriculture, forestry, fishing and hunting (%)
Most Common Industries - Mining, quarrying, and oil and gas extraction (%)
Most Common Industries - Construction (%)
Most Common Industries - Manufacturing (%)
Most Common Industries - Wholesale trade (%)
Most Common Industries - Retail trade (%)
Most Common Industries - Transportation and warehousing, and utilities (%)
Most Common Industries - Transportation and warehousing (%)
Most Common Industries - Utilities (%)
Most Common Industries - Information (%)
Most Common Industries - Finance and insurance, and real estate and rental and leasing (%)
Most Common Industries - Finance and insurance (%)
Most Common Industries - Real estate and rental and leasing (%)
Most Common Industries - Professional, scientific, and management, and administrative and waste management services (%)
Most Common Industries - Professional, scientific, and technical services (%)
Most Common Industries - Management of companies and enterprises (%)
Most Common Industries - Administrative and support and waste management services (%)
Most Common Industries - Educational services, and health care and social assistance (%)
Most Common Industries - Educational services (%)
Most Common Industries - Health care and social assistance (%)
Most Common Industries - Arts, entertainment, and recreation, and accommodation and food services (%)
Most Common Industries - Arts, entertainment, and recreation (%)
Most Common Industries - Accommodation and food services (%)
Most Common Industries - Other services, except public administration (%)
Most Common Industries - Public administration (%)
Occupation diversity
Most Common Occupations - Management, business, science, and arts occupations (%)
Most Common Occupations - Management, business, and financial occupations (%)
Most Common Occupations - Management occupations (%)
Most Common Occupations - Business and financial operations occupations (%)
Most Common Occupations - Computer, engineering, and science occupations (%)
Most Common Occupations - Computer and mathematical occupations (%)
Most Common Occupations - Architecture and engineering occupations (%)
Most Common Occupations - Life, physical, and social science occupations (%)
Most Common Occupations - Education, legal, community service, arts, and media occupations (%)
Most Common Occupations - Community and social service occupations (%)
Most Common Occupations - Legal occupations (%)
Most Common Occupations - Education, training, and library occupations (%)
Most Common Occupations - Arts, design, entertainment, sports, and media occupations (%)
Most Common Occupations - Healthcare practitioners and technical occupations (%)
Most Common Occupations - Health diagnosing and treating practitioners and other technical occupations (%)
Most Common Occupations - Health technologists and technicians (%)
Most Common Occupations - Service occupations (%)
Most Common Occupations - Healthcare support occupations (%)
Most Common Occupations - Protective service occupations (%)
Most Common Occupations - Fire fighting and prevention, and other protective service workers including supervisors (%)
Most Common Occupations - Law enforcement workers including supervisors (%)
Most Common Occupations - Food preparation and serving related occupations (%)
Most Common Occupations - Building and grounds cleaning and maintenance occupations (%)
Most Common Occupations - Personal care and service occupations (%)
Most Common Occupations - Sales and office occupations (%)
Most Common Occupations - Sales and related occupations (%)
Most Common Occupations - Office and administrative support occupations (%)
Most Common Occupations - Natural resources, construction, and maintenance occupations (%)
Most Common Occupations - Farming, fishing, and forestry occupations (%)
Most Common Occupations - Construction and extraction occupations (%)
Most Common Occupations - Installation, maintenance, and repair occupations (%)
Most Common Occupations - Production, transportation, and material moving occupations (%)
Most Common Occupations - Production occupations (%)
Most Common Occupations - Transportation occupations (%)
Most Common Occupations - Material moving occupations (%)
People in Group quarters - Institutionalized population (%)
People in Group quarters - Correctional institutions (%)
People in Group quarters - Federal prisons and detention centers (%)
People in Group quarters - Halfway houses (%)
People in Group quarters - Local jails and other confinement facilities (including police lockups) (%)
People in Group quarters - Military disciplinary barracks (%)
People in Group quarters - State prisons (%)
People in Group quarters - Other types of correctional institutions (%)
People in Group quarters - Nursing homes (%)
People in Group quarters - Hospitals/wards, hospices, and schools for the handicapped (%)
People in Group quarters - Hospitals/wards and hospices for chronically ill (%)
People in Group quarters - Hospices or homes for chronically ill (%)
People in Group quarters - Military hospitals or wards for chronically ill (%)
People in Group quarters - Other hospitals or wards for chronically ill (%)
People in Group quarters - Hospitals or wards for drug/alcohol abuse (%)
People in Group quarters - Mental (Psychiatric) hospitals or wards (%)
People in Group quarters - Schools, hospitals, or wards for the mentally retarded (%)
People in Group quarters - Schools, hospitals, or wards for the physically handicapped (%)
People in Group quarters - Institutions for the deaf (%)
People in Group quarters - Institutions for the blind (%)
People in Group quarters - Orthopedic wards and institutions for the physically handicapped (%)
People in Group quarters - Wards in general hospitals for patients who have no usual home elsewhere (%)
People in Group quarters - Wards in military hospitals for patients who have no usual home elsewhere (%)
People in Group quarters - Juvenile institutions (%)
People in Group quarters - Long-term care (%)
People in Group quarters - Homes for abused, dependent, and neglected children (%)
People in Group quarters - Residential treatment centers for emotionally disturbed children (%)
People in Group quarters - Training schools for juvenile delinquents (%)
People in Group quarters - Short-term care, detention or diagnostic centers for delinquent children (%)
People in Group quarters - Type of juvenile institution unknown (%)
People in Group quarters - Noninstitutionalized population (%)
People in Group quarters - College dormitories (includes college quarters off campus) (%)
People in Group quarters - Military quarters (%)
People in Group quarters - On base (%)
People in Group quarters - Barracks, unaccompanied personnel housing (UPH), (Enlisted/Officer), ;and similar group living quarters for military personnel (%)
People in Group quarters - Transient quarters for temporary residents (%)
People in Group quarters - Military ships (%)
People in Group quarters - Group homes (%)
People in Group quarters - Homes or halfway houses for drug/alcohol abuse (%)
People in Group quarters - Homes for the mentally ill (%)
People in Group quarters - Homes for the mentally retarded (%)
People in Group quarters - Homes for the physically handicapped (%)
People in Group quarters - Other group homes (%)
People in Group quarters - Religious group quarters (%)
People in Group quarters - Dormitories (%)
People in Group quarters - Agriculture workers' dormitories on farms (%)
People in Group quarters - Job Corps and vocational training facilities (%)
People in Group quarters - Other workers' dormitories (%)
People in Group quarters - Crews of maritime vessels (%)
People in Group quarters - Other nonhousehold living situations (%)
People in Group quarters - Other noninstitutional group quarters (%)
Residents speaking English at home (%)
Residents speaking English at home - Born in the United States (%)
Residents speaking English at home - Native, born elsewhere (%)
Residents speaking English at home - Foreign born (%)
Residents speaking Spanish at home (%)
Residents speaking Spanish at home - Born in the United States (%)
Residents speaking Spanish at home - Native, born elsewhere (%)
Residents speaking Spanish at home - Foreign born (%)
Residents speaking other language at home (%)
Residents speaking other language at home - Born in the United States (%)
Residents speaking other language at home - Native, born elsewhere (%)
Residents speaking other language at home - Foreign born (%)
Class of Workers - Employee of private company (%)
Class of Workers - Self-employed in own incorporated business (%)
Class of Workers - Private not-for-profit wage and salary workers (%)
Class of Workers - Local government workers (%)
Class of Workers - State government workers (%)
Class of Workers - Federal government workers (%)
Class of Workers - Self-employed workers in own not incorporated business and Unpaid family workers (%)
House heating fuel used in houses and condos - Utility gas (%)
House heating fuel used in houses and condos - Bottled, tank, or LP gas (%)
House heating fuel used in houses and condos - Electricity (%)
House heating fuel used in houses and condos - Fuel oil, kerosene, etc. (%)
House heating fuel used in houses and condos - Coal or coke (%)
House heating fuel used in houses and condos - Wood (%)
House heating fuel used in houses and condos - Solar energy (%)
House heating fuel used in houses and condos - Other fuel (%)
House heating fuel used in houses and condos - No fuel used (%)
House heating fuel used in apartments - Utility gas (%)
House heating fuel used in apartments - Bottled, tank, or LP gas (%)
House heating fuel used in apartments - Electricity (%)
House heating fuel used in apartments - Fuel oil, kerosene, etc. (%)
House heating fuel used in apartments - Coal or coke (%)
House heating fuel used in apartments - Wood (%)
House heating fuel used in apartments - Solar energy (%)
House heating fuel used in apartments - Other fuel (%)
House heating fuel used in apartments - No fuel used (%)
Armed forces status - In Armed Forces (%)
Armed forces status - Civilian (%)
Armed forces status - Civilian - Veteran (%)
Armed forces status - Civilian - Nonveteran (%)
Fatal accidents locations in years 2005-2021
Fatal accidents locations in 2005
Fatal accidents locations in 2006
Fatal accidents locations in 2007
Fatal accidents locations in 2008
Fatal accidents locations in 2009
Fatal accidents locations in 2010
Fatal accidents locations in 2011
Fatal accidents locations in 2012
Fatal accidents locations in 2013
Fatal accidents locations in 2014
Fatal accidents locations in 2015
Fatal accidents locations in 2016
Fatal accidents locations in 2017
Fatal accidents locations in 2018
Fatal accidents locations in 2019
Fatal accidents locations in 2020
Fatal accidents locations in 2021
Alcohol use - People drinking some alcohol every month (%)
Alcohol use - People not drinking at all (%)
Alcohol use - Average days/month drinking alcohol
Alcohol use - Average drinks/week
Alcohol use - Average days/year people drink much
Audiometry - Average condition of hearing (%)
Audiometry - People that can hear a whisper from across a quiet room (%)
Audiometry - People that can hear normal voice from across a quiet room (%)
Audiometry - Ears ringing, roaring, buzzing (%)
Audiometry - Had a job exposure to loud noise (%)
Audiometry - Had off-work exposure to loud noise (%)
Blood Pressure & Cholesterol - Has high blood pressure (%)
Blood Pressure & Cholesterol - Checking blood pressure at home (%)
Blood Pressure & Cholesterol - Frequently checking blood cholesterol (%)
Blood Pressure & Cholesterol - Has high cholesterol level (%)
Consumer Behavior - Money monthly spent on food at supermarket/grocery store
Consumer Behavior - Money monthly spent on food at other stores
Consumer Behavior - Money monthly spent on eating out
Consumer Behavior - Money monthly spent on carryout/delivered foods
Consumer Behavior - Income spent on food at supermarket/grocery store (%)
Consumer Behavior - Income spent on food at other stores (%)
Consumer Behavior - Income spent on eating out (%)
Consumer Behavior - Income spent on carryout/delivered foods (%)
Current Health Status - General health condition (%)
Current Health Status - Blood donors (%)
Current Health Status - Has blood ever tested for HIV virus (%)
Current Health Status - Left-handed people (%)
Dermatology - People using sunscreen (%)
Diabetes - Diabetics (%)
Diabetes - Had a blood test for high blood sugar (%)
Diabetes - People taking insulin (%)
Diet Behavior & Nutrition - Diet health (%)
Diet Behavior & Nutrition - Milk product consumption (# of products/month)
Diet Behavior & Nutrition - Meals not home prepared (#/week)
Diet Behavior & Nutrition - Meals from fast food or pizza place (#/week)
Diet Behavior & Nutrition - Ready-to-eat foods (#/month)
Diet Behavior & Nutrition - Frozen meals/pizza (#/month)
Drug Use - People that ever used marijuana or hashish (%)
Drug Use - Ever used hard drugs (%)
Drug Use - Ever used any form of cocaine (%)
Drug Use - Ever used heroin (%)
Drug Use - Ever used methamphetamine (%)
Health Insurance - People covered by health insurance (%)
Kidney Conditions-Urology - Avg. # of times urinating at night
Medical Conditions - People with asthma (%)
Medical Conditions - People with anemia (%)
Medical Conditions - People with psoriasis (%)
Medical Conditions - People with overweight (%)
Medical Conditions - Elderly people having difficulties in thinking or remembering (%)
Medical Conditions - People who ever received blood transfusion (%)
Medical Conditions - People having trouble seeing even with glass/contacts (%)
Medical Conditions - People with arthritis (%)
Medical Conditions - People with gout (%)
Medical Conditions - People with congestive heart failure (%)
Medical Conditions - People with coronary heart disease (%)
Medical Conditions - People with angina pectoris (%)
Medical Conditions - People who ever had heart attack (%)
Medical Conditions - People who ever had stroke (%)
Medical Conditions - People with emphysema (%)
Medical Conditions - People with thyroid problem (%)
Medical Conditions - People with chronic bronchitis (%)
Medical Conditions - People with any liver condition (%)
Medical Conditions - People who ever had cancer or malignancy (%)
Mental Health - People who have little interest in doing things (%)
Mental Health - People feeling down, depressed, or hopeless (%)
Mental Health - People who have trouble sleeping or sleeping too much (%)
Mental Health - People feeling tired or having little energy (%)
Mental Health - People with poor appetite or overeating (%)
Mental Health - People feeling bad about themself (%)
Mental Health - People who have trouble concentrating on things (%)
Mental Health - People moving or speaking slowly or too fast (%)
Mental Health - People having thoughts they would be better off dead (%)
Oral Health - Average years since last visit a dentist
Oral Health - People embarrassed because of mouth (%)
Oral Health - People with gum disease (%)
Oral Health - General health of teeth and gums (%)
Oral Health - Average days a week using dental floss/device
Oral Health - Average days a week using mouthwash for dental problem
Oral Health - Average number of teeth
Pesticide Use - Households using pesticides to control insects (%)
Pesticide Use - Households using pesticides to kill weeds (%)
Physical Activity - People doing vigorous-intensity work activities (%)
Physical Activity - People doing moderate-intensity work activities (%)
Physical Activity - People walking or bicycling (%)
Physical Activity - People doing vigorous-intensity recreational activities (%)
Physical Activity - People doing moderate-intensity recreational activities (%)
Physical Activity - Average hours a day doing sedentary activities
Physical Activity - Average hours a day watching TV or videos
Physical Activity - Average hours a day using computer
Physical Functioning - People having limitations keeping them from working (%)
Physical Functioning - People limited in amount of work they can do (%)
Physical Functioning - People that need special equipment to walk (%)
Physical Functioning - People experiencing confusion/memory problems (%)
Physical Functioning - People requiring special healthcare equipment (%)
Prescription Medications - Average number of prescription medicines taking
Preventive Aspirin Use - Adults 40+ taking low-dose aspirin (%)
Reproductive Health - Vaginal deliveries (%)
Reproductive Health - Cesarean deliveries (%)
Reproductive Health - Deliveries resulted in a live birth (%)
Reproductive Health - Pregnancies resulted in a delivery (%)
Reproductive Health - Women breastfeeding newborns (%)
Reproductive Health - Women that had a hysterectomy (%)
Reproductive Health - Women that had both ovaries removed (%)
Reproductive Health - Women that have ever taken birth control pills (%)
Reproductive Health - Women taking birth control pills (%)
Reproductive Health - Women that have ever used Depo-Provera or injectables (%)
Reproductive Health - Women that have ever used female hormones (%)
Sexual Behavior - People 18+ that ever had sex (vaginal, anal, or oral) (%)
Sexual Behavior - Males 18+ that ever had vaginal sex with a woman (%)
Sexual Behavior - Males 18+ that ever performed oral sex on a woman (%)
Sexual Behavior - Males 18+ that ever had anal sex with a woman (%)
Sexual Behavior - Males 18+ that ever had any sex with a man (%)
Sexual Behavior - Females 18+ that ever had vaginal sex with a man (%)
Sexual Behavior - Females 18+ that ever performed oral sex on a man (%)
Sexual Behavior - Females 18+ that ever had anal sex with a man (%)
Sexual Behavior - Females 18+ that ever had any kind of sex with a woman (%)
Sexual Behavior - Average age people first had sex
Sexual Behavior - Average number of female sex partners in lifetime (males 18+)
Sexual Behavior - Average number of female vaginal sex partners in lifetime (males 18+)
Sexual Behavior - Average age people first performed oral sex on a woman (18+)
Sexual Behavior - Average number of woman performed oral sex on in lifetime (18+)
Sexual Behavior - Average number of male sex partners in lifetime (males 18+)
Sexual Behavior - Average number of male anal sex partners in lifetime (males 18+)
Sexual Behavior - Average age people first performed oral sex on a man (18+)
Sexual Behavior - Average number of male oral sex partners in lifetime (18+)
Sexual Behavior - People using protection when performing oral sex (%)
Sexual Behavior - Average number of times people have vaginal or anal sex a year
Sexual Behavior - People having sex without condom (%)
Sexual Behavior - Average number of male sex partners in lifetime (females 18+)
Sexual Behavior - Average number of male vaginal sex partners in lifetime (females 18+)
Sexual Behavior - Average number of female sex partners in lifetime (females 18+)
Sexual Behavior - Circumcised males 18+ (%)
Sleep Disorders - Average hours sleeping at night
Sleep Disorders - People that has trouble sleeping (%)
Smoking-Cigarette Use - People smoking cigarettes (%)
Taste & Smell - People 40+ having problems with smell (%)
Taste & Smell - People 40+ having problems with taste (%)
Taste & Smell - People 40+ that ever had wisdom teeth removed (%)
Taste & Smell - People 40+ that ever had tonsils teeth removed (%)
Taste & Smell - People 40+ that ever had a loss of consciousness because of a head injury (%)
Taste & Smell - People 40+ that ever had a broken nose or other serious injury to face or skull (%)
Taste & Smell - People 40+ that ever had two or more sinus infections (%)
Weight - Average height (inches)
Weight - Average weight (pounds)
Weight - Average BMI
Weight - People that are obese (%)
Weight - People that ever were obese (%)
Weight - People trying to lose weight (%)
Latest news from Brush Prairie, WA collected exclusively by city-data.com from local newspapers, TV, and radio stations
Ancestries: German (17.5%), Norwegian (14.4%), English (13.0%), American (12.1%), Ukrainian (9.3%), European (5.0%).
Current Local Time:
Land area: 7.82 square miles.
Population density: 339 people per square mile (very low).
127 residents are foreign born (2.2% Latin America , 1.5% Europe , 0.6% Asia ).
This place:
4.7%Washington:
14.9%
Median real estate property taxes paid for housing units in 2000: Brush Prairie CDP:
1.1% ($2,247)Washington:
1.2% ($1,915)
Nearest city with pop. 50,000+: Vancouver, WA
Nearest city with pop. 200,000+: Portland, OR
Nearest city with pop. 1,000,000+: Los Angeles, CA
Nearest cities:
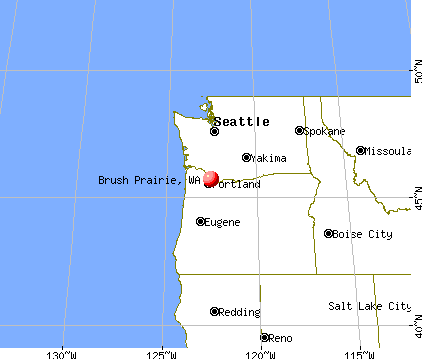
Latitude: 45.73 N, Longitude: 122.54 W
Area code commonly used in this area: 360
Property values in Brush Prairie, WA
Unemployment in December 2023:
Most common industries in Brush Prairie, WA (%)
Both Males Females
Health care (9.2%)
Construction (9.1%)
Educational services (8.7%)
Professional, scientific, technical services (5.6%)
Public administration (4.6%)
Religious, grantmaking, civic, professional, similar organizations (3.6%)
Truck transportation (3.6%)
Construction (16.8%)
Professional, scientific, technical services (6.0%)
Educational services (5.5%)
Repair & maintenance (4.7%)
Truck transportation (4.2%)
Public administration (3.9%)
Air transportation (3.7%)
Health care (16.0%)
Educational services (12.5%)
Finance & insurance (6.3%)
Administrative & support & waste management services (5.8%)
Public administration (5.4%)
Professional, scientific, technical services (5.2%)
Real estate & rental & leasing (4.4%)
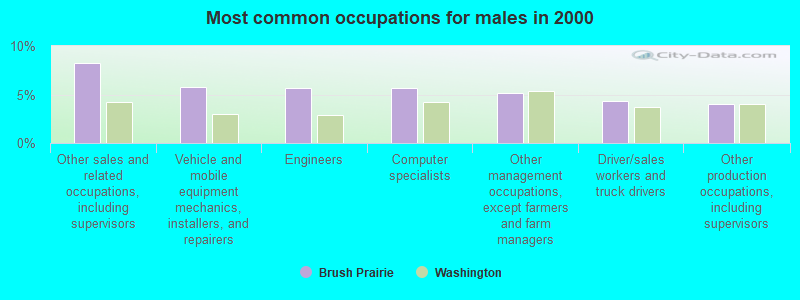
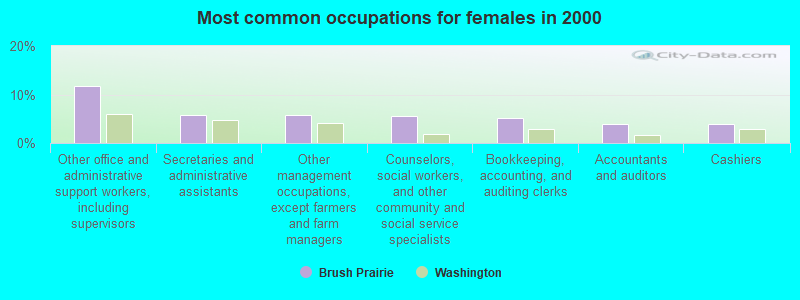
Most common occupations in Brush Prairie, WA (%)
Both Males Females
Other office and administrative support workers, including supervisors (5.9%)
Other management occupations, except farmers and farm managers (5.4%)
Other sales and related occupations, including supervisors (5.4%)
Computer specialists (3.5%)
Vehicle and mobile equipment mechanics, installers, and repairers (3.2%)
Engineers (3.1%)
Counselors, social workers, and other community and social service specialists (3.1%)
Other sales and related occupations, including supervisors (8.2%)
Vehicle and mobile equipment mechanics, installers, and repairers (5.8%)
Engineers (5.6%)
Computer specialists (5.6%)
Other management occupations, except farmers and farm managers (5.2%)
Driver/sales workers and truck drivers (4.4%)
Other production occupations, including supervisors (4.0%)
Other office and administrative support workers, including supervisors (11.7%)
Secretaries and administrative assistants (5.8%)
Other management occupations, except farmers and farm managers (5.8%)
Counselors, social workers, and other community and social service specialists (5.6%)
Bookkeeping, accounting, and auditing clerks (5.2%)
Accountants and auditors (3.8%)
Cashiers (3.8%)
Earthquake activity:
Brush Prairie-area historical earthquake activity is significantly above Washington state average. It is 1502% greater than the overall U.S. average. On 4/13/1949 at 19:55:42, a magnitude 7.0 (7.0 UK, Class: Major, Intensity: VIII - XII) earthquake occurred 105.2 miles away from Brush Prairie center, causing $80,000,000 total damage On 2/28/2001 at 18:54:32, a magnitude 6.8 (6.5 MB, 6.6 MS, 6.8 MW, Class: Strong, Intensity: VII - IX) earthquake occurred 94.2 miles away from Brush Prairie center, causing $2,000,000,000 total damage and $305,000,000 insured lossesOn 2/28/2001 at 18:54:32, a magnitude 6.8 (6.8 MD, Depth: 32.2 mi) earthquake occurred 98.6 miles away from Brush Prairie center On 4/29/1965 at 15:28:43, a magnitude 6.6 (6.6 UK) earthquake occurred 110.3 miles away from the city center, causing $28,000,000 total damage On 1/31/1922 at 13:17:28, a magnitude 7.6 (7.6 UK) earthquake occurred 379.4 miles away from Brush Prairie center On 11/8/1980 at 10:27:34, a magnitude 7.2 (6.2 MB, 7.2 MS, 7.2 MW, 7.0 ML) earthquake occurred 331.4 miles away from Brush Prairie center Magnitude types: body-wave magnitude (MB), duration magnitude (MD), local magnitude (ML), surface-wave magnitude (MS), moment magnitude (MW) Natural disasters: The number of natural disasters in Clark County (13) is near the US average (15).Major Disasters (Presidential) Declared: 12Emergencies Declared: 1Floods: 7, Mudslides: 4, Storms: 4, Winter Storms: 4, Landslides: 3, Winds: 2, Earthquake: 1, Heavy Rain: 1, Hurricane: 1, Snow: 1, Tornado: 1, Volcanic Eruption: 1, Other: 1 (Note: some incidents may be assigned to more than one category). Hospitals and medical centers near Brush Prairie: MEADOW GLADE MANOR (Nursing Home, about 3 miles away; BATTLE GROUND, WA)
MANORCARE HEALTH SERVICES - SALMON CREEK (Nursing Home, about 5 miles away; VANCOUVER, WA)
VANCOUVER DIALYSIS CENTER (Dialysis Facility, about 6 miles away; VANCOUVER, WA)
LEGACY SALMON CREEK MEDICAL CENTER (about 6 miles away; VANCOUVER, WA)
PNRS SALMON CREEK (Dialysis Facility, about 7 miles away; VANCOUVER, WA)
EMERALD TERRACE NURSING CENTER (Nursing Home, about 8 miles away; VANCOUVER, WA)
PACIFIC SPECIALTY AND REHAB CARE (Nursing Home, about 8 miles away; VANCOUVER, WA)
Airports located in Brush Prairie: Amtrak stations near Brush Prairie: 10 miles: VANCOUVER (FOOT OF W. 11TH ST.) Services: ticket office, fully wheelchair accessible, enclosed waiting area, public restrooms, public payphones, vending machines, free short-term parking, free long-term parking, call for taxi service.
16 miles: PORTLAND (800 NW 6TH AVE.) Services: ticket office, fully wheelchair accessible, enclosed waiting area, public restrooms, public payphones, full-service food facilities, paid short-term parking, paid long-term parking, call for car rental service, taxi stand, intercity bus service, public transit connection.
Colleges/universities with over 2000 students nearest to Brush Prairie:
Clark College (about 9 miles; Vancouver, WA ; Full-time enrollment: 9,330)
Concordia University-Portland (about 13 miles; Portland, OR ; FT enrollment: 3,996)
University of Portland (about 15 miles; Portland, OR ; FT enrollment: 4,030)
Portland State University (about 17 miles; Portland, OR ; FT enrollment: 21,450)
Mt Hood Community College (about 17 miles; Gresham, OR ; FT enrollment: 11,847)
Lewis & Clark College (about 21 miles; Portland, OR ; FT enrollment: 2,864)
Portland Community College (about 23 miles; Portland, OR ; FT enrollment: 23,600)
Public high schools in Brush Prairie: SUMMIT VIEW HIGH SCHOOL Location: 11104 NE 149TH ST, Grades: 7-12)
PRAIRIE HIGH SCHOOL Location: 11311 NE 119TH ST, Grades: 9-12)
PRESCHOOL INFANT OTHER Location: 11104 NE 149TH ST, Grades: PK-12)
OPEN DOORS BATTLE GROUND Location: 11104 NE 149TH ST, Grades: 9-12)
HOCKINSON HIGH SCHOOL Location: 16819 NE 159 ST, Grades: 9-12)Public elementary/middle schools in Brush Prairie:
See full list of schools located in Brush Prairie User-submitted facts and corrections:
Hockinson High School was recently built, in 2004, near Brush Prairie, WA. It is a public high school.
Concordia University 2811 Ne Holman St, Portland, OR 97211 US This University is roughly 20 miles from Brush Prairie WA added by Sharon
Birthplace of: Gerry Staley - Baseball player.
Clark County has a predicted average indoor radon screening level greater than 4 pCi/L (pico curies per liter) - Highest Potential Average household size: This place:
2.9 peopleWashington:
2.5 people
Percentage of family households: This place:
77.9%Whole state:
64.4%
Percentage of households with unmarried partners: This place:
5.2%Whole state:
7.7%
Likely homosexual households (counted as self-reported same-sex unmarried-partner households)
Lesbian couples: 0.4% of all households Gay men: 0.3% of all households
8 people in nursing facilities/skilled-nursing facilities in 2010people in group homes intended for adults in 2010people in other noninstitutional group quarters in 2000
For population 15 years and over in Brush Prairie:
Never married: 35.2%Now married: 49.4%Separated: 0.5%Widowed: 6.0%Divorced: 8.9% For population 25 years and over in Brush Prairie:
High school or higher: 95.4%Bachelor's degree or higher: 29.1%Graduate or professional degree: 8.2%Unemployed: 9.1%Mean travel time to work (commute): 27.4 minutes
Education Gini index (Inequality in education) Here:
8.4Washington average:
11.6
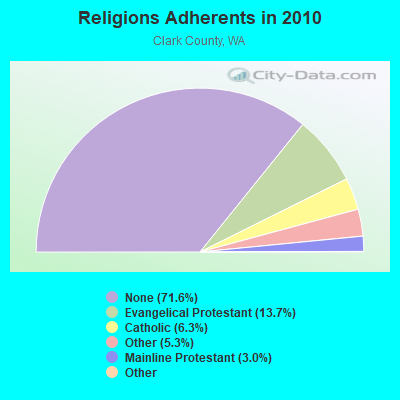
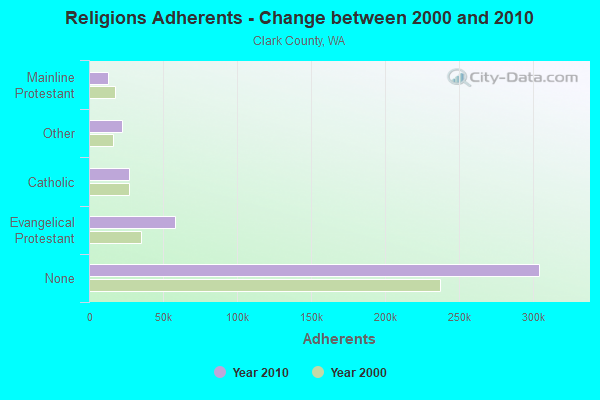
Religion statistics for Brush Prairie, WA (based on Clark County data)
Religion Adherents Congregations Evangelical Protestant 58,413 191 Catholic 26,886 9 Other 22,590 60 Mainline Protestant 12,633 37 Black Protestant 378 2 Orthodox 61 1 None 304,402 -
Source: Clifford Grammich, Kirk Hadaway, Richard Houseal, Dale E.Jones, Alexei Krindatch, Richie Stanley and Richard H.Taylor. 2012. 2010 U.S.Religion Census: Religious Congregations & Membership Study. Association of Statisticians of American Religious Bodies. Jones, Dale E., et al. 2002. Congregations and Membership in the United States 2000. Nashville, TN: Glenmary Research Center. Graphs represent county-level data
Food Environment Statistics: Number of grocery stores : 46Clark County :
1.10 / 10,000 pop.Washington :
2.06 / 10,000 pop.
Number of supercenters and club stores : 11Clark County :
0.26 / 10,000 pop.Washington :
0.19 / 10,000 pop.
Number of convenience stores (no gas) : 39This county :
0.94 / 10,000 pop.Washington :
1.18 / 10,000 pop.
Number of convenience stores (with gas) : 93This county :
2.23 / 10,000 pop.Washington :
2.67 / 10,000 pop.
Number of full-service restaurants : 239Clark County :
5.74 / 10,000 pop.State :
8.26 / 10,000 pop.
Adult obesity rate : This county :
27.6%Washington :
25.7%
Low-income preschool obesity rate : This county :
13.7%Washington :
13.9%
Health and Nutrition: Healthy diet rate : Brush Prairie:
49.2%Washington:
49.9%
Average overall health of teeth and gums : This city:
46.5%Washington:
47.2%
Average BMI : Brush Prairie:
29.1Washington:
28.4
People feeling badly about themselves : Brush Prairie:
22.5%Washington:
20.9%
People not drinking alcohol at all : Brush Prairie:
8.0%State:
10.5%
Average hours sleeping at night : This city:
6.8Washington:
6.8
Overweight people : This city:
39.1%Washington:
32.8%
General health condition : This city:
55.8%Washington:
56.8%
Average condition of hearing : This city:
77.4%State:
79.4%
More about Health and Nutrition of Brush Prairie, WA Residents
7.99% of this county's 2021 resident taxpayers lived in other counties in 2020 ($91,627 average adjusted gross income )
Here:
7.99%Washington average:
7.53%
0.03% of residents moved from foreign countries ($212 average AGI )Clark County:
0.03%Washington average:
0.05%
Top counties from which taxpayers relocated into this county between 2020 and 2021:
6.69% of this county's 2020 resident taxpayers moved to other counties in 2021 ($81,466 average adjusted gross income )
Here:
6.69%Washington average:
7.40%
0.01% of residents moved to foreign countries ($99 average AGI )Clark County:
0.01%Washington average:
0.04%
Top counties to which taxpayers relocated from this county between 2020 and 2021: Businesses in Brush Prairie, WA
Strongest AM radio stations in Brush Prairie:
KPAM (860 AM; 50 kW; TROUTDALE, OR; Owner: PAMPLIN BROADCASTING-OREGON, INC.)
KKAD (1550 AM; 50 kW; VANCOUVER, WA; Owner: PAMPLIN BROADCASTING-WASHINGTON, INC)
KOTK (1080 AM; 50 kW; PORTLAND, OR; Owner: FISHER BROADCASTING - PORTLAND RADIO, L.L.C.)
KPOJ (620 AM; 50 kW; PORTLAND, OR; Owner: CITICASTERS LICENSES, L.P.)
KXL (750 AM; 50 kW; PORTLAND, OR; Owner: ROSE CITY RADIO CORPORATION)
KEX (1190 AM; 50 kW; PORTLAND, OR; Owner: CITICASTERS LICENSES, L.P.)
KKGT (1150 AM; 5 kW; PORTLAND, OR; Owner: WESTERN BROADCASTING COMPANY)
KFXX (910 AM; 10 kW; VANCOUVER, WA; Owner: ENTERCOM PORTLAND LICENSE, LLC (DE))
KKSN (1520 AM; 50 kW; OREGON CITY, OR; Owner: ENTERCOM PORTLAND LICENSE, LLC)
KDZR (1640 AM; 10 kW; LAKE OSWEGO, OR; Owner: ABC, INC.)
KUPL (970 AM; 5 kW; PORTLAND, OR; Owner: INFINITY RADIO OPERATIONS INC.)
KKSL (1290 AM; 10 kW; LAKE OSWEGO, OR; Owner: ABC, INC.)
KGUY (1010 AM; daytime; 4 kW; MILWAUKIE, OR; Owner: NORTHWEST RADIO BROADCASTING COMPANY)
Strongest FM radio stations in Brush Prairie:
KRVO (105.9 FM; VANCOUVER, WA; Owner: CITICASTERS LICENSES, L.P.)
KINK (101.9 FM; PORTLAND, OR; Owner: INFINITY RADIO OPERATIONS INC.)
KKCW (103.3 FM; BEAVERTON, OR; Owner: CITICASTERS LICENSES, L.P.)
KOPB-FM (91.5 FM; PORTLAND, OR; Owner: OREGON PUBLIC BROADCASTING)
KPDQ-FM (93.7 FM; PORTLAND, OR; Owner: SALEM MEDIA OF OREGON, INC.)
KKRZ (100.3 FM; PORTLAND, OR; Owner: CITICASTERS LICENSES, L.P.)
K273AI (102.5 FM; ARIEL, WA; Owner: CALVARY CHAPEL OF TWIN FALLS, INC.)
KUFO-FM (101.1 FM; PORTLAND, OR; Owner: INFINITY RADIO OPERATIONS INC.)
KMHD (89.1 FM; GRESHAM, OR; Owner: MT. HOOD COMMUNITY COLLEGE DISTRICT)
KVMX (107.5 FM; BANKS, OR; Owner: INFINITY RADIO OPERATIONS INC.)
KLTH (106.7 FM; LAKE OSWEGO, OR; Owner: INIFINITY RADIO OF PORTLAND INC.)
KUPL-FM (98.7 FM; PORTLAND, OR; Owner: INFINITY RADIO OF PORTLAND INC.)
KBVM (88.3 FM; PORTLAND, OR; Owner: CATHOLIC BROADCASTING NORTHWEST, INC)
KBPS-FM (89.9 FM; PORTLAND, OR; Owner: SCHOOL DISTRICT #1, MULTNOMAH COUNTY, OR)
KNRK (94.7 FM; CAMAS, WA; Owner: ENTERCOM PORTLAND LICENSE, LLC (DE))
KFIS (104.1 FM; SCAPPOOSE, OR; Owner: CARON BROADCASTING, INC.)
KBOO (90.7 FM; PORTLAND, OR; Owner: THE KBOO FOUNDATION)
KWJJ-FM (99.5 FM; PORTLAND, OR; Owner: FISHER BROADCASTING - PORTLAND RADIO, L.L.C.)
KGON (92.3 FM; PORTLAND, OR; Owner: ENTERCOM PORTLAND LICENSE, LLC (DE))
KKSN-FM (97.1 FM; PORTLAND, OR; Owner: ENTERCOM PORTLAND LICENSE, LLC (DE))
TV broadcast stations around Brush Prairie:
KATU (Channel 2; PORTLAND, OR; Owner: FISHER BROADCASTING - PORTLAND TV, L.L.C.)
KPDX (Channel 49; VANCOUVER, WA; Owner: MEREDITH CORPORATION)
KPTV (Channel 12; PORTLAND, OR; Owner: MEREDITH CORPORATION)
K57IF (Channel 57; SALEM, OR; Owner: LaGRANDE BROADCASTING, INC.)
KOIN (Channel 6; PORTLAND, OR; Owner: EMMIS TELEVISION LICENSE CORPORATION)
KNMT (Channel 24; PORTLAND, OR; Owner: NATIONAL MINORITY T.V., INC.)
KGW (Channel 8; PORTLAND, OR; Owner: KING BROADCASTING COMPANY)
KOPB-TV (Channel 10; PORTLAND, OR; Owner: OREGON PUBLIC BROADCASTING)
KPXG-LP (Channel 54; PORTLAND, OR; Owner: PAXSON COMMUNICATIONS LICENSE COMPANY, LLC)
K14HN (Channel 14; VANCOUVER/CAMAS, WA; Owner: MEREDITH CORPORATION)
KWBP-LP (Channel 4; PORTLAND, OR; Owner: TRIBUNE BROADCASTING HOLDINGS, INC.)
KOXI-CA (Channel 19; CAMAS, WA; Owner: WATCHTV, INC.)
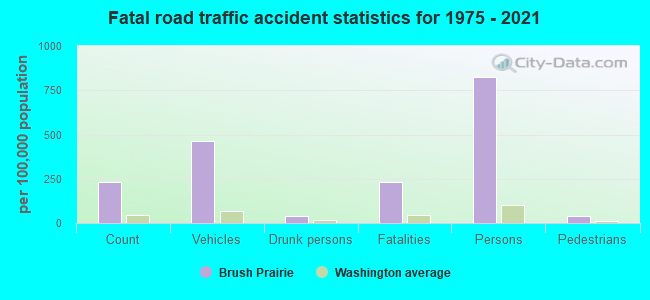
Brush Prairie fatal accident statistics for 1975 - 2021
Brush Prairie fatal accident list:
Jun 13, 2020 07:30 PM, Cr-Ne 139th St, Lat: 45.722342, Lon: -122.587811, Vehicles: 1, Persons: 1, Pedestrians: 1, Fatalities: 1Lat: 45.726392, Lon: -122.523769, Vehicles: 1, Persons: 1, Fatalities: 1, Drunk persons involved: 1Lat: 45.730675, Lon: -122.552089, Vehicles: 2, Persons: 2, Fatalities: 1Lat: 45.733767, Lon: -122.551572, Vehicles: 3, Persons: 4, Fatalities: 1Lat: 45.707881, Lon: -122.557750, Vehicles: 2, Persons: 4, Fatalities: 1Vehicles: 3, Persons: 9, Fatalities: 1
National Bridge Inventory (NBI) Statistics 2 Number of bridges49ft / 15.1m Total length $15,713,000 Total costs28,586 Total average daily traffic1,796 Total average daily truck traffic43,750 Total future (year 2039) average daily traffic
FCC Registered Antenna Towers: 36 (
See the full list of FCC Registered Antenna Towers in Brush Prairie )
FCC Registered Broadcast Land Mobile Towers: 6
Little East Resv Ne 169 St & Ne 230 Ave (Lat: 45.744000 Lon: -122.437306), Structure height: 12 m, Call Sign: WPDH721, Assigned Frequencies: 173.287 MHz, Grant Date: 03/06/2024, Expiration Date: 03/08/2034, Registrant: Clark Public Utilities, 8600 Ne 117th Ave, Vancouver, WA 98662, Phone: (360) 992-8832, Email:
Lat: 45.732056 Lon: -122.547306, Call Sign: WPWC378, Assigned Frequencies: 451.337 MHz, 452.112 MHz, 452.137 MHz, 452.287 MHz, Grant Date: 10/09/2002, Expiration Date: 10/09/2012, Cancellation Date: 12/15/2012, Certifier: Daniel Massie, Registrant: Radio Licensing Services, P.O. Box 22161, Milwaukie, OR 97222, Phone: (503) 659-1240, Fax: (503) 659-4723Call Sign: WPYU534, Assigned Frequencies: 466.850 MHz, Grant Date: 09/06/2013, Expiration Date: 10/30/2023, Cancellation Date: 12/30/2023, Certifier: Barry Gourley, Registrant: Radio Licensing Services, 4700 Se International Way, Milwaukie, OR 97222, Phone: (503) 659-1240, Fax: (503) 794-3759, Email:
Call Sign: WQAD906, Assigned Frequencies: 458.387 MHz, Grant Date: 06/06/2014, Expiration Date: 05/13/2024, Certifier: Margaret Bates, Registrant: Radio Licensing Services, Milwaukie, OR 97267, Phone: (503) 794-3787, Fax: (503) 794-3759, Email:
Lat: 45.742833 Lon: -122.524917, Call Sign: WRAX460, Assigned Frequencies: 467.212 MHz, Grant Date: 04/03/2018, Expiration Date: 04/03/2028, Certifier: Tim A Tormanen, Registrant: Innovation Wireless, 5306 Beethoven Street, Los Angeles, CA 90066, Phone: (888) 559-5565, Fax: (310) 482-3480, Email:
Clark County, Lat: 45.752667 Lon: -122.450139, Call Sign: WRVQ388, Assigned Frequencies: 458.900 MHz, Grant Date: 12/21/2022, Expiration Date: 12/21/2032, Certifier: Anthony Blackmon, Registrant: Radio Licensing Services, 4700 Se International Way, Milwaukie, OR 97269, Phone: (503) 659-1240, Email:
FCC Registered Amateur Radio Licenses: 116 (
See the full list of FCC Registered Amateur Radio Licenses in Brush Prairie )
FAA Registered Aircraft: 33 (
See the full list of FAA Registered Aircraft in Brush Prairie )
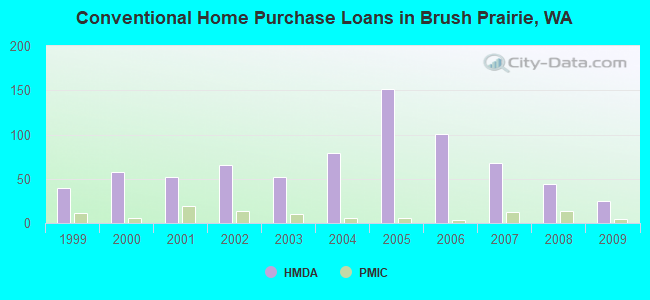
Home Mortgage Disclosure Act Aggregated Statistics For Year 2009(Based on 1 partial tract) A) FHA, FSA/RHS & VA B) Conventional C) Refinancings D) Home Improvement Loans F) Non-occupant Loans on G) Loans On Manufactured Number Average Value Number Average Value Number Average Value Number Average Value Number Average Value Number Average Value
LOANS ORIGINATED 28 $259,698 25 $226,506 132 $246,931 6 $131,293 10 $208,564 1 $36,950 APPLICATIONS APPROVED, NOT ACCEPTED 3 $255,917 6 $255,915 14 $259,276 1 $112,900 2 $175,515 1 $19,500 APPLICATIONS DENIED 4 $270,970 8 $265,901 46 $254,425 2 $149,085 3 $220,163 4 $71,462 APPLICATIONS WITHDRAWN 2 $205,025 4 $184,110 24 $271,632 1 $186,800 1 $247,880 1 $35,410 FILES CLOSED FOR INCOMPLETENESS 1 $133,950 2 $128,815 2 $190,655 1 $43,620 1 $38,490 1 $18,480
Aggregated Statistics For Year 2008(Based on 1 partial tract) A) FHA, FSA/RHS & VA B) Conventional C) Refinancings D) Home Improvement Loans F) Non-occupant Loans on G) Loans On Manufactured Number Average Value Number Average Value Number Average Value Number Average Value Number Average Value Number Average Value
LOANS ORIGINATED 16 $278,475 44 $249,917 81 $229,660 2 $61,585 9 $182,300 2 $25,145 APPLICATIONS APPROVED, NOT ACCEPTED 2 $316,130 9 $321,948 24 $258,995 1 $84,160 2 $265,070 1 $36,440 APPLICATIONS DENIED 1 $198,100 10 $233,403 49 $277,714 4 $47,342 2 $198,095 4 $106,105 APPLICATIONS WITHDRAWN 2 $343,585 5 $304,020 13 $322,922 1 $23,090 2 $143,440 1 $132,410 FILES CLOSED FOR INCOMPLETENESS 1 $121,630 3 $344,527 6 $223,927 1 $510 1 $132,920 1 $510
Aggregated Statistics For Year 2007(Based on 1 partial tract) A) FHA, FSA/RHS & VA B) Conventional C) Refinancings D) Home Improvement Loans F) Non-occupant Loans on G) Loans On Manufactured Number Average Value Number Average Value Number Average Value Number Average Value Number Average Value Number Average Value
LOANS ORIGINATED 1 $125,730 68 $258,215 108 $261,100 9 $150,881 8 $254,868 2 $134,200 APPLICATIONS APPROVED, NOT ACCEPTED 0 $0 14 $253,191 31 $250,806 1 $63,640 2 $178,080 2 $24,120 APPLICATIONS DENIED 3 $202,713 21 $303,594 63 $249,977 7 $131,013 4 $192,450 3 $150,710 APPLICATIONS WITHDRAWN 0 $0 10 $243,359 25 $236,524 0 $0 2 $240,180 0 $0 FILES CLOSED FOR INCOMPLETENESS 0 $0 2 $340,765 9 $339,054 2 $87,245 1 $287,390 0 $0
Aggregated Statistics For Year 2006(Based on 1 partial tract) A) FHA, FSA/RHS & VA B) Conventional C) Refinancings D) Home Improvement Loans F) Non-occupant Loans on G) Loans On Manufactured Number Average Value Number Average Value Number Average Value Number Average Value Number Average Value Number Average Value
LOANS ORIGINATED 1 $275,590 101 $225,523 130 $238,800 16 $101,999 13 $185,818 2 $118,035 APPLICATIONS APPROVED, NOT ACCEPTED 0 $0 19 $220,568 23 $241,405 4 $106,490 0 $0 1 $23,610 APPLICATIONS DENIED 1 $301,760 25 $240,013 48 $235,163 9 $55,653 3 $261,390 2 $67,485 APPLICATIONS WITHDRAWN 0 $0 17 $206,397 32 $238,141 3 $191,080 3 $155,500 0 $0 FILES CLOSED FOR INCOMPLETENESS 0 $0 4 $126,505 7 $359,313 1 $12,830 0 $0 0 $0
Aggregated Statistics For Year 2005(Based on 1 partial tract) A) FHA, FSA/RHS & VA B) Conventional C) Refinancings D) Home Improvement Loans F) Non-occupant Loans on G) Loans On Manufactured Number Average Value Number Average Value Number Average Value Number Average Value Number Average Value Number Average Value
LOANS ORIGINATED 2 $277,385 151 $195,179 145 $197,359 11 $120,415 21 $202,225 3 $79,373 APPLICATIONS APPROVED, NOT ACCEPTED 0 $0 21 $199,928 34 $178,594 3 $68,257 2 $219,650 2 $78,775 APPLICATIONS DENIED 0 $0 30 $198,403 65 $206,662 10 $81,753 7 $230,867 2 $52,605 APPLICATIONS WITHDRAWN 0 $0 18 $209,699 47 $212,901 3 $153,617 3 $177,227 1 $95,970 FILES CLOSED FOR INCOMPLETENESS 0 $0 5 $128,710 20 $243,000 1 $10,260 1 $346,920 0 $0
Aggregated Statistics For Year 2004(Based on 1 partial tract) A) FHA, FSA/RHS & VA B) Conventional C) Refinancings D) Home Improvement Loans F) Non-occupant Loans on G) Loans On Manufactured Number Average Value Number Average Value Number Average Value Number Average Value Number Average Value Number Average Value
LOANS ORIGINATED 8 $171,024 79 $177,502 121 $184,358 6 $178,080 8 $154,922 4 $97,638 APPLICATIONS APPROVED, NOT ACCEPTED 1 $91,350 14 $174,268 31 $171,160 1 $15,400 2 $160,120 1 $81,600 APPLICATIONS DENIED 1 $162,170 14 $189,371 48 $187,019 9 $72,760 2 $127,530 2 $123,425 APPLICATIONS WITHDRAWN 1 $102,640 8 $143,696 40 $155,025 3 $50,637 3 $141,643 1 $87,760 FILES CLOSED FOR INCOMPLETENESS 1 $72,360 1 $234,530 11 $237,332 1 $132,920 0 $0 0 $0
Aggregated Statistics For Year 2003(Based on 1 partial tract) A) FHA, FSA/RHS & VA B) Conventional C) Refinancings D) Home Improvement Loans F) Non-occupant Loans on Number Average Value Number Average Value Number Average Value Number Average Value Number Average Value
LOANS ORIGINATED 10 $166,585 52 $156,644 284 $160,765 4 $25,018 14 $120,859 APPLICATIONS APPROVED, NOT ACCEPTED 1 $166,790 5 $89,502 30 $188,601 3 $48,583 2 $132,920 APPLICATIONS DENIED 1 $157,550 12 $153,190 61 $189,514 6 $27,627 4 $133,048 APPLICATIONS WITHDRAWN 1 $64,150 8 $170,254 44 $174,301 1 $5,130 2 $110,850 FILES CLOSED FOR INCOMPLETENESS 0 $0 1 $83,650 6 $170,810 1 $43,620 1 $27,710
Aggregated Statistics For Year 2002(Based on 1 partial tract) A) FHA, FSA/RHS & VA B) Conventional C) Refinancings D) Home Improvement Loans F) Non-occupant Loans on Number Average Value Number Average Value Number Average Value Number Average Value Number Average Value
LOANS ORIGINATED 23 $156,280 65 $157,071 181 $159,137 6 $31,220 11 $128,300 APPLICATIONS APPROVED, NOT ACCEPTED 2 $166,020 10 $153,242 24 $156,291 3 $19,330 2 $90,835 APPLICATIONS DENIED 1 $72,360 7 $118,476 48 $128,888 4 $16,680 4 $126,248 APPLICATIONS WITHDRAWN 2 $126,505 5 $149,444 42 $161,255 1 $102,640 2 $94,170 FILES CLOSED FOR INCOMPLETENESS 0 $0 3 $116,667 11 $184,938 0 $0 1 $152,420
Aggregated Statistics For Year 2001(Based on 1 partial tract) A) FHA, FSA/RHS & VA B) Conventional C) Refinancings D) Home Improvement Loans F) Non-occupant Loans on Number Average Value Number Average Value Number Average Value Number Average Value Number Average Value
LOANS ORIGINATED 27 $153,713 52 $145,986 137 $155,878 16 $28,066 6 $149,427 APPLICATIONS APPROVED, NOT ACCEPTED 4 $137,410 6 $190,825 16 $145,652 2 $12,315 2 $129,325 APPLICATIONS DENIED 3 $141,473 5 $115,162 36 $144,452 3 $15,053 2 $71,080 APPLICATIONS WITHDRAWN 2 $147,030 5 $194,810 26 $155,203 2 $128,555 1 $55,430 FILES CLOSED FOR INCOMPLETENESS 0 $0 1 $19,500 5 $102,538 0 $0 0 $0
Aggregated Statistics For Year 2000(Based on 1 partial tract) A) FHA, FSA/RHS & VA B) Conventional C) Refinancings D) Home Improvement Loans F) Non-occupant Loans on Number Average Value Number Average Value Number Average Value Number Average Value Number Average Value
LOANS ORIGINATED 11 $148,128 58 $142,767 33 $134,894 10 $27,713 4 $128,042 APPLICATIONS APPROVED, NOT ACCEPTED 2 $85,190 13 $107,456 11 $155,360 3 $17,107 1 $82,110 APPLICATIONS DENIED 2 $152,675 9 $89,639 16 $123,361 4 $61,070 0 $0 APPLICATIONS WITHDRAWN 1 $83,140 5 $226,322 10 $147,237 2 $94,685 1 $43,110 FILES CLOSED FOR INCOMPLETENESS 0 $0 2 $139,845 2 $172,180 0 $0 0 $0
Aggregated Statistics For Year 1999(Based on 1 partial tract) A) FHA, FSA/RHS & VA B) Conventional C) Refinancings D) Home Improvement Loans F) Non-occupant Loans on Number Average Value Number Average Value Number Average Value Number Average Value Number Average Value
LOANS ORIGINATED 21 $133,671 40 $138,874 61 $151,258 13 $46,640 5 $119,770 APPLICATIONS APPROVED, NOT ACCEPTED 0 $0 5 $104,638 13 $134,291 3 $28,043 1 $125,940 APPLICATIONS DENIED 1 $144,360 8 $108,645 22 $173,302 5 $16,328 1 $163,780 APPLICATIONS WITHDRAWN 0 $0 3 $128,433 11 $143,909 1 $35,840 0 $0 FILES CLOSED FOR INCOMPLETENESS 0 $0 0 $0 4 $125,445 0 $0 0 $0
Detailed HMDA statistics for the following Tracts:
0407.02
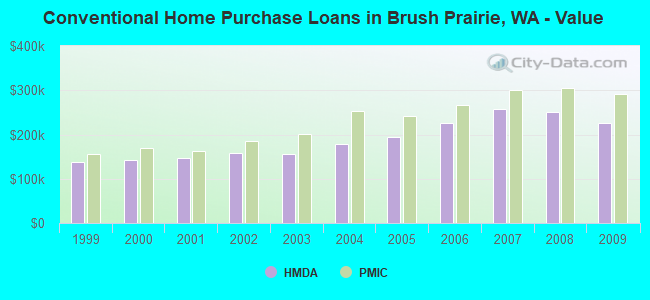
Private Mortgage Insurance Companies Aggregated Statistics For Year 2009(Based on 1 partial tract) A) Conventional B) Refinancings Number Average Value Number Average Value
LOANS ORIGINATED 4 $290,855 5 $229,298 APPLICATIONS APPROVED, NOT ACCEPTED 4 $324,085 1 $280,720 APPLICATIONS DENIED 1 $321,260 0 $0 APPLICATIONS WITHDRAWN 0 $0 0 $0 FILES CLOSED FOR INCOMPLETENESS 0 $0 1 $169,360
Aggregated Statistics For Year 2008(Based on 1 partial tract) A) Conventional B) Refinancings C) Non-occupant Loans on Number Average Value Number Average Value Number Average Value
LOANS ORIGINATED 13 $306,144 5 $268,814 1 $132,920 APPLICATIONS APPROVED, NOT ACCEPTED 4 $311,770 5 $248,800 1 $294,580 APPLICATIONS DENIED 1 $106,750 3 $325,027 1 $205,280 APPLICATIONS WITHDRAWN 3 $250,440 0 $0 0 $0 FILES CLOSED FOR INCOMPLETENESS 1 $156,010 0 $0 0 $0
Aggregated Statistics For Year 2007(Based on 1 partial tract) A) Conventional B) Refinancings C) Non-occupant Loans on D) Loans On Manufactured Number Average Value Number Average Value Number Average Value Number Average Value
LOANS ORIGINATED 12 $300,436 7 $337,246 1 $406,450 1 $115,470 APPLICATIONS APPROVED, NOT ACCEPTED 3 $276,613 2 $246,595 0 $0 1 $230,940 APPLICATIONS DENIED 1 $115,470 0 $0 0 $0 1 $115,470 APPLICATIONS WITHDRAWN 2 $256,345 2 $249,415 0 $0 0 $0 FILES CLOSED FOR INCOMPLETENESS 0 $0 1 $163,710 0 $0 0 $0
Aggregated Statistics For Year 2006(Based on 1 partial tract) A) Conventional B) Refinancings Number Average Value Number Average Value
LOANS ORIGINATED 3 $265,667 2 $259,165 APPLICATIONS APPROVED, NOT ACCEPTED 1 $175,000 2 $213,235 APPLICATIONS DENIED 0 $0 0 $0 APPLICATIONS WITHDRAWN 0 $0 0 $0 FILES CLOSED FOR INCOMPLETENESS 0 $0 0 $0
Aggregated Statistics For Year 2005(Based on 1 partial tract) A) Conventional B) Refinancings C) Non-occupant Loans on Number Average Value Number Average Value Number Average Value
LOANS ORIGINATED 6 $240,862 5 $238,844 1 $111,880 APPLICATIONS APPROVED, NOT ACCEPTED 1 $329,470 1 $191,420 0 $0 APPLICATIONS DENIED 0 $0 1 $178,590 0 $0 APPLICATIONS WITHDRAWN 0 $0 0 $0 0 $0 FILES CLOSED FOR INCOMPLETENESS 0 $0 0 $0 0 $0
Aggregated Statistics For Year 2004(Based on 1 partial tract) A) Conventional B) Refinancings Number Average Value Number Average Value
LOANS ORIGINATED 6 $252,323 7 $217,817 APPLICATIONS APPROVED, NOT ACCEPTED 1 $114,960 2 $329,475 APPLICATIONS DENIED 0 $0 0 $0 APPLICATIONS WITHDRAWN 0 $0 0 $0 FILES CLOSED FOR INCOMPLETENESS 0 $0 0 $0
Aggregated Statistics For Year 2003(Based on 1 partial tract) A) Conventional B) Refinancings C) Non-occupant Loans on Number Average Value Number Average Value Number Average Value
LOANS ORIGINATED 10 $200,815 17 $166,881 1 $64,660 APPLICATIONS APPROVED, NOT ACCEPTED 2 $125,990 7 $221,116 0 $0 APPLICATIONS DENIED 1 $75,440 1 $74,410 0 $0 APPLICATIONS WITHDRAWN 1 $75,950 1 $79,550 1 $79,550 FILES CLOSED FOR INCOMPLETENESS 0 $0 1 $74,410 0 $0
Aggregated Statistics For Year 2002(Based on 1 partial tract) A) Conventional B) Refinancings Number Average Value Number Average Value
LOANS ORIGINATED 13 $185,344 12 $164,010 APPLICATIONS APPROVED, NOT ACCEPTED 2 $146,005 4 $160,118 APPLICATIONS DENIED 1 $62,100 0 $0 APPLICATIONS WITHDRAWN 0 $0 1 $43,620 FILES CLOSED FOR INCOMPLETENESS 0 $0 0 $0
Aggregated Statistics For Year 2001(Based on 1 partial tract) A) Conventional B) Refinancings C) Non-occupant Loans on Number Average Value Number Average Value Number Average Value
LOANS ORIGINATED 19 $163,089 13 $192,489 1 $173,460 APPLICATIONS APPROVED, NOT ACCEPTED 3 $186,633 2 $162,940 1 $204,250 APPLICATIONS DENIED 1 $129,330 2 $262,760 1 $123,170 APPLICATIONS WITHDRAWN 0 $0 0 $0 0 $0 FILES CLOSED FOR INCOMPLETENESS 0 $0 0 $0 0 $0
Aggregated Statistics For Year 2000(Based on 1 partial tract) A) Conventional B) Refinancings Number Average Value Number Average Value
LOANS ORIGINATED 6 $169,185 2 $119,320 APPLICATIONS APPROVED, NOT ACCEPTED 2 $124,195 0 $0 APPLICATIONS DENIED 0 $0 1 $167,300 APPLICATIONS WITHDRAWN 0 $0 0 $0 FILES CLOSED FOR INCOMPLETENESS 0 $0 0 $0
Aggregated Statistics For Year 1999(Based on 1 partial tract) A) Conventional B) Refinancings C) Non-occupant Loans on Number Average Value Number Average Value Number Average Value
LOANS ORIGINATED 11 $155,405 4 $174,602 1 $118,480 APPLICATIONS APPROVED, NOT ACCEPTED 0 $0 1 $142,370 0 $0 APPLICATIONS DENIED 0 $0 0 $0 0 $0 APPLICATIONS WITHDRAWN 0 $0 0 $0 0 $0 FILES CLOSED FOR INCOMPLETENESS 0 $0 0 $0 0 $0
Detailed PMIC statistics for the following Tracts:
0407.02
Brush Prairie compared to Washington state average:
Black race population percentage significantly below state average. Hispanic race population percentage below state average. Median age significantly above state average. Foreign-born population percentage significantly below state average. Renting percentage significantly below state average. Length of stay since moving in significantly above state average. Number of rooms per house above state average. Brush Prairie on our top lists :
#7 on the list of "Top 101 cities with the most residents born in Russia (population 500+)"
#63 on the list of "Top 101 cities with the most residents born in Eastern Europe (population 500+)"
#9 on the list of "Top 101 counties with the largest increase in the number of infant deaths per 1000 residents 2000-2006 to 2007-2013 (pop. 50,000+)"
#26 on the list of "Top 101 counties with the highest average weight of females"
#45 on the list of "Top 101 counties with the highest percentage of residents that exercised in the past month"
#59 on the list of "Top 101 counties with the lowest Ozone (1-hour) air pollution readings in 2012 (ppm)"
#62 on the list of "Top 101 counties with the highest ground withdrawal of fresh water for public supply"
Top Patent Applicants
Joel Bennett Acker, Jr. (27)
Jefferson P. Ward (20)
Edward L. Flick (7)
Jason M. Quintana (5)
Daniel Paul Miller (4)
David M. Hall (4)
Russell P. Yearout (4)
Teressa L. Roth (4)
Edward Winslow King (4)
Connie A. Sarkinen (3)
Total of 124 patent applications in 2008-2024.


 Recent articles from our blog. Our writers, many of them Ph.D. graduates or candidates, create easy-to-read articles on a wide variety of topics.

 (7.2 miles
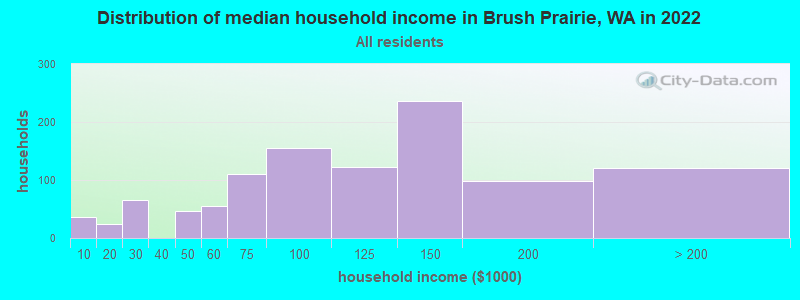


 According to the data from the years 2003 - 2018 the average number of fire incidents per year is 46. The highest number of reported fire incidents - 68 took place in 2004, and the least - 29 in 2016. The data has a declining trend.
 When looking into fire subcategories, the most reports belonged to: Outside Fires (40.8%), and Structure Fires (39.2%).