Estimated zip code population in 2022: 19,868
Zip code population in 2010: 12,480
Zip code population in 2000: 7,009
Houses and condos: 7,995
Renter-occupied apartments: 1,960
% of renters here:
25%State:
36%
March 2022 cost of living index in zip code 99016: 96.0
(near average, U.S. average is 100)
Land area: 25.2
sq. mi.
Water area: 0.1
sq. mi.
Population density: 788 people per square mile (low).
OSM Map
General Map
Google Map
MSN Map
OSM Map
General Map
Google Map
MSN Map
OSM Map
General Map
Google Map
MSN Map
OSM Map
General Map
Google Map
MSN Map
Please wait while loading the map...
Real estate property taxes paid for housing units in 2022:
This zip code:
0.8% ($3,992)Washington:
0.8% ($4,283)
Median real estate property taxes paid for housing units with mortgages in 2022: $4,309 (0.8%)
Median real estate property taxes paid for housing units with no mortgage in 2022: $3,518 (0.8%)
Profiles of local businesses
Business Search - 14 Million verified businesses
Males: 9,361 Females: 10,505
For population 25 years and over in 99016:
High school or higher: 95.7%Bachelor's degree or higher: 42.8%Graduate or professional degree: 17.6%Unemployed: 4.0%Mean travel time to work (commute): 22.1 minutes
For population 15 years and over in 99016:
Never married: 19.4%Now married: 60.9%Separated: 2.1%Widowed: 4.0%Divorced: 13.6%
Zip code 99016 compared to state average:
Black race population percentage below state average. Hispanic race population percentage below state average. Foreign-born population percentage below state average. House age below state average. Number of college students below state average. 16,329 82.2% White 1,335 6.7% Hispanic or Latino 1,122 5.6% Asian 778 3.9% Two or more races 281 1.4% Black 20 0.1% American Indian
Data:
Median household income ($)
Median household income (% change since 2000)
Household income diversity
Ratio of average income to average house value (%)
Ratio of average income to average rent
Median household income ($) - White
Median household income ($) - Black or African American
Median household income ($) - Asian
Median household income ($) - Hispanic or Latino
Median household income ($) - American Indian and Alaska Native
Median household income ($) - Multirace
Median household income ($) - Other Race
Median household income for houses/condos with a mortgage ($)
Median household income for apartments without a mortgage ($)
Races - White alone (%)
Races - White alone (% change since 2000)
Races - Black alone (%)
Races - Black alone (% change since 2000)
Races - American Indian alone (%)
Races - American Indian alone (% change since 2000)
Races - Asian alone (%)
Races - Asian alone (% change since 2000)
Races - Hispanic (%)
Races - Hispanic (% change since 2000)
Races - Native Hawaiian and Other Pacific Islander alone (%)
Races - Native Hawaiian and Other Pacific Islander alone (% change since 2000)
Races - Two or more races (%)
Races - Two or more races (% change since 2000)
Races - Other race alone (%)
Races - Other race alone (% change since 2000)
Racial diversity
Unemployment (%)
Unemployment (% change since 2000)
Unemployment (%) - White
Unemployment (%) - Black or African American
Unemployment (%) - Asian
Unemployment (%) - Hispanic or Latino
Unemployment (%) - American Indian and Alaska Native
Unemployment (%) - Multirace
Unemployment (%) - Other Race
Population density (people per square mile)
Population - Males (%)
Population - Females (%)
Population - Males (%) - White
Population - Males (%) - Black or African American
Population - Males (%) - Asian
Population - Males (%) - Hispanic or Latino
Population - Males (%) - American Indian and Alaska Native
Population - Males (%) - Multirace
Population - Males (%) - Other Race
Population - Females (%) - White
Population - Females (%) - Black or African American
Population - Females (%) - Asian
Population - Females (%) - Hispanic or Latino
Population - Females (%) - American Indian and Alaska Native
Population - Females (%) - Multirace
Population - Females (%) - Other Race
Coronavirus confirmed cases (Apr 27, 2024)
Deaths caused by coronavirus (Apr 27, 2024)
Coronavirus confirmed cases (per 100k population) (Apr 27, 2024)
Deaths caused by coronavirus (per 100k population) (Apr 27, 2024)
Daily increase in number of cases (Apr 27, 2024)
Weekly increase in number of cases (Apr 27, 2024)
Cases doubled (in days) (Apr 27, 2024)
Hospitalized patients (Apr 18, 2022)
Negative test results (Apr 18, 2022)
Total test results (Apr 18, 2022)
COVID Vaccine doses distributed (per 100k population) (Sep 19, 2023)
COVID Vaccine doses administered (per 100k population) (Sep 19, 2023)
COVID Vaccine doses distributed (Sep 19, 2023)
COVID Vaccine doses administered (Sep 19, 2023)
Likely homosexual households (%)
Likely homosexual households (% change since 2000)
Likely homosexual households - Lesbian couples (%)
Likely homosexual households - Lesbian couples (% change since 2000)
Likely homosexual households - Gay men (%)
Likely homosexual households - Gay men (% change since 2000)
Cost of living index
Median gross rent ($)
Median contract rent ($)
Median monthly housing costs ($)
Median house or condo value ($)
Median house or condo value ($ change since 2000)
Mean house or condo value by units in structure - 1, detached ($)
Mean house or condo value by units in structure - 1, attached ($)
Mean house or condo value by units in structure - 2 ($)
Mean house or condo value by units in structure by units in structure - 3 or 4 ($)
Mean house or condo value by units in structure - 5 or more ($)
Mean house or condo value by units in structure - Boat, RV, van, etc. ($)
Mean house or condo value by units in structure - Mobile home ($)
Median house or condo value ($) - White
Median house or condo value ($) - Black or African American
Median house or condo value ($) - Asian
Median house or condo value ($) - Hispanic or Latino
Median house or condo value ($) - American Indian and Alaska Native
Median house or condo value ($) - Multirace
Median house or condo value ($) - Other Race
Median resident age
Resident age diversity
Median resident age - Males
Median resident age - Females
Median resident age - White
Median resident age - Black or African American
Median resident age - Asian
Median resident age - Hispanic or Latino
Median resident age - American Indian and Alaska Native
Median resident age - Multirace
Median resident age - Other Race
Median resident age - Males - White
Median resident age - Males - Black or African American
Median resident age - Males - Asian
Median resident age - Males - Hispanic or Latino
Median resident age - Males - American Indian and Alaska Native
Median resident age - Males - Multirace
Median resident age - Males - Other Race
Median resident age - Females - White
Median resident age - Females - Black or African American
Median resident age - Females - Asian
Median resident age - Females - Hispanic or Latino
Median resident age - Females - American Indian and Alaska Native
Median resident age - Females - Multirace
Median resident age - Females - Other Race
Commute - mean travel time to work (minutes)
Travel time to work - Less than 5 minutes (%)
Travel time to work - Less than 5 minutes (% change since 2000)
Travel time to work - 5 to 9 minutes (%)
Travel time to work - 5 to 9 minutes (% change since 2000)
Travel time to work - 10 to 19 minutes (%)
Travel time to work - 10 to 19 minutes (% change since 2000)
Travel time to work - 20 to 29 minutes (%)
Travel time to work - 20 to 29 minutes (% change since 2000)
Travel time to work - 30 to 39 minutes (%)
Travel time to work - 30 to 39 minutes (% change since 2000)
Travel time to work - 40 to 59 minutes (%)
Travel time to work - 40 to 59 minutes (% change since 2000)
Travel time to work - 60 to 89 minutes (%)
Travel time to work - 60 to 89 minutes (% change since 2000)
Travel time to work - 90 or more minutes (%)
Travel time to work - 90 or more minutes (% change since 2000)
Marital status - Never married (%)
Marital status - Now married (%)
Marital status - Separated (%)
Marital status - Widowed (%)
Marital status - Divorced (%)
Median family income ($)
Median family income (% change since 2000)
Median non-family income ($)
Median non-family income (% change since 2000)
Median per capita income ($)
Median per capita income (% change since 2000)
Median family income ($) - White
Median family income ($) - Black or African American
Median family income ($) - Asian
Median family income ($) - Hispanic or Latino
Median family income ($) - American Indian and Alaska Native
Median family income ($) - Multirace
Median family income ($) - Other Race
Median year house/condo built
Median year apartment built
Year house built - Built 2005 or later (%)
Year house built - Built 2000 to 2004 (%)
Year house built - Built 1990 to 1999 (%)
Year house built - Built 1980 to 1989 (%)
Year house built - Built 1970 to 1979 (%)
Year house built - Built 1960 to 1969 (%)
Year house built - Built 1950 to 1959 (%)
Year house built - Built 1940 to 1949 (%)
Year house built - Built 1939 or earlier (%)
Average household size
Household density (households per square mile)
Average household size - White
Average household size - Black or African American
Average household size - Asian
Average household size - Hispanic or Latino
Average household size - American Indian and Alaska Native
Average household size - Multirace
Average household size - Other Race
Occupied housing units (%)
Vacant housing units (%)
Owner occupied housing units (%)
Renter occupied housing units (%)
Vacancy status - For rent (%)
Vacancy status - For sale only (%)
Vacancy status - Rented or sold, not occupied (%)
Vacancy status - For seasonal, recreational, or occasional use (%)
Vacancy status - For migrant workers (%)
Vacancy status - Other vacant (%)
Residents with income below the poverty level (%)
Residents with income below 50% of the poverty level (%)
Children below poverty level (%)
Poor families by family type - Married-couple family (%)
Poor families by family type - Male, no wife present (%)
Poor families by family type - Female, no husband present (%)
Poverty status for native-born residents (%)
Poverty status for foreign-born residents (%)
Poverty among high school graduates not in families (%)
Poverty among people who did not graduate high school not in families (%)
Residents with income below the poverty level (%) - White
Residents with income below the poverty level (%) - Black or African American
Residents with income below the poverty level (%) - Asian
Residents with income below the poverty level (%) - Hispanic or Latino
Residents with income below the poverty level (%) - American Indian and Alaska Native
Residents with income below the poverty level (%) - Multirace
Residents with income below the poverty level (%) - Other Race
Air pollution - Air Quality Index (AQI)
Air pollution - CO
Air pollution - NO2
Air pollution - SO2
Air pollution - Ozone
Air pollution - PM10
Air pollution - PM25
Air pollution - Pb
Crime - Murders per 100,000 population
Crime - Rapes per 100,000 population
Crime - Robberies per 100,000 population
Crime - Assaults per 100,000 population
Crime - Burglaries per 100,000 population
Crime - Thefts per 100,000 population
Crime - Auto thefts per 100,000 population
Crime - Arson per 100,000 population
Crime - City-data.com crime index
Crime - Violent crime index
Crime - Property crime index
Crime - Murders per 100,000 population (5 year average)
Crime - Rapes per 100,000 population (5 year average)
Crime - Robberies per 100,000 population (5 year average)
Crime - Assaults per 100,000 population (5 year average)
Crime - Burglaries per 100,000 population (5 year average)
Crime - Thefts per 100,000 population (5 year average)
Crime - Auto thefts per 100,000 population (5 year average)
Crime - Arson per 100,000 population (5 year average)
Crime - City-data.com crime index (5 year average)
Crime - Violent crime index (5 year average)
Crime - Property crime index (5 year average)
1996 Presidential Elections Results (%) - Democratic Party (Clinton)
1996 Presidential Elections Results (%) - Republican Party (Dole)
1996 Presidential Elections Results (%) - Other
2000 Presidential Elections Results (%) - Democratic Party (Gore)
2000 Presidential Elections Results (%) - Republican Party (Bush)
2000 Presidential Elections Results (%) - Other
2004 Presidential Elections Results (%) - Democratic Party (Kerry)
2004 Presidential Elections Results (%) - Republican Party (Bush)
2004 Presidential Elections Results (%) - Other
2008 Presidential Elections Results (%) - Democratic Party (Obama)
2008 Presidential Elections Results (%) - Republican Party (McCain)
2008 Presidential Elections Results (%) - Other
2012 Presidential Elections Results (%) - Democratic Party (Obama)
2012 Presidential Elections Results (%) - Republican Party (Romney)
2012 Presidential Elections Results (%) - Other
2016 Presidential Elections Results (%) - Democratic Party (Clinton)
2016 Presidential Elections Results (%) - Republican Party (Trump)
2016 Presidential Elections Results (%) - Other
2020 Presidential Elections Results (%) - Democratic Party (Biden)
2020 Presidential Elections Results (%) - Republican Party (Trump)
2020 Presidential Elections Results (%) - Other
Ancestries Reported - Arab (%)
Ancestries Reported - Czech (%)
Ancestries Reported - Danish (%)
Ancestries Reported - Dutch (%)
Ancestries Reported - English (%)
Ancestries Reported - French (%)
Ancestries Reported - French Canadian (%)
Ancestries Reported - German (%)
Ancestries Reported - Greek (%)
Ancestries Reported - Hungarian (%)
Ancestries Reported - Irish (%)
Ancestries Reported - Italian (%)
Ancestries Reported - Lithuanian (%)
Ancestries Reported - Norwegian (%)
Ancestries Reported - Polish (%)
Ancestries Reported - Portuguese (%)
Ancestries Reported - Russian (%)
Ancestries Reported - Scotch-Irish (%)
Ancestries Reported - Scottish (%)
Ancestries Reported - Slovak (%)
Ancestries Reported - Subsaharan African (%)
Ancestries Reported - Swedish (%)
Ancestries Reported - Swiss (%)
Ancestries Reported - Ukrainian (%)
Ancestries Reported - United States (%)
Ancestries Reported - Welsh (%)
Ancestries Reported - West Indian (%)
Ancestries Reported - Other (%)
Educational Attainment - No schooling completed (%)
Educational Attainment - Less than high school (%)
Educational Attainment - High school or equivalent (%)
Educational Attainment - Less than 1 year of college (%)
Educational Attainment - 1 or more years of college (%)
Educational Attainment - Associate degree (%)
Educational Attainment - Bachelor's degree (%)
Educational Attainment - Master's degree (%)
Educational Attainment - Professional school degree (%)
Educational Attainment - Doctorate degree (%)
School Enrollment - Nursery, preschool (%)
School Enrollment - Kindergarten (%)
School Enrollment - Grade 1 to 4 (%)
School Enrollment - Grade 5 to 8 (%)
School Enrollment - Grade 9 to 12 (%)
School Enrollment - College undergrad (%)
School Enrollment - Graduate or professional (%)
School Enrollment - Not enrolled in school (%)
School enrollment - Public schools (%)
School enrollment - Private schools (%)
School enrollment - Not enrolled (%)
Median number of rooms in houses and condos
Median number of rooms in apartments
Housing units lacking complete plumbing facilities (%)
Housing units lacking complete kitchen facilities (%)
Density of houses
Urban houses (%)
Rural houses (%)
Households with people 60 years and over (%)
Households with people 65 years and over (%)
Households with people 75 years and over (%)
Households with one or more nonrelatives (%)
Households with no nonrelatives (%)
Population in households (%)
Family households (%)
Nonfamily households (%)
Population in families (%)
Family households with own children (%)
Median number of bedrooms in owner occupied houses
Mean number of bedrooms in owner occupied houses
Median number of bedrooms in renter occupied houses
Mean number of bedrooms in renter occupied houses
Median number of vehichles in owner occupied houses
Mean number of vehichles in owner occupied houses
Median number of vehichles in renter occupied houses
Mean number of vehichles in renter occupied houses
Mortgage status - with mortgage (%)
Mortgage status - with second mortgage (%)
Mortgage status - with home equity loan (%)
Mortgage status - with both second mortgage and home equity loan (%)
Mortgage status - without a mortgage (%)
Average family size
Average family size - White
Average family size - Black or African American
Average family size - Asian
Average family size - Hispanic or Latino
Average family size - American Indian and Alaska Native
Average family size - Multirace
Average family size - Other Race
Geographical mobility - Same house 1 year ago (%)
Geographical mobility - Moved within same county (%)
Geographical mobility - Moved from different county within same state (%)
Geographical mobility - Moved from different state (%)
Geographical mobility - Moved from abroad (%)
Place of birth - Born in state of residence (%)
Place of birth - Born in other state (%)
Place of birth - Native, outside of US (%)
Place of birth - Foreign born (%)
Housing units in structures - 1, detached (%)
Housing units in structures - 1, attached (%)
Housing units in structures - 2 (%)
Housing units in structures - 3 or 4 (%)
Housing units in structures - 5 to 9 (%)
Housing units in structures - 10 to 19 (%)
Housing units in structures - 20 to 49 (%)
Housing units in structures - 50 or more (%)
Housing units in structures - Mobile home (%)
Housing units in structures - Boat, RV, van, etc. (%)
House/condo owner moved in on average (years ago)
Renter moved in on average (years ago)
Year householder moved into unit - Moved in 1999 to March 2000 (%)
Year householder moved into unit - Moved in 1995 to 1998 (%)
Year householder moved into unit - Moved in 1990 to 1994 (%)
Year householder moved into unit - Moved in 1980 to 1989 (%)
Year householder moved into unit - Moved in 1970 to 1979 (%)
Year householder moved into unit - Moved in 1969 or earlier (%)
Means of transportation to work - Drove car alone (%)
Means of transportation to work - Carpooled (%)
Means of transportation to work - Public transportation (%)
Means of transportation to work - Bus or trolley bus (%)
Means of transportation to work - Streetcar or trolley car (%)
Means of transportation to work - Subway or elevated (%)
Means of transportation to work - Railroad (%)
Means of transportation to work - Ferryboat (%)
Means of transportation to work - Taxicab (%)
Means of transportation to work - Motorcycle (%)
Means of transportation to work - Bicycle (%)
Means of transportation to work - Walked (%)
Means of transportation to work - Other means (%)
Working at home (%)
Industry diversity
Most Common Industries - Agriculture, forestry, fishing and hunting, and mining (%)
Most Common Industries - Agriculture, forestry, fishing and hunting (%)
Most Common Industries - Mining, quarrying, and oil and gas extraction (%)
Most Common Industries - Construction (%)
Most Common Industries - Manufacturing (%)
Most Common Industries - Wholesale trade (%)
Most Common Industries - Retail trade (%)
Most Common Industries - Transportation and warehousing, and utilities (%)
Most Common Industries - Transportation and warehousing (%)
Most Common Industries - Utilities (%)
Most Common Industries - Information (%)
Most Common Industries - Finance and insurance, and real estate and rental and leasing (%)
Most Common Industries - Finance and insurance (%)
Most Common Industries - Real estate and rental and leasing (%)
Most Common Industries - Professional, scientific, and management, and administrative and waste management services (%)
Most Common Industries - Professional, scientific, and technical services (%)
Most Common Industries - Management of companies and enterprises (%)
Most Common Industries - Administrative and support and waste management services (%)
Most Common Industries - Educational services, and health care and social assistance (%)
Most Common Industries - Educational services (%)
Most Common Industries - Health care and social assistance (%)
Most Common Industries - Arts, entertainment, and recreation, and accommodation and food services (%)
Most Common Industries - Arts, entertainment, and recreation (%)
Most Common Industries - Accommodation and food services (%)
Most Common Industries - Other services, except public administration (%)
Most Common Industries - Public administration (%)
Occupation diversity
Most Common Occupations - Management, business, science, and arts occupations (%)
Most Common Occupations - Management, business, and financial occupations (%)
Most Common Occupations - Management occupations (%)
Most Common Occupations - Business and financial operations occupations (%)
Most Common Occupations - Computer, engineering, and science occupations (%)
Most Common Occupations - Computer and mathematical occupations (%)
Most Common Occupations - Architecture and engineering occupations (%)
Most Common Occupations - Life, physical, and social science occupations (%)
Most Common Occupations - Education, legal, community service, arts, and media occupations (%)
Most Common Occupations - Community and social service occupations (%)
Most Common Occupations - Legal occupations (%)
Most Common Occupations - Education, training, and library occupations (%)
Most Common Occupations - Arts, design, entertainment, sports, and media occupations (%)
Most Common Occupations - Healthcare practitioners and technical occupations (%)
Most Common Occupations - Health diagnosing and treating practitioners and other technical occupations (%)
Most Common Occupations - Health technologists and technicians (%)
Most Common Occupations - Service occupations (%)
Most Common Occupations - Healthcare support occupations (%)
Most Common Occupations - Protective service occupations (%)
Most Common Occupations - Fire fighting and prevention, and other protective service workers including supervisors (%)
Most Common Occupations - Law enforcement workers including supervisors (%)
Most Common Occupations - Food preparation and serving related occupations (%)
Most Common Occupations - Building and grounds cleaning and maintenance occupations (%)
Most Common Occupations - Personal care and service occupations (%)
Most Common Occupations - Sales and office occupations (%)
Most Common Occupations - Sales and related occupations (%)
Most Common Occupations - Office and administrative support occupations (%)
Most Common Occupations - Natural resources, construction, and maintenance occupations (%)
Most Common Occupations - Farming, fishing, and forestry occupations (%)
Most Common Occupations - Construction and extraction occupations (%)
Most Common Occupations - Installation, maintenance, and repair occupations (%)
Most Common Occupations - Production, transportation, and material moving occupations (%)
Most Common Occupations - Production occupations (%)
Most Common Occupations - Transportation occupations (%)
Most Common Occupations - Material moving occupations (%)
People in Group quarters - Institutionalized population (%)
People in Group quarters - Correctional institutions (%)
People in Group quarters - Federal prisons and detention centers (%)
People in Group quarters - Halfway houses (%)
People in Group quarters - Local jails and other confinement facilities (including police lockups) (%)
People in Group quarters - Military disciplinary barracks (%)
People in Group quarters - State prisons (%)
People in Group quarters - Other types of correctional institutions (%)
People in Group quarters - Nursing homes (%)
People in Group quarters - Hospitals/wards, hospices, and schools for the handicapped (%)
People in Group quarters - Hospitals/wards and hospices for chronically ill (%)
People in Group quarters - Hospices or homes for chronically ill (%)
People in Group quarters - Military hospitals or wards for chronically ill (%)
People in Group quarters - Other hospitals or wards for chronically ill (%)
People in Group quarters - Hospitals or wards for drug/alcohol abuse (%)
People in Group quarters - Mental (Psychiatric) hospitals or wards (%)
People in Group quarters - Schools, hospitals, or wards for the mentally retarded (%)
People in Group quarters - Schools, hospitals, or wards for the physically handicapped (%)
People in Group quarters - Institutions for the deaf (%)
People in Group quarters - Institutions for the blind (%)
People in Group quarters - Orthopedic wards and institutions for the physically handicapped (%)
People in Group quarters - Wards in general hospitals for patients who have no usual home elsewhere (%)
People in Group quarters - Wards in military hospitals for patients who have no usual home elsewhere (%)
People in Group quarters - Juvenile institutions (%)
People in Group quarters - Long-term care (%)
People in Group quarters - Homes for abused, dependent, and neglected children (%)
People in Group quarters - Residential treatment centers for emotionally disturbed children (%)
People in Group quarters - Training schools for juvenile delinquents (%)
People in Group quarters - Short-term care, detention or diagnostic centers for delinquent children (%)
People in Group quarters - Type of juvenile institution unknown (%)
People in Group quarters - Noninstitutionalized population (%)
People in Group quarters - College dormitories (includes college quarters off campus) (%)
People in Group quarters - Military quarters (%)
People in Group quarters - On base (%)
People in Group quarters - Barracks, unaccompanied personnel housing (UPH), (Enlisted/Officer), ;and similar group living quarters for military personnel (%)
People in Group quarters - Transient quarters for temporary residents (%)
People in Group quarters - Military ships (%)
People in Group quarters - Group homes (%)
People in Group quarters - Homes or halfway houses for drug/alcohol abuse (%)
People in Group quarters - Homes for the mentally ill (%)
People in Group quarters - Homes for the mentally retarded (%)
People in Group quarters - Homes for the physically handicapped (%)
People in Group quarters - Other group homes (%)
People in Group quarters - Religious group quarters (%)
People in Group quarters - Dormitories (%)
People in Group quarters - Agriculture workers' dormitories on farms (%)
People in Group quarters - Job Corps and vocational training facilities (%)
People in Group quarters - Other workers' dormitories (%)
People in Group quarters - Crews of maritime vessels (%)
People in Group quarters - Other nonhousehold living situations (%)
People in Group quarters - Other noninstitutional group quarters (%)
Residents speaking English at home (%)
Residents speaking English at home - Born in the United States (%)
Residents speaking English at home - Native, born elsewhere (%)
Residents speaking English at home - Foreign born (%)
Residents speaking Spanish at home (%)
Residents speaking Spanish at home - Born in the United States (%)
Residents speaking Spanish at home - Native, born elsewhere (%)
Residents speaking Spanish at home - Foreign born (%)
Residents speaking other language at home (%)
Residents speaking other language at home - Born in the United States (%)
Residents speaking other language at home - Native, born elsewhere (%)
Residents speaking other language at home - Foreign born (%)
Class of Workers - Employee of private company (%)
Class of Workers - Self-employed in own incorporated business (%)
Class of Workers - Private not-for-profit wage and salary workers (%)
Class of Workers - Local government workers (%)
Class of Workers - State government workers (%)
Class of Workers - Federal government workers (%)
Class of Workers - Self-employed workers in own not incorporated business and Unpaid family workers (%)
House heating fuel used in houses and condos - Utility gas (%)
House heating fuel used in houses and condos - Bottled, tank, or LP gas (%)
House heating fuel used in houses and condos - Electricity (%)
House heating fuel used in houses and condos - Fuel oil, kerosene, etc. (%)
House heating fuel used in houses and condos - Coal or coke (%)
House heating fuel used in houses and condos - Wood (%)
House heating fuel used in houses and condos - Solar energy (%)
House heating fuel used in houses and condos - Other fuel (%)
House heating fuel used in houses and condos - No fuel used (%)
House heating fuel used in apartments - Utility gas (%)
House heating fuel used in apartments - Bottled, tank, or LP gas (%)
House heating fuel used in apartments - Electricity (%)
House heating fuel used in apartments - Fuel oil, kerosene, etc. (%)
House heating fuel used in apartments - Coal or coke (%)
House heating fuel used in apartments - Wood (%)
House heating fuel used in apartments - Solar energy (%)
House heating fuel used in apartments - Other fuel (%)
House heating fuel used in apartments - No fuel used (%)
Armed forces status - In Armed Forces (%)
Armed forces status - Civilian (%)
Armed forces status - Civilian - Veteran (%)
Armed forces status - Civilian - Nonveteran (%)
Fatal accidents locations in years 2005-2021
Fatal accidents locations in 2005
Fatal accidents locations in 2006
Fatal accidents locations in 2007
Fatal accidents locations in 2008
Fatal accidents locations in 2009
Fatal accidents locations in 2010
Fatal accidents locations in 2011
Fatal accidents locations in 2012
Fatal accidents locations in 2013
Fatal accidents locations in 2014
Fatal accidents locations in 2015
Fatal accidents locations in 2016
Fatal accidents locations in 2017
Fatal accidents locations in 2018
Fatal accidents locations in 2019
Fatal accidents locations in 2020
Fatal accidents locations in 2021
Alcohol use - People drinking some alcohol every month (%)
Alcohol use - People not drinking at all (%)
Alcohol use - Average days/month drinking alcohol
Alcohol use - Average drinks/week
Alcohol use - Average days/year people drink much
Audiometry - Average condition of hearing (%)
Audiometry - People that can hear a whisper from across a quiet room (%)
Audiometry - People that can hear normal voice from across a quiet room (%)
Audiometry - Ears ringing, roaring, buzzing (%)
Audiometry - Had a job exposure to loud noise (%)
Audiometry - Had off-work exposure to loud noise (%)
Blood Pressure & Cholesterol - Has high blood pressure (%)
Blood Pressure & Cholesterol - Checking blood pressure at home (%)
Blood Pressure & Cholesterol - Frequently checking blood cholesterol (%)
Blood Pressure & Cholesterol - Has high cholesterol level (%)
Consumer Behavior - Money monthly spent on food at supermarket/grocery store
Consumer Behavior - Money monthly spent on food at other stores
Consumer Behavior - Money monthly spent on eating out
Consumer Behavior - Money monthly spent on carryout/delivered foods
Consumer Behavior - Income spent on food at supermarket/grocery store (%)
Consumer Behavior - Income spent on food at other stores (%)
Consumer Behavior - Income spent on eating out (%)
Consumer Behavior - Income spent on carryout/delivered foods (%)
Current Health Status - General health condition (%)
Current Health Status - Blood donors (%)
Current Health Status - Has blood ever tested for HIV virus (%)
Current Health Status - Left-handed people (%)
Dermatology - People using sunscreen (%)
Diabetes - Diabetics (%)
Diabetes - Had a blood test for high blood sugar (%)
Diabetes - People taking insulin (%)
Diet Behavior & Nutrition - Diet health (%)
Diet Behavior & Nutrition - Milk product consumption (# of products/month)
Diet Behavior & Nutrition - Meals not home prepared (#/week)
Diet Behavior & Nutrition - Meals from fast food or pizza place (#/week)
Diet Behavior & Nutrition - Ready-to-eat foods (#/month)
Diet Behavior & Nutrition - Frozen meals/pizza (#/month)
Drug Use - People that ever used marijuana or hashish (%)
Drug Use - Ever used hard drugs (%)
Drug Use - Ever used any form of cocaine (%)
Drug Use - Ever used heroin (%)
Drug Use - Ever used methamphetamine (%)
Health Insurance - People covered by health insurance (%)
Kidney Conditions-Urology - Avg. # of times urinating at night
Medical Conditions - People with asthma (%)
Medical Conditions - People with anemia (%)
Medical Conditions - People with psoriasis (%)
Medical Conditions - People with overweight (%)
Medical Conditions - Elderly people having difficulties in thinking or remembering (%)
Medical Conditions - People who ever received blood transfusion (%)
Medical Conditions - People having trouble seeing even with glass/contacts (%)
Medical Conditions - People with arthritis (%)
Medical Conditions - People with gout (%)
Medical Conditions - People with congestive heart failure (%)
Medical Conditions - People with coronary heart disease (%)
Medical Conditions - People with angina pectoris (%)
Medical Conditions - People who ever had heart attack (%)
Medical Conditions - People who ever had stroke (%)
Medical Conditions - People with emphysema (%)
Medical Conditions - People with thyroid problem (%)
Medical Conditions - People with chronic bronchitis (%)
Medical Conditions - People with any liver condition (%)
Medical Conditions - People who ever had cancer or malignancy (%)
Mental Health - People who have little interest in doing things (%)
Mental Health - People feeling down, depressed, or hopeless (%)
Mental Health - People who have trouble sleeping or sleeping too much (%)
Mental Health - People feeling tired or having little energy (%)
Mental Health - People with poor appetite or overeating (%)
Mental Health - People feeling bad about themself (%)
Mental Health - People who have trouble concentrating on things (%)
Mental Health - People moving or speaking slowly or too fast (%)
Mental Health - People having thoughts they would be better off dead (%)
Oral Health - Average years since last visit a dentist
Oral Health - People embarrassed because of mouth (%)
Oral Health - People with gum disease (%)
Oral Health - General health of teeth and gums (%)
Oral Health - Average days a week using dental floss/device
Oral Health - Average days a week using mouthwash for dental problem
Oral Health - Average number of teeth
Pesticide Use - Households using pesticides to control insects (%)
Pesticide Use - Households using pesticides to kill weeds (%)
Physical Activity - People doing vigorous-intensity work activities (%)
Physical Activity - People doing moderate-intensity work activities (%)
Physical Activity - People walking or bicycling (%)
Physical Activity - People doing vigorous-intensity recreational activities (%)
Physical Activity - People doing moderate-intensity recreational activities (%)
Physical Activity - Average hours a day doing sedentary activities
Physical Activity - Average hours a day watching TV or videos
Physical Activity - Average hours a day using computer
Physical Functioning - People having limitations keeping them from working (%)
Physical Functioning - People limited in amount of work they can do (%)
Physical Functioning - People that need special equipment to walk (%)
Physical Functioning - People experiencing confusion/memory problems (%)
Physical Functioning - People requiring special healthcare equipment (%)
Prescription Medications - Average number of prescription medicines taking
Preventive Aspirin Use - Adults 40+ taking low-dose aspirin (%)
Reproductive Health - Vaginal deliveries (%)
Reproductive Health - Cesarean deliveries (%)
Reproductive Health - Deliveries resulted in a live birth (%)
Reproductive Health - Pregnancies resulted in a delivery (%)
Reproductive Health - Women breastfeeding newborns (%)
Reproductive Health - Women that had a hysterectomy (%)
Reproductive Health - Women that had both ovaries removed (%)
Reproductive Health - Women that have ever taken birth control pills (%)
Reproductive Health - Women taking birth control pills (%)
Reproductive Health - Women that have ever used Depo-Provera or injectables (%)
Reproductive Health - Women that have ever used female hormones (%)
Sexual Behavior - People 18+ that ever had sex (vaginal, anal, or oral) (%)
Sexual Behavior - Males 18+ that ever had vaginal sex with a woman (%)
Sexual Behavior - Males 18+ that ever performed oral sex on a woman (%)
Sexual Behavior - Males 18+ that ever had anal sex with a woman (%)
Sexual Behavior - Males 18+ that ever had any sex with a man (%)
Sexual Behavior - Females 18+ that ever had vaginal sex with a man (%)
Sexual Behavior - Females 18+ that ever performed oral sex on a man (%)
Sexual Behavior - Females 18+ that ever had anal sex with a man (%)
Sexual Behavior - Females 18+ that ever had any kind of sex with a woman (%)
Sexual Behavior - Average age people first had sex
Sexual Behavior - Average number of female sex partners in lifetime (males 18+)
Sexual Behavior - Average number of female vaginal sex partners in lifetime (males 18+)
Sexual Behavior - Average age people first performed oral sex on a woman (18+)
Sexual Behavior - Average number of woman performed oral sex on in lifetime (18+)
Sexual Behavior - Average number of male sex partners in lifetime (males 18+)
Sexual Behavior - Average number of male anal sex partners in lifetime (males 18+)
Sexual Behavior - Average age people first performed oral sex on a man (18+)
Sexual Behavior - Average number of male oral sex partners in lifetime (18+)
Sexual Behavior - People using protection when performing oral sex (%)
Sexual Behavior - Average number of times people have vaginal or anal sex a year
Sexual Behavior - People having sex without condom (%)
Sexual Behavior - Average number of male sex partners in lifetime (females 18+)
Sexual Behavior - Average number of male vaginal sex partners in lifetime (females 18+)
Sexual Behavior - Average number of female sex partners in lifetime (females 18+)
Sexual Behavior - Circumcised males 18+ (%)
Sleep Disorders - Average hours sleeping at night
Sleep Disorders - People that has trouble sleeping (%)
Smoking-Cigarette Use - People smoking cigarettes (%)
Taste & Smell - People 40+ having problems with smell (%)
Taste & Smell - People 40+ having problems with taste (%)
Taste & Smell - People 40+ that ever had wisdom teeth removed (%)
Taste & Smell - People 40+ that ever had tonsils teeth removed (%)
Taste & Smell - People 40+ that ever had a loss of consciousness because of a head injury (%)
Taste & Smell - People 40+ that ever had a broken nose or other serious injury to face or skull (%)
Taste & Smell - People 40+ that ever had two or more sinus infections (%)
Weight - Average height (inches)
Weight - Average weight (pounds)
Weight - Average BMI
Weight - People that are obese (%)
Weight - People that ever were obese (%)
Weight - People trying to lose weight (%)
Urban population: 17,226
Rural population: 2,641
Estimated median house/condo value in 2022: $496,117
99016:
$496,117Washington:
$569,500
According to our research of Washington and other state lists, there were 2 registered sex offenders living in 99016 zip code as of April 27, 2024 . The ratio of all residents to sex offenders in zip code 99016 is 6,915 to 1.The ratio of registered sex offenders to all residents in this zip code is much lower than the state average.
Median resident age: This zip code:
38.9 yearsWashington median age:
38.4 years
Average household size: This zip code:
2.6 peopleWashington:
2.5 people
Averages for the 2020 tax year for zip code 99016, filed in 2021:
Average Adjusted Gross Income (AGI) in 2020: $87,158 (Individual Income Tax Returns) Here:
$87,158State:
$99,264
Salary/wage: $73,213 (reported on 81.7% of returns )Here:
$73,213State:
$80,347
(% of AGI for various income ranges: 1136.8% for AGIs below $25k , 3370.9% for AGIs $25k-50k , 6225.7% for AGIs $50k-75k , 9032.6% for AGIs $75k-100k , 18629.0% for AGIs $100k-200k , 61229.1% for AGIs over 200k ) Taxable interest for individuals: $1,396 (reported on 41.0% of returns )This zip code:
$1,396Washington:
$2,077
(% of AGI for various income ranges: 18.1% for AGIs below $25k , 28.3% for AGIs $25k-50k , 57.0% for AGIs $50k-75k , 56.7% for AGIs $75k-100k , 105.3% for AGIs $100k-200k , 1025.5% for AGIs over 200k ) Ordinary dividends: $4,491 (reported on 20.0% of returns )(% of AGI for various income ranges: 31.1% for AGIs below $25k , 45.0% for AGIs $25k-50k , 90.9% for AGIs $50k-75k , 117.5% for AGIs $75k-100k , 241.6% for AGIs $100k-200k , 1111.8% for AGIs over 200k ) Net capital gain/loss in AGI: +$18,509 (reported on 19.9% of returns )Here:
+$18,509State:
+$40,092
(% of AGI for various income ranges: 9.9% for AGIs below $25k , 50.6% for AGIs $25k-50k , 107.7% for AGIs $50k-75k , 135.4% for AGIs $75k-100k , 498.4% for AGIs $100k-200k , 10917.3% for AGIs over 200k ) Profit/loss from business: +$16,012 (reported on 13.7% of returns )Here:
+$16,012State:
+$18,312
(% of AGI for various income ranges: 70.7% for AGIs below $25k , 163.7% for AGIs $25k-50k , 283.2% for AGIs $50k-75k , 297.4% for AGIs $75k-100k , 515.8% for AGIs $100k-200k , 2471.8% for AGIs over 200k ) Taxable individual retirement arrangement distribution: $20,796 (reported on 10.5% of returns )99016:
$20,796Washington:
$24,221
(% of AGI for various income ranges: 83.3% for AGIs below $25k , 137.3% for AGIs $25k-50k , 269.4% for AGIs $50k-75k , 313.7% for AGIs $75k-100k , 665.1% for AGIs $100k-200k , 1801.8% for AGIs over 200k ) Self-employed (Keogh) retirement plans: $20,600 (reported on 0.3% of returns )99016:
$20,600Washington:
$24,166
(% of AGI for various income ranges: 58.3% for AGIs $100k-200k ) Total itemized deductions: $35,048 (reported on 9.9% of returns )Here:
$35,048State:
$39,068
(% of AGI for various income ranges: 58.2% for AGIs below $25k , 78.3% for AGIs $25k-50k , 246.9% for AGIs $50k-75k , 386.6% for AGIs $75k-100k , 923.4% for AGIs $100k-200k , 6120.9% for AGIs over 200k ) Charity contributions: $14,491 (reported on 8.0% of returns )Here:
$14,491State:
$15,331
(% of AGI for various income ranges: 19.9% for AGIs $25k-50k , 33.1% for AGIs $50k-75k , 77.0% for AGIs $75k-100k , 261.5% for AGIs $100k-200k , 2815.9% for AGIs over 200k ) Taxes paid: $7,223 (reported on 9.8% of returns )(% of AGI for various income ranges: 5.9% for AGIs below $25k , 14.8% for AGIs $25k-50k , 63.8% for AGIs $50k-75k , 93.0% for AGIs $75k-100k , 213.9% for AGIs $100k-200k , 1065.5% for AGIs over 200k ) Earned income credit: $1,923 (reported on 9.0% of returns )(% of AGI for various income ranges: 49.5% for AGIs below $25k , 52.2% for AGIs $25k-50k , 2.3% for AGIs $50k-75k ) Percentage of individuals using paid preparers for their 2020 taxes: 94.5%(% for various income ranges: 93.4% for AGIs below $25k , 94.0% for AGIs $25k-50k , 93.8% for AGIs $50k-75k , 95.3% for AGIs $75k-100k , 95.7% for AGIs $100k-200k , 96.7% for AGIs over 200k )
Averages for the 2012 tax year for zip code 99016, filed in 2013:
Average Adjusted Gross Income (AGI) in 2012: $63,128 (Individual Income Tax Returns) Here:
$63,128State:
$69,533
Salary/wage: $54,778 (reported on 84.4% of returns )Here:
$54,778State:
$57,267
(% of AGI for various income ranges: 70.7% for AGIs below $25k , 75.9% for AGIs $25k-50k , 79.6% for AGIs $50k-75k , 80.2% for AGIs $75k-100k , 81.6% for AGIs $100k-200k , 47.7% for AGIs over 200k ) Taxable interest for individuals: $1,300 (reported on 39.5% of returns )This zip code:
$1,300Washington:
$1,816
(% of AGI for various income ranges: 1.8% for AGIs below $25k , 0.8% for AGIs $25k-50k , 0.9% for AGIs $50k-75k , 0.5% for AGIs $75k-100k , 0.6% for AGIs $100k-200k , 1.0% for AGIs over 200k ) Ordinary dividends: $4,581 (reported on 19.6% of returns )(% of AGI for various income ranges: 1.7% for AGIs below $25k , 1.3% for AGIs $25k-50k , 1.1% for AGIs $50k-75k , 0.9% for AGIs $75k-100k , 1.1% for AGIs $100k-200k , 2.8% for AGIs over 200k ) Net capital gain/loss in AGI: +$13,524 (reported on 16.5% of returns )Here:
+$13,524State:
+$21,568
(% of AGI for various income ranges: 0.4% for AGIs $25k-50k , 0.2% for AGIs $50k-75k , 0.3% for AGIs $75k-100k , 1.7% for AGIs $100k-200k , 15.7% for AGIs over 200k ) Profit/loss from business: +$11,195 (reported on 13.6% of returns )Here:
+$11,195State:
+$16,521
(% of AGI for various income ranges: 6.1% for AGIs below $25k , 3.2% for AGIs $25k-50k , 2.5% for AGIs $50k-75k , 1.6% for AGIs $75k-100k , 1.9% for AGIs $100k-200k , 2.0% for AGIs over 200k ) Taxable individual retirement arrangement distribution: $13,698 (reported on 10.7% of returns )99016:
$13,698Washington:
$18,648
(% of AGI for various income ranges: 3.9% for AGIs below $25k , 2.6% for AGIs $25k-50k , 2.0% for AGIs $50k-75k , 2.3% for AGIs $75k-100k , 2.6% for AGIs $100k-200k , 1.6% for AGIs over 200k ) Total itemized deductions: $21,371 (21% of AGI, reported on 39.3% of returns )Here:
$21,371State:
$23,872
Here:
20.6% of AGIState:
18.2% of AGI
(% of AGI for various income ranges: 11.9% for AGIs below $25k , 12.1% for AGIs $25k-50k , 13.7% for AGIs $50k-75k , 14.2% for AGIs $75k-100k , 14.3% for AGIs $100k-200k , 12.0% for AGIs over 200k ) Charity contributions: $4,028 (reported on 31.1% of returns )(% of AGI for various income ranges: 0.8% for AGIs below $25k , 1.1% for AGIs $25k-50k , 1.5% for AGIs $50k-75k , 1.6% for AGIs $75k-100k , 2.4% for AGIs $100k-200k , 3.1% for AGIs over 200k ) Taxes paid: $5,528 (reported on 39.1% of returns )(% of AGI for various income ranges: 2.3% for AGIs below $25k , 3.0% for AGIs $25k-50k , 3.5% for AGIs $50k-75k , 3.9% for AGIs $75k-100k , 4.1% for AGIs $100k-200k , 2.5% for AGIs over 200k ) Earned income credit: $2,114 (reported on 13.6% of returns )(% of AGI for various income ranges: 5.1% for AGIs below $25k , 1.1% for AGIs $25k-50k ) Percentage of individuals using paid preparers for their 2012 taxes: 42.2%(% for various income ranges: 38.1% for AGIs below $25k , 39.6% for AGIs $25k-50k , 44.6% for AGIs $50k-75k , 40.0% for AGIs $75k-100k , 48.8% for AGIs $100k-200k , 75.0% for AGIs over 200k )
Averages for the 2004 tax year for zip code 99016, filed in 2005:
Average Adjusted Gross Income (AGI) in 2004: $48,623 (Individual Income Tax Returns) Here:
$48,623State:
$54,331
Salary/wage: $40,838 (reported on 84.6% of returns )Here:
$40,838State:
$45,761
(% of AGI for various income ranges: 119.6% for AGIs below $10k , 74.4% for AGIs $10k-25k , 80.9% for AGIs $25k-50k , 83.0% for AGIs $50k-75k , 81.7% for AGIs $75k-100k , 51.7% for AGIs over 100k ) Taxable interest for individuals: $1,791 (reported on 46.9% of returns )This zip code:
$1,791Washington:
$2,110
(% of AGI for various income ranges: 9.2% for AGIs below $10k , 2.5% for AGIs $10k-25k , 1.6% for AGIs $25k-50k , 1.1% for AGIs $50k-75k , 1.5% for AGIs $75k-100k , 1.8% for AGIs over 100k ) Taxable dividends: $2,502 (reported on 21.0% of returns )(% of AGI for various income ranges: 4.6% for AGIs below $10k , 1.3% for AGIs $10k-25k , 0.9% for AGIs $25k-50k , 0.6% for AGIs $50k-75k , 0.6% for AGIs $75k-100k , 1.5% for AGIs over 100k ) Net capital gain/loss: +$12,599 (reported on 18.5% of returns )Here:
+$12,599State:
+$15,835
(% of AGI for various income ranges: -4.4% for AGIs below $10k , -0.4% for AGIs $10k-25k , 0.4% for AGIs $25k-50k , 0.7% for AGIs $50k-75k , 1.8% for AGIs $75k-100k , 12.3% for AGIs over 100k ) Profit/loss from business: +$10,255 (reported on 13.6% of returns )Here:
+$10,255State:
+$13,994
(% of AGI for various income ranges: -1.3% for AGIs below $10k , 4.5% for AGIs $10k-25k , 2.9% for AGIs $25k-50k , 3.4% for AGIs $50k-75k , 3.2% for AGIs $75k-100k , 2.2% for AGIs over 100k ) IRA payment deduction: $2,895 (reported on 3.1% of returns )99016:
$2,895Washington:
$3,001
(% of AGI for various income ranges: 0.2% for AGIs $10k-25k , 0.3% for AGIs $25k-50k , 0.2% for AGIs $50k-75k , 0.2% for AGIs $75k-100k , 0.1% for AGIs over 100k ) Self-employed pension: $13,400 (reported on 0.6% of returns )Here:
$13,400Washington:
$14,244
Total itemized deductions: $16,258 (21% of AGI, reported on 37.8% of returns )Here:
$16,258State:
$19,669
Here:
20.7% of AGIState:
20.7% of AGI
(% of AGI for various income ranges: 26.0% for AGIs below $10k , 12.7% for AGIs $10k-25k , 13.7% for AGIs $25k-50k , 14.8% for AGIs $50k-75k , 13.5% for AGIs $75k-100k , 9.9% for AGIs over 100k ) Charity contributions deductions: $2,818 (3% of AGI, reported on 32.0% of returns )Here:
3.4% of AGIState:
3.5% of AGI
(% of AGI for various income ranges: 2.1% for AGIs below $10k , 1.4% for AGIs $10k-25k , 1.4% for AGIs $25k-50k , 1.9% for AGIs $50k-75k , 1.9% for AGIs $75k-100k , 2.1% for AGIs over 100k ) Total tax: $7,349 (reported on 76.8% of returns )(% of AGI for various income ranges: 4.1% for AGIs below $10k , 4.1% for AGIs $10k-25k , 6.3% for AGIs $25k-50k , 8.3% for AGIs $50k-75k , 10.6% for AGIs $75k-100k , 18.9% for AGIs over 100k ) Earned income credit: $1,587 (reported on 13.3% of returns )Percentage of individuals using paid preparers for their 2004 taxes: 47.5%(% for various income ranges: 38.7% for AGIs below $10k , 49.4% for AGIs $10k-25k , 49.0% for AGIs $25k-50k , 45.9% for AGIs $50k-75k , 47.9% for AGIs $75k-100k , 59.6% for AGIs over 100k )
Estimated median household income in 2022: This zip code:
$95,914Washington:
$91,306
Nearest zip codes: 99023 ,
99019 ,
99037 ,
99027 ,
99030 ,
99216 .
Spokane Valley Zip Code Map
Percentage of family households: This zip code:
53.7%Washington:
45.0%
Percentage of households with unmarried partners: This zip code:
2.6%Washington:
48.7%
No gay or lesbian households reported
Household received Food Stamps/SNAP in the past 12 months: 698Household did not receive Food Stamps/SNAP in the past 12 months: 7,036
Women who had a birth in the past 12 months: 288 (247 now married , 42 unmarried) Women who did not have a birth in the past 12 months: 4,422 (2,561 now married , 1,843 unmarried)
Housing units in zip code 99016 with a mortgage: 4,098 (146
second mortgage , 150
both second mortgage and home equity loan )
Houses without a mortgage: 138
Median monthly owner costs for units with a mortgage: $2,032
Median monthly owner costs for units without a mortgage: $584
Residents with income below the poverty level in 2022:
This zip code:
9.0%Whole state:
10.0%
Residents with income below 50% of the poverty level in 2022:
This zip code:
3.3%Whole state:
4.6%
Median number of rooms in houses and condos: Median number of rooms in apartments:
Year house built (houses)
277 2020 or later2,231 2010 to 20192,182 2000 to 2009939 1990 to 1999456 1980 to 1989882 1970 to 1979207 1960 to 1969254 1950 to 1959306 1940 to 1949418 1939 or earlier
Zip code 99016 household income distribution in 2022 537 Less than $10,00098 $10,000 to $14,999158 $20,000 to $24,99983 $25,000 to $29,999499 $30,000 to $34,999234 $35,000 to $39,999256 $40,000 to $44,99973 $45,000 to $49,999250 $50,000 to $59,999700 $60,000 to $74,9991,299 $75,000 to $99,999903 $100,000 to $124,999875 $125,000 to $149,999725 $150,000 to $199,9991,101 $200,000 or moreEstimate of home value of owner-occupied houses/condos in 2022 in zip code 99016 77 $40,000 to $49,99943 $70,000 to $79,99947 $80,000 to $89,99918 $90,000 to $99,99952 $100,000 to $124,99963 $125,000 to $149,99927 $150,000 to $174,99953 $175,000 to $199,999169 $200,000 to $249,999330 $250,000 to $299,9991,069 $300,000 to $399,9991,021 $400,000 to $499,9991,483 $500,000 to $749,999717 $750,000 to $999,99955 $1,000,000 to $1,499,99944 $1,500,000 to $1,999,99964 $2,000,000 or moreRent paid by renters in 2022 in zip code 99016 12 $150 to $19914 $450 to $499198 $500 to $54916 $600 to $64960 $700 to $74941 $750 to $79912 $800 to $89995 $900 to $999372 $1,000 to $1,249115 $1,250 to $1,499536 $1,500 to $1,999254 $2,000 to $2,49919 $2,500 to $2,99973 $3,000 to $3,499138 No cash rent
Median gross rent in 2022: $1,546.
Median price asked for vacant for-sale houses and condos in 2022: $369,475.
Estimated median house (or condo) value in 2022 for: White Non-Hispanic householders: $558,315Black or African American householders: $550,969American Indian or Alaska Native householders: $743,440Two or more races householders: $673,406Hispanic or Latino householders: $673,406Estimated median house or condo value in 2022: $496,117
99016:
$496,117Washington:
$569,500
Lower value quartile - upper value quartile: $371,708 - $689,867
Mean price in 2022: Detached houses: $591,327Here:
$591,327State:
$734,307
Townhouses or other attached units: $404,437Here:
$404,437State:
$657,697
Mobile homes: $224,158Here:
$224,158State:
$218,362
Housing units in structures:
One, detached: 6,313One, attached: 420Two: 515 to 9: 7810 to 19: 31620 to 49: 4150 or more: 250Mobile homes: 486Unemployment : 4.0%
Means of transportation to work in zip code 99016 69.9% 6,466 Drove a car alone7.6% 700 Carpooled1.0% 88 Bus or trolley bus0.2% 17 Bicycle0.7% 66 Walked1.2% 110 Other means20.0% 1,850 Worked at homeTravel time to work (commute) in zip code 99016 99 Less than 5 minutes498 5 to 9 minutes972 10 to 14 minutes910 15 to 19 minutes1,790 20 to 24 minutes899 25 to 29 minutes1,373 30 to 34 minutes198 35 to 39 minutes171 40 to 44 minutes254 45 to 59 minutes174 60 to 89 minutes41 90 or more minutes
Percentage of zip code residents living and working in this county: 94.5%
Household type by relationship:
Households: 19,868
Male householders: 3,770 (769 living alone ), Female householders: 3,975 (695 living alone )4,247 spouses (4,114 opposite-sex spouses ), 734 unmarried partners , (695 opposite-sex unmarried partners ), 5,788 children (5,569 natural , 27 adopted , 195 stepchildren ), 65 grandchildren , 159 brothers or sisters , 285 parents , 0 foster children , 297 other relatives , 476 non-relatives In group quarters: 95 (-1 institutionalized population )
Size of family households: 2,348 2-persons , 1,279 3-persons , 1,008 4-persons , 585 5-persons , 207 6-persons , 60 7-or-more-persons
Size of nonfamily households: 1,464 1-person , 677 2-persons , 48 3-persons , 24 4-persons
4,098 married couples with children. single-parent households (334 men , 440 women ).
90.2% of residents of 99016 zip code speak English at home. of residents speak Spanish at home (74% very well, 23% well, 3% not well ).of residents speak other Indo-European language at home (69% very well, 13% well, 18% not well ).of residents speak Asian or Pacific Island language at home (52% very well, 30% well, 18% not well ).of residents speak other language at home (100% very well ).
Foreign born population: 1,457 (7.3%)
(68.7%
of them are naturalized citizens )
This zip code:
7.3%Whole state:
15.3%
36% Thailand 18% Albania 7% Haiti 6% Honduras 4% Cambodia 4% Malaysia 4% Lithuania 18% American 12% German 11% Irish 7% English 7% Italian 4% European 2% Norwegian
Year of entry for the foreign-born population
443 2010 or later 539 2000 to 2009 386 1990 to 1999 295 Before 1990
Facilities with environmental interests located in this zip code:
BROADWAY TRUCK SERVICE GREENACRES (E 18709 APPLEWAY in GREENACRES, WA)
Conditionally Exempt Small Quantity Generators, less than 100 kg/month of hazardous waste (Resource Conservation and Recovery Act (tracking hazardous waste)) STATE MASTER (Washington State Department of Ecology's Facility/Site identification system) - HAZWASTE-WAD988488607, EPCRA, CESQG Business SIC classification: GASOLINE SERVICE STATIONSOrganizations: EXXON COMPANY USA (CONTACT/ HAZARDOUS WASTE)
, CAROLYN JONES (CONTACT/OPERATOR)
, CB HOLDINGS (CONTACT/OWNER)
Alternative names: EXXON CO USA 72749
CALVIN GRANT RESIDENCE (EAST 18118 BOONE AVENUE in SPOKANE VALLEY, WA)
(Resource Conservation and Recovery Act (tracking hazardous waste)) STATE MASTER (Washington State Department of Ecology's Facility/Site identification system) - HAZWASTE-WAH000014183, HAZARDOUS WASTE PROGRAM
Housing units lacking complete plumbing facilities: 0.6%
Housing units lacking complete kitchen facilities: 0.6%
62.8% Utility gas 33.1% Electricity 2.5% Wood 0.8% Fuel oil, kerosene, etc. 0.6% Bottled, tank, or LP gas
Population in 1990: 5,312. Population change in the 1990s: +1,697 (+31.9%).
Place of birth for U.S.-born residents:
This state: 9,735Northeast: 684Midwest: 1,948South: 819West: 4,934
58% of the 99016 zip code residents lived in the same house 5 years ago.
Out of people who lived in different houses, 75% lived in this county.
Out of people who lived in different counties, 50% lived in Washington.
86% of the 99016 zip code residents lived in the same house 1 year ago.
Out of people who lived in different houses, 55% moved from this county.
Out of people who lived in different houses, 8% moved from different county within same state.
Out of people who lived in different houses, 35% moved from different state.
Out of people who lived in different houses, 3% moved from abroad.
Private vs. public school enrollment:
Students in private schools in grades 1 to 8 (elementary and middle school): 174
Here:
8.8%Washington:
12.4%
Students in private schools in grades 9 to 12 (high school): 67
Here:
10.6%Washington:
9.2%
Students in private undergraduate colleges: 49
Here:
18.2%Washington:
16.5%
Occupation by median earnings in the past 12 months ($)
108,849 Computer and mathematical occupations 100,363 Fire fighting and prevention, and other protective service workers including supervisors 95,500 Architecture and engineering occupations 95,112 Health diagnosing and treating practitioners and other technical occupations 89,105 Legal occupations 85,933 Management occupations
Companies with federal contracts located in this zip code:
ARTISTIC LANDSCAPE CORPORATION (18323 E BOW AVE in GREENACRES, WA; small business) in 21 contracts from 2000 to 2006
Contracts for Landscaping/Groundskeeping Services, Snow Removal/Salt Service (also spreading aggregate or other snow melting material) by Air ForceSigned by year: 2000: $177,914; 2001: $114,314; 2002: $155,145; 2003: $44,589; 2004: $175,588; 2005: -$65,120; 2006: -$123,006.
Biggest contracts: with Air Force for Landscaping/Groundskeeping Services. Signed on 2004-10-01. Completion date: 2005-09-30.
with Air Force for Snow Removal/Salt Service (also spreading aggregate or other snow melting material). Signed on 2003-10-01. Completion date: 2004-09-30.
, same as above. Signed on 2002-10-01. Completion date: 2003-09-30.
, same as above. Signed on 2001-10-01. Completion date: 2002-09-30.
VALCON DISTRIBUTING, LTD. INC. (18826 E APPLEWAY in GREENACRES, WA; small business)
$25,599 with Air Force for Gases: Compressed and Liquefied. Signed on 1999-10-26. Completion date: 2000-09-30.
NORTHWEST CHALLENGES, INC (18213 E APPLEWAY in GREENACRES, WA; small business)
$5,803 with Air Force for Office Supplies. Signed on 2005-09-30. Completion date: 2005-10-30.
Top industries in this zip code by the number of employees in 2005:
Health Care and Social Assistance: Nursing Care Facilities (100-249 employees: 1 establishment)Accommodation and Food Services: Limited-Service Restaurants (20-49: 1, 5-9: 1, 1-4: 1)Arts, Entertainment, and Recreation: Fitness and Recreational Sports Centers (20-49: 1, 5-9: 1, 1-4: 1)Administrative and Support and Waste Management and Remediation Services: Landscaping Services (5-9: 4, 1-4: 7)Administrative and Support and Waste Management and Remediation Services: Janitorial Services (20-49: 1, 1-4: 2)Construction: Painting and Wall Covering Contractors (20-49: 1, 1-4: 1)Construction: Electrical Contractors (10-19: 1, 5-9: 2, 1-4: 3)
People in group quarters in 2010:
96 people in nursing facilities/skilled-nursing facilities
People in group quarters in 2000:
7 people in other noninstitutional group quarters
Fatal accident statistics in 2014:
Fatal accident count: 1Vehicles involved in fatal accidents: 2Fatal accidents caused by drunken drivers: 0Fatalities: 1Persons involved in fatal accidents: 2Pedestrians involved in fatal accidents: 0
Fatal accident statistics in 2011:
Fatal accident count: 1Vehicles involved in fatal accidents: 3Fatal accidents caused by drunken drivers: 2Fatalities: 1Persons involved in fatal accidents: 3Pedestrians involved in fatal accidents: 0
Home Mortgage Disclosure Act Aggregated Statistics For Year 2009(Based on 4 partial tracts) A) FHA, FSA/RHS & VA B) Conventional C) Refinancings D) Home Improvement Loans F) Non-occupant Loans on G) Loans On Manufactured Number Average Value Number Average Value Number Average Value Number Average Value Number Average Value Number Average Value
LOANS ORIGINATED 198 $183,801 162 $180,882 794 $177,194 48 $82,530 28 $152,281 60 $88,936 APPLICATIONS APPROVED, NOT ACCEPTED 10 $230,394 18 $258,723 73 $186,598 6 $163,818 4 $217,610 2 $29,135 APPLICATIONS DENIED 24 $177,359 8 $120,861 188 $177,671 26 $64,449 16 $152,850 19 $93,933 APPLICATIONS WITHDRAWN 10 $161,219 26 $200,935 183 $178,931 11 $71,326 10 $159,940 22 $91,690 FILES CLOSED FOR INCOMPLETENESS 2 $211,235 0 $0 37 $200,046 0 $0 0 $0 4 $65,928
Aggregated Statistics For Year 2008(Based on 4 partial tracts) A) FHA, FSA/RHS & VA B) Conventional C) Refinancings D) Home Improvement Loans E) Loans on Dwellings For 5+ Families F) Non-occupant Loans on G) Loans On Manufactured Number Average Value Number Average Value Number Average Value Number Average Value Number Average Value Number Average Value Number Average Value
LOANS ORIGINATED 182 $175,391 304 $203,505 525 $165,495 63 $83,112 2 $1,611,585 56 $205,511 56 $89,675 APPLICATIONS APPROVED, NOT ACCEPTED 6 $166,040 20 $199,399 56 $154,243 5 $123,382 0 $0 5 $158,062 10 $89,901 APPLICATIONS DENIED 37 $125,716 28 $188,369 277 $171,180 34 $171,769 0 $0 17 $173,600 40 $86,544 APPLICATIONS WITHDRAWN 9 $144,668 26 $174,880 143 $185,194 12 $106,420 0 $0 15 $190,145 14 $82,050 FILES CLOSED FOR INCOMPLETENESS 2 $208,505 1 $424,700 38 $161,234 2 $22,760 0 $0 8 $163,128 0 $0
Aggregated Statistics For Year 2007(Based on 4 partial tracts) A) FHA, FSA/RHS & VA B) Conventional C) Refinancings D) Home Improvement Loans E) Loans on Dwellings For 5+ Families F) Non-occupant Loans on G) Loans On Manufactured Number Average Value Number Average Value Number Average Value Number Average Value Number Average Value Number Average Value Number Average Value
LOANS ORIGINATED 34 $169,678 506 $165,124 487 $151,410 93 $65,436 2 $2,276,250 81 $153,463 71 $86,784 APPLICATIONS APPROVED, NOT ACCEPTED 4 $180,735 41 $150,422 81 $146,756 11 $52,975 0 $0 15 $127,470 23 $65,674 APPLICATIONS DENIED 13 $146,380 84 $171,916 287 $176,998 51 $79,012 0 $0 21 $154,322 54 $83,286 APPLICATIONS WITHDRAWN 5 $110,716 38 $170,450 118 $158,011 20 $86,923 0 $0 13 $174,676 8 $83,421 FILES CLOSED FOR INCOMPLETENESS 2 $133,845 5 $93,236 22 $186,228 6 $103,967 0 $0 2 $124,740 2 $75,570
Aggregated Statistics For Year 2006(Based on 4 partial tracts) A) FHA, FSA/RHS & VA B) Conventional C) Refinancings D) Home Improvement Loans F) Non-occupant Loans on G) Loans On Manufactured Number Average Value Number Average Value Number Average Value Number Average Value Number Average Value Number Average Value
LOANS ORIGINATED 33 $167,601 746 $137,153 466 $128,255 95 $50,740 129 $128,713 79 $88,820 APPLICATIONS APPROVED, NOT ACCEPTED 0 $0 80 $136,759 72 $138,472 8 $155,974 31 $145,260 6 $112,737 APPLICATIONS DENIED 7 $129,031 109 $129,257 199 $132,277 73 $62,525 34 $118,224 35 $60,149 APPLICATIONS WITHDRAWN 10 $123,884 64 $141,867 189 $146,272 10 $143,937 17 $143,765 12 $89,362 FILES CLOSED FOR INCOMPLETENESS 0 $0 18 $89,735 29 $142,050 1 $25,280 7 $50,207 0 $0
Aggregated Statistics For Year 2005(Based on 4 partial tracts) A) FHA, FSA/RHS & VA B) Conventional C) Refinancings D) Home Improvement Loans E) Loans on Dwellings For 5+ Families F) Non-occupant Loans on G) Loans On Manufactured Number Average Value Number Average Value Number Average Value Number Average Value Number Average Value Number Average Value Number Average Value
LOANS ORIGINATED 65 $143,666 666 $126,115 498 $122,679 64 $65,349 2 $290,450 136 $119,496 66 $76,139 APPLICATIONS APPROVED, NOT ACCEPTED 6 $163,238 67 $120,082 71 $173,163 10 $80,367 0 $0 22 $120,165 7 $83,766 APPLICATIONS DENIED 13 $136,295 115 $116,043 242 $120,995 42 $67,849 0 $0 33 $117,326 43 $77,314 APPLICATIONS WITHDRAWN 5 $116,908 68 $137,352 187 $125,646 19 $91,215 0 $0 28 $130,048 21 $77,834 FILES CLOSED FOR INCOMPLETENESS 2 $83,765 15 $125,986 62 $126,543 4 $27,315 0 $0 4 $175,728 5 $95,420
Aggregated Statistics For Year 2004(Based on 4 partial tracts) A) FHA, FSA/RHS & VA B) Conventional C) Refinancings D) Home Improvement Loans F) Non-occupant Loans on G) Loans On Manufactured Number Average Value Number Average Value Number Average Value Number Average Value Number Average Value Number Average Value
LOANS ORIGINATED 68 $125,927 404 $115,483 444 $105,819 41 $41,522 56 $100,201 47 $66,677 APPLICATIONS APPROVED, NOT ACCEPTED 0 $0 23 $131,472 66 $109,279 4 $31,360 4 $41,428 12 $79,109 APPLICATIONS DENIED 8 $108,898 33 $96,099 199 $117,823 31 $41,058 5 $97,970 37 $72,623 APPLICATIONS WITHDRAWN 8 $93,248 29 $116,938 124 $125,670 16 $64,168 9 $114,521 17 $74,490 FILES CLOSED FOR INCOMPLETENESS 0 $0 4 $85,588 47 $140,871 5 $45,380 2 $122,915 2 $95,645
Aggregated Statistics For Year 2003(Based on 4 partial tracts) A) FHA, FSA/RHS & VA B) Conventional C) Refinancings D) Home Improvement Loans F) Non-occupant Loans on Number Average Value Number Average Value Number Average Value Number Average Value Number Average Value
LOANS ORIGINATED 131 $121,276 320 $107,647 1,127 $105,970 43 $26,584 85 $87,475 APPLICATIONS APPROVED, NOT ACCEPTED 9 $122,817 28 $122,673 80 $106,539 7 $14,309 9 $97,929 APPLICATIONS DENIED 5 $151,144 28 $107,661 236 $104,603 21 $24,531 8 $108,474 APPLICATIONS WITHDRAWN 11 $106,943 19 $107,288 198 $110,267 3 $22,760 9 $108,046 FILES CLOSED FOR INCOMPLETENESS 0 $0 1 $75,840 36 $139,473 0 $0 4 $74,660
Aggregated Statistics For Year 2002(Based on 4 partial tracts) A) FHA, FSA/RHS & VA B) Conventional C) Refinancings D) Home Improvement Loans E) Loans on Dwellings For 5+ Families F) Non-occupant Loans on Number Average Value Number Average Value Number Average Value Number Average Value Number Average Value Number Average Value
LOANS ORIGINATED 90 $114,295 304 $93,764 619 $108,327 42 $20,615 2 $182,100 56 $73,240 APPLICATIONS APPROVED, NOT ACCEPTED 9 $96,513 24 $89,627 72 $105,430 3 $25,960 0 $0 6 $86,523 APPLICATIONS DENIED 4 $121,442 39 $72,548 179 $91,401 19 $29,566 0 $0 12 $79,381 APPLICATIONS WITHDRAWN 13 $113,018 29 $106,086 107 $123,263 1 $6,070 0 $0 7 $126,430 FILES CLOSED FOR INCOMPLETENESS 0 $0 2 $50,825 29 $103,990 0 $0 0 $0 2 $128,380
Aggregated Statistics For Year 2001(Based on 4 partial tracts) A) FHA, FSA/RHS & VA B) Conventional C) Refinancings D) Home Improvement Loans F) Non-occupant Loans on Number Average Value Number Average Value Number Average Value Number Average Value Number Average Value
LOANS ORIGINATED 94 $109,190 229 $97,755 544 $102,410 30 $23,540 28 $89,473 APPLICATIONS APPROVED, NOT ACCEPTED 1 $98,090 29 $68,603 78 $87,560 3 $32,707 3 $132,860 APPLICATIONS DENIED 0 $0 58 $62,081 179 $85,071 40 $15,640 8 $104,721 APPLICATIONS WITHDRAWN 4 $120,882 13 $94,832 99 $88,534 6 $10,638 0 $0 FILES CLOSED FOR INCOMPLETENESS 0 $0 4 $86,385 18 $82,583 1 $30,340 0 $0
Aggregated Statistics For Year 2000(Based on 4 partial tracts) A) FHA, FSA/RHS & VA B) Conventional C) Refinancings D) Home Improvement Loans F) Non-occupant Loans on Number Average Value Number Average Value Number Average Value Number Average Value Number Average Value
LOANS ORIGINATED 106 $109,256 242 $95,603 130 $77,858 51 $19,977 11 $76,438 APPLICATIONS APPROVED, NOT ACCEPTED 7 $69,459 34 $76,407 30 $77,132 14 $14,631 7 $67,637 APPLICATIONS DENIED 7 $79,343 84 $75,595 125 $70,187 39 $17,491 9 $85,789 APPLICATIONS WITHDRAWN 8 $98,558 32 $98,098 37 $68,076 10 $45,147 0 $0 FILES CLOSED FOR INCOMPLETENESS 0 $0 9 $150,716 22 $89,922 0 $0 4 $82,400
Aggregated Statistics For Year 1999(Based on 2 partial tracts) A) FHA, FSA/RHS & VA B) Conventional C) Refinancings D) Home Improvement Loans F) Non-occupant Loans on Number Average Value Number Average Value Number Average Value Number Average Value Number Average Value
LOANS ORIGINATED 55 $101,330 111 $93,700 136 $88,864 28 $18,874 10 $103,888 APPLICATIONS APPROVED, NOT ACCEPTED 5 $96,862 19 $80,704 44 $87,889 6 $21,278 3 $107,230 APPLICATIONS DENIED 2 $68,935 41 $74,520 67 $100,533 26 $19,292 5 $122,788 APPLICATIONS WITHDRAWN 1 $99,020 17 $131,698 43 $87,631 7 $37,720 4 $76,482 FILES CLOSED FOR INCOMPLETENESS 1 $97,220 5 $44,512 19 $95,912 0 $0 1 $134,130
Detailed HMDA statistics for the following Tracts:
0131.00
,
0133.00
Private Mortgage Insurance Companies Aggregated Statistics For Year 2009(Based on 4 partial tracts) A) Conventional B) Refinancings Number Average Value Number Average Value
LOANS ORIGINATED 34 $233,979 27 $235,690 APPLICATIONS APPROVED, NOT ACCEPTED 9 $203,142 16 $220,113 APPLICATIONS DENIED 2 $204,860 4 $171,175 APPLICATIONS WITHDRAWN 7 $178,719 6 $188,123 FILES CLOSED FOR INCOMPLETENESS 0 $0 0 $0
Aggregated Statistics For Year 2008(Based on 4 partial tracts) A) Conventional B) Refinancings C) Non-occupant Loans on D) Loans On Manufactured Number Average Value Number Average Value Number Average Value Number Average Value
LOANS ORIGINATED 123 $199,720 59 $235,835 5 $164,618 2 $111,990 APPLICATIONS APPROVED, NOT ACCEPTED 27 $223,418 22 $254,109 0 $0 1 $68,260 APPLICATIONS DENIED 7 $215,919 7 $206,350 2 $227,995 0 $0 APPLICATIONS WITHDRAWN 5 $226,168 2 $267,650 0 $0 0 $0 FILES CLOSED FOR INCOMPLETENESS 0 $0 2 $191,205 2 $191,205 0 $0
Aggregated Statistics For Year 2007(Based on 4 partial tracts) A) Conventional B) Refinancings C) Non-occupant Loans on D) Loans On Manufactured Number Average Value Number Average Value Number Average Value Number Average Value
LOANS ORIGINATED 169 $197,411 40 $206,957 6 $177,165 4 $122,462 APPLICATIONS APPROVED, NOT ACCEPTED 14 $157,032 1 $80,390 0 $0 0 $0 APPLICATIONS DENIED 0 $0 0 $0 0 $0 0 $0 APPLICATIONS WITHDRAWN 5 $210,508 2 $325,510 0 $0 0 $0 FILES CLOSED FOR INCOMPLETENESS 2 $198,490 0 $0 0 $0 0 $0
Aggregated Statistics For Year 2006(Based on 4 partial tracts) A) Conventional B) Refinancings C) Non-occupant Loans on D) Loans On Manufactured Number Average Value Number Average Value Number Average Value Number Average Value
LOANS ORIGINATED 84 $191,865 13 $151,333 8 $150,248 1 $235,100 APPLICATIONS APPROVED, NOT ACCEPTED 7 $188,343 4 $159,338 0 $0 0 $0 APPLICATIONS DENIED 5 $164,254 0 $0 0 $0 0 $0 APPLICATIONS WITHDRAWN 10 $162,338 2 $138,395 1 $95,560 0 $0 FILES CLOSED FOR INCOMPLETENESS 0 $0 0 $0 0 $0 0 $0
Aggregated Statistics For Year 2005(Based on 4 partial tracts) A) Conventional B) Refinancings C) Non-occupant Loans on D) Loans On Manufactured Number Average Value Number Average Value Number Average Value Number Average Value
LOANS ORIGINATED 85 $170,357 46 $147,792 11 $166,404 4 $116,180 APPLICATIONS APPROVED, NOT ACCEPTED 6 $225,998 10 $147,943 1 $212,350 0 $0 APPLICATIONS DENIED 0 $0 0 $0 0 $0 0 $0 APPLICATIONS WITHDRAWN 0 $0 5 $141,674 0 $0 0 $0 FILES CLOSED FOR INCOMPLETENESS 0 $0 0 $0 0 $0 0 $0
Aggregated Statistics For Year 2004(Based on 4 partial tracts) A) Conventional B) Refinancings C) Non-occupant Loans on D) Loans On Manufactured Number Average Value Number Average Value Number Average Value Number Average Value
LOANS ORIGINATED 79 $139,306 25 $121,454 4 $132,932 4 $71,475 APPLICATIONS APPROVED, NOT ACCEPTED 15 $109,260 13 $102,396 5 $104,162 0 $0 APPLICATIONS DENIED 0 $0 2 $77,395 0 $0 0 $0 APPLICATIONS WITHDRAWN 0 $0 0 $0 0 $0 0 $0 FILES CLOSED FOR INCOMPLETENESS 2 $73,750 2 $104,705 4 $89,230 0 $0
Aggregated Statistics For Year 2003(Based on 4 partial tracts) A) Conventional B) Refinancings C) Non-occupant Loans on Number Average Value Number Average Value Number Average Value
LOANS ORIGINATED 75 $120,667 146 $127,680 7 $101,716 APPLICATIONS APPROVED, NOT ACCEPTED 9 $114,116 45 $123,384 4 $87,408 APPLICATIONS DENIED 0 $0 2 $133,845 0 $0 APPLICATIONS WITHDRAWN 2 $103,795 6 $119,268 0 $0 FILES CLOSED FOR INCOMPLETENESS 0 $0 0 $0 0 $0
Aggregated Statistics For Year 2002(Based on 4 partial tracts) A) Conventional B) Refinancings C) Non-occupant Loans on Number Average Value Number Average Value Number Average Value
LOANS ORIGINATED 88 $111,192 117 $124,739 13 $65,976 APPLICATIONS APPROVED, NOT ACCEPTED 6 $128,695 13 $102,642 0 $0 APPLICATIONS DENIED 0 $0 2 $101,975 0 $0 APPLICATIONS WITHDRAWN 4 $94,692 6 $161,242 0 $0 FILES CLOSED FOR INCOMPLETENESS 0 $0 0 $0 0 $0
Aggregated Statistics For Year 2001(Based on 4 partial tracts) A) Conventional B) Refinancings C) Non-occupant Loans on Number Average Value Number Average Value Number Average Value
LOANS ORIGINATED 67 $121,021 82 $117,760 4 $141,128 APPLICATIONS APPROVED, NOT ACCEPTED 5 $101,966 9 $100,154 0 $0 APPLICATIONS DENIED 0 $0 2 $135,295 0 $0 APPLICATIONS WITHDRAWN 0 $0 2 $150,865 0 $0 FILES CLOSED FOR INCOMPLETENESS 0 $0 0 $0 0 $0
Aggregated Statistics For Year 2000(Based on 4 partial tracts) A) Conventional B) Refinancings Number Average Value Number Average Value
LOANS ORIGINATED 74 $110,924 8 $127,661 APPLICATIONS APPROVED, NOT ACCEPTED 5 $79,032 6 $108,482 APPLICATIONS DENIED 2 $73,750 1 $67,240 APPLICATIONS WITHDRAWN 2 $78,305 0 $0 FILES CLOSED FOR INCOMPLETENESS 0 $0 0 $0
Aggregated Statistics For Year 1999(Based on 2 partial tracts) A) Conventional B) Refinancings C) Non-occupant Loans on Number Average Value Number Average Value Number Average Value
LOANS ORIGINATED 35 $110,825 24 $111,649 1 $124,230 APPLICATIONS APPROVED, NOT ACCEPTED 2 $87,320 1 $156,580 0 $0 APPLICATIONS DENIED 1 $37,810 1 $98,120 0 $0 APPLICATIONS WITHDRAWN 1 $102,620 2 $94,970 0 $0 FILES CLOSED FOR INCOMPLETENESS 0 $0 0 $0 0 $0
Detailed PMIC statistics for the following Tracts:
0131.00
,
0133.00
2002 - 2018 National Fire Incident Reporting System (NFIRS) incidents See full 2006 National Fire Incident Reporting System statistics for zip code 99016, Washington
Most common first names in zip code 99016 among deceased individuals Name Count Lived (average)
James 45 76.4 years Robert 39 74.4 years Mary 38 80.9 years George 37 76.9 years John 37 78.5 years William 36 79.5 years Richard 27 73.3 years Charles 25 78.5 years Donald 20 71.5 years Frank 20 79.9 years
Most common last names in zip code 99016 among deceased individuals Last name Count Lived (average)
Anderson 26 75.8 years Johnson 20 84.2 years Smith 18 82.3 years Brown 15 70.2 years Nelson 13 81.1 years Olson 13 79.1 years Williams 11 73.2 years Miller 10 79.9 years Peterson 10 83.8 years Wilson 10 80.5 years
Businesses in zip code 99016
Cricket Wireless: 1U-Haul: 1Wendy's: 1
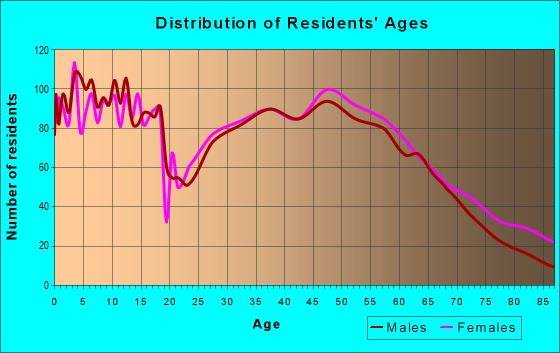
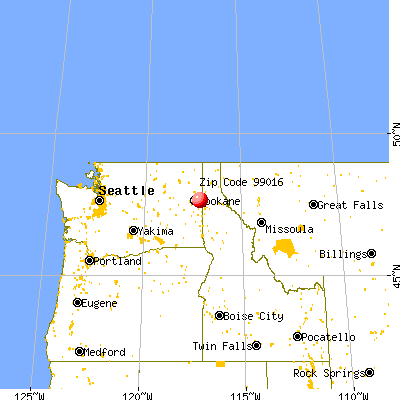


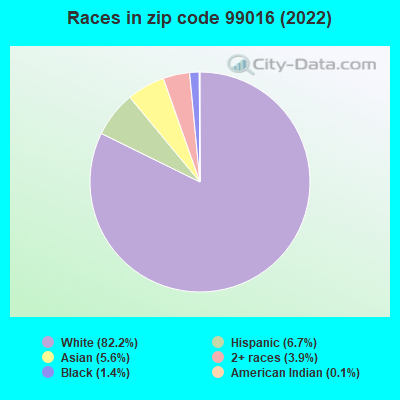


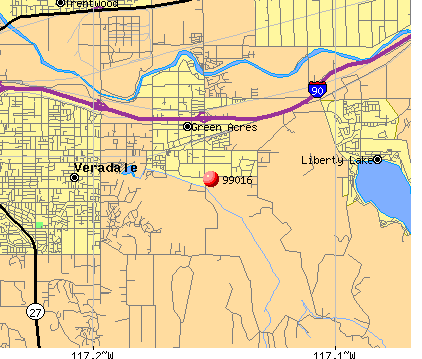 Nearest zip codes: 99023, 99019, 99037, 99027, 99030, 99216.
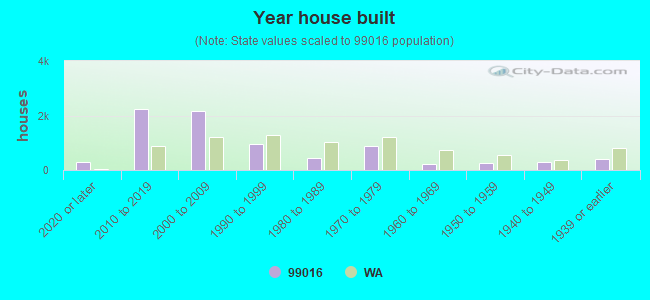
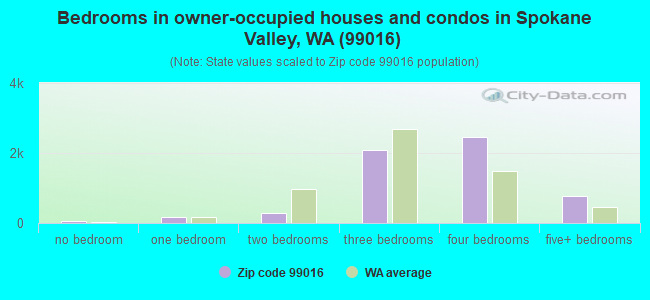
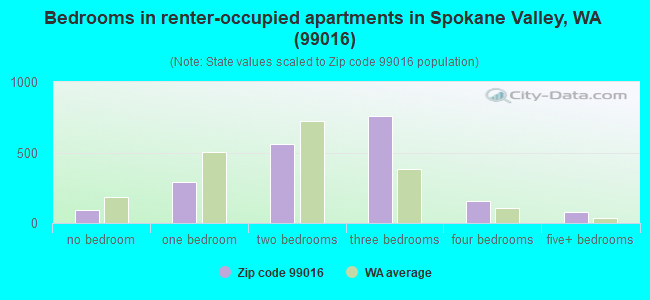
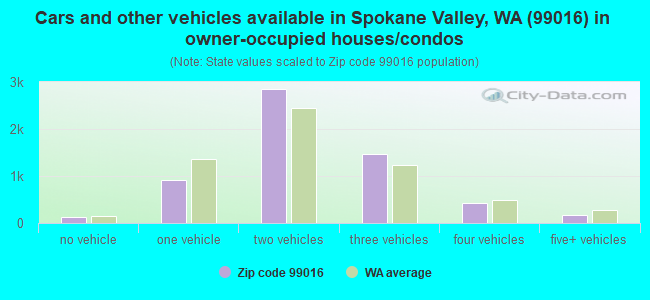
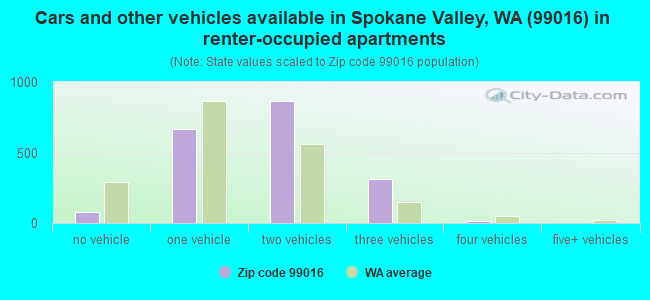


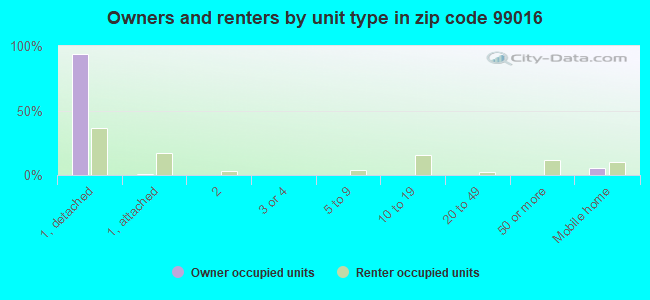
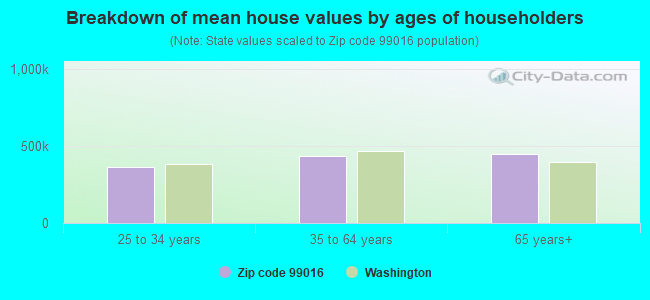


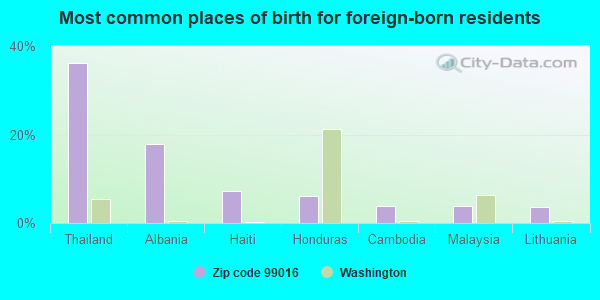
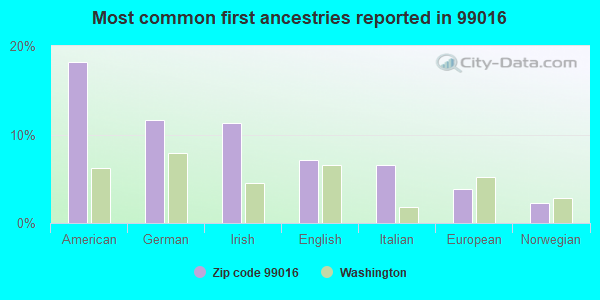
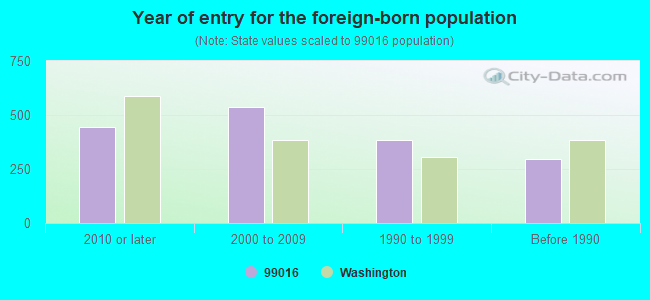


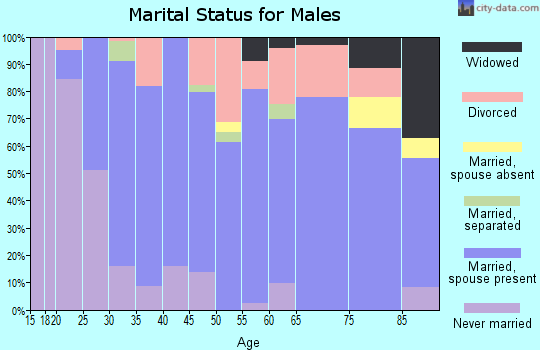
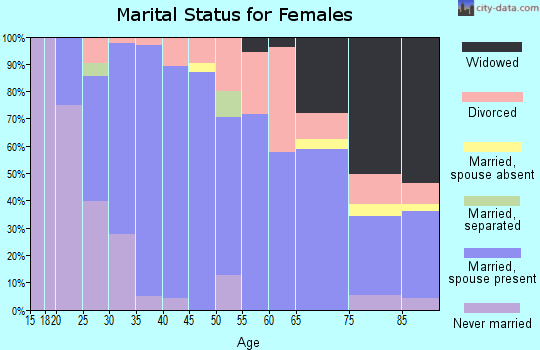
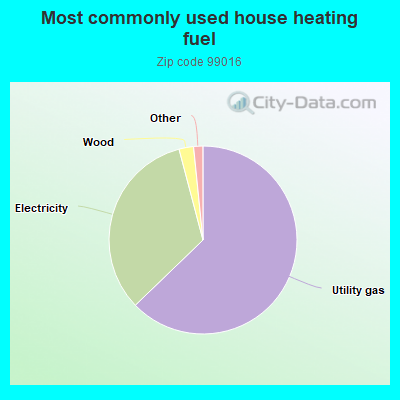
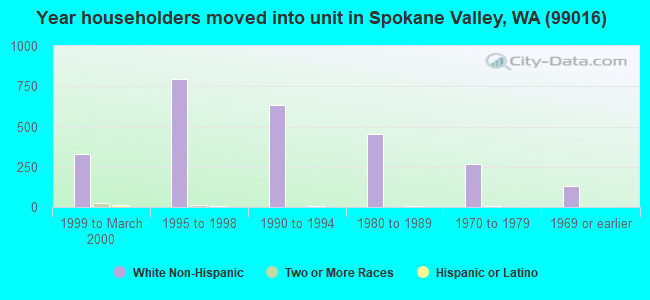
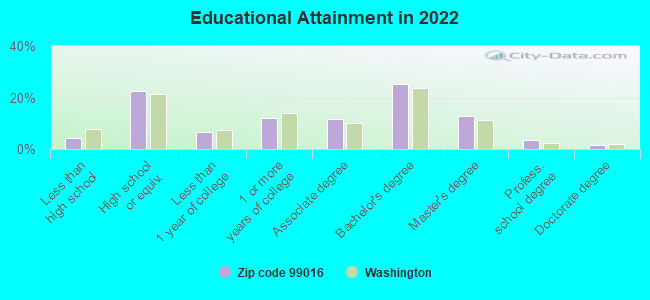
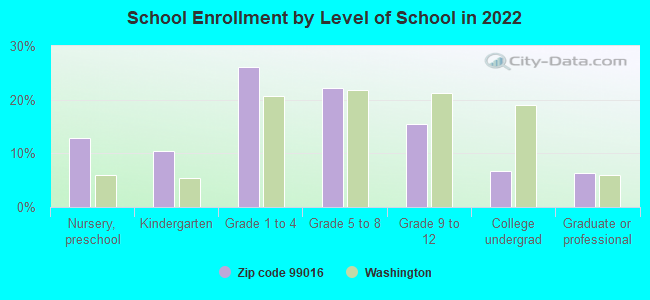
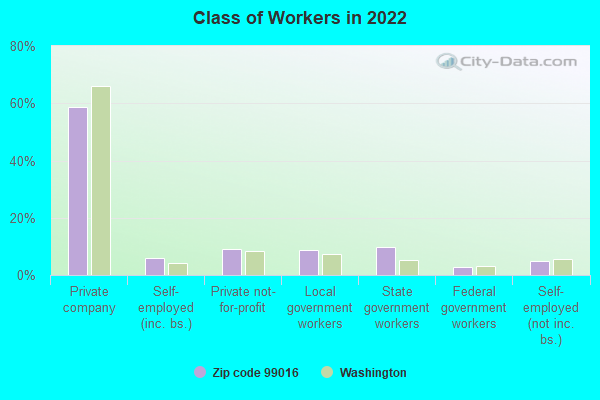
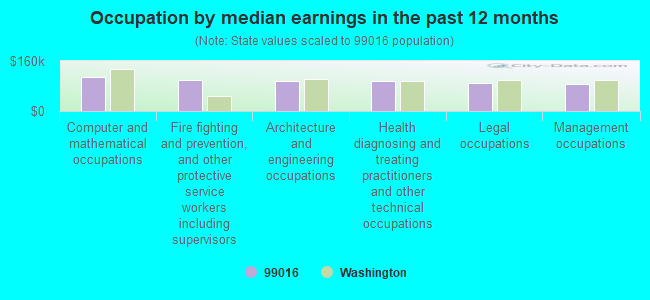
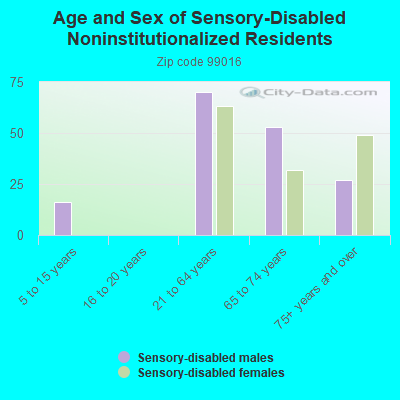
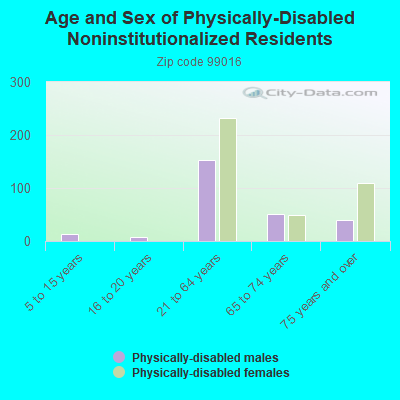
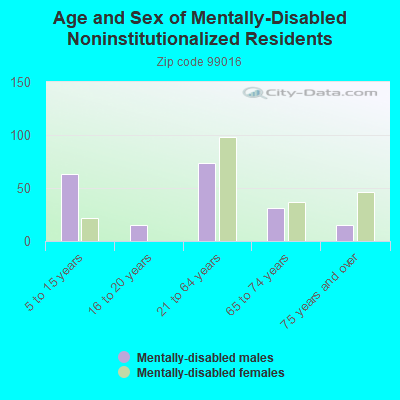
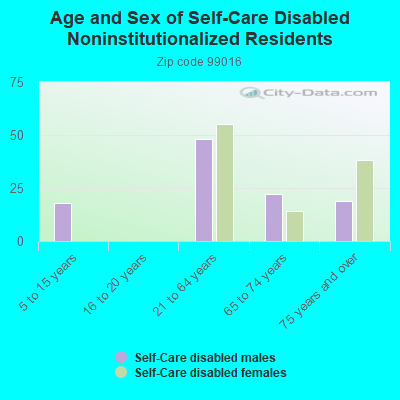
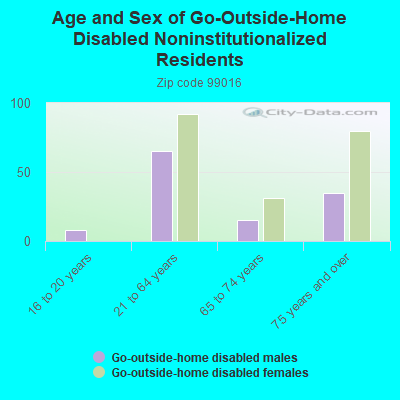
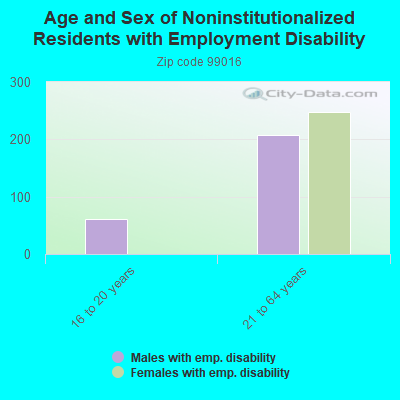
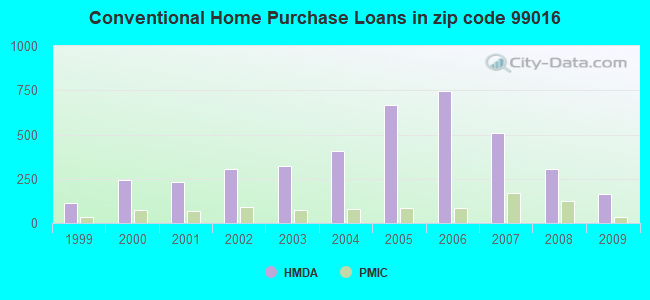
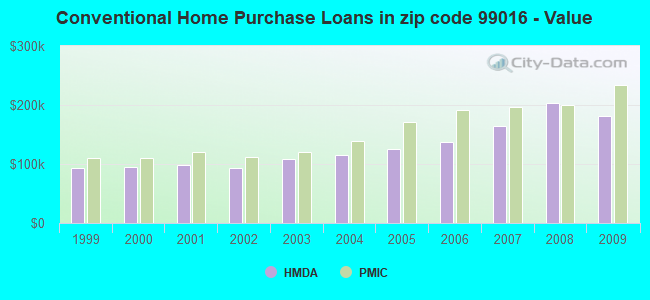
 Based on the data from the years 2002 - 2018 the average number of fires per year is 28. The highest number of reported fire incidents - 40 took place in 2012, and the least - 15 in 2004. The data has an increasing trend.
 When looking into fire subcategories, the most incidents belonged to: Outside Fires (49.6%), and Structure Fires (28.0%).