Estimated zip code population in 2022: 12,399 Zip code population in 2010: 9,502 Zip code population in 2000: 5,370
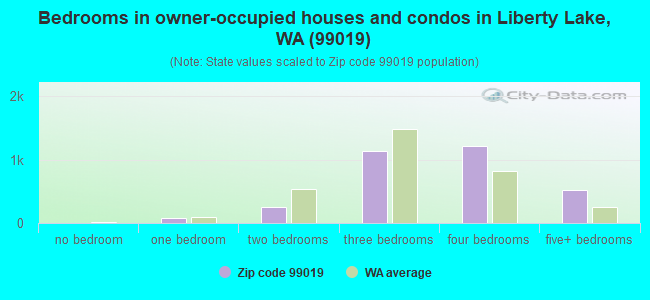
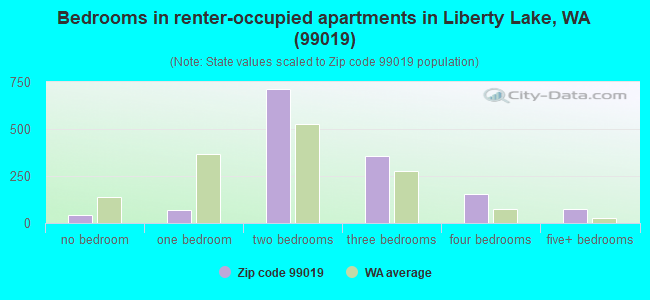
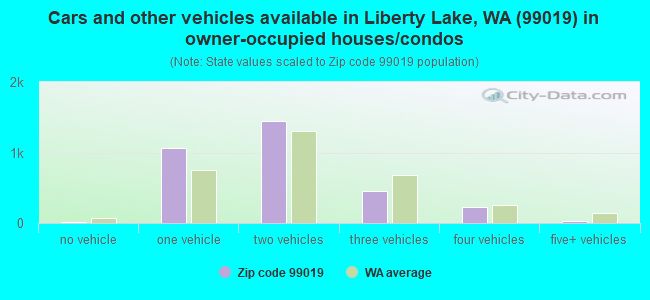
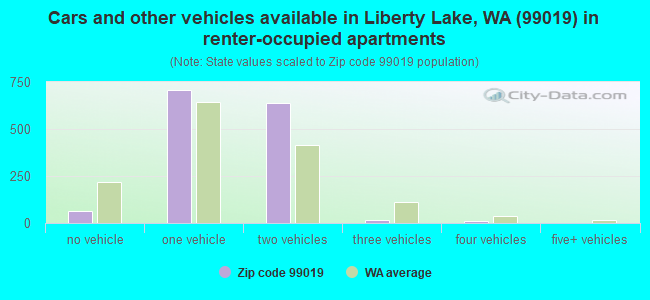
Houses and condos: 5,036 Renter-occupied apartments: 1,422
% of renters here:
31%
State:
36%
March 2022 cost of living index in zip code 99019: 96.6 (near average, U.S. average is 100)
Land area: 21.9 sq. mi. Water area: 1.2 sq. mi.
Population density: 567 people per square mile
(low).
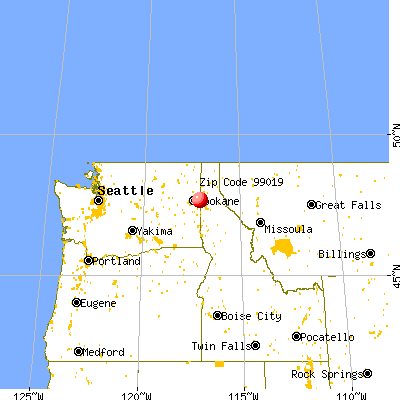
OSM Map
General Map
Google Map
MSN Map
OSM Map
General Map
Google Map
MSN Map
OSM Map
General Map
Google Map
MSN Map
OSM Map
General Map
Google Map
MSN Map
Please wait while loading the map...
Real estate property taxes paid for housing units in 2022:
This zip code:
0.8% ($4,527)
Washington:
0.8% ($4,283)
Median real estate property taxes paid for housing units with mortgages in 2022: $4,497 (0.8%) Median real estate property taxes paid for housing units with no mortgage in 2022: $4,604 (0.9%)
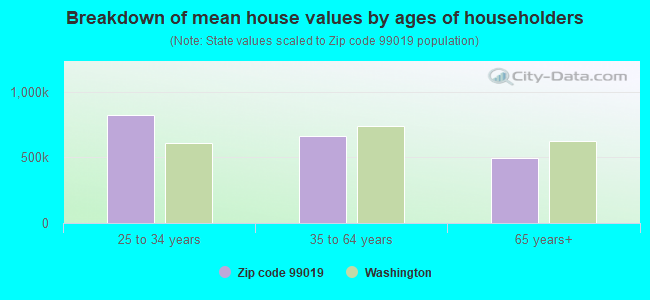
Estimated median house/condo value in 2022: $563,966
99019:
$563,966
Washington:
$569,500
According to our research of Washington and other state lists, there were 2 registered sex offenders living in 99019 zip code as of April 27, 2024. The ratio of all residents to sex offenders in zip code 99019 is 5,373 to 1. The ratio of registered sex offenders to all residents in this zip code is much lower than the state average.
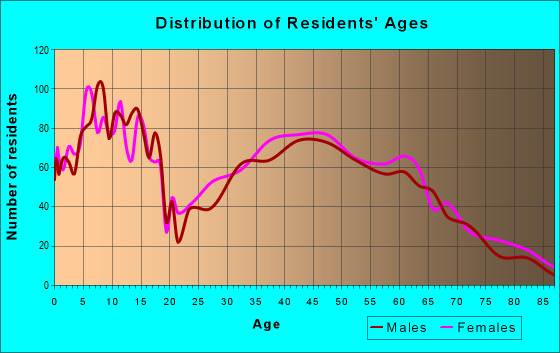
Median resident age:
This zip code:
38.3 years
Washington median age:
38.4 years
Average household size:
This zip code:
2.7 people
Washington:
2.5 people
Averages for the 2020 tax year for zip code 99019, filed in 2021:
Average Adjusted Gross Income (AGI) in 2020: $121,401 (Individual Income Tax Returns)
Here:
$121,401
State:
$99,264
Salary/wage: $88,345 (reported on 78.5% of returns)
Here:
$88,345
State:
$80,347
(% of AGI for various income ranges: 1191.6% for AGIs below $25k, 3343.0% for AGIs $25k-50k, 6041.8% for AGIs $50k-75k, 8923.7% for AGIs $75k-100k, 18568.1% for AGIs $100k-200k, 70766.9% for AGIs over 200k)
Taxable interest for individuals: $3,029 (reported on 48.3% of returns)
This zip code:
$3,029
Washington:
$2,077
(% of AGI for various income ranges: 46.1% for AGIs below $25k, 47.5% for AGIs $25k-50k, 98.8% for AGIs $50k-75k, 160.0% for AGIs $75k-100k, 281.9% for AGIs $100k-200k, 1924.6% for AGIs over 200k)
Ordinary dividends: $9,961 (reported on 29.2% of returns)
Here:
$9,961
State:
$10,013
(% of AGI for various income ranges: 57.0% for AGIs below $25k, 70.0% for AGIs $25k-50k, 142.0% for AGIs $50k-75k, 316.5% for AGIs $75k-100k, 531.7% for AGIs $100k-200k, 4263.1% for AGIs over 200k)
Net capital gain/loss in AGI: +$45,621 (reported on 29.7% of returns)
Here:
+$45,621
State:
+$40,092
(% of AGI for various income ranges: 35.4% for AGIs below $25k, 69.6% for AGIs $25k-50k, 114.1% for AGIs $50k-75k, 336.3% for AGIs $75k-100k, 983.2% for AGIs $100k-200k, 29075.0% for AGIs over 200k)
Profit/loss from business: +$20,509 (reported on 15.1% of returns)
Here:
+$20,509
State:
+$18,312
(% of AGI for various income ranges: 60.2% for AGIs below $25k, 203.9% for AGIs $25k-50k, 247.5% for AGIs $50k-75k, 164.7% for AGIs $75k-100k, 616.4% for AGIs $100k-200k, 4012.3% for AGIs over 200k)
Taxable individual retirement arrangement distribution: $26,821 (reported on 13.7% of returns)
99019:
$26,821
Washington:
$24,221
(% of AGI for various income ranges: 106.0% for AGIs below $25k, 150.8% for AGIs $25k-50k, 335.5% for AGIs $50k-75k, 549.5% for AGIs $75k-100k, 1157.0% for AGIs $100k-200k, 2992.7% for AGIs over 200k)
Self-employed (Keogh) retirement plans: $25,160 (reported on 0.8% of returns)
99019:
$25,160
Washington:
$24,166
(% of AGI for various income ranges: 483.8% for AGIs over 200k)
Total itemized deductions: $41,542 (reported on 14.5% of returns)
Here:
$41,542
State:
$39,068
(% of AGI for various income ranges: 66.9% for AGIs below $25k, 143.6% for AGIs $25k-50k, 400.7% for AGIs $50k-75k, 554.4% for AGIs $75k-100k, 1190.4% for AGIs $100k-200k, 8645.4% for AGIs over 200k)
Charity contributions: $18,144 (reported on 12.3% of returns)
Here:
$18,144
State:
$15,331
(% of AGI for various income ranges: 27.2% for AGIs $25k-50k, 67.3% for AGIs $50k-75k, 85.3% for AGIs $75k-100k, 357.7% for AGIs $100k-200k, 4004.6% for AGIs over 200k)
Taxes paid: $7,920 (reported on 14.3% of returns)
99019:
$7,920
State:
$7,774
(% of AGI for various income ranges: 10.8% for AGIs below $25k, 29.6% for AGIs $25k-50k, 76.1% for AGIs $50k-75k, 120.7% for AGIs $75k-100k, 297.7% for AGIs $100k-200k, 1384.2% for AGIs over 200k)
Earned income credit: $1,938 (reported on 7.1% of returns)
Here:
$1,938
State:
$2,020
(% of AGI for various income ranges: 46.4% for AGIs below $25k, 45.8% for AGIs $25k-50k)
Percentage of individuals using paid preparers for their 2020 taxes: 93.4%
Here:
93%
State:
93%
(% for various income ranges: 89.9% for AGIs below $25k, 94.8% for AGIs $25k-50k, 95.0% for AGIs $50k-75k, 92.4% for AGIs $75k-100k, 94.5% for AGIs $100k-200k, 95.1% for AGIs over 200k)
Averages for the 2012 tax year for zip code 99019, filed in 2013:
Average Adjusted Gross Income (AGI) in 2012: $103,691 (Individual Income Tax Returns)
Here:
$103,691
State:
$69,533
Salary/wage: $75,397 (reported on 81.8% of returns)
Here:
$75,397
State:
$57,267
(% of AGI for various income ranges: 74.9% for AGIs below $25k, 72.9% for AGIs $25k-50k, 73.3% for AGIs $50k-75k, 73.5% for AGIs $75k-100k, 75.1% for AGIs $100k-200k, 41.5% for AGIs over 200k)
Taxable interest for individuals: $3,093 (reported on 48.4% of returns)
This zip code:
$3,093
Washington:
$1,816
(% of AGI for various income ranges: 1.9% for AGIs below $25k, 1.4% for AGIs $25k-50k, 1.3% for AGIs $50k-75k, 1.0% for AGIs $75k-100k, 1.1% for AGIs $100k-200k, 1.7% for AGIs over 200k)
Ordinary dividends: $10,182 (reported on 28.1% of returns)
Here:
$10,182
State:
$8,163
(% of AGI for various income ranges: 3.0% for AGIs below $25k, 2.3% for AGIs $25k-50k, 1.6% for AGIs $50k-75k, 1.8% for AGIs $75k-100k, 1.5% for AGIs $100k-200k, 4.0% for AGIs over 200k)
Net capital gain/loss in AGI: +$60,096 (reported on 27.3% of returns)
Here:
+$60,096
State:
+$21,568
(% of AGI for various income ranges: 0.2% for AGIs $25k-50k, 0.7% for AGIs $50k-75k, 1.2% for AGIs $75k-100k, 2.2% for AGIs $100k-200k, 33.3% for AGIs over 200k)
Profit/loss from business: +$20,303 (reported on 16.4% of returns)
Here:
+$20,303
State:
+$16,521
(% of AGI for various income ranges: 5.0% for AGIs below $25k, 3.7% for AGIs $25k-50k, 1.7% for AGIs $50k-75k, 3.9% for AGIs $75k-100k, 4.0% for AGIs $100k-200k, 2.7% for AGIs over 200k)
Taxable individual retirement arrangement distribution: $19,746 (reported on 13.2% of returns)
99019:
$19,746
Washington:
$18,648
(% of AGI for various income ranges: 4.5% for AGIs below $25k, 3.7% for AGIs $25k-50k, 3.3% for AGIs $50k-75k, 3.9% for AGIs $75k-100k, 3.5% for AGIs $100k-200k, 1.2% for AGIs over 200k)
Self-employment retirement plans: $14,950 (reported on 0.8% of returns)
99019:
$14,950
Washington:
$20,087
Total itemized deductions: $26,520 (15% of AGI, reported on 46.1% of returns)
Here:
$26,520
State:
$23,872
Here:
15.3% of AGI
State:
18.2% of AGI
(% of AGI for various income ranges: 15.6% for AGIs below $25k, 14.6% for AGIs $25k-50k, 14.7% for AGIs $50k-75k, 15.3% for AGIs $75k-100k, 15.0% for AGIs $100k-200k, 7.9% for AGIs over 200k)
Charity contributions: $6,974 (reported on 39.4% of returns)
Here:
$6,974
State:
$4,465
(% of AGI for various income ranges: 1.0% for AGIs below $25k, 1.5% for AGIs $25k-50k, 1.7% for AGIs $50k-75k, 2.1% for AGIs $75k-100k, 2.7% for AGIs $100k-200k, 3.2% for AGIs over 200k)
Taxes paid: $7,343 (reported on 46.1% of returns)
99019:
$7,343
State:
$6,400
(% of AGI for various income ranges: 3.4% for AGIs below $25k, 3.6% for AGIs $25k-50k, 3.9% for AGIs $50k-75k, 4.2% for AGIs $75k-100k, 4.4% for AGIs $100k-200k, 2.2% for AGIs over 200k)
Earned income credit: $2,090 (reported on 8.4% of returns)
Here:
$2,090
State:
$2,073
(% of AGI for various income ranges: 4.0% for AGIs below $25k, 0.7% for AGIs $25k-50k)
Percentage of individuals using paid preparers for their 2012 taxes: 46.1%
Here:
46%
State:
43%
(% for various income ranges: 35.2% for AGIs below $25k, 40.7% for AGIs $25k-50k, 49.3% for AGIs $50k-75k, 45.8% for AGIs $75k-100k, 52.6% for AGIs $100k-200k, 77.1% for AGIs over 200k)
Averages for the 2004 tax year for zip code 99019, filed in 2005:
Average Adjusted Gross Income (AGI) in 2004: $76,559 (Individual Income Tax Returns)
Here:
$76,559
State:
$54,331
Salary/wage: $61,495 (reported on 82.9% of returns)
Here:
$61,495
State:
$45,761
(% of AGI for various income ranges: 162.3% for AGIs below $10k, 65.9% for AGIs $10k-25k, 77.9% for AGIs $25k-50k, 78.8% for AGIs $50k-75k, 81.8% for AGIs $75k-100k, 56.7% for AGIs over 100k)
Taxable interest for individuals: $3,920 (reported on 57.6% of returns)
This zip code:
$3,920
Washington:
$2,110
(% of AGI for various income ranges: 14.3% for AGIs below $10k, 3.5% for AGIs $10k-25k, 2.3% for AGIs $25k-50k, 1.8% for AGIs $50k-75k, 1.0% for AGIs $75k-100k, 3.7% for AGIs over 100k)
Taxable dividends: $6,122 (reported on 36.5% of returns)
Here:
$6,122
State:
$5,879
(% of AGI for various income ranges: 10.4% for AGIs below $10k, 4.4% for AGIs $10k-25k, 1.6% for AGIs $25k-50k, 1.7% for AGIs $50k-75k, 1.2% for AGIs $75k-100k, 3.7% for AGIs over 100k)
Net capital gain/loss: +$15,847 (reported on 34.8% of returns)
Here:
+$15,847
State:
+$15,835
(% of AGI for various income ranges: -2.6% for AGIs below $10k, 0.0% for AGIs $10k-25k, 0.3% for AGIs $25k-50k, 1.2% for AGIs $50k-75k, 1.4% for AGIs $75k-100k, 11.9% for AGIs over 100k)
Profit/loss from business: +$16,386 (reported on 17.3% of returns)
Here:
+$16,386
State:
+$13,994
(% of AGI for various income ranges: -2.0% for AGIs below $10k, 4.3% for AGIs $10k-25k, 3.5% for AGIs $25k-50k, 3.0% for AGIs $50k-75k, 3.2% for AGIs $75k-100k, 4.1% for AGIs over 100k)
IRA payment deduction: $3,491 (reported on 3.0% of returns)
99019:
$3,491
Washington:
$3,001
(% of AGI for various income ranges: 1.7% for AGIs below $10k, 0.2% for AGIs $25k-50k, 0.2% for AGIs $50k-75k, 0.1% for AGIs $75k-100k, 0.1% for AGIs over 100k)
Self-employed pension: $13,298 (reported on 1.3% of returns)
Here:
$13,298
Washington:
$14,244
Total itemized deductions: $21,800 (19% of AGI, reported on 52.2% of returns)
Here:
$21,800
State:
$19,669
Here:
19.2% of AGI
State:
20.7% of AGI
(% of AGI for various income ranges: 31.8% for AGIs below $10k, 17.1% for AGIs $10k-25k, 17.8% for AGIs $25k-50k, 18.2% for AGIs $50k-75k, 17.0% for AGIs $75k-100k, 12.7% for AGIs over 100k)
Charity contributions deductions: $5,327 (4% of AGI, reported on 47.0% of returns)
Here:
$5,327
State:
$3,569
Here:
4.5% of AGI
State:
3.5% of AGI
(% of AGI for various income ranges: 1.4% for AGIs below $10k, 2.0% for AGIs $10k-25k, 1.6% for AGIs $25k-50k, 2.6% for AGIs $50k-75k, 2.4% for AGIs $75k-100k, 4.0% for AGIs over 100k)
Total tax: $13,695 (reported on 82.6% of returns)
99019:
$13,695
State:
$9,065
(% of AGI for various income ranges: 4.3% for AGIs below $10k, 4.7% for AGIs $10k-25k, 6.9% for AGIs $25k-50k, 8.2% for AGIs $50k-75k, 10.0% for AGIs $75k-100k, 19.7% for AGIs over 100k)
Earned income credit: $1,502 (reported on 6.8% of returns)
Here:
$1,502
State:
$1,607
Percentage of individuals using paid preparers for their 2004 taxes: 49.8%
Here:
50%
State:
49%
(% for various income ranges: 41.5% for AGIs below $10k, 48.3% for AGIs $10k-25k, 45.7% for AGIs $25k-50k, 45.3% for AGIs $50k-75k, 52.1% for AGIs $75k-100k, 64.4% for AGIs over 100k)
Household received Food Stamps/SNAP in the past 12 months: 476 Household did not receive Food Stamps/SNAP in the past 12 months: 4,136
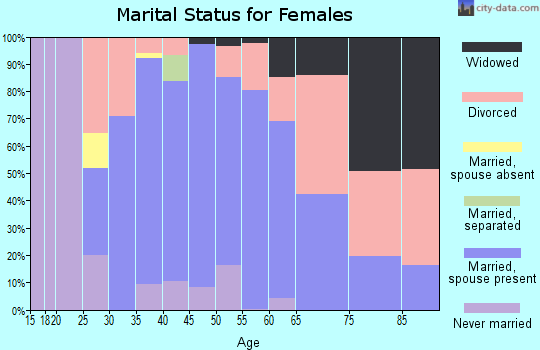
Women who had a birth in the past 12 months: 111 (115 now married, 0 unmarried) Women who did not have a birth in the past 12 months: 2,593 (1,401 now married, 1,184 unmarried)
Housing units in zip code 99019 with a mortgage: 2,055 (111 second mortgage, 64 both second mortgage and home equity loan) Median monthly owner costs for units with a mortgage: $2,287 Median monthly owner costs for units without a mortgage: $712
Residents with income below the poverty level in 2022:
This zip code:
3.3%
Whole state:
10.0%
Residents with income below 50% of the poverty level in 2022:
This zip code:
1.2%
Whole state:
4.6%
Median number of rooms in houses and condos:
Here:
8.0
State:
6.5
Median number of rooms in apartments:
Here:
4.3
State:
3.9
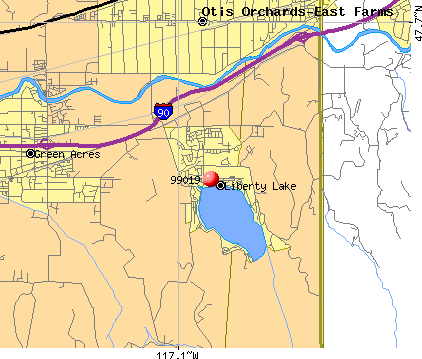
Notable locations in this zip code not listed on our city pages
Notable locations in zip code 99019: Valley View Golf Course (A), Mulsh Grove (B), Liberty Lake (C), Spokane Bridge (D), Aturdee (E), Spokane Valley Fire Station 3 (F). Display/hide their locations on the map
In group quarters: 16 (-1 institutionalized population)
Size of family households: 1,320 2-persons, 520 3-persons, 869 4-persons, 225 5-persons, 359 6-persons, 14 7-or-more-persons
Size of nonfamily households: 1,074 1-person, 180 2-persons, 12 3-persons
2,923 married couples with children.
650 single-parent households (650 women).
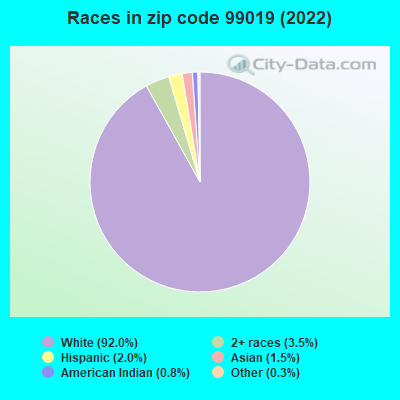
98.4% of residents of 99019 zip code speak English at home.
0.3% of residents speak Spanish at home (100% very well).
0.6% of residents speak Asian or Pacific Island language at home (33% very well, 33% well, 34% not well).
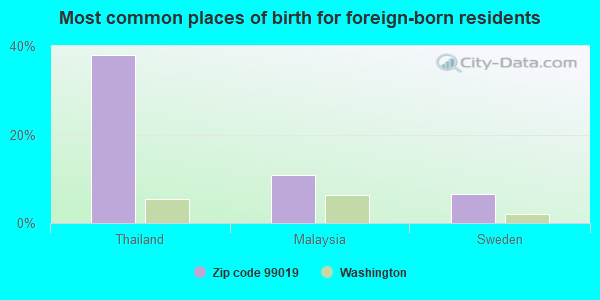
Foreign born population: 122 (1.0%) (95.8% of them are naturalized citizens)
This zip code:
1.0%
Whole state:
15.3%
38%Thailand
11%Malaysia
7%Sweden
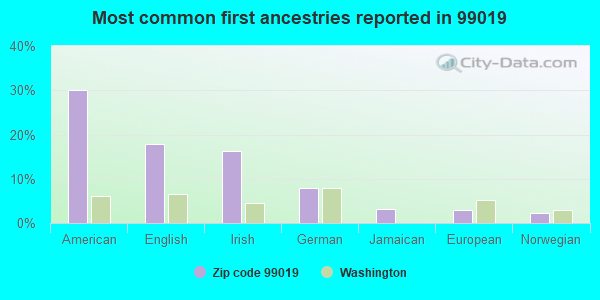
30%American
18%English
16%Irish
8%German
3%Jamaican
3%European
2%Norwegian
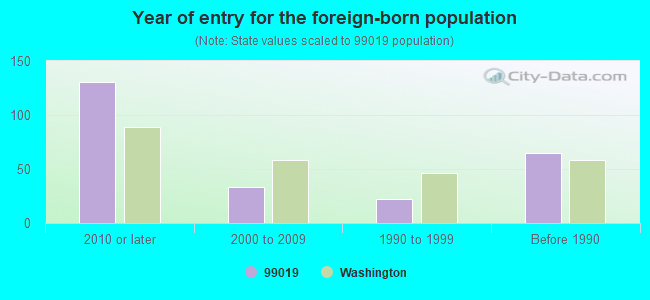
Year of entry for the foreign-born population
1312010 or later
332000 to 2009
221990 to 1999
65Before 1990
Facilities with environmental interests located in this zip code:
AGILENT TECHNOLOGIES (24001 EAST MISSION AVENUE in LIBERTY LAKE, WA)
ENFORCEMENT/COMPLIANCE ACTIVITY (Integrated Compliance Information System) CRITERIA AND HAZARDOUS AIR POLLUTANT INVENTORY (Inventory of air pollution sources) HAZARDOUS WASTE BIENNIAL REPORTER (Resource Conservation and Recovery Act (tracking hazardous waste)) Large Quantity Generators, more that 1000 kg of hazardous waste/month (Resource Conservation and Recovery Act (tracking hazardous waste)) - notification TSD (Resource Conservation and Recovery Act (tracking hazardous waste)) TRI REPORTER (Tracking of toxic chemicals releasing facilities) STATE MASTER (Washington State Department of Ecology's Facility/Site identification system) - HAZWASTE-WAD991281841, EPCRA, TRI REPORTER, HAZARDOUS WASTE PROGRAM, LQG STATE MASTER (Washington State Department of Ecology's Facility/Site identification system) - TOXICS-3042, UNDERGROUND STORAGE TANK PROGRAM Business SIC classification: INSTRUMENTS FOR MEASURING AND TESTING OF ELECTRICITY AND ELECTRICAL SIGNALS Organizations: MIKE DITTMORE (CONTACT/OPERATOR)
Alternative names: AGILENT TECHNOLOGIES SPOKANE, HEWLETT-PACKARD CO., HEWLETT PACKARD COMPANY SPOKANE, HEWLETT PACKARD COMPANY UST 3042
ALTEK INCORPORATED (22819 EAST APPLEWAY AVENUE in LIBERTY LAKE, WA)
AIR SYNTHETIC MINOR (AIRS/AFS) (Resource Conservation and Recovery Act (tracking hazardous waste)) Conditionally Exempt Small Quantity Generators, less than 100 kg/month of hazardous waste (Resource Conservation and Recovery Act (tracking hazardous waste)) STATE MASTER (Washington State Department of Ecology's Facility/Site identification system) - AIRQUAL-K0630126, AIR MINOR, HAZWASTE-WAH000012864, CESQG Business SIC classification: PLASTICS PRODUCTS Business NAICS classification: ALL OTHER PLASTICS PRODUCT MANUFACTURING.; ALL OTHER MISCELLANEOUS GENERAL PURPOSE MACHINERY MANUFACTURING.; ALL OTHER MISCELLANEOUS GENERAL PURPOSE MACHINERY MANUFACTURING. Organizations: ALTEK INC APPLEWAY AVE (CONTACT/OPERATOR)
Alternative names: ALTEK INC APPLEWAY AVE, ALTEK INC APPLEWAY AVE
ACCRA FAB INC LIBERTY LAKE (1611 N MOLTER RD in LIBERTY LAKE, WA)
HAZARDOUS WASTE BIENNIAL REPORTER (Resource Conservation and Recovery Act (tracking hazardous waste)) Large Quantity Generators, more that 1000 kg of hazardous waste/month (Resource Conservation and Recovery Act (tracking hazardous waste)) STATE MASTER (Washington State Department of Ecology's Facility/Site identification system) - HAZWASTE-WAH000003632, LQG, EPCRA, HAZARDOUS WASTE PROGRAM Business SIC classification: SHEET METALWORK Business NAICS classification: SHEET METAL WORK MANUFACTURING.; SHEET METAL WORK MANUFACTURING. Organizations: WILLIAM PATRICK (CONTACT/OPERATOR)
ACCRA FAB INC APPLEWAY DR (23201 E APPLEWAY DR in LIBERTY LAKE, WA)
Large Quantity Generators, more that 1000 kg of hazardous waste/month (Resource Conservation and Recovery Act (tracking hazardous waste)) STATE MASTER (Washington State Department of Ecology's Facility/Site identification system) - HAZWASTE-WAH000016352, EPCRA, HAZARDOUS WASTE PROGRAM, LQG Business SIC classification: SHEET METALWORK Business NAICS classification: SHEET METAL WORK MANUFACTURING.; SHEET METAL WORK MANUFACTURING. Organizations: BOB OTTO (CONTACT/OPERATOR)
Housing units lacking complete plumbing facilities: 0.8% Housing units lacking complete kitchen facilities: 2.7%
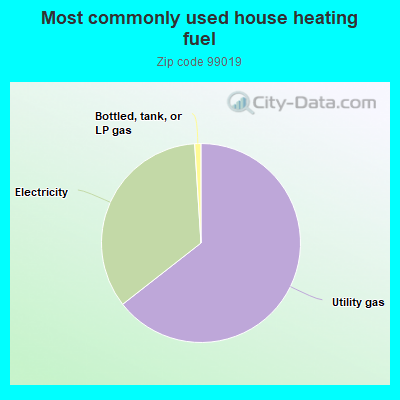
63.8%Utility gas
34.2%Electricity
1.0%Bottled, tank, or LP gas
Population in 1990: 2,372. Population change in the 1990s: +2,998 (+126.4%).
Place of birth for U.S.-born residents:
This state: 5,277
Northeast: 461
Midwest: 1,008
South: 1,434
West: 3,895
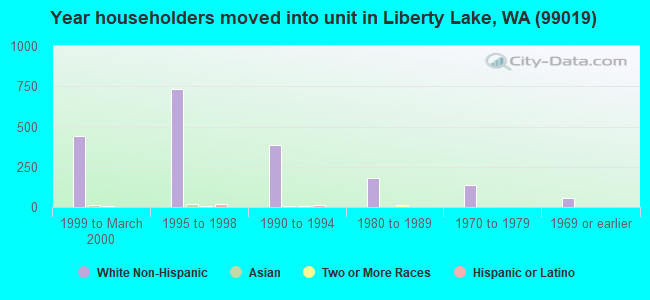
48% of the 99019 zip code residents lived in the same house 5 years ago. Out of people who lived in different houses, 55% lived in this county. Out of people who lived in different counties, 50% lived in Washington.
86% of the 99019 zip code residents lived in the same house 1 year ago. Out of people who lived in different houses, 37% moved from this county. Out of people who lived in different houses, 11% moved from different county within same state. Out of people who lived in different houses, 56% moved from different state.
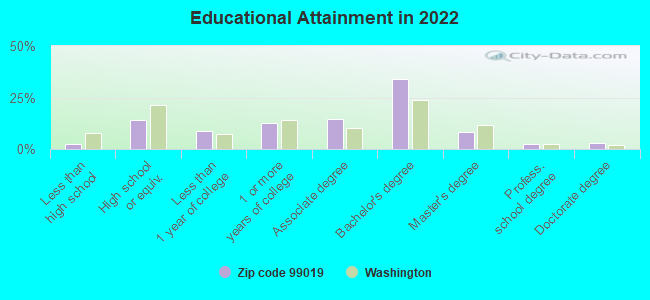
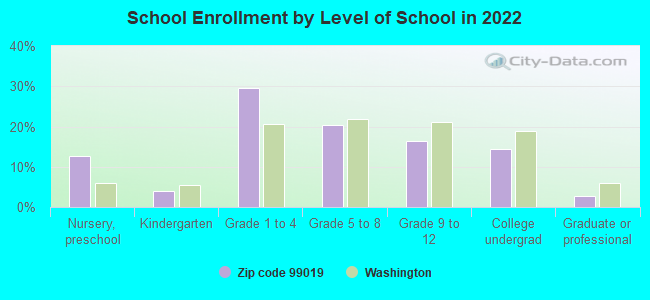
Private vs. public school enrollment:
Students in private schools in grades 1 to 8 (elementary and middle school): 534
Here:
29.0%
Washington:
12.4%
Students in private schools in grades 9 to 12 (high school): 112
Here:
18.3%
Washington:
9.2%
Students in private undergraduate colleges: 17
Here:
3.4%
Washington:
16.5%
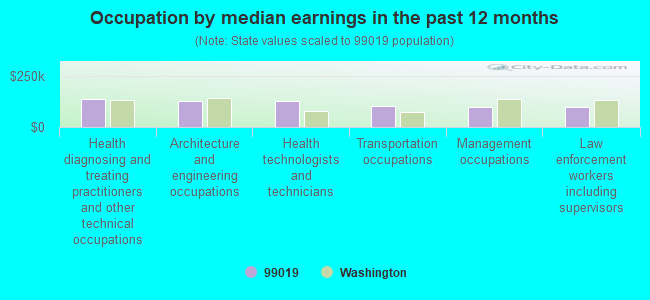
Occupation by median earnings in the past 12 months ($)
137,199Health diagnosing and treating practitioners and other technical occupations
128,632Architecture and engineering occupations
127,361Health technologists and technicians
103,302Transportation occupations
100,522Management occupations
99,573Law enforcement workers including supervisors
Companies with federal contracts located in this zip code:
ISOTHERMAL SYSTEMS RESEARCH (2218 N MOLTER RD in LIBERTY LAKE, WA; small business) : $110,287,724 in 33 contractsfrom 2000 to 2006
Contracts for Engineering and Technical Services, Defense Electronics and Communication Equipment -- Applied Research and Exploratory Development (R&D), Defense Electronics and Communication Equipment -- Advanced Development (R&D), Microcircuits, Electronic, and moreby Defense Microelectronics Activity, Department of Defense, Air Force, Navy, and others Signed by year:2000: $1,482,592; 2001: $1,765,401; 2002: $14,339,485; 2003: $12,542,490; 2004: $45,735,380; 2005: $19,014,157; 2006: $15,408,219.
Biggest contracts:
$16,721,778 with Defense Microelectronics Activity for Engineering and Technical Services. Signed on 2004-03-24. Completion date: 2005-10-31.
$11,190,950, same as above.Signed on 2004-06-08. Completion date: 2006-02-17.
$10,999,998 with Department of Defense for Engineering and Technical Services. Signed on 2005-03-15. Completion date: 2007-03-31.
$10,095,069 with Defense Microelectronics Activity for Engineering and Technical Services. Signed on 2006-05-15. Completion date: 2007-09-21.
SOFTWARE SPECTRUM INC (22721 E MISSION in LIBERTY LAKE, WA) : $2,454,883 in 19 contractsfrom 2000 to 2006
Contracts for ADP Software, Maintenance, Repair and Rebuilding of Equipment -- Automatic Data Processing Equipment (Including Firmware), Software, Supplies and Support Equipment, Other Professional Services, Maintenance, Repair and Rebuilding of Equipment -- Miscellaneous by Defense Finance and Accounting Service, Department of Defense, Army, Navy, and others Signed by year:2000: $771,387; 2001: $66,424; 2002: -$60,007; 2003: $1,562,763; 2004: $10,572; 2005: $12,443; 2006: $91,301.
Biggest contracts:
$842,599 with Defense Finance and Accounting Service for ADP Software. Taking place in FL. Signed on 2003-10-01. Completion date: 2006-09-08.
$738,045 with Department of Defense for ADP Software. Signed on 2000-09-19. Completion date: 2000-09-30.
$367,995 with Army for ADP Software. Taking place in GA. Signed on 2003-09-25. Completion date: 2003-09-30.
$191,925 with Army for ADP Software. Signed on 2003-07-07. Completion date: 2006-07-06.
Top industries in this zip code by the number of employees in 2005:
Finance and Insurance: Direct Property and Casualty Insurance Carriers (500-999 employees: 1 establishment, 1-4 employees: 2 establishments)
Finance and Insurance: Third Party Administration of Insurance and Pension Funds (250-499: 1)
Professional, Scientific, and Technical Services: Computer Systems Design Services (100-249: 1, 1-4: 2)
Finance and Insurance: Credit Unions (100-249: 1, 1-4: 1)
Wholesale Trade: Computer and Computer Peripheral Equipment and Software Merchant Wholesalers (100-249: 1)
People in group quarters in 2000:
11 people in other noninstitutional group quarters
Fatal accident statistics in 2013:
Fatal accident count: 1
Vehicles involved in fatal accidents: 1
Fatal accidents caused by drunken drivers: 1
Fatalities: 1
Persons involved in fatal accidents: 1
Pedestrians involved in fatal accidents: 0
Fatal accident statistics in 2011:
Fatal accident count: 2
Vehicles involved in fatal accidents: 2
Fatal accidents caused by drunken drivers: 2
Fatalities: 2
Persons involved in fatal accidents: 4
Pedestrians involved in fatal accidents: 1
Home Mortgage Disclosure Act Aggregated Statistics For Year 2009 (Based on 2 full tracts)
A) FHA, FSA/RHS & VA Home Purchase Loans
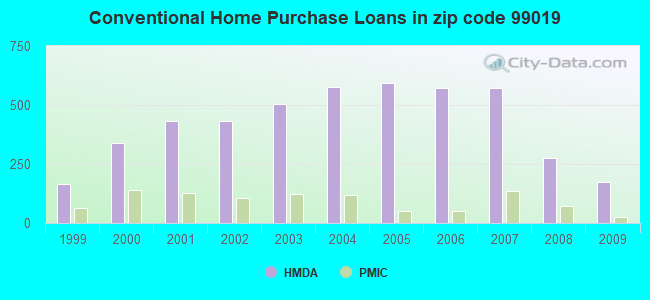
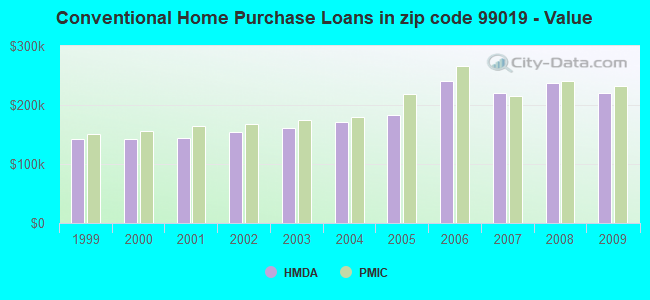
B) Conventional Home Purchase Loans
C) Refinancings
D) Home Improvement Loans
E) Loans on Dwellings For 5+ Families
F) Non-occupant Loans on < 5 Family Dwellings (A B C & D)
G) Loans On Manufactured Home Dwelling (A B C & D)
Number
Average Value
Number
Average Value
Number
Average Value
Number
Average Value
Number
Average Value
Number
Average Value
Number
Average Value
LOANS ORIGINATED
146
$202,394
174
$220,669
895
$236,670
48
$161,552
2
$89,065
38
$206,566
4
$145,965
APPLICATIONS APPROVED, NOT ACCEPTED
6
$307,435
22
$294,721
113
$279,855
2
$17,815
0
$0
14
$181,097
0
$0
APPLICATIONS DENIED
16
$180,973
32
$244,679
243
$329,313
4
$22,265
0
$0
22
$198,190
4
$109,845
APPLICATIONS WITHDRAWN
24
$181,427
42
$198,203
212
$255,532
8
$83,374
0
$0
14
$186,610
2
$229,585
FILES CLOSED FOR INCOMPLETENESS
2
$169,220
2
$675,895
32
$241,772
2
$148,440
0
$0
0
$0
0
$0
Aggregated Statistics For Year 2008 (Based on 2 full tracts)
A) FHA, FSA/RHS & VA Home Purchase Loans
B) Conventional Home Purchase Loans
C) Refinancings
D) Home Improvement Loans
E) Loans on Dwellings For 5+ Families
F) Non-occupant Loans on < 5 Family Dwellings (A B C & D)
G) Loans On Manufactured Home Dwelling (A B C & D)
Number
Average Value
Number
Average Value
Number
Average Value
Number
Average Value
Number
Average Value
Number
Average Value
Number
Average Value
LOANS ORIGINATED
40
$232,259
275
$236,885
477
$240,467
77
$123,790
0
$0
53
$164,572
4
$95,990
APPLICATIONS APPROVED, NOT ACCEPTED
0
$0
28
$227,608
81
$262,256
10
$215,139
2
$316,670
6
$166,583
0
$0
APPLICATIONS DENIED
8
$241,710
22
$236,155
113
$253,495
12
$341,742
0
$0
10
$232,358
0
$0
APPLICATIONS WITHDRAWN
4
$162,790
28
$283,945
59
$263,770
10
$126,471
0
$0
6
$237,833
2
$115,785
FILES CLOSED FOR INCOMPLETENESS
0
$0
2
$712,510
20
$303,807
0
$0
0
$0
2
$111,825
0
$0
Aggregated Statistics For Year 2007 (Based on 2 full tracts)
A) FHA, FSA/RHS & VA Home Purchase Loans
B) Conventional Home Purchase Loans
C) Refinancings
D) Home Improvement Loans
E) Loans on Dwellings For 5+ Families
F) Non-occupant Loans on < 5 Family Dwellings (A B C & D)
G) Loans On Manufactured Home Dwelling (A B C & D)
Number
Average Value
Number
Average Value
Number
Average Value
Number
Average Value
Number
Average Value
Number
Average Value
Number
Average Value
LOANS ORIGINATED
4
$238,988
574
$220,074
433
$255,239
67
$69,597
4
$9,871,260
95
$200,066
4
$32,162
APPLICATIONS APPROVED, NOT ACCEPTED
0
$0
57
$237,678
71
$280,294
6
$58,057
0
$0
12
$259,605
0
$0
APPLICATIONS DENIED
0
$0
61
$301,487
162
$321,095
24
$95,826
0
$0
24
$361,204
4
$41,562
APPLICATIONS WITHDRAWN
2
$151,410
36
$274,724
97
$279,332
12
$62,675
0
$0
10
$207,420
0
$0
FILES CLOSED FOR INCOMPLETENESS
0
$0
16
$241,215
26
$215,580
6
$170,542
0
$0
4
$90,548
0
$0
Aggregated Statistics For Year 2006 (Based on 2 full tracts)
A) FHA, FSA/RHS & VA Home Purchase Loans
B) Conventional Home Purchase Loans
C) Refinancings
D) Home Improvement Loans
E) Loans on Dwellings For 5+ Families
F) Non-occupant Loans on < 5 Family Dwellings (A B C & D)
G) Loans On Manufactured Home Dwelling (A B C & D)
Number
Average Value
Number
Average Value
Number
Average Value
Number
Average Value
Number
Average Value
Number
Average Value
Number
Average Value
LOANS ORIGINATED
4
$256,308
574
$240,797
392
$204,055
89
$67,582
2
$13,804,920
109
$198,465
4
$115,782
APPLICATIONS APPROVED, NOT ACCEPTED
2
$78,180
73
$245,936
53
$275,482
14
$66,021
0
$0
10
$189,607
2
$66,305
APPLICATIONS DENIED
0
$0
99
$265,973
139
$212,016
26
$84,573
0
$0
26
$344,914
12
$90,548
APPLICATIONS WITHDRAWN
0
$0
67
$264,533
115
$230,964
8
$71,499
0
$0
4
$226,618
0
$0
FILES CLOSED FOR INCOMPLETENESS
0
$0
12
$111,330
32
$265,027
2
$29,690
0
$0
6
$200,558
0
$0
Aggregated Statistics For Year 2005 (Based on 2 full tracts)
A) FHA, FSA/RHS & VA Home Purchase Loans
B) Conventional Home Purchase Loans
C) Refinancings
D) Home Improvement Loans
F) Non-occupant Loans on < 5 Family Dwellings (A B C & D)
G) Loans On Manufactured Home Dwelling (A B C & D)
Number
Average Value
Number
Average Value
Number
Average Value
Number
Average Value
Number
Average Value
Number
Average Value
LOANS ORIGINATED
6
$207,157
594
$183,799
524
$176,553
59
$131,130
127
$155,048
2
$47,500
APPLICATIONS APPROVED, NOT ACCEPTED
0
$0
44
$194,187
57
$158,405
12
$88,074
10
$129,440
0
$0
APPLICATIONS DENIED
0
$0
101
$146,382
115
$152,863
48
$65,602
30
$104,898
4
$49,480
APPLICATIONS WITHDRAWN
2
$118,750
85
$182,994
139
$182,385
12
$62,675
30
$125,877
2
$153,390
FILES CLOSED FOR INCOMPLETENESS
0
$0
16
$125,432
67
$193,519
2
$34,635
2
$117,760
2
$159,325
Aggregated Statistics For Year 2004 (Based on 2 full tracts)
A) FHA, FSA/RHS & VA Home Purchase Loans
B) Conventional Home Purchase Loans
C) Refinancings
D) Home Improvement Loans
E) Loans on Dwellings For 5+ Families
F) Non-occupant Loans on < 5 Family Dwellings (A B C & D)
G) Loans On Manufactured Home Dwelling (A B C & D)
Number
Average Value
Number
Average Value
Number
Average Value
Number
Average Value
Number
Average Value
Number
Average Value
Number
Average Value
LOANS ORIGINATED
30
$174,895
576
$170,916
485
$179,915
44
$79,258
2
$2,968,800
77
$134,483
6
$122,050
APPLICATIONS APPROVED, NOT ACCEPTED
0
$0
44
$156,447
93
$184,938
10
$93,220
0
$0
8
$100,691
2
$11,875
APPLICATIONS DENIED
0
$0
67
$138,160
111
$155,430
32
$20,472
0
$0
8
$111,578
14
$82,278
APPLICATIONS WITHDRAWN
4
$175,655
32
$155,924
119
$149,438
6
$309,745
0
$0
4
$96,980
0
$0
FILES CLOSED FOR INCOMPLETENESS
0
$0
12
$184,066
34
$192,332
0
$0
0
$0
2
$161,305
0
$0
Aggregated Statistics For Year 2003 (Based on 2 full tracts)
A) FHA, FSA/RHS & VA Home Purchase Loans
B) Conventional Home Purchase Loans
C) Refinancings
D) Home Improvement Loans
E) Loans on Dwellings For 5+ Families
F) Non-occupant Loans on < 5 Family Dwellings (A B C & D)
Number
Average Value
Number
Average Value
Number
Average Value
Number
Average Value
Number
Average Value
Number
Average Value
LOANS ORIGINATED
51
$156,784
505
$160,523
1,407
$158,934
22
$41,383
4
$13,333,870
73
$131,468
APPLICATIONS APPROVED, NOT ACCEPTED
4
$121,720
40
$166,302
141
$157,957
4
$60,365
0
$0
14
$119,600
APPLICATIONS DENIED
10
$134,586
61
$169,011
172
$192,891
8
$75,458
0
$0
12
$90,218
APPLICATIONS WITHDRAWN
8
$141,760
32
$154,996
148
$163,819
4
$14,845
0
$0
8
$159,325
FILES CLOSED FOR INCOMPLETENESS
4
$106,878
8
$117,515
34
$216,024
2
$51,460
0
$0
0
$0
Aggregated Statistics For Year 2002 (Based on 2 full tracts)
A) FHA, FSA/RHS & VA Home Purchase Loans
B) Conventional Home Purchase Loans
C) Refinancings
D) Home Improvement Loans
F) Non-occupant Loans on < 5 Family Dwellings (A B C & D)
Number
Average Value
Number
Average Value
Number
Average Value
Number
Average Value
Number
Average Value
LOANS ORIGINATED
53
$143,884
431
$154,102
926
$148,466
16
$34,512
59
$125,931
APPLICATIONS APPROVED, NOT ACCEPTED
8
$132,606
20
$246,311
97
$167,477
4
$22,265
6
$189,013
APPLICATIONS DENIED
4
$69,768
24
$119,412
99
$148,580
8
$34,389
0
$0
APPLICATIONS WITHDRAWN
6
$146,790
30
$116,971
127
$161,515
0
$0
14
$123,559
FILES CLOSED FOR INCOMPLETENESS
2
$132,605
8
$151,656
22
$133,506
0
$0
4
$78,178
Aggregated Statistics For Year 2001 (Based on 2 full tracts)
A) FHA, FSA/RHS & VA Home Purchase Loans
B) Conventional Home Purchase Loans
C) Refinancings
D) Home Improvement Loans
E) Loans on Dwellings For 5+ Families
F) Non-occupant Loans on < 5 Family Dwellings (A B C & D)
Number
Average Value
Number
Average Value
Number
Average Value
Number
Average Value
Number
Average Value
Number
Average Value
LOANS ORIGINATED
61
$135,981
431
$144,826
716
$164,310
36
$28,698
2
$4,453,200
51
$346,670
APPLICATIONS APPROVED, NOT ACCEPTED
2
$153,390
30
$174,302
59
$145,689
4
$7,422
0
$0
2
$121,720
APPLICATIONS DENIED
2
$127,660
30
$135,707
93
$129,840
10
$40,574
0
$0
6
$147,780
APPLICATIONS WITHDRAWN
4
$163,285
28
$124,124
103
$531,444
6
$35,625
0
$0
8
$84,859
FILES CLOSED FOR INCOMPLETENESS
0
$0
2
$157,345
18
$195,501
0
$0
0
$0
0
$0
Aggregated Statistics For Year 2000 (Based on 2 full tracts)
A) FHA, FSA/RHS & VA Home Purchase Loans
B) Conventional Home Purchase Loans
C) Refinancings
D) Home Improvement Loans
F) Non-occupant Loans on < 5 Family Dwellings (A B C & D)
Number
Average Value
Number
Average Value
Number
Average Value
Number
Average Value
Number
Average Value
LOANS ORIGINATED
46
$121,506
340
$143,154
105
$152,493
46
$37,002
20
$112,716
APPLICATIONS APPROVED, NOT ACCEPTED
6
$94,342
30
$145,273
28
$87,650
6
$20,452
6
$99,290
APPLICATIONS DENIED
8
$107,619
16
$146,337
51
$84,174
12
$15,998
0
$0
APPLICATIONS WITHDRAWN
2
$91,045
24
$131,699
28
$89,347
8
$44,038
4
$87,580
FILES CLOSED FOR INCOMPLETENESS
0
$0
4
$194,458
0
$0
0
$0
0
$0
Aggregated Statistics For Year 1999 (Based on 1 full tract)
A) FHA, FSA/RHS & VA Home Purchase Loans
B) Conventional Home Purchase Loans
C) Refinancings
D) Home Improvement Loans
F) Non-occupant Loans on < 5 Family Dwellings (A B C & D)
Detailed PMIC statistics for the following Tracts:0132.02
2002 - 2018 National Fire Incident Reporting System (NFIRS) incidents
Based on the data from the years 2002 - 2018 the average number of fires per year is 17. The highest number of reported fire incidents - 33 took place in 2003, and the least - 10 in 2010. The data has an increasing trend.
When looking into fire subcategories, the most incidents belonged to: Outside Fires (44.4%), and Mobile Property/Vehicle Fires (28.7%).
Fire incident types reported to NFIRS in Zip Code 99019


 Nearest zip codes: 99016, 99027, 99037, 99023, 83854, 99216.
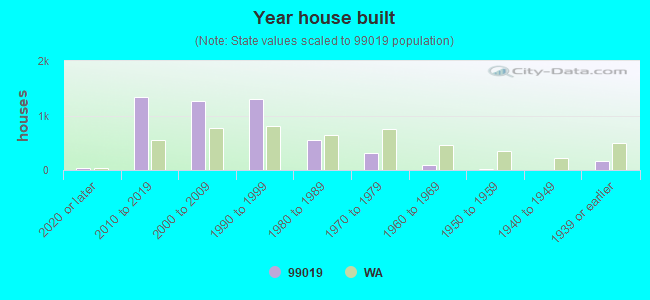


 Based on the data from the years 2002 - 2018 the average number of fires per year is 17. The highest number of reported fire incidents - 33 took place in 2003, and the least - 10 in 2010. The data has an increasing trend.
 When looking into fire subcategories, the most incidents belonged to: Outside Fires (44.4%), and Mobile Property/Vehicle Fires (28.7%).