Estimated zip code population in 2022: 7,279 Zip code population in 2010: 6,681 Zip code population in 2000: 9,863
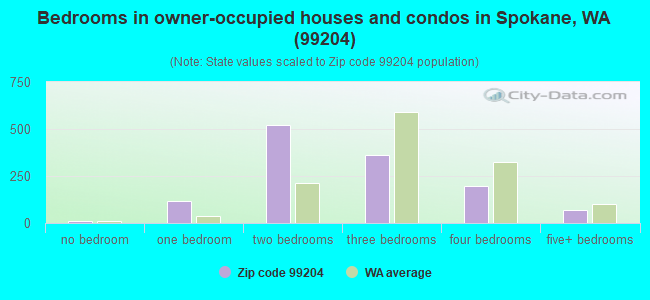
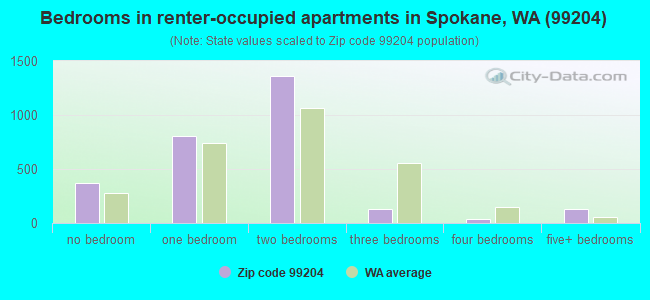
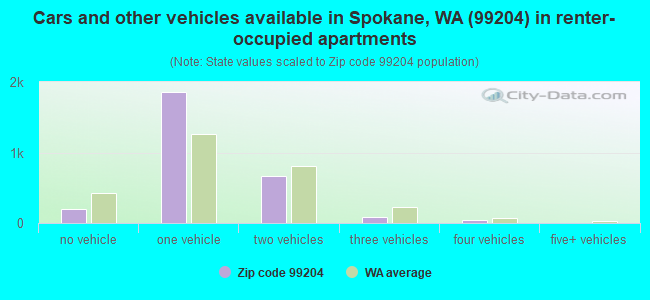
Houses and condos: 4,449 Renter-occupied apartments: 2,782
% of renters here:
69%
State:
36%
March 2022 cost of living index in zip code 99204: 97.0 (near average, U.S. average is 100)
Land area: 1.1 sq. mi. Water area: 0.0 sq. mi.
Population density: 6,456 people per square mile
(high).
OSM Map
General Map
Google Map
MSN Map
OSM Map
General Map
Google Map
MSN Map
OSM Map
General Map
Google Map
MSN Map
OSM Map
General Map
Google Map
MSN Map
Please wait while loading the map...
Real estate property taxes paid for housing units in 2022:
This zip code:
0.7% ($2,692)
Washington:
0.8% ($4,283)
Median real estate property taxes paid for housing units with mortgages in 2022: $2,976 (0.7%) Median real estate property taxes paid for housing units with no mortgage in 2022: $2,378 (0.8%)
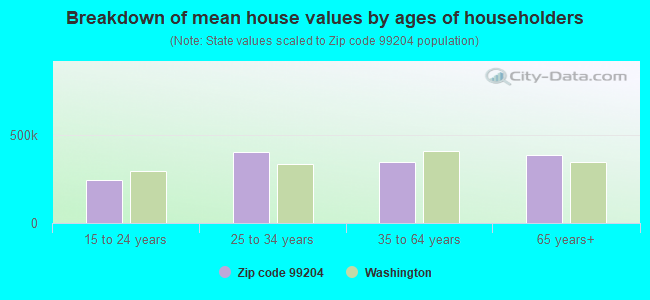
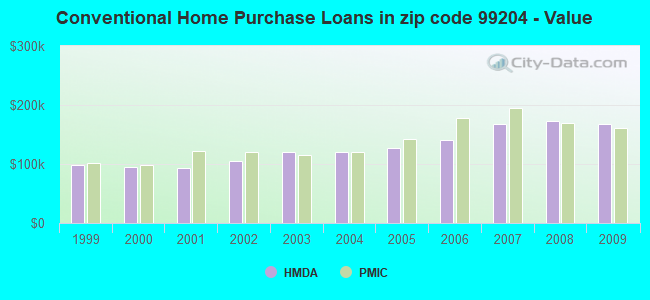
Estimated median house/condo value in 2022: $363,306
99204:
$363,306
Washington:
$569,500
According to our research of Washington and other state lists, there were 5 registered sex offenders living in 99204 zip code as of April 27, 2024. The ratio of all residents to sex offenders in zip code 99204 is 1,183 to 1. The ratio of registered sex offenders to all residents in this zip code is near the state average.
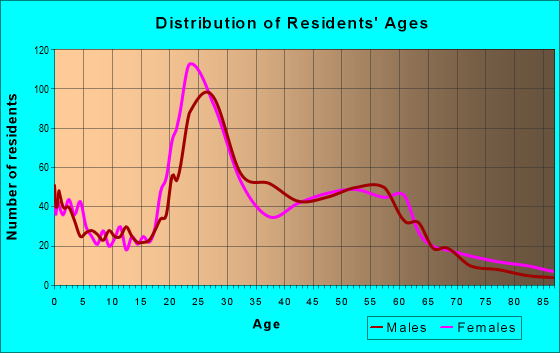
Median resident age:
This zip code:
35.2 years
Washington median age:
38.4 years
Average household size:
This zip code:
1.7 people
Washington:
2.5 people
Averages for the 2020 tax year for zip code 99204, filed in 2021:
Average Adjusted Gross Income (AGI) in 2020: $54,997 (Individual Income Tax Returns)
Here:
$54,997
State:
$99,264
Salary/wage: $46,149 (reported on 85.2% of returns)
Here:
$46,149
State:
$80,347
(% of AGI for various income ranges: 1281.8% for AGIs below $25k, 3607.7% for AGIs $25k-50k, 6675.0% for AGIs $50k-75k, 10203.6% for AGIs $75k-100k, 18112.0% for AGIs $100k-200k, 67935.0% for AGIs over 200k)
Taxable interest for individuals: $878 (reported on 28.8% of returns)
This zip code:
$878
Washington:
$2,077
(% of AGI for various income ranges: 14.5% for AGIs below $25k, 8.0% for AGIs $25k-50k, 27.8% for AGIs $50k-75k, 41.4% for AGIs $75k-100k, 106.7% for AGIs $100k-200k, 912.5% for AGIs over 200k)
Ordinary dividends: $5,226 (reported on 17.7% of returns)
Here:
$5,226
State:
$10,013
(% of AGI for various income ranges: 31.1% for AGIs below $25k, 28.2% for AGIs $25k-50k, 102.2% for AGIs $50k-75k, 232.9% for AGIs $75k-100k, 611.3% for AGIs $100k-200k, 2747.5% for AGIs over 200k)
Net capital gain/loss in AGI: +$12,538 (reported on 17.4% of returns)
Here:
+$12,538
State:
+$40,092
(% of AGI for various income ranges: 21.2% for AGIs below $25k, 38.7% for AGIs $25k-50k, 134.1% for AGIs $50k-75k, 241.4% for AGIs $75k-100k, 1030.0% for AGIs $100k-200k, 11880.0% for AGIs over 200k)
Profit/loss from business: +$13,364 (reported on 12.8% of returns)
Here:
+$13,364
State:
+$18,312
(% of AGI for various income ranges: 110.4% for AGIs below $25k, 81.8% for AGIs $25k-50k, 111.2% for AGIs $50k-75k, 498.6% for AGIs $75k-100k, 1182.7% for AGIs $100k-200k, 3352.5% for AGIs over 200k)
Taxable individual retirement arrangement distribution: $17,770 (reported on 5.7% of returns)
99204:
$17,770
Washington:
$24,221
(% of AGI for various income ranges: 27.6% for AGIs below $25k, 42.3% for AGIs $25k-50k, 120.3% for AGIs $50k-75k, 234.3% for AGIs $75k-100k, 1440.7% for AGIs $100k-200k)
Total itemized deductions: $30,350 (reported on 4.6% of returns)
Here:
$30,350
State:
$39,068
(% of AGI for various income ranges: 59.4% for AGIs below $25k, 350.6% for AGIs $50k-75k, 916.0% for AGIs $100k-200k, 4520.0% for AGIs over 200k)
Charity contributions: $11,308 (reported on 3.7% of returns)
Here:
$11,308
State:
$15,331
(% of AGI for various income ranges: 10.9% for AGIs below $25k, 86.6% for AGIs $50k-75k, 286.7% for AGIs $100k-200k, 1655.0% for AGIs over 200k)
Taxes paid: $6,500 (reported on 4.6% of returns)
99204:
$6,500
State:
$7,774
(% of AGI for various income ranges: 14.5% for AGIs below $25k, 30.0% for AGIs $50k-75k, 82.1% for AGIs $75k-100k, 194.7% for AGIs $100k-200k, 1005.0% for AGIs over 200k)
Earned income credit: $1,724 (reported on 14.0% of returns)
Here:
$1,724
State:
$2,020
(% of AGI for various income ranges: 56.3% for AGIs below $25k, 32.1% for AGIs $25k-50k)
Percentage of individuals using paid preparers for their 2020 taxes: 93.4%
Here:
93%
State:
93%
(% for various income ranges: 92.3% for AGIs below $25k, 95.2% for AGIs $25k-50k, 93.5% for AGIs $50k-75k, 90.9% for AGIs $75k-100k, 93.1% for AGIs $100k-200k, 92.3% for AGIs over 200k)
Averages for the 2012 tax year for zip code 99204, filed in 2013:
Average Adjusted Gross Income (AGI) in 2012: $46,558 (Individual Income Tax Returns)
Here:
$46,558
State:
$69,533
Salary/wage: $37,401 (reported on 86.6% of returns)
Here:
$37,401
State:
$57,267
(% of AGI for various income ranges: 83.8% for AGIs below $25k, 84.5% for AGIs $25k-50k, 76.0% for AGIs $50k-75k, 80.7% for AGIs $75k-100k, 69.1% for AGIs $100k-200k, 45.9% for AGIs over 200k)
Taxable interest for individuals: $1,584 (reported on 26.5% of returns)
This zip code:
$1,584
Washington:
$1,816
(% of AGI for various income ranges: 1.1% for AGIs below $25k, 1.0% for AGIs $25k-50k, 1.0% for AGIs $50k-75k, 1.1% for AGIs $75k-100k, 1.0% for AGIs $100k-200k, 0.6% for AGIs over 200k)
Ordinary dividends: $5,584 (reported on 15.7% of returns)
Here:
$5,584
State:
$8,163
(% of AGI for various income ranges: 2.3% for AGIs below $25k, 0.9% for AGIs $25k-50k, 2.3% for AGIs $50k-75k, 1.2% for AGIs $75k-100k, 2.8% for AGIs $100k-200k, 1.8% for AGIs over 200k)
Net capital gain/loss in AGI: +$5,593 (reported on 14.1% of returns)
Here:
+$5,593
State:
+$21,568
(% of AGI for various income ranges: 0.2% for AGIs $25k-50k, 0.5% for AGIs $50k-75k, 1.8% for AGIs $75k-100k, 3.3% for AGIs $100k-200k, 3.1% for AGIs over 200k)
Profit/loss from business: +$14,949 (reported on 13.1% of returns)
Here:
+$14,949
State:
+$16,521
(% of AGI for various income ranges: 4.5% for AGIs below $25k, 3.3% for AGIs $25k-50k, 2.8% for AGIs $50k-75k, 2.9% for AGIs $75k-100k, 6.4% for AGIs $100k-200k, 4.5% for AGIs over 200k)
Taxable individual retirement arrangement distribution: $14,438 (reported on 6.7% of returns)
99204:
$14,438
Washington:
$18,648
(% of AGI for various income ranges: 1.4% for AGIs below $25k, 1.4% for AGIs $25k-50k, 3.7% for AGIs $50k-75k, 2.5% for AGIs $75k-100k, 5.5% for AGIs $100k-200k)
Total itemized deductions: $20,384 (15% of AGI, reported on 17.6% of returns)
Here:
$20,384
State:
$23,872
Here:
15.1% of AGI
State:
18.2% of AGI
(% of AGI for various income ranges: 5.0% for AGIs below $25k, 5.6% for AGIs $25k-50k, 10.5% for AGIs $50k-75k, 10.5% for AGIs $75k-100k, 11.7% for AGIs $100k-200k, 6.0% for AGIs over 200k)
Charity contributions: $4,480 (reported on 14.4% of returns)
Here:
$4,480
State:
$4,465
(% of AGI for various income ranges: 0.5% for AGIs below $25k, 0.5% for AGIs $25k-50k, 1.2% for AGIs $50k-75k, 1.3% for AGIs $75k-100k, 2.9% for AGIs $100k-200k, 1.7% for AGIs over 200k)
Taxes paid: $5,502 (reported on 16.9% of returns)
99204:
$5,502
State:
$6,400
(% of AGI for various income ranges: 0.9% for AGIs below $25k, 1.1% for AGIs $25k-50k, 2.5% for AGIs $50k-75k, 2.4% for AGIs $75k-100k, 3.3% for AGIs $100k-200k, 2.0% for AGIs over 200k)
Earned income credit: $1,546 (reported on 19.5% of returns)
Here:
$1,546
State:
$2,073
(% of AGI for various income ranges: 3.8% for AGIs below $25k, 0.5% for AGIs $25k-50k)
Percentage of individuals using paid preparers for their 2012 taxes: 35.5%
Here:
35%
State:
43%
(% for various income ranges: 31.7% for AGIs below $25k, 28.2% for AGIs $25k-50k, 46.7% for AGIs $50k-75k, 47.1% for AGIs $75k-100k, 52.9% for AGIs $100k-200k, 85.7% for AGIs over 200k)
Averages for the 2004 tax year for zip code 99204, filed in 2005:
Average Adjusted Gross Income (AGI) in 2004: $33,691 (Individual Income Tax Returns)
Here:
$33,691
State:
$54,331
Salary/wage: $27,110 (reported on 87.4% of returns)
Here:
$27,110
State:
$45,761
(% of AGI for various income ranges: 111.3% for AGIs below $10k, 87.2% for AGIs $10k-25k, 83.4% for AGIs $25k-50k, 76.2% for AGIs $50k-75k, 74.2% for AGIs $75k-100k, 43.5% for AGIs over 100k)
Taxable interest for individuals: $1,813 (reported on 32.2% of returns)
This zip code:
$1,813
Washington:
$2,110
(% of AGI for various income ranges: 4.0% for AGIs below $10k, 1.2% for AGIs $10k-25k, 1.4% for AGIs $25k-50k, 1.8% for AGIs $50k-75k, 2.1% for AGIs $75k-100k, 2.0% for AGIs over 100k)
Taxable dividends: $4,122 (reported on 18.0% of returns)
Here:
$4,122
State:
$5,879
(% of AGI for various income ranges: 3.2% for AGIs below $10k, 1.2% for AGIs $10k-25k, 1.6% for AGIs $25k-50k, 1.8% for AGIs $50k-75k, 1.8% for AGIs $75k-100k, 3.4% for AGIs over 100k)
Net capital gain/loss: +$15,829 (reported on 16.6% of returns)
Here:
+$15,829
State:
+$15,835
(% of AGI for various income ranges: -1.2% for AGIs below $10k, -0.1% for AGIs $10k-25k, 0.9% for AGIs $25k-50k, 2.1% for AGIs $50k-75k, 5.1% for AGIs $75k-100k, 21.4% for AGIs over 100k)
Profit/loss from business: +$15,726 (reported on 10.9% of returns)
Here:
+$15,726
State:
+$13,994
(% of AGI for various income ranges: 6.1% for AGIs below $10k, 2.5% for AGIs $10k-25k, 3.7% for AGIs $25k-50k, 3.9% for AGIs $50k-75k, 3.5% for AGIs $75k-100k, 8.4% for AGIs over 100k)
IRA payment deduction: $2,693 (reported on 2.3% of returns)
99204:
$2,693
Washington:
$3,001
(% of AGI for various income ranges: 0.3% for AGIs $10k-25k, 0.3% for AGIs $25k-50k, 0.3% for AGIs $50k-75k, 0.1% for AGIs over 100k)
Self-employed pension: $17,833 (reported on 0.7% of returns)
Here:
$17,833
Washington:
$14,244
Total itemized deductions: $17,339 (20% of AGI, reported on 16.1% of returns)
Here:
$17,339
State:
$19,669
Here:
19.6% of AGI
State:
20.7% of AGI
(% of AGI for various income ranges: 4.1% for AGIs below $10k, 3.8% for AGIs $10k-25k, 6.9% for AGIs $25k-50k, 10.0% for AGIs $50k-75k, 13.2% for AGIs $75k-100k, 10.2% for AGIs over 100k)
Charity contributions deductions: $4,995 (5% of AGI, reported on 13.8% of returns)
Here:
$4,995
State:
$3,569
Here:
5.3% of AGI
State:
3.5% of AGI
(% of AGI for various income ranges: 0.3% for AGIs below $10k, 0.4% for AGIs $10k-25k, 1.1% for AGIs $25k-50k, 1.5% for AGIs $50k-75k, 2.4% for AGIs $75k-100k, 4.0% for AGIs over 100k)
Total tax: $5,365 (reported on 74.4% of returns)
99204:
$5,365
State:
$9,065
(% of AGI for various income ranges: 2.0% for AGIs below $10k, 4.9% for AGIs $10k-25k, 8.5% for AGIs $25k-50k, 10.4% for AGIs $50k-75k, 11.4% for AGIs $75k-100k, 20.0% for AGIs over 100k)
Earned income credit: $1,218 (reported on 17.0% of returns)
Here:
$1,218
State:
$1,607
Percentage of individuals using paid preparers for their 2004 taxes: 41.3%
Here:
41%
State:
49%
(% for various income ranges: 39.0% for AGIs below $10k, 37.9% for AGIs $10k-25k, 37.9% for AGIs $25k-50k, 50.0% for AGIs $50k-75k, 50.9% for AGIs $75k-100k, 76.5% for AGIs over 100k)
Likely homosexual households (counted as self-reported same-sex unmarried-partner households)
Lesbian couples: 0.4% of all households
Gay men: 0.6% of all households
Household received Food Stamps/SNAP in the past 12 months: 583 Household did not receive Food Stamps/SNAP in the past 12 months: 3,488
Women who had a birth in the past 12 months: 25 (26 now married, 0 unmarried) Women who did not have a birth in the past 12 months: 2,104 (450 now married, 1,668 unmarried)
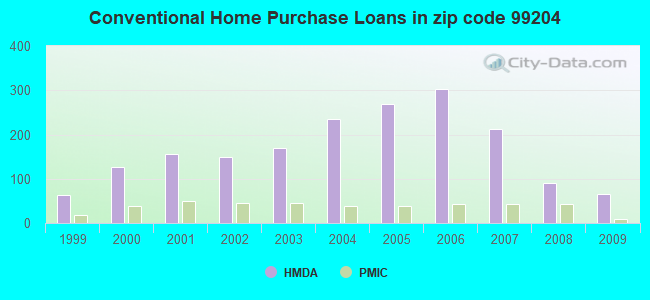
Housing units in zip code 99204 with a mortgage: 788 (129 second mortgage, 133 both second mortgage and home equity loan) Median monthly owner costs for units with a mortgage: $1,638 Median monthly owner costs for units without a mortgage: $488
Residents with income below the poverty level in 2022:
This zip code:
14.8%
Whole state:
10.0%
Residents with income below 50% of the poverty level in 2022:
This zip code:
6.9%
Whole state:
4.6%
Median number of rooms in houses and condos:
Here:
5.6
State:
6.5
Median number of rooms in apartments:
Here:
3.7
State:
3.9
Notable locations in this zip code not listed on our city pages
214 married couples with children.
506 single-parent households (96 men, 410 women).
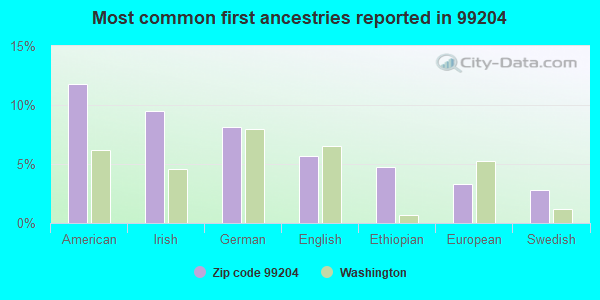
90.7% of residents of 99204 zip code speak English at home.
5.1% of residents speak Spanish at home (81% very well, 19% well).
1.0% of residents speak other Indo-European language at home (94% very well, 6% not well).
2.5% of residents speak Asian or Pacific Island language at home (46% very well, 33% well, 22% not well).
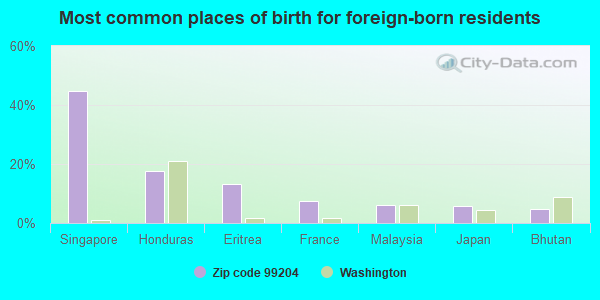
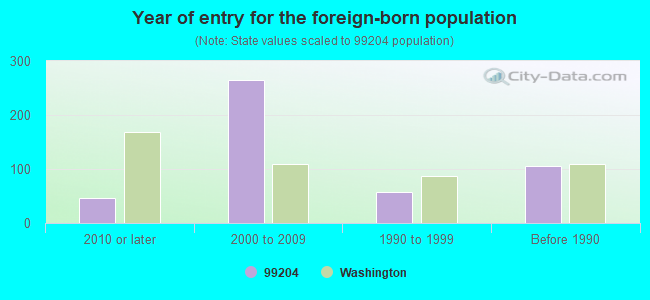
Foreign born population: 412 (5.7%) (59.7% of them are naturalized citizens)
Facilities with environmental interests located in this zip code:
CHEVRON USA INC SS 95056 (1821 W SUNSET BLVD in SPOKANE, WA)
(Resource Conservation and Recovery Act (tracking hazardous waste)) STATE MASTER (Washington State Department of Ecology's Facility/Site identification system) - TOXICS-5181, LEAKING STORAGE TANK, UNDERGROUND STORAGE TANK PROGRAM, HAZWASTE-WAD988489779, EPCRA, TOXICS-EA0022, VOLUNTARY CLEAN UP PROGRAM Business SIC classification: GASOLINE SERVICE STATIONS Organizations: CHEVRON PRODUCTS CO (CONTACT/ HAZARDOUS WASTE)
Alternative names: GO SPOT GO
CHEVRON USA INC SS 90466 (1005 W 3RD AVE in SPOKANE, WA)
(Resource Conservation and Recovery Act (tracking hazardous waste)) STATE MASTER (Washington State Department of Ecology's Facility/Site identification system) - TOXICS-5056, LEAKING STORAGE TANK, UNDERGROUND STORAGE TANK PROGRAM, HAZWASTE-WAD988496204, EPCRA Business SIC classification: GASOLINE SERVICE STATIONS; NONCLASSIFIABLE ESTABLISHMENTS Organizations: CHEVRON PRODUCTS CO (CONTACT/ HAZARDOUS WASTE)
, FRANK THOMPSON (CONTACT/OWNER)
Alternative names: FRANK A THOMPSONS CHEVRON SERVICE CENTER
AT&T CORPORATION (501 WEST 2ND AVENUE in SPOKANE, WA)
(Resource Conservation and Recovery Act (tracking hazardous waste)) STATE MASTER (Washington State Department of Ecology's Facility/Site identification system) - HAZWASTE-WAT540010691, HAZARDOUS WASTE PROGRAM, EPCRA Business SIC classification: TELEPHONE COMMUNICATIONS, EXCEPT RADIOTELEPHONE Organizations: MAY VICHITKULWONGSA (CONTACT/OPERATOR)
Alternative names: AT&T CORP 2ND, AT&T CORP 2ND
CENTRAL PRE MIX CONCRETE FT WRIGHT (508 N GOVERNMENT WAY in SPOKANE, WA)
(Resource Conservation and Recovery Act (tracking hazardous waste)) STATE MASTER (Washington State Department of Ecology's Facility/Site identification system) - SWFAP-, REFUSE DISPOSAL, HAZWASTE-WAD988522876, EPCRA, WATQUAL-WAG507011, National Pollutant Discharge Elimination System Permit Business SIC classification: CONSTRUCTION SAND AND GRAVEL; READY-MIXED CONCRETE; REFUSE SYSTEMS Organizations: MIKE DELANEY (CONTACT/OPERATOR)
, CPM DEVELOPMENT CORP (CONTACT/OWNER)
Alternative names: Central Pre Mix
CENTRAL PRE MIX CONCRETE MOE SITE (N 101 HAYFORD RD in SPOKANE, WA)
National Pollutant Discharge Elimination System NON-MAJOR (Tracking pollutant discharge elimination systems) - permit STATE MASTER (Washington State Department of Ecology's Facility/Site identification system) - WATQUAL-WAG507107, National Pollutant Discharge Elimination System Permit Business SIC classification: CONSTRUCTION SAND AND GRAVEL; READY-MIXED CONCRETE Organizations: CENTRAL PRE-MIX CONCRETE (CONTACT/OPERATOR)
ABX AIR AIRBORNE EXPRESS GEG (8412 W AVIATION AVE in SPOKANE, WA)
National Pollutant Discharge Elimination System NON-MAJOR (Tracking pollutant discharge elimination systems) - permit STATE MASTER (Washington State Department of Ecology's Facility/Site identification system) - WATQUAL-, NPDES STORMWATER PERMIT Business SIC classification: AIR COURIER SERVICES Organizations: ABX AIR, INC (CONTACT/OWNER)
Alternative names: ABX AIR INC
CITY SERVICE UST 5115 (404 S MAPLE ST in SPOKANE, WA)
(Resource Conservation and Recovery Act (tracking hazardous waste)) STATE MASTER (Washington State Department of Ecology's Facility/Site identification system) - TOXICS-, UNDERGROUND STORAGE TANK PROGRAM, HAZWASTE-WAD988503009, EPCRA, TOXICS-, FORMAL ENFORCEMENT ACTION Business SIC classification: GASOLINE SERVICE STATIONS Organizations: EDWIN ANDERSON (CONTACT/OWNER)
Alternative names: ED ANDERSON CHEVRON
ALT SCHOOL #2 SACRED HEART HOSP (WEST 101 8TH AVENUE in SPOKANE, WA)
(National Center for Education Statistics) - STATE ID-4286 Organizations: SPOKANE SCH DIST 81 (SCHOOL DISTRICT)
CDC SERVICES (311 S CEDAR ST in SPOKANE, WA)
(Resource Conservation and Recovery Act (tracking hazardous waste)) Organizations: STEVEN SCHRODER (CONTACT/OPERATOR)
, DAE UH (CONTACT/OWNER)
COBRA ROOFING SERVICES (3212 S BEAGAN ST in SPOKANE, WA)
(Resource Conservation and Recovery Act (tracking hazardous waste)) Organizations: SPOKANE AIRPORT BUSINESS PARK (CONTACT/OWNER)
BORNING CORP (S 161 ADAMS in SPOKANE, WA)
(Resource Conservation and Recovery Act (tracking hazardous waste)) Business NAICS classification: ALL OTHER MISCELLANEOUS FABRICATED METAL PRODUCT MANUFACTURING.
CLEAN CARE CORP (1815 S LEWIS ST in SPOKANE, WA)
COMPLIANCE ACTIVITY (Tracking inspections of insecticide, fungicide, and rodenticide, and toxic substances)
Housing units lacking complete kitchen facilities: 0.7%
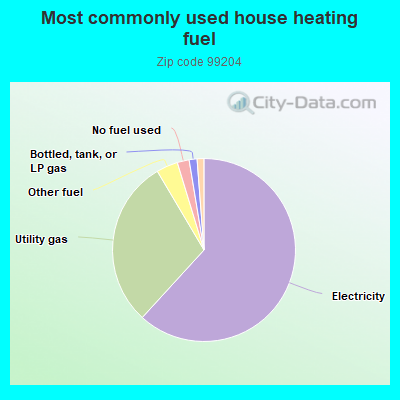
61.8%Electricity
29.7%Utility gas
3.8%Other fuel
2.1%No fuel used
1.4%Bottled, tank, or LP gas
1.2%Fuel oil, kerosene, etc.
Population in 1990: 24,611.
Place of birth for U.S.-born residents:
This state: 3,483
Northeast: 328
Midwest: 508
South: 652
West: 1,780
33% of the 99204 zip code residents lived in the same house 5 years ago. Out of people who lived in different houses, 58% lived in this county. Out of people who lived in different counties, 50% lived in Washington.
75% of the 99204 zip code residents lived in the same house 1 year ago. Out of people who lived in different houses, 51% moved from this county. Out of people who lived in different houses, 28% moved from different county within same state. Out of people who lived in different houses, 15% moved from different state. Out of people who lived in different houses, 2% moved from abroad.
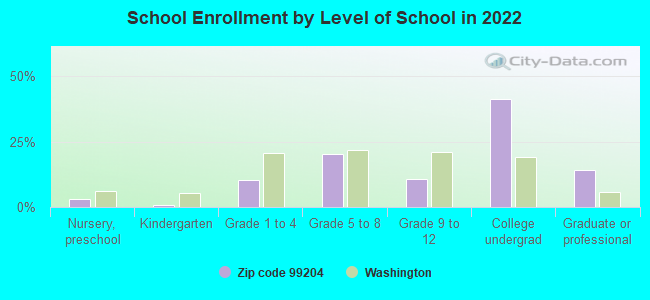
Private vs. public school enrollment:
Students in private schools in grades 1 to 8 (elementary and middle school): 52
Here:
10.9%
Washington:
12.4%
Students in private schools in grades 9 to 12 (high school): 2
Here:
1.4%
Washington:
9.2%
Students in private undergraduate colleges: 99
Here:
15.1%
Washington:
16.5%
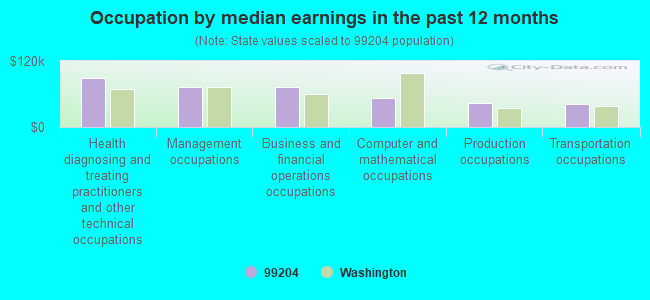
Occupation by median earnings in the past 12 months ($)
88,524Health diagnosing and treating practitioners and other technical occupations
72,512Management occupations
72,110Business and financial operations occupations
53,050Computer and mathematical occupations
42,883Production occupations
42,501Transportation occupations
Companies with federal contracts located in this zip code:
SPOKANE INDUSTRIES, INC (SPOKANE INDUS PARK BLDG 4 in SPOKANE, WA; small business) : $1,106,044 in 3 contractsfrom 1999 to 2000
$512,772 with Air Force for Trailers. Signed on 1999-12-03. Completion date: 1999-07-31.
$512,772, same as above.Signed on 2000-03-22. Completion date: 2000-12-31.
$80,500, same as above.Signed on 2000-08-10. Completion date: 2000-11-30.
CULINARIA (1321 W 9 TH AVE in SPOKANE, WA; small business) : $5,651 in 2 contractsin 2005
$3,080 with Navy for Food Services. Taking place in TX. Signed on 2005-06-28. Completion date: 2005-06-11.
$2,571 with Navy for Food Services. Signed on 2005-09-29. Completion date: 2005-09-22.
Top industries in this zip code by the number of employees in 2005:
Health Care and Social Assistance: General Medical and Surgical Hospitals (over 1000 employees: 2 establishments)
Health Care and Social Assistance: Offices of Physicians (except Mental Health Specialists) (100-249: 4, 50-99: 4, 20-49: 19, 10-19: 15, 5-9: 22, 1-4: 28)
Health Care and Social Assistance: Medical Laboratories (500-999: 1)
Management of Companies and Enterprises: Corporate, Subsidiary, and Regional Managing Offices (250-499: 1, 5-9: 1, 1-4: 1)
Health Care and Social Assistance: Nursing Care Facilities (100-249: 2, 20-49: 1, 1-4: 1)
2002 - 2018 National Fire Incident Reporting System (NFIRS) incidents
According to the data from the years 2002 - 2018 the average number of fire incidents per year is 59. The highest number of fires - 102 took place in 2011, and the least - 5 in 2002. The data has a rising trend.
When looking into fire subcategories, the most reports belonged to: Outside Fires (45.0%), and Structure Fires (35.7%).
Fire incident types reported to NFIRS in Zip Code 99204


 Nearest zip codes: 99201, 99203, 99202, 99205, 99207, 99224.
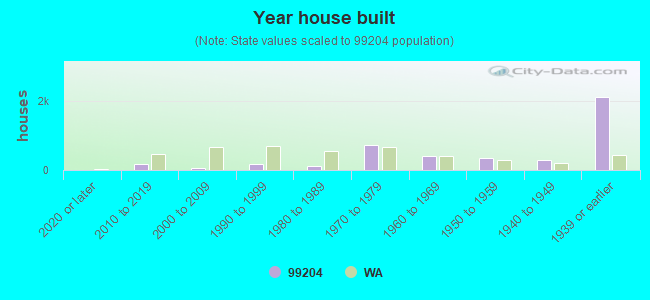


 According to the data from the years 2002 - 2018 the average number of fire incidents per year is 59. The highest number of fires - 102 took place in 2011, and the least - 5 in 2002. The data has a rising trend.
 When looking into fire subcategories, the most reports belonged to: Outside Fires (45.0%), and Structure Fires (35.7%).