Estimated zip code population in 2022: 22,262
Zip code population in 2010: 20,192
Zip code population in 2000: 21,010
Houses and condos: 9,880
Renter-occupied apartments: 2,287
% of renters here:
24%State:
36%
March 2022 cost of living index in zip code 99203: 95.4
(near average, U.S. average is 100)
Land area: 4.7
sq. mi.
Water area: 0.0
sq. mi.
Population density: 4,760 people per square mile (average).
OSM Map
General Map
Google Map
MSN Map
OSM Map
General Map
Google Map
MSN Map
OSM Map
General Map
Google Map
MSN Map
OSM Map
General Map
Google Map
MSN Map
Please wait while loading the map...
Real estate property taxes paid for housing units in 2022:
This zip code:
0.8% ($3,744)Washington:
0.8% ($4,283)
Median real estate property taxes paid for housing units with mortgages in 2022: $3,663 (0.7%)
Median real estate property taxes paid for housing units with no mortgage in 2022: $3,894 (0.8%)
Profiles of local businesses
Business Search - 14 Million verified businesses
Males: 10,320 Females: 11,939
For population 25 years and over in 99203:
High school or higher: 100.0%Bachelor's degree or higher: 61.7%Graduate or professional degree: 30.1%Unemployed: 3.9%Mean travel time to work (commute): 18.1 minutes
For population 15 years and over in 99203:
Never married: 26.4%Now married: 55.3%Separated: 0.7%Widowed: 5.8%Divorced: 11.8%
Zip code 99203 compared to state average:
Black race population percentage below state average. Hispanic race population percentage below state average. Median age above state average. Foreign-born population percentage significantly below state average. Renting percentage below state average. Length of stay since moving in significantly above state average. Number of rooms per house above state average. House age significantly above state average. Percentage of population with a bachelor's degree or higher above state average. 19,313 86.8% White 1,319 5.9% Hispanic or Latino 857 3.9% Two or more races 368 1.7% Asian 305 1.4% Black 66 0.3% American Indian 25 0.1% Some other race 5 0.02% Native Hawaiian and Other
Data:
Median household income ($)
Median household income (% change since 2000)
Household income diversity
Ratio of average income to average house value (%)
Ratio of average income to average rent
Median household income ($) - White
Median household income ($) - Black or African American
Median household income ($) - Asian
Median household income ($) - Hispanic or Latino
Median household income ($) - American Indian and Alaska Native
Median household income ($) - Multirace
Median household income ($) - Other Race
Median household income for houses/condos with a mortgage ($)
Median household income for apartments without a mortgage ($)
Races - White alone (%)
Races - White alone (% change since 2000)
Races - Black alone (%)
Races - Black alone (% change since 2000)
Races - American Indian alone (%)
Races - American Indian alone (% change since 2000)
Races - Asian alone (%)
Races - Asian alone (% change since 2000)
Races - Hispanic (%)
Races - Hispanic (% change since 2000)
Races - Native Hawaiian and Other Pacific Islander alone (%)
Races - Native Hawaiian and Other Pacific Islander alone (% change since 2000)
Races - Two or more races (%)
Races - Two or more races (% change since 2000)
Races - Other race alone (%)
Races - Other race alone (% change since 2000)
Racial diversity
Unemployment (%)
Unemployment (% change since 2000)
Unemployment (%) - White
Unemployment (%) - Black or African American
Unemployment (%) - Asian
Unemployment (%) - Hispanic or Latino
Unemployment (%) - American Indian and Alaska Native
Unemployment (%) - Multirace
Unemployment (%) - Other Race
Population density (people per square mile)
Population - Males (%)
Population - Females (%)
Population - Males (%) - White
Population - Males (%) - Black or African American
Population - Males (%) - Asian
Population - Males (%) - Hispanic or Latino
Population - Males (%) - American Indian and Alaska Native
Population - Males (%) - Multirace
Population - Males (%) - Other Race
Population - Females (%) - White
Population - Females (%) - Black or African American
Population - Females (%) - Asian
Population - Females (%) - Hispanic or Latino
Population - Females (%) - American Indian and Alaska Native
Population - Females (%) - Multirace
Population - Females (%) - Other Race
Coronavirus confirmed cases (Apr 27, 2024)
Deaths caused by coronavirus (Apr 27, 2024)
Coronavirus confirmed cases (per 100k population) (Apr 27, 2024)
Deaths caused by coronavirus (per 100k population) (Apr 27, 2024)
Daily increase in number of cases (Apr 27, 2024)
Weekly increase in number of cases (Apr 27, 2024)
Cases doubled (in days) (Apr 27, 2024)
Hospitalized patients (Apr 18, 2022)
Negative test results (Apr 18, 2022)
Total test results (Apr 18, 2022)
COVID Vaccine doses distributed (per 100k population) (Sep 19, 2023)
COVID Vaccine doses administered (per 100k population) (Sep 19, 2023)
COVID Vaccine doses distributed (Sep 19, 2023)
COVID Vaccine doses administered (Sep 19, 2023)
Likely homosexual households (%)
Likely homosexual households (% change since 2000)
Likely homosexual households - Lesbian couples (%)
Likely homosexual households - Lesbian couples (% change since 2000)
Likely homosexual households - Gay men (%)
Likely homosexual households - Gay men (% change since 2000)
Cost of living index
Median gross rent ($)
Median contract rent ($)
Median monthly housing costs ($)
Median house or condo value ($)
Median house or condo value ($ change since 2000)
Mean house or condo value by units in structure - 1, detached ($)
Mean house or condo value by units in structure - 1, attached ($)
Mean house or condo value by units in structure - 2 ($)
Mean house or condo value by units in structure by units in structure - 3 or 4 ($)
Mean house or condo value by units in structure - 5 or more ($)
Mean house or condo value by units in structure - Boat, RV, van, etc. ($)
Mean house or condo value by units in structure - Mobile home ($)
Median house or condo value ($) - White
Median house or condo value ($) - Black or African American
Median house or condo value ($) - Asian
Median house or condo value ($) - Hispanic or Latino
Median house or condo value ($) - American Indian and Alaska Native
Median house or condo value ($) - Multirace
Median house or condo value ($) - Other Race
Median resident age
Resident age diversity
Median resident age - Males
Median resident age - Females
Median resident age - White
Median resident age - Black or African American
Median resident age - Asian
Median resident age - Hispanic or Latino
Median resident age - American Indian and Alaska Native
Median resident age - Multirace
Median resident age - Other Race
Median resident age - Males - White
Median resident age - Males - Black or African American
Median resident age - Males - Asian
Median resident age - Males - Hispanic or Latino
Median resident age - Males - American Indian and Alaska Native
Median resident age - Males - Multirace
Median resident age - Males - Other Race
Median resident age - Females - White
Median resident age - Females - Black or African American
Median resident age - Females - Asian
Median resident age - Females - Hispanic or Latino
Median resident age - Females - American Indian and Alaska Native
Median resident age - Females - Multirace
Median resident age - Females - Other Race
Commute - mean travel time to work (minutes)
Travel time to work - Less than 5 minutes (%)
Travel time to work - Less than 5 minutes (% change since 2000)
Travel time to work - 5 to 9 minutes (%)
Travel time to work - 5 to 9 minutes (% change since 2000)
Travel time to work - 10 to 19 minutes (%)
Travel time to work - 10 to 19 minutes (% change since 2000)
Travel time to work - 20 to 29 minutes (%)
Travel time to work - 20 to 29 minutes (% change since 2000)
Travel time to work - 30 to 39 minutes (%)
Travel time to work - 30 to 39 minutes (% change since 2000)
Travel time to work - 40 to 59 minutes (%)
Travel time to work - 40 to 59 minutes (% change since 2000)
Travel time to work - 60 to 89 minutes (%)
Travel time to work - 60 to 89 minutes (% change since 2000)
Travel time to work - 90 or more minutes (%)
Travel time to work - 90 or more minutes (% change since 2000)
Marital status - Never married (%)
Marital status - Now married (%)
Marital status - Separated (%)
Marital status - Widowed (%)
Marital status - Divorced (%)
Median family income ($)
Median family income (% change since 2000)
Median non-family income ($)
Median non-family income (% change since 2000)
Median per capita income ($)
Median per capita income (% change since 2000)
Median family income ($) - White
Median family income ($) - Black or African American
Median family income ($) - Asian
Median family income ($) - Hispanic or Latino
Median family income ($) - American Indian and Alaska Native
Median family income ($) - Multirace
Median family income ($) - Other Race
Median year house/condo built
Median year apartment built
Year house built - Built 2005 or later (%)
Year house built - Built 2000 to 2004 (%)
Year house built - Built 1990 to 1999 (%)
Year house built - Built 1980 to 1989 (%)
Year house built - Built 1970 to 1979 (%)
Year house built - Built 1960 to 1969 (%)
Year house built - Built 1950 to 1959 (%)
Year house built - Built 1940 to 1949 (%)
Year house built - Built 1939 or earlier (%)
Average household size
Household density (households per square mile)
Average household size - White
Average household size - Black or African American
Average household size - Asian
Average household size - Hispanic or Latino
Average household size - American Indian and Alaska Native
Average household size - Multirace
Average household size - Other Race
Occupied housing units (%)
Vacant housing units (%)
Owner occupied housing units (%)
Renter occupied housing units (%)
Vacancy status - For rent (%)
Vacancy status - For sale only (%)
Vacancy status - Rented or sold, not occupied (%)
Vacancy status - For seasonal, recreational, or occasional use (%)
Vacancy status - For migrant workers (%)
Vacancy status - Other vacant (%)
Residents with income below the poverty level (%)
Residents with income below 50% of the poverty level (%)
Children below poverty level (%)
Poor families by family type - Married-couple family (%)
Poor families by family type - Male, no wife present (%)
Poor families by family type - Female, no husband present (%)
Poverty status for native-born residents (%)
Poverty status for foreign-born residents (%)
Poverty among high school graduates not in families (%)
Poverty among people who did not graduate high school not in families (%)
Residents with income below the poverty level (%) - White
Residents with income below the poverty level (%) - Black or African American
Residents with income below the poverty level (%) - Asian
Residents with income below the poverty level (%) - Hispanic or Latino
Residents with income below the poverty level (%) - American Indian and Alaska Native
Residents with income below the poverty level (%) - Multirace
Residents with income below the poverty level (%) - Other Race
Air pollution - Air Quality Index (AQI)
Air pollution - CO
Air pollution - NO2
Air pollution - SO2
Air pollution - Ozone
Air pollution - PM10
Air pollution - PM25
Air pollution - Pb
Crime - Murders per 100,000 population
Crime - Rapes per 100,000 population
Crime - Robberies per 100,000 population
Crime - Assaults per 100,000 population
Crime - Burglaries per 100,000 population
Crime - Thefts per 100,000 population
Crime - Auto thefts per 100,000 population
Crime - Arson per 100,000 population
Crime - City-data.com crime index
Crime - Violent crime index
Crime - Property crime index
Crime - Murders per 100,000 population (5 year average)
Crime - Rapes per 100,000 population (5 year average)
Crime - Robberies per 100,000 population (5 year average)
Crime - Assaults per 100,000 population (5 year average)
Crime - Burglaries per 100,000 population (5 year average)
Crime - Thefts per 100,000 population (5 year average)
Crime - Auto thefts per 100,000 population (5 year average)
Crime - Arson per 100,000 population (5 year average)
Crime - City-data.com crime index (5 year average)
Crime - Violent crime index (5 year average)
Crime - Property crime index (5 year average)
1996 Presidential Elections Results (%) - Democratic Party (Clinton)
1996 Presidential Elections Results (%) - Republican Party (Dole)
1996 Presidential Elections Results (%) - Other
2000 Presidential Elections Results (%) - Democratic Party (Gore)
2000 Presidential Elections Results (%) - Republican Party (Bush)
2000 Presidential Elections Results (%) - Other
2004 Presidential Elections Results (%) - Democratic Party (Kerry)
2004 Presidential Elections Results (%) - Republican Party (Bush)
2004 Presidential Elections Results (%) - Other
2008 Presidential Elections Results (%) - Democratic Party (Obama)
2008 Presidential Elections Results (%) - Republican Party (McCain)
2008 Presidential Elections Results (%) - Other
2012 Presidential Elections Results (%) - Democratic Party (Obama)
2012 Presidential Elections Results (%) - Republican Party (Romney)
2012 Presidential Elections Results (%) - Other
2016 Presidential Elections Results (%) - Democratic Party (Clinton)
2016 Presidential Elections Results (%) - Republican Party (Trump)
2016 Presidential Elections Results (%) - Other
2020 Presidential Elections Results (%) - Democratic Party (Biden)
2020 Presidential Elections Results (%) - Republican Party (Trump)
2020 Presidential Elections Results (%) - Other
Ancestries Reported - Arab (%)
Ancestries Reported - Czech (%)
Ancestries Reported - Danish (%)
Ancestries Reported - Dutch (%)
Ancestries Reported - English (%)
Ancestries Reported - French (%)
Ancestries Reported - French Canadian (%)
Ancestries Reported - German (%)
Ancestries Reported - Greek (%)
Ancestries Reported - Hungarian (%)
Ancestries Reported - Irish (%)
Ancestries Reported - Italian (%)
Ancestries Reported - Lithuanian (%)
Ancestries Reported - Norwegian (%)
Ancestries Reported - Polish (%)
Ancestries Reported - Portuguese (%)
Ancestries Reported - Russian (%)
Ancestries Reported - Scotch-Irish (%)
Ancestries Reported - Scottish (%)
Ancestries Reported - Slovak (%)
Ancestries Reported - Subsaharan African (%)
Ancestries Reported - Swedish (%)
Ancestries Reported - Swiss (%)
Ancestries Reported - Ukrainian (%)
Ancestries Reported - United States (%)
Ancestries Reported - Welsh (%)
Ancestries Reported - West Indian (%)
Ancestries Reported - Other (%)
Educational Attainment - No schooling completed (%)
Educational Attainment - Less than high school (%)
Educational Attainment - High school or equivalent (%)
Educational Attainment - Less than 1 year of college (%)
Educational Attainment - 1 or more years of college (%)
Educational Attainment - Associate degree (%)
Educational Attainment - Bachelor's degree (%)
Educational Attainment - Master's degree (%)
Educational Attainment - Professional school degree (%)
Educational Attainment - Doctorate degree (%)
School Enrollment - Nursery, preschool (%)
School Enrollment - Kindergarten (%)
School Enrollment - Grade 1 to 4 (%)
School Enrollment - Grade 5 to 8 (%)
School Enrollment - Grade 9 to 12 (%)
School Enrollment - College undergrad (%)
School Enrollment - Graduate or professional (%)
School Enrollment - Not enrolled in school (%)
School enrollment - Public schools (%)
School enrollment - Private schools (%)
School enrollment - Not enrolled (%)
Median number of rooms in houses and condos
Median number of rooms in apartments
Housing units lacking complete plumbing facilities (%)
Housing units lacking complete kitchen facilities (%)
Density of houses
Urban houses (%)
Rural houses (%)
Households with people 60 years and over (%)
Households with people 65 years and over (%)
Households with people 75 years and over (%)
Households with one or more nonrelatives (%)
Households with no nonrelatives (%)
Population in households (%)
Family households (%)
Nonfamily households (%)
Population in families (%)
Family households with own children (%)
Median number of bedrooms in owner occupied houses
Mean number of bedrooms in owner occupied houses
Median number of bedrooms in renter occupied houses
Mean number of bedrooms in renter occupied houses
Median number of vehichles in owner occupied houses
Mean number of vehichles in owner occupied houses
Median number of vehichles in renter occupied houses
Mean number of vehichles in renter occupied houses
Mortgage status - with mortgage (%)
Mortgage status - with second mortgage (%)
Mortgage status - with home equity loan (%)
Mortgage status - with both second mortgage and home equity loan (%)
Mortgage status - without a mortgage (%)
Average family size
Average family size - White
Average family size - Black or African American
Average family size - Asian
Average family size - Hispanic or Latino
Average family size - American Indian and Alaska Native
Average family size - Multirace
Average family size - Other Race
Geographical mobility - Same house 1 year ago (%)
Geographical mobility - Moved within same county (%)
Geographical mobility - Moved from different county within same state (%)
Geographical mobility - Moved from different state (%)
Geographical mobility - Moved from abroad (%)
Place of birth - Born in state of residence (%)
Place of birth - Born in other state (%)
Place of birth - Native, outside of US (%)
Place of birth - Foreign born (%)
Housing units in structures - 1, detached (%)
Housing units in structures - 1, attached (%)
Housing units in structures - 2 (%)
Housing units in structures - 3 or 4 (%)
Housing units in structures - 5 to 9 (%)
Housing units in structures - 10 to 19 (%)
Housing units in structures - 20 to 49 (%)
Housing units in structures - 50 or more (%)
Housing units in structures - Mobile home (%)
Housing units in structures - Boat, RV, van, etc. (%)
House/condo owner moved in on average (years ago)
Renter moved in on average (years ago)
Year householder moved into unit - Moved in 1999 to March 2000 (%)
Year householder moved into unit - Moved in 1995 to 1998 (%)
Year householder moved into unit - Moved in 1990 to 1994 (%)
Year householder moved into unit - Moved in 1980 to 1989 (%)
Year householder moved into unit - Moved in 1970 to 1979 (%)
Year householder moved into unit - Moved in 1969 or earlier (%)
Means of transportation to work - Drove car alone (%)
Means of transportation to work - Carpooled (%)
Means of transportation to work - Public transportation (%)
Means of transportation to work - Bus or trolley bus (%)
Means of transportation to work - Streetcar or trolley car (%)
Means of transportation to work - Subway or elevated (%)
Means of transportation to work - Railroad (%)
Means of transportation to work - Ferryboat (%)
Means of transportation to work - Taxicab (%)
Means of transportation to work - Motorcycle (%)
Means of transportation to work - Bicycle (%)
Means of transportation to work - Walked (%)
Means of transportation to work - Other means (%)
Working at home (%)
Industry diversity
Most Common Industries - Agriculture, forestry, fishing and hunting, and mining (%)
Most Common Industries - Agriculture, forestry, fishing and hunting (%)
Most Common Industries - Mining, quarrying, and oil and gas extraction (%)
Most Common Industries - Construction (%)
Most Common Industries - Manufacturing (%)
Most Common Industries - Wholesale trade (%)
Most Common Industries - Retail trade (%)
Most Common Industries - Transportation and warehousing, and utilities (%)
Most Common Industries - Transportation and warehousing (%)
Most Common Industries - Utilities (%)
Most Common Industries - Information (%)
Most Common Industries - Finance and insurance, and real estate and rental and leasing (%)
Most Common Industries - Finance and insurance (%)
Most Common Industries - Real estate and rental and leasing (%)
Most Common Industries - Professional, scientific, and management, and administrative and waste management services (%)
Most Common Industries - Professional, scientific, and technical services (%)
Most Common Industries - Management of companies and enterprises (%)
Most Common Industries - Administrative and support and waste management services (%)
Most Common Industries - Educational services, and health care and social assistance (%)
Most Common Industries - Educational services (%)
Most Common Industries - Health care and social assistance (%)
Most Common Industries - Arts, entertainment, and recreation, and accommodation and food services (%)
Most Common Industries - Arts, entertainment, and recreation (%)
Most Common Industries - Accommodation and food services (%)
Most Common Industries - Other services, except public administration (%)
Most Common Industries - Public administration (%)
Occupation diversity
Most Common Occupations - Management, business, science, and arts occupations (%)
Most Common Occupations - Management, business, and financial occupations (%)
Most Common Occupations - Management occupations (%)
Most Common Occupations - Business and financial operations occupations (%)
Most Common Occupations - Computer, engineering, and science occupations (%)
Most Common Occupations - Computer and mathematical occupations (%)
Most Common Occupations - Architecture and engineering occupations (%)
Most Common Occupations - Life, physical, and social science occupations (%)
Most Common Occupations - Education, legal, community service, arts, and media occupations (%)
Most Common Occupations - Community and social service occupations (%)
Most Common Occupations - Legal occupations (%)
Most Common Occupations - Education, training, and library occupations (%)
Most Common Occupations - Arts, design, entertainment, sports, and media occupations (%)
Most Common Occupations - Healthcare practitioners and technical occupations (%)
Most Common Occupations - Health diagnosing and treating practitioners and other technical occupations (%)
Most Common Occupations - Health technologists and technicians (%)
Most Common Occupations - Service occupations (%)
Most Common Occupations - Healthcare support occupations (%)
Most Common Occupations - Protective service occupations (%)
Most Common Occupations - Fire fighting and prevention, and other protective service workers including supervisors (%)
Most Common Occupations - Law enforcement workers including supervisors (%)
Most Common Occupations - Food preparation and serving related occupations (%)
Most Common Occupations - Building and grounds cleaning and maintenance occupations (%)
Most Common Occupations - Personal care and service occupations (%)
Most Common Occupations - Sales and office occupations (%)
Most Common Occupations - Sales and related occupations (%)
Most Common Occupations - Office and administrative support occupations (%)
Most Common Occupations - Natural resources, construction, and maintenance occupations (%)
Most Common Occupations - Farming, fishing, and forestry occupations (%)
Most Common Occupations - Construction and extraction occupations (%)
Most Common Occupations - Installation, maintenance, and repair occupations (%)
Most Common Occupations - Production, transportation, and material moving occupations (%)
Most Common Occupations - Production occupations (%)
Most Common Occupations - Transportation occupations (%)
Most Common Occupations - Material moving occupations (%)
People in Group quarters - Institutionalized population (%)
People in Group quarters - Correctional institutions (%)
People in Group quarters - Federal prisons and detention centers (%)
People in Group quarters - Halfway houses (%)
People in Group quarters - Local jails and other confinement facilities (including police lockups) (%)
People in Group quarters - Military disciplinary barracks (%)
People in Group quarters - State prisons (%)
People in Group quarters - Other types of correctional institutions (%)
People in Group quarters - Nursing homes (%)
People in Group quarters - Hospitals/wards, hospices, and schools for the handicapped (%)
People in Group quarters - Hospitals/wards and hospices for chronically ill (%)
People in Group quarters - Hospices or homes for chronically ill (%)
People in Group quarters - Military hospitals or wards for chronically ill (%)
People in Group quarters - Other hospitals or wards for chronically ill (%)
People in Group quarters - Hospitals or wards for drug/alcohol abuse (%)
People in Group quarters - Mental (Psychiatric) hospitals or wards (%)
People in Group quarters - Schools, hospitals, or wards for the mentally retarded (%)
People in Group quarters - Schools, hospitals, or wards for the physically handicapped (%)
People in Group quarters - Institutions for the deaf (%)
People in Group quarters - Institutions for the blind (%)
People in Group quarters - Orthopedic wards and institutions for the physically handicapped (%)
People in Group quarters - Wards in general hospitals for patients who have no usual home elsewhere (%)
People in Group quarters - Wards in military hospitals for patients who have no usual home elsewhere (%)
People in Group quarters - Juvenile institutions (%)
People in Group quarters - Long-term care (%)
People in Group quarters - Homes for abused, dependent, and neglected children (%)
People in Group quarters - Residential treatment centers for emotionally disturbed children (%)
People in Group quarters - Training schools for juvenile delinquents (%)
People in Group quarters - Short-term care, detention or diagnostic centers for delinquent children (%)
People in Group quarters - Type of juvenile institution unknown (%)
People in Group quarters - Noninstitutionalized population (%)
People in Group quarters - College dormitories (includes college quarters off campus) (%)
People in Group quarters - Military quarters (%)
People in Group quarters - On base (%)
People in Group quarters - Barracks, unaccompanied personnel housing (UPH), (Enlisted/Officer), ;and similar group living quarters for military personnel (%)
People in Group quarters - Transient quarters for temporary residents (%)
People in Group quarters - Military ships (%)
People in Group quarters - Group homes (%)
People in Group quarters - Homes or halfway houses for drug/alcohol abuse (%)
People in Group quarters - Homes for the mentally ill (%)
People in Group quarters - Homes for the mentally retarded (%)
People in Group quarters - Homes for the physically handicapped (%)
People in Group quarters - Other group homes (%)
People in Group quarters - Religious group quarters (%)
People in Group quarters - Dormitories (%)
People in Group quarters - Agriculture workers' dormitories on farms (%)
People in Group quarters - Job Corps and vocational training facilities (%)
People in Group quarters - Other workers' dormitories (%)
People in Group quarters - Crews of maritime vessels (%)
People in Group quarters - Other nonhousehold living situations (%)
People in Group quarters - Other noninstitutional group quarters (%)
Residents speaking English at home (%)
Residents speaking English at home - Born in the United States (%)
Residents speaking English at home - Native, born elsewhere (%)
Residents speaking English at home - Foreign born (%)
Residents speaking Spanish at home (%)
Residents speaking Spanish at home - Born in the United States (%)
Residents speaking Spanish at home - Native, born elsewhere (%)
Residents speaking Spanish at home - Foreign born (%)
Residents speaking other language at home (%)
Residents speaking other language at home - Born in the United States (%)
Residents speaking other language at home - Native, born elsewhere (%)
Residents speaking other language at home - Foreign born (%)
Class of Workers - Employee of private company (%)
Class of Workers - Self-employed in own incorporated business (%)
Class of Workers - Private not-for-profit wage and salary workers (%)
Class of Workers - Local government workers (%)
Class of Workers - State government workers (%)
Class of Workers - Federal government workers (%)
Class of Workers - Self-employed workers in own not incorporated business and Unpaid family workers (%)
House heating fuel used in houses and condos - Utility gas (%)
House heating fuel used in houses and condos - Bottled, tank, or LP gas (%)
House heating fuel used in houses and condos - Electricity (%)
House heating fuel used in houses and condos - Fuel oil, kerosene, etc. (%)
House heating fuel used in houses and condos - Coal or coke (%)
House heating fuel used in houses and condos - Wood (%)
House heating fuel used in houses and condos - Solar energy (%)
House heating fuel used in houses and condos - Other fuel (%)
House heating fuel used in houses and condos - No fuel used (%)
House heating fuel used in apartments - Utility gas (%)
House heating fuel used in apartments - Bottled, tank, or LP gas (%)
House heating fuel used in apartments - Electricity (%)
House heating fuel used in apartments - Fuel oil, kerosene, etc. (%)
House heating fuel used in apartments - Coal or coke (%)
House heating fuel used in apartments - Wood (%)
House heating fuel used in apartments - Solar energy (%)
House heating fuel used in apartments - Other fuel (%)
House heating fuel used in apartments - No fuel used (%)
Armed forces status - In Armed Forces (%)
Armed forces status - Civilian (%)
Armed forces status - Civilian - Veteran (%)
Armed forces status - Civilian - Nonveteran (%)
Fatal accidents locations in years 2005-2021
Fatal accidents locations in 2005
Fatal accidents locations in 2006
Fatal accidents locations in 2007
Fatal accidents locations in 2008
Fatal accidents locations in 2009
Fatal accidents locations in 2010
Fatal accidents locations in 2011
Fatal accidents locations in 2012
Fatal accidents locations in 2013
Fatal accidents locations in 2014
Fatal accidents locations in 2015
Fatal accidents locations in 2016
Fatal accidents locations in 2017
Fatal accidents locations in 2018
Fatal accidents locations in 2019
Fatal accidents locations in 2020
Fatal accidents locations in 2021
Alcohol use - People drinking some alcohol every month (%)
Alcohol use - People not drinking at all (%)
Alcohol use - Average days/month drinking alcohol
Alcohol use - Average drinks/week
Alcohol use - Average days/year people drink much
Audiometry - Average condition of hearing (%)
Audiometry - People that can hear a whisper from across a quiet room (%)
Audiometry - People that can hear normal voice from across a quiet room (%)
Audiometry - Ears ringing, roaring, buzzing (%)
Audiometry - Had a job exposure to loud noise (%)
Audiometry - Had off-work exposure to loud noise (%)
Blood Pressure & Cholesterol - Has high blood pressure (%)
Blood Pressure & Cholesterol - Checking blood pressure at home (%)
Blood Pressure & Cholesterol - Frequently checking blood cholesterol (%)
Blood Pressure & Cholesterol - Has high cholesterol level (%)
Consumer Behavior - Money monthly spent on food at supermarket/grocery store
Consumer Behavior - Money monthly spent on food at other stores
Consumer Behavior - Money monthly spent on eating out
Consumer Behavior - Money monthly spent on carryout/delivered foods
Consumer Behavior - Income spent on food at supermarket/grocery store (%)
Consumer Behavior - Income spent on food at other stores (%)
Consumer Behavior - Income spent on eating out (%)
Consumer Behavior - Income spent on carryout/delivered foods (%)
Current Health Status - General health condition (%)
Current Health Status - Blood donors (%)
Current Health Status - Has blood ever tested for HIV virus (%)
Current Health Status - Left-handed people (%)
Dermatology - People using sunscreen (%)
Diabetes - Diabetics (%)
Diabetes - Had a blood test for high blood sugar (%)
Diabetes - People taking insulin (%)
Diet Behavior & Nutrition - Diet health (%)
Diet Behavior & Nutrition - Milk product consumption (# of products/month)
Diet Behavior & Nutrition - Meals not home prepared (#/week)
Diet Behavior & Nutrition - Meals from fast food or pizza place (#/week)
Diet Behavior & Nutrition - Ready-to-eat foods (#/month)
Diet Behavior & Nutrition - Frozen meals/pizza (#/month)
Drug Use - People that ever used marijuana or hashish (%)
Drug Use - Ever used hard drugs (%)
Drug Use - Ever used any form of cocaine (%)
Drug Use - Ever used heroin (%)
Drug Use - Ever used methamphetamine (%)
Health Insurance - People covered by health insurance (%)
Kidney Conditions-Urology - Avg. # of times urinating at night
Medical Conditions - People with asthma (%)
Medical Conditions - People with anemia (%)
Medical Conditions - People with psoriasis (%)
Medical Conditions - People with overweight (%)
Medical Conditions - Elderly people having difficulties in thinking or remembering (%)
Medical Conditions - People who ever received blood transfusion (%)
Medical Conditions - People having trouble seeing even with glass/contacts (%)
Medical Conditions - People with arthritis (%)
Medical Conditions - People with gout (%)
Medical Conditions - People with congestive heart failure (%)
Medical Conditions - People with coronary heart disease (%)
Medical Conditions - People with angina pectoris (%)
Medical Conditions - People who ever had heart attack (%)
Medical Conditions - People who ever had stroke (%)
Medical Conditions - People with emphysema (%)
Medical Conditions - People with thyroid problem (%)
Medical Conditions - People with chronic bronchitis (%)
Medical Conditions - People with any liver condition (%)
Medical Conditions - People who ever had cancer or malignancy (%)
Mental Health - People who have little interest in doing things (%)
Mental Health - People feeling down, depressed, or hopeless (%)
Mental Health - People who have trouble sleeping or sleeping too much (%)
Mental Health - People feeling tired or having little energy (%)
Mental Health - People with poor appetite or overeating (%)
Mental Health - People feeling bad about themself (%)
Mental Health - People who have trouble concentrating on things (%)
Mental Health - People moving or speaking slowly or too fast (%)
Mental Health - People having thoughts they would be better off dead (%)
Oral Health - Average years since last visit a dentist
Oral Health - People embarrassed because of mouth (%)
Oral Health - People with gum disease (%)
Oral Health - General health of teeth and gums (%)
Oral Health - Average days a week using dental floss/device
Oral Health - Average days a week using mouthwash for dental problem
Oral Health - Average number of teeth
Pesticide Use - Households using pesticides to control insects (%)
Pesticide Use - Households using pesticides to kill weeds (%)
Physical Activity - People doing vigorous-intensity work activities (%)
Physical Activity - People doing moderate-intensity work activities (%)
Physical Activity - People walking or bicycling (%)
Physical Activity - People doing vigorous-intensity recreational activities (%)
Physical Activity - People doing moderate-intensity recreational activities (%)
Physical Activity - Average hours a day doing sedentary activities
Physical Activity - Average hours a day watching TV or videos
Physical Activity - Average hours a day using computer
Physical Functioning - People having limitations keeping them from working (%)
Physical Functioning - People limited in amount of work they can do (%)
Physical Functioning - People that need special equipment to walk (%)
Physical Functioning - People experiencing confusion/memory problems (%)
Physical Functioning - People requiring special healthcare equipment (%)
Prescription Medications - Average number of prescription medicines taking
Preventive Aspirin Use - Adults 40+ taking low-dose aspirin (%)
Reproductive Health - Vaginal deliveries (%)
Reproductive Health - Cesarean deliveries (%)
Reproductive Health - Deliveries resulted in a live birth (%)
Reproductive Health - Pregnancies resulted in a delivery (%)
Reproductive Health - Women breastfeeding newborns (%)
Reproductive Health - Women that had a hysterectomy (%)
Reproductive Health - Women that had both ovaries removed (%)
Reproductive Health - Women that have ever taken birth control pills (%)
Reproductive Health - Women taking birth control pills (%)
Reproductive Health - Women that have ever used Depo-Provera or injectables (%)
Reproductive Health - Women that have ever used female hormones (%)
Sexual Behavior - People 18+ that ever had sex (vaginal, anal, or oral) (%)
Sexual Behavior - Males 18+ that ever had vaginal sex with a woman (%)
Sexual Behavior - Males 18+ that ever performed oral sex on a woman (%)
Sexual Behavior - Males 18+ that ever had anal sex with a woman (%)
Sexual Behavior - Males 18+ that ever had any sex with a man (%)
Sexual Behavior - Females 18+ that ever had vaginal sex with a man (%)
Sexual Behavior - Females 18+ that ever performed oral sex on a man (%)
Sexual Behavior - Females 18+ that ever had anal sex with a man (%)
Sexual Behavior - Females 18+ that ever had any kind of sex with a woman (%)
Sexual Behavior - Average age people first had sex
Sexual Behavior - Average number of female sex partners in lifetime (males 18+)
Sexual Behavior - Average number of female vaginal sex partners in lifetime (males 18+)
Sexual Behavior - Average age people first performed oral sex on a woman (18+)
Sexual Behavior - Average number of woman performed oral sex on in lifetime (18+)
Sexual Behavior - Average number of male sex partners in lifetime (males 18+)
Sexual Behavior - Average number of male anal sex partners in lifetime (males 18+)
Sexual Behavior - Average age people first performed oral sex on a man (18+)
Sexual Behavior - Average number of male oral sex partners in lifetime (18+)
Sexual Behavior - People using protection when performing oral sex (%)
Sexual Behavior - Average number of times people have vaginal or anal sex a year
Sexual Behavior - People having sex without condom (%)
Sexual Behavior - Average number of male sex partners in lifetime (females 18+)
Sexual Behavior - Average number of male vaginal sex partners in lifetime (females 18+)
Sexual Behavior - Average number of female sex partners in lifetime (females 18+)
Sexual Behavior - Circumcised males 18+ (%)
Sleep Disorders - Average hours sleeping at night
Sleep Disorders - People that has trouble sleeping (%)
Smoking-Cigarette Use - People smoking cigarettes (%)
Taste & Smell - People 40+ having problems with smell (%)
Taste & Smell - People 40+ having problems with taste (%)
Taste & Smell - People 40+ that ever had wisdom teeth removed (%)
Taste & Smell - People 40+ that ever had tonsils teeth removed (%)
Taste & Smell - People 40+ that ever had a loss of consciousness because of a head injury (%)
Taste & Smell - People 40+ that ever had a broken nose or other serious injury to face or skull (%)
Taste & Smell - People 40+ that ever had two or more sinus infections (%)
Weight - Average height (inches)
Weight - Average weight (pounds)
Weight - Average BMI
Weight - People that are obese (%)
Weight - People that ever were obese (%)
Weight - People trying to lose weight (%)
100%
urban population.
Estimated median house/condo value in 2022: $498,764
99203:
$498,764Washington:
$569,500
According to our research of Washington and other state lists, there were 3 registered sex offenders living in 99203 zip code as of April 26, 2024 . The ratio of all residents to sex offenders in zip code 99203 is 7,098 to 1.The ratio of registered sex offenders to all residents in this zip code is much lower than the state average.
Median resident age: This zip code:
43.6 yearsWashington median age:
38.4 years
Average household size: This zip code:
2.3 peopleWashington:
2.5 people
Averages for the 2020 tax year for zip code 99203, filed in 2021:
Average Adjusted Gross Income (AGI) in 2020: $106,998 (Individual Income Tax Returns) Here:
$106,998State:
$99,264
Salary/wage: $86,814 (reported on 76.0% of returns )Here:
$86,814State:
$80,347
(% of AGI for various income ranges: 1130.2% for AGIs below $25k , 3391.7% for AGIs $25k-50k , 5761.8% for AGIs $50k-75k , 9023.6% for AGIs $75k-100k , 17747.7% for AGIs $100k-200k , 74187.7% for AGIs over 200k ) Taxable interest for individuals: $1,965 (reported on 52.4% of returns )This zip code:
$1,965Washington:
$2,077
(% of AGI for various income ranges: 28.1% for AGIs below $25k , 34.9% for AGIs $25k-50k , 70.8% for AGIs $50k-75k , 124.3% for AGIs $75k-100k , 328.0% for AGIs $100k-200k , 1113.3% for AGIs over 200k ) Ordinary dividends: $9,361 (reported on 35.2% of returns )(% of AGI for various income ranges: 64.3% for AGIs below $25k , 104.0% for AGIs $25k-50k , 202.4% for AGIs $50k-75k , 395.0% for AGIs $75k-100k , 771.4% for AGIs $100k-200k , 4612.6% for AGIs over 200k ) Net capital gain/loss in AGI: +$27,856 (reported on 32.9% of returns )Here:
+$27,856State:
+$40,092
(% of AGI for various income ranges: 32.2% for AGIs below $25k , 77.8% for AGIs $25k-50k , 194.0% for AGIs $50k-75k , 359.6% for AGIs $75k-100k , 970.1% for AGIs $100k-200k , 20256.7% for AGIs over 200k ) Profit/loss from business: +$21,638 (reported on 16.7% of returns )Here:
+$21,638State:
+$18,312
(% of AGI for various income ranges: 90.1% for AGIs below $25k , 231.9% for AGIs $25k-50k , 337.7% for AGIs $50k-75k , 401.9% for AGIs $75k-100k , 839.0% for AGIs $100k-200k , 4321.5% for AGIs over 200k ) Taxable individual retirement arrangement distribution: $26,555 (reported on 14.4% of returns )99203:
$26,555Washington:
$24,221
(% of AGI for various income ranges: 92.5% for AGIs below $25k , 181.8% for AGIs $25k-50k , 345.0% for AGIs $50k-75k , 684.3% for AGIs $75k-100k , 1273.9% for AGIs $100k-200k , 3149.7% for AGIs over 200k ) Self-employed (Keogh) retirement plans: $19,613 (reported on 1.4% of returns )99203:
$19,613Washington:
$24,166
(% of AGI for various income ranges: 19.1% for AGIs $25k-50k , 69.2% for AGIs $100k-200k , 470.5% for AGIs over 200k ) Total itemized deductions: $35,674 (reported on 11.4% of returns )Here:
$35,674State:
$39,068
(% of AGI for various income ranges: 57.5% for AGIs below $25k , 115.4% for AGIs $25k-50k , 344.2% for AGIs $50k-75k , 558.0% for AGIs $75k-100k , 1005.5% for AGIs $100k-200k , 5328.2% for AGIs over 200k ) Charity contributions: $12,736 (reported on 9.6% of returns )Here:
$12,736State:
$15,331
(% of AGI for various income ranges: 3.4% for AGIs below $25k , 17.6% for AGIs $25k-50k , 48.3% for AGIs $50k-75k , 109.3% for AGIs $75k-100k , 247.5% for AGIs $100k-200k , 2156.2% for AGIs over 200k ) Taxes paid: $7,295 (reported on 11.4% of returns )(% of AGI for various income ranges: 10.6% for AGIs below $25k , 25.7% for AGIs $25k-50k , 63.0% for AGIs $50k-75k , 126.4% for AGIs $75k-100k , 202.0% for AGIs $100k-200k , 1093.8% for AGIs over 200k ) Earned income credit: $1,719 (reported on 6.8% of returns )(% of AGI for various income ranges: 42.6% for AGIs below $25k , 37.0% for AGIs $25k-50k ) Percentage of individuals using paid preparers for their 2020 taxes: 93.0%(% for various income ranges: 92.3% for AGIs below $25k , 92.6% for AGIs $25k-50k , 92.7% for AGIs $50k-75k , 93.3% for AGIs $75k-100k , 93.0% for AGIs $100k-200k , 95.0% for AGIs over 200k )
Averages for the 2012 tax year for zip code 99203, filed in 2013:
Average Adjusted Gross Income (AGI) in 2012: $78,534 (Individual Income Tax Returns) Here:
$78,534State:
$69,533
Salary/wage: $65,695 (reported on 79.1% of returns )Here:
$65,695State:
$57,267
(% of AGI for various income ranges: 69.8% for AGIs below $25k , 71.9% for AGIs $25k-50k , 71.1% for AGIs $50k-75k , 68.9% for AGIs $75k-100k , 71.0% for AGIs $100k-200k , 57.6% for AGIs over 200k ) Taxable interest for individuals: $1,850 (reported on 49.4% of returns )This zip code:
$1,850Washington:
$1,816
(% of AGI for various income ranges: 1.8% for AGIs below $25k , 1.2% for AGIs $25k-50k , 1.3% for AGIs $50k-75k , 1.3% for AGIs $75k-100k , 1.2% for AGIs $100k-200k , 0.9% for AGIs over 200k ) Ordinary dividends: $7,722 (reported on 33.7% of returns )(% of AGI for various income ranges: 5.4% for AGIs below $25k , 2.8% for AGIs $25k-50k , 2.4% for AGIs $50k-75k , 2.7% for AGIs $75k-100k , 2.7% for AGIs $100k-200k , 4.2% for AGIs over 200k ) Net capital gain/loss in AGI: +$13,968 (reported on 28.4% of returns )Here:
+$13,968State:
+$21,568
(% of AGI for various income ranges: 0.5% for AGIs $25k-50k , 0.9% for AGIs $50k-75k , 0.8% for AGIs $75k-100k , 2.1% for AGIs $100k-200k , 12.2% for AGIs over 200k ) Profit/loss from business: +$16,938 (reported on 16.4% of returns )Here:
+$16,938State:
+$16,521
(% of AGI for various income ranges: 6.7% for AGIs below $25k , 4.4% for AGIs $25k-50k , 3.6% for AGIs $50k-75k , 3.8% for AGIs $75k-100k , 3.3% for AGIs $100k-200k , 3.0% for AGIs over 200k ) Taxable individual retirement arrangement distribution: $19,136 (reported on 15.0% of returns )99203:
$19,136Washington:
$18,648
(% of AGI for various income ranges: 4.9% for AGIs below $25k , 3.5% for AGIs $25k-50k , 3.6% for AGIs $50k-75k , 4.1% for AGIs $75k-100k , 4.5% for AGIs $100k-200k , 2.7% for AGIs over 200k ) Self-employment retirement plans: $15,500 (reported on 1.4% of returns )99203:
$15,500Washington:
$20,087
(% of AGI for various income ranges: 0.2% for AGIs $50k-75k , 0.2% for AGIs $100k-200k , 0.5% for AGIs over 200k ) Total itemized deductions: $22,776 (17% of AGI, reported on 38.8% of returns )Here:
$22,776State:
$23,872
Here:
16.8% of AGIState:
18.2% of AGI
(% of AGI for various income ranges: 15.1% for AGIs below $25k , 11.2% for AGIs $25k-50k , 12.6% for AGIs $50k-75k , 12.6% for AGIs $75k-100k , 12.8% for AGIs $100k-200k , 8.6% for AGIs over 200k ) Charity contributions: $4,846 (reported on 33.2% of returns )(% of AGI for various income ranges: 1.2% for AGIs below $25k , 1.3% for AGIs $25k-50k , 1.5% for AGIs $50k-75k , 2.0% for AGIs $75k-100k , 2.1% for AGIs $100k-200k , 2.5% for AGIs over 200k ) Taxes paid: $6,353 (reported on 38.6% of returns )(% of AGI for various income ranges: 2.8% for AGIs below $25k , 2.7% for AGIs $25k-50k , 3.0% for AGIs $50k-75k , 3.4% for AGIs $75k-100k , 3.6% for AGIs $100k-200k , 2.9% for AGIs over 200k ) Earned income credit: $1,771 (reported on 10.0% of returns )(% of AGI for various income ranges: 3.4% for AGIs below $25k , 0.7% for AGIs $25k-50k ) Percentage of individuals using paid preparers for their 2012 taxes: 45.5%(% for various income ranges: 36.3% for AGIs below $25k , 38.8% for AGIs $25k-50k , 45.5% for AGIs $50k-75k , 48.2% for AGIs $75k-100k , 56.7% for AGIs $100k-200k , 80.0% for AGIs over 200k )
Averages for the 2004 tax year for zip code 99203, filed in 2005:
Average Adjusted Gross Income (AGI) in 2004: $61,536 (Individual Income Tax Returns) Here:
$61,536State:
$54,331
Salary/wage: $51,507 (reported on 78.9% of returns )Here:
$51,507State:
$45,761
(% of AGI for various income ranges: 252.3% for AGIs below $10k , 68.1% for AGIs $10k-25k , 73.8% for AGIs $25k-50k , 75.9% for AGIs $50k-75k , 74.2% for AGIs $75k-100k , 57.0% for AGIs over 100k ) Taxable interest for individuals: $2,299 (reported on 58.0% of returns )This zip code:
$2,299Washington:
$2,110
(% of AGI for various income ranges: 22.4% for AGIs below $10k , 4.2% for AGIs $10k-25k , 2.6% for AGIs $25k-50k , 2.0% for AGIs $50k-75k , 1.5% for AGIs $75k-100k , 1.9% for AGIs over 100k ) Taxable dividends: $5,138 (reported on 39.5% of returns )(% of AGI for various income ranges: 24.8% for AGIs below $10k , 4.2% for AGIs $10k-25k , 2.5% for AGIs $25k-50k , 2.4% for AGIs $50k-75k , 2.6% for AGIs $75k-100k , 3.7% for AGIs over 100k ) Net capital gain/loss: +$15,553 (reported on 33.5% of returns )Here:
+$15,553State:
+$15,835
(% of AGI for various income ranges: 17.3% for AGIs below $10k , -0.2% for AGIs $10k-25k , 0.8% for AGIs $25k-50k , 1.2% for AGIs $50k-75k , 3.7% for AGIs $75k-100k , 14.7% for AGIs over 100k ) Profit/loss from business: +$17,799 (reported on 16.2% of returns )Here:
+$17,799State:
+$13,994
(% of AGI for various income ranges: -25.8% for AGIs below $10k , 5.2% for AGIs $10k-25k , 4.5% for AGIs $25k-50k , 4.3% for AGIs $50k-75k , 3.7% for AGIs $75k-100k , 5.3% for AGIs over 100k ) IRA payment deduction: $3,261 (reported on 3.8% of returns )99203:
$3,261Washington:
$3,001
(% of AGI for various income ranges: 1.0% for AGIs below $10k , 0.3% for AGIs $10k-25k , 0.4% for AGIs $25k-50k , 0.3% for AGIs $50k-75k , 0.2% for AGIs $75k-100k , 0.1% for AGIs over 100k ) Self-employed pension: $13,236 (reported on 2.1% of returns )Here:
$13,236Washington:
$14,244
(% of AGI for various income ranges: 0.8% for AGIs below $10k , 0.2% for AGIs $25k-50k , 0.2% for AGIs $50k-75k , 0.2% for AGIs $75k-100k , 0.7% for AGIs over 100k ) Total itemized deductions: $17,451 (17% of AGI, reported on 41.0% of returns )Here:
$17,451State:
$19,669
Here:
17.4% of AGIState:
20.7% of AGI
(% of AGI for various income ranges: 55.8% for AGIs below $10k , 15.5% for AGIs $10k-25k , 14.4% for AGIs $25k-50k , 13.2% for AGIs $50k-75k , 12.7% for AGIs $75k-100k , 9.3% for AGIs over 100k ) Charity contributions deductions: $4,018 (4% of AGI, reported on 36.5% of returns )Here:
3.8% of AGIState:
3.5% of AGI
(% of AGI for various income ranges: 2.8% for AGIs below $10k , 1.6% for AGIs $10k-25k , 1.7% for AGIs $25k-50k , 2.0% for AGIs $50k-75k , 2.2% for AGIs $75k-100k , 2.8% for AGIs over 100k ) Total tax: $11,175 (reported on 80.4% of returns )99203:
$11,175State:
$9,065
(% of AGI for various income ranges: 7.9% for AGIs below $10k , 4.6% for AGIs $10k-25k , 7.6% for AGIs $25k-50k , 9.7% for AGIs $50k-75k , 11.0% for AGIs $75k-100k , 19.9% for AGIs over 100k ) Earned income credit: $1,340 (reported on 8.2% of returns )Percentage of individuals using paid preparers for their 2004 taxes: 49.5%(% for various income ranges: 41.7% for AGIs below $10k , 46.7% for AGIs $10k-25k , 46.6% for AGIs $25k-50k , 49.7% for AGIs $50k-75k , 49.7% for AGIs $75k-100k , 67.7% for AGIs over 100k )
Estimated median household income in 2022: This zip code:
$92,731Washington:
$91,306
Nearest zip codes: 99204 ,
99202 ,
99201 ,
99207 ,
99223 ,
99205 .
Spokane Zip Code Map
Percentage of family households: This zip code:
42.5%Washington:
45.0%
Percentage of households with unmarried partners: This zip code:
5.0%Washington:
48.7%
Likely homosexual households (counted as self-reported same-sex unmarried-partner households)
Lesbian couples: 0.4% of all households Gay men: 0.3% of all households
Household received Food Stamps/SNAP in the past 12 months: 499Household did not receive Food Stamps/SNAP in the past 12 months: 9,106
Women who had a birth in the past 12 months: 283 (270 now married , 19 unmarried) Women who did not have a birth in the past 12 months: 4,652 (2,147 now married , 2,503 unmarried)
Housing units in zip code 99203 with a mortgage: 4,802 (669
second mortgage , 20
home equity loan , 543
both second mortgage and home equity loan )
Houses without a mortgage: 116
Median monthly owner costs for units with a mortgage: $1,977
Median monthly owner costs for units without a mortgage: $703
Residents with income below the poverty level in 2022:
This zip code:
5.4%Whole state:
10.0%
Residents with income below 50% of the poverty level in 2022:
This zip code:
1.9%Whole state:
4.6%
Median number of rooms in houses and condos: Median number of rooms in apartments:
Year house built (houses)
0 2020 or later191 2010 to 2019191 2000 to 2009365 1990 to 1999839 1980 to 19891,032 1970 to 1979478 1960 to 19691,816 1950 to 19591,511 1940 to 19493,202 1939 or earlier
Zip code 99203 household income distribution in 2022 243 Less than $10,000236 $10,000 to $14,99976 $15,000 to $19,999268 $20,000 to $24,999207 $25,000 to $29,999228 $30,000 to $34,999312 $35,000 to $39,999232 $40,000 to $44,999289 $45,000 to $49,999631 $50,000 to $59,9991,045 $60,000 to $74,9991,288 $75,000 to $99,9991,217 $100,000 to $124,999857 $125,000 to $149,999923 $150,000 to $199,9991,545 $200,000 or moreEstimate of home value of owner-occupied houses/condos in 2022 in zip code 99203 5 Less than $10,00017 $10,000 to $14,9999 $15,000 to $19,9998 $30,000 to $34,99958 $50,000 to $59,999120 $60,000 to $69,99940 $70,000 to $79,99914 $80,000 to $89,99953 $100,000 to $124,99910 $125,000 to $149,99930 $150,000 to $174,99958 $175,000 to $199,999308 $200,000 to $249,999357 $250,000 to $299,9991,389 $300,000 to $399,9991,510 $400,000 to $499,9991,804 $500,000 to $749,999550 $750,000 to $999,999266 $1,000,000 to $1,499,999204 $2,000,000 or moreRent paid by renters in 2022 in zip code 99203 13 Less than $10032 $200 to $24910 $300 to $34911 $400 to $4495 $450 to $49923 $550 to $59936 $600 to $64998 $700 to $74960 $750 to $799240 $800 to $899453 $900 to $999350 $1,000 to $1,249144 $1,250 to $1,499366 $1,500 to $1,999148 $2,000 to $2,49921 $2,500 to $2,999152 $3,500 or more3 No cash rent
Median gross rent in 2022: $1,237.
Median price asked for vacant for-sale houses and condos in 2022: $1,114,345.
Estimated median house (or condo) value in 2022 for: White Non-Hispanic householders: $501,717Black or African American householders: $425,665American Indian or Alaska Native householders: $375,826Asian householders: $423,450Some other race householders: $352,937Two or more races householders: $498,394Hispanic or Latino householders: $453,723Estimated median house or condo value in 2022: $498,764
99203:
$498,764Washington:
$569,500
Lower value quartile - upper value quartile: $378,320 - $662,032
Mean price in 2022: Detached houses: $415,140Here:
$415,140State:
$734,307
Townhouses or other attached units: $499,737Here:
$499,737State:
$657,697
In 2-unit structures: $311,126Here:
$311,126State:
$534,634
In 3-to-4-unit structures: $385,032Here:
$385,032State:
$510,239
In 5-or-more-unit structures: $386,557Here:
$386,557State:
$503,183
Mobile homes: $56,517Here:
$56,517State:
$218,362
Housing units in structures:
One, detached: 8,086One, attached: 316Two: 913 or 4: 3865 to 9: 27310 to 19: 9520 to 49: 5950 or more: 505Mobile homes: 19Unemployment : 3.9%
Means of transportation to work in zip code 99203 68.5% 7,497 Drove a car alone6.7% 731 Carpooled2.6% 283 Bus or trolley bus0.1% 15 Motorcycle0.3% 33 Bicycle1.0% 108 Walked0.6% 66 Other means20.0% 2,190 Worked at homeTravel time to work (commute) in zip code 99203 192 Less than 5 minutes1,374 5 to 9 minutes2,152 10 to 14 minutes1,702 15 to 19 minutes1,276 20 to 24 minutes723 25 to 29 minutes637 30 to 34 minutes172 35 to 39 minutes75 40 to 44 minutes99 45 to 59 minutes203 60 to 89 minutes135 90 or more minutes
Neighborhoods in zip code 99203: Percentage of zip code residents living and working in this county: 98.4%
Household type by relationship:
Households: 22,262
Male householders: 4,490 (896 living alone ), Female householders: 5,144 (1,924 living alone )4,839 spouses (4,705 opposite-sex spouses ), 587 unmarried partners , (538 opposite-sex unmarried partners ), 5,726 children (5,367 natural , 271 adopted , 79 stepchildren ), 273 grandchildren , 64 brothers or sisters , 273 parents , 7 foster children , 106 other relatives , 615 non-relatives In group quarters: 184 (-1 institutionalized population )
Size of family households: 3,028 2-persons , 1,454 3-persons , 1,052 4-persons , 378 5-persons , 102 6-persons , 113 7-or-more-persons
Size of nonfamily households: 2,820 1-person , 582 2-persons , 52 3-persons , 6 4-persons , 24 5-persons , 1 7-or-more-persons
3,447 married couples with children. single-parent households (252 men , 529 women ).
95.3% of residents of 99203 zip code speak English at home. of residents speak Spanish at home (72% very well, 14% well, 14% not well, 1% not at all ).of residents speak other Indo-European language at home (94% very well, 6% not well ).of residents speak Asian or Pacific Island language at home (51% very well, 43% well, 6% not at all ).of residents speak other language at home (100% very well ).
Foreign born population: 940 (4.2%)
(63.7%
of them are naturalized citizens )
This zip code:
4.2%Whole state:
15.3%
8% Honduras 7% Eritrea 6% Romania 5% Taiwan 5% Azores Islands 5% Greece 3% Uruguay 12% English 11% European 11% Irish 11% American 10% German 4% Norwegian 3% Italian
Year of entry for the foreign-born population
368 2010 or later 271 2000 to 2009 147 1990 to 1999 560 Before 1990
There are
159 Medical Specialists in Zip Code 99203 .
Facilities with environmental interests located in this zip code:
ALT MORNING STAR BOYS RANCH (4511 S GLEN ROSE in SPOKANE, WA)
(National Center for Education Statistics) - STATE ID-1616 Organizations: SPOKANE SCH DIST 81 (SCHOOL DISTRICT)
BOYD CROWLEY BETTER HOMES AND GARDENS (3022 S GRAND in SPOKANE, WA)
COMPLIANCE ACTIVITY (Tracking inspections of insecticide, fungicide, and rodenticide, and toxic substances)
Housing units lacking complete kitchen facilities: 2.9%
68.0% Utility gas 24.8% Electricity 3.7% Fuel oil, kerosene, etc. 1.7% No fuel used 1.3% Bottled, tank, or LP gas
Population in 1990: 20,454. Population change in the 1990s: +556 (+2.7%).
Place of birth for U.S.-born residents:
This state: 10,985Northeast: 1,237Midwest: 2,138South: 1,360West: 5,096
54% of the 99203 zip code residents lived in the same house 5 years ago.
Out of people who lived in different houses, 58% lived in this county.
Out of people who lived in different counties, 50% lived in Washington.
88% of the 99203 zip code residents lived in the same house 1 year ago.
Out of people who lived in different houses, 60% moved from this county.
Out of people who lived in different houses, 22% moved from different county within same state.
Out of people who lived in different houses, 16% moved from different state.
Out of people who lived in different houses, 1% moved from abroad.
Private vs. public school enrollment:
Students in private schools in grades 1 to 8 (elementary and middle school): 301
Here:
13.7%Washington:
12.4%
Students in private schools in grades 9 to 12 (high school): 69
Students in private undergraduate colleges: 171
Here:
21.3%Washington:
16.5%
Occupation by median earnings in the past 12 months ($)
95,326 Management occupations 90,100 Health diagnosing and treating practitioners and other technical occupations 89,202 Architecture and engineering occupations 86,806 Legal occupations 83,497 Law enforcement workers including supervisors 82,843 Computer and mathematical occupations
Companies with federal contracts located in this zip code (SPOKANE, WA):
ROYAL STRATEGIC ENTREPRENEURIA (410 E 42ND AVE; small business) in 24 contracts from 2004 to 2006
Contracts for Time Measuring Instruments, Marine Lifesaving and Diving Equipment by Defense Logistics Agency, NavySigned by year: 2000: $0; 2001: $0; 2002: $0; 2003: $0; 2004: $175,298; 2005: $439,224; 2006: $176,090.
Biggest contracts: with Defense Logistics Agency for Time Measuring Instruments. Signed on 2004-03-08. Completion date: 2004-04-20.
, same as above. Signed on 2005-10-21. Completion date: 2005-12-03.
, same as above. Signed on 2005-03-14. Completion date: 2005-04-26.
, same as above. Signed on 2006-03-22. Completion date: 2006-05-04.
SHEILA PACHERNEGG (336 EAST 16TH AVENUE; small business)
$23,500 with Air Force for Land Surveys, Cadastral Services (non-construction). Signed on 2006-05-09. Completion date: 2006-09-30.
GODWIN VENTURES INC (2107 E 36TH AVE; small business)
$5,500 with Air Force for Surveillance Services. Signed on 2005-03-11. Completion date: 2005-04-01.
EWING'S SCOPE STANDS (1518 S GRAND BLVD; small business) employees , $0 revenue . Veteran Owned Business
$3,148 with Army for Optical Sighting and Ranging Equipment. Signed on 2005-04-21. Completion date: 2005-05-01.
SPRING ENVIRONMENTAL, INC (829 W 29TH AVENUE; small business) in 2 contracts in 2001
$420 with U.S. Army Corps of Engineers - civil program financing only for Air Quality Support Services. Taking place in ID. Signed on 2001-11-27. Completion date: 2001-12-03.
, same as above. Signed on 2001-11-27. Completion date: 2001-12-03.
DUNAU ASSOCIATES INC (2206 S SHERMAN ST; small business) in 2 contracts from 2002 to 2003
$3,400 with U.S. Army Corps of Engineers - civil program financing only for Training Aids. Taking place in OR. Signed on 2002-09-23. Completion date: 2002-10-30.
, same as above. Signed on 2003-07-09. Completion date: 2002-10-30.
Top industries in this zip code by the number of employees in 2005:
Other Services (except Public Administration): Religious Organizations (20-49 employees: 4 establishments, 10-19 employees: 4 establishments, 5-9 employees: 4 establishments, 1-4 employees: 2 establishments)Accommodation and Food Services: Full-Service Restaurants (50-99: 1, 20-49: 3, 10-19: 2, 5-9: 1, 1-4: 2)Health Care and Social Assistance: Offices of Dentists (20-49: 2, 10-19: 3, 5-9: 8, 1-4: 2)Health Care and Social Assistance: Continuing Care Retirement Communities (100-249: 1)Educational Services: Elementary and Secondary Schools (50-99: 1, 20-49: 1, 1-4: 1)Accommodation and Food Services: Limited-Service Restaurants (20-49: 3, 5-9: 1)Health Care and Social Assistance: Child Day Care Services (20-49: 2, 1-4: 5)Wholesale Trade: Other Grocery and Related Products Merchant Wholesalers (50-99: 1)Health Care and Social Assistance: Offices of Physicians (except Mental Health Specialists) (10-19: 3, 5-9: 1, 1-4: 9)
People in group quarters in 2010:
55 people in group homes intended for adults
46 people in nursing facilities/skilled-nursing facilities
7 people in group homes for juveniles (non-correctional)
6 people in workers' group living quarters and job corps centers
4 people in residential treatment centers for juveniles (non-correctional)
People in group quarters in 2000:
48 people in other noninstitutional group quarters
43 people in nursing homes
11 people in homes or halfway houses for drug/alcohol abuse
11 people in homes for the mentally retarded
11 people in other group homes
5 people in homes for the mentally ill
Fatal accident statistics in 2012:
Fatal accident count: 2Vehicles involved in fatal accidents: 3Fatal accidents caused by drunken drivers: 0Fatalities: 2Persons involved in fatal accidents: 3Pedestrians involved in fatal accidents: 1
Home Mortgage Disclosure Act Aggregated Statistics For Year 2009(Based on 7 full and 12 partial tracts) A) FHA, FSA/RHS & VA B) Conventional C) Refinancings D) Home Improvement Loans E) Loans on Dwellings For 5+ Families F) Non-occupant Loans on G) Loans On Manufactured Number Average Value Number Average Value Number Average Value Number Average Value Number Average Value Number Average Value Number Average Value
LOANS ORIGINATED 222 $172,162 317 $191,983 1,509 $191,079 116 $101,428 3 $643,933 90 $149,510 2 $101,720 APPLICATIONS APPROVED, NOT ACCEPTED 11 $180,481 28 $222,094 128 $200,496 13 $220,805 0 $0 9 $168,949 2 $52,545 APPLICATIONS DENIED 24 $171,577 26 $185,931 312 $200,457 25 $54,579 0 $0 33 $141,398 2 $47,985 APPLICATIONS WITHDRAWN 25 $162,007 34 $201,090 274 $181,405 18 $206,256 0 $0 13 $144,778 0 $0 FILES CLOSED FOR INCOMPLETENESS 1 $262,330 1 $285,000 54 $184,589 2 $42,830 0 $0 3 $83,527 0 $0
Aggregated Statistics For Year 2008(Based on 7 full and 12 partial tracts) A) FHA, FSA/RHS & VA B) Conventional C) Refinancings D) Home Improvement Loans E) Loans on Dwellings For 5+ Families F) Non-occupant Loans on G) Loans On Manufactured Number Average Value Number Average Value Number Average Value Number Average Value Number Average Value Number Average Value Number Average Value
LOANS ORIGINATED 130 $184,590 429 $212,260 924 $188,589 141 $104,771 9 $2,573,033 149 $168,396 3 $80,227 APPLICATIONS APPROVED, NOT ACCEPTED 12 $175,224 69 $224,296 112 $175,953 24 $53,466 0 $0 21 $131,717 1 $77,530 APPLICATIONS DENIED 19 $200,923 44 $176,661 233 $175,804 46 $88,928 1 $541,120 21 $120,745 1 $22,980 APPLICATIONS WITHDRAWN 9 $139,042 56 $208,689 149 $172,479 36 $157,384 0 $0 23 $143,465 0 $0 FILES CLOSED FOR INCOMPLETENESS 0 $0 16 $224,222 35 $176,056 5 $124,396 0 $0 6 $216,513 0 $0
Aggregated Statistics For Year 2007(Based on 7 full and 12 partial tracts) A) FHA, FSA/RHS & VA B) Conventional C) Refinancings D) Home Improvement Loans E) Loans on Dwellings For 5+ Families F) Non-occupant Loans on G) Loans On Manufactured Number Average Value Number Average Value Number Average Value Number Average Value Number Average Value Number Average Value Number Average Value
LOANS ORIGINATED 36 $178,550 808 $180,013 852 $166,396 201 $85,225 10 $455,979 213 $148,309 3 $54,767 APPLICATIONS APPROVED, NOT ACCEPTED 0 $0 83 $182,573 128 $168,817 26 $130,050 0 $0 27 $132,203 3 $105,260 APPLICATIONS DENIED 4 $203,248 115 $180,536 321 $158,886 76 $82,905 0 $0 50 $155,263 7 $71,660 APPLICATIONS WITHDRAWN 10 $182,596 64 $203,186 185 $166,337 25 $91,548 0 $0 26 $161,936 0 $0 FILES CLOSED FOR INCOMPLETENESS 0 $0 24 $180,229 53 $213,802 8 $59,079 0 $0 12 $153,980 0 $0
Aggregated Statistics For Year 2006(Based on 7 full and 12 partial tracts) A) FHA, FSA/RHS & VA B) Conventional C) Refinancings D) Home Improvement Loans E) Loans on Dwellings For 5+ Families F) Non-occupant Loans on G) Loans On Manufactured Number Average Value Number Average Value Number Average Value Number Average Value Number Average Value Number Average Value Number Average Value
LOANS ORIGINATED 42 $158,192 1,162 $150,373 972 $140,179 211 $72,276 9 $527,486 324 $127,690 3 $88,187 APPLICATIONS APPROVED, NOT ACCEPTED 4 $142,038 92 $155,314 137 $149,088 37 $68,300 0 $0 25 $110,401 1 $64,270 APPLICATIONS DENIED 1 $224,870 125 $140,258 321 $140,675 64 $62,427 0 $0 49 $123,734 2 $38,625 APPLICATIONS WITHDRAWN 1 $170,180 78 $148,527 269 $151,101 26 $105,078 0 $0 22 $127,860 0 $0 FILES CLOSED FOR INCOMPLETENESS 0 $0 13 $122,799 79 $161,922 4 $66,825 0 $0 2 $188,745 0 $0
Aggregated Statistics For Year 2005(Based on 7 full and 12 partial tracts) A) FHA, FSA/RHS & VA B) Conventional C) Refinancings D) Home Improvement Loans E) Loans on Dwellings For 5+ Families F) Non-occupant Loans on G) Loans On Manufactured Number Average Value Number Average Value Number Average Value Number Average Value Number Average Value Number Average Value Number Average Value
LOANS ORIGINATED 62 $136,733 1,074 $142,556 1,105 $134,644 168 $81,250 8 $256,780 308 $113,203 4 $85,658 APPLICATIONS APPROVED, NOT ACCEPTED 3 $153,313 108 $146,046 145 $137,632 15 $93,069 0 $0 20 $101,596 3 $62,173 APPLICATIONS DENIED 1 $49,270 101 $126,251 334 $128,373 74 $61,097 0 $0 31 $106,989 4 $57,185 APPLICATIONS WITHDRAWN 8 $165,852 100 $119,736 282 $143,377 43 $147,040 0 $0 42 $106,293 6 $130,225 FILES CLOSED FOR INCOMPLETENESS 0 $0 15 $95,815 119 $136,515 4 $41,975 0 $0 16 $116,388 0 $0
Aggregated Statistics For Year 2004(Based on 7 full and 12 partial tracts) A) FHA, FSA/RHS & VA B) Conventional C) Refinancings D) Home Improvement Loans E) Loans on Dwellings For 5+ Families F) Non-occupant Loans on G) Loans On Manufactured Number Average Value Number Average Value Number Average Value Number Average Value Number Average Value Number Average Value Number Average Value
LOANS ORIGINATED 83 $123,298 1,010 $121,965 1,058 $119,218 104 $50,196 17 $319,146 298 $98,946 2 $61,130 APPLICATIONS APPROVED, NOT ACCEPTED 6 $112,490 95 $117,987 160 $122,705 8 $82,061 0 $0 26 $109,176 3 $45,757 APPLICATIONS DENIED 6 $107,105 110 $103,299 329 $115,254 65 $48,097 3 $484,080 51 $79,235 5 $65,216 APPLICATIONS WITHDRAWN 5 $178,136 63 $130,975 223 $110,172 24 $80,028 1 $387,740 25 $82,392 1 $58,400 FILES CLOSED FOR INCOMPLETENESS 2 $148,600 11 $174,863 61 $126,457 8 $57,075 0 $0 3 $56,083 0 $0
Aggregated Statistics For Year 2003(Based on 7 full and 12 partial tracts) A) FHA, FSA/RHS & VA B) Conventional C) Refinancings D) Home Improvement Loans E) Loans on Dwellings For 5+ Families F) Non-occupant Loans on Number Average Value Number Average Value Number Average Value Number Average Value Number Average Value Number Average Value
LOANS ORIGINATED 168 $113,167 863 $123,426 3,130 $120,791 92 $35,666 7 $301,160 337 $87,751 APPLICATIONS APPROVED, NOT ACCEPTED 6 $142,117 82 $121,509 265 $113,217 8 $34,456 0 $0 31 $103,609 APPLICATIONS DENIED 13 $123,316 92 $116,798 366 $111,743 38 $22,057 1 $288,790 28 $84,177 APPLICATIONS WITHDRAWN 18 $105,329 73 $99,575 272 $107,703 5 $29,556 0 $0 17 $92,918 FILES CLOSED FOR INCOMPLETENESS 4 $94,700 7 $115,840 73 $104,547 3 $25,180 0 $0 6 $91,098
Aggregated Statistics For Year 2002(Based on 7 full and 10 partial tracts) A) FHA, FSA/RHS & VA B) Conventional C) Refinancings D) Home Improvement Loans E) Loans on Dwellings For 5+ Families F) Non-occupant Loans on Number Average Value Number Average Value Number Average Value Number Average Value Number Average Value Number Average Value
LOANS ORIGINATED 150 $108,216 783 $121,863 2,144 $129,758 73 $33,124 7 $203,137 243 $81,102 APPLICATIONS APPROVED, NOT ACCEPTED 10 $91,929 56 $124,590 184 $117,126 14 $34,519 0 $0 23 $93,380 APPLICATIONS DENIED 8 $88,746 39 $110,484 285 $113,460 26 $13,236 0 $0 18 $102,226 APPLICATIONS WITHDRAWN 14 $99,503 52 $114,765 224 $112,432 0 $0 0 $0 19 $108,555 FILES CLOSED FOR INCOMPLETENESS 2 $98,780 10 $108,518 48 $147,919 4 $27,890 0 $0 1 $142,290
Aggregated Statistics For Year 2001(Based on 7 full and 10 partial tracts) A) FHA, FSA/RHS & VA B) Conventional C) Refinancings D) Home Improvement Loans E) Loans on Dwellings For 5+ Families F) Non-occupant Loans on Number Average Value Number Average Value Number Average Value Number Average Value Number Average Value Number Average Value
LOANS ORIGINATED 196 $97,734 760 $112,882 1,454 $115,141 117 $45,289 5 $253,758 169 $84,435 APPLICATIONS APPROVED, NOT ACCEPTED 7 $88,780 51 $131,196 141 $107,252 21 $13,966 0 $0 9 $98,802 APPLICATIONS DENIED 12 $92,142 49 $110,630 278 $100,132 47 $22,489 2 $118,545 18 $108,552 APPLICATIONS WITHDRAWN 9 $124,868 65 $129,919 194 $104,979 10 $13,550 0 $0 20 $101,951 FILES CLOSED FOR INCOMPLETENESS 0 $0 12 $54,741 53 $121,349 11 $22,727 0 $0 3 $75,423
Aggregated Statistics For Year 2000(Based on 7 full and 10 partial tracts) A) FHA, FSA/RHS & VA B) Conventional C) Refinancings D) Home Improvement Loans E) Loans on Dwellings For 5+ Families F) Non-occupant Loans on Number Average Value Number Average Value Number Average Value Number Average Value Number Average Value Number Average Value
LOANS ORIGINATED 161 $101,601 624 $108,028 264 $96,288 131 $23,833 3 $407,770 74 $86,663 APPLICATIONS APPROVED, NOT ACCEPTED 12 $94,111 74 $106,200 59 $88,109 40 $28,894 0 $0 5 $96,606 APPLICATIONS DENIED 14 $97,919 81 $97,976 163 $79,748 82 $27,391 0 $0 15 $77,745 APPLICATIONS WITHDRAWN 24 $97,636 52 $83,608 85 $101,318 11 $117,261 1 $94,480 10 $77,253 FILES CLOSED FOR INCOMPLETENESS 4 $111,442 13 $88,906 24 $68,046 1 $33,440 0 $0 1 $60,080
Aggregated Statistics For Year 1999(Based on 4 full and 6 partial tracts) A) FHA, FSA/RHS & VA B) Conventional C) Refinancings D) Home Improvement Loans E) Loans on Dwellings For 5+ Families F) Non-occupant Loans on Number Average Value Number Average Value Number Average Value Number Average Value Number Average Value Number Average Value
LOANS ORIGINATED 111 $98,213 447 $111,348 485 $101,635 105 $30,853 1 $4,381,870 78 $79,105 APPLICATIONS APPROVED, NOT ACCEPTED 5 $104,886 48 $104,142 82 $116,103 16 $21,779 0 $0 6 $64,255 APPLICATIONS DENIED 5 $85,704 66 $77,130 146 $101,448 32 $20,359 0 $0 17 $118,125 APPLICATIONS WITHDRAWN 8 $97,614 43 $103,493 100 $100,226 8 $52,896 0 $0 7 $96,036 FILES CLOSED FOR INCOMPLETENESS 0 $0 8 $97,671 40 $104,085 2 $22,530 0 $0 4 $64,957
Private Mortgage Insurance Companies Aggregated Statistics For Year 2009(Based on 7 full and 12 partial tracts) A) Conventional B) Refinancings C) Non-occupant Loans on Number Average Value Number Average Value Number Average Value
LOANS ORIGINATED 48 $210,709 44 $237,751 0 $0 APPLICATIONS APPROVED, NOT ACCEPTED 20 $232,837 13 $234,986 1 $281,370 APPLICATIONS DENIED 10 $231,578 12 $292,668 1 $147,990 APPLICATIONS WITHDRAWN 5 $223,112 4 $191,222 0 $0 FILES CLOSED FOR INCOMPLETENESS 2 $258,000 0 $0 1 $237,000
Aggregated Statistics For Year 2008(Based on 7 full and 12 partial tracts) A) Conventional B) Refinancings C) Non-occupant Loans on Number Average Value Number Average Value Number Average Value
LOANS ORIGINATED 142 $202,126 73 $217,940 9 $168,809 APPLICATIONS APPROVED, NOT ACCEPTED 38 $188,164 32 $244,347 9 $137,466 APPLICATIONS DENIED 6 $232,725 5 $197,682 4 $240,782 APPLICATIONS WITHDRAWN 5 $193,072 2 $248,755 0 $0 FILES CLOSED FOR INCOMPLETENESS 0 $0 0 $0 0 $0
Aggregated Statistics For Year 2007(Based on 7 full and 12 partial tracts) A) Conventional B) Refinancings C) Non-occupant Loans on Number Average Value Number Average Value Number Average Value
LOANS ORIGINATED 226 $183,277 57 $206,303 24 $156,273 APPLICATIONS APPROVED, NOT ACCEPTED 21 $183,624 17 $196,567 0 $0 APPLICATIONS DENIED 2 $188,355 1 $255,000 0 $0 APPLICATIONS WITHDRAWN 6 $172,625 6 $303,435 1 $136,430 FILES CLOSED FOR INCOMPLETENESS 2 $122,000 0 $0 2 $122,000
Aggregated Statistics For Year 2006(Based on 7 full and 12 partial tracts) A) Conventional B) Refinancings C) Non-occupant Loans on Number Average Value Number Average Value Number Average Value
LOANS ORIGINATED 130 $177,179 51 $193,724 19 $138,728 APPLICATIONS APPROVED, NOT ACCEPTED 12 $143,482 6 $163,697 5 $131,290 APPLICATIONS DENIED 0 $0 0 $0 0 $0 APPLICATIONS WITHDRAWN 7 $162,146 0 $0 4 $154,375 FILES CLOSED FOR INCOMPLETENESS 0 $0 0 $0 0 $0
Aggregated Statistics For Year 2005(Based on 7 full and 12 partial tracts) A) Conventional B) Refinancings C) Non-occupant Loans on Number Average Value Number Average Value Number Average Value
LOANS ORIGINATED 167 $153,060 66 $149,068 37 $122,020 APPLICATIONS APPROVED, NOT ACCEPTED 17 $166,506 10 $149,665 5 $113,040 APPLICATIONS DENIED 0 $0 1 $157,000 0 $0 APPLICATIONS WITHDRAWN 8 $132,388 7 $90,884 6 $81,537 FILES CLOSED FOR INCOMPLETENESS 0 $0 0 $0 0 $0
Aggregated Statistics For Year 2004(Based on 7 full and 12 partial tracts) A) Conventional B) Refinancings C) Non-occupant Loans on Number Average Value Number Average Value Number Average Value
LOANS ORIGINATED 189 $130,774 79 $137,622 35 $97,591 APPLICATIONS APPROVED, NOT ACCEPTED 22 $156,874 20 $126,627 6 $149,965 APPLICATIONS DENIED 3 $117,130 0 $0 1 $112,350 APPLICATIONS WITHDRAWN 11 $155,138 2 $117,185 7 $77,174 FILES CLOSED FOR INCOMPLETENESS 0 $0 0 $0 0 $0
Aggregated Statistics For Year 2003(Based on 7 full and 12 partial tracts) A) Conventional B) Refinancings C) Non-occupant Loans on Number Average Value Number Average Value Number Average Value
LOANS ORIGINATED 237 $128,716 313 $120,756 39 $95,811 APPLICATIONS APPROVED, NOT ACCEPTED 30 $134,506 79 $124,327 4 $94,268 APPLICATIONS DENIED 1 $69,940 4 $175,128 2 $105,780 APPLICATIONS WITHDRAWN 18 $120,437 14 $122,036 5 $125,882 FILES CLOSED FOR INCOMPLETENESS 1 $187,000 2 $158,455 0 $0
Aggregated Statistics For Year 2002(Based on 7 full and 10 partial tracts) A) Conventional B) Refinancings C) Non-occupant Loans on Number Average Value Number Average Value Number Average Value
LOANS ORIGINATED 216 $130,904 226 $131,687 20 $101,666 APPLICATIONS APPROVED, NOT ACCEPTED 19 $118,252 33 $120,786 2 $70,835 APPLICATIONS DENIED 1 $77,050 6 $150,275 1 $77,050 APPLICATIONS WITHDRAWN 13 $135,968 11 $138,620 3 $91,233 FILES CLOSED FOR INCOMPLETENESS 0 $0 2 $95,615 0 $0
Aggregated Statistics For Year 2001(Based on 7 full and 10 partial tracts) A) Conventional B) Refinancings C) Non-occupant Loans on Number Average Value Number Average Value Number Average Value
LOANS ORIGINATED 229 $120,592 195 $120,769 24 $89,560 APPLICATIONS APPROVED, NOT ACCEPTED 20 $140,846 35 $117,517 0 $0 APPLICATIONS DENIED 4 $129,220 11 $114,559 0 $0 APPLICATIONS WITHDRAWN 4 $158,600 6 $100,977 1 $84,910 FILES CLOSED FOR INCOMPLETENESS 0 $0 0 $0 0 $0
Aggregated Statistics For Year 2000(Based on 7 full and 10 partial tracts) A) Conventional B) Refinancings C) Non-occupant Loans on Number Average Value Number Average Value Number Average Value
LOANS ORIGINATED 204 $108,479 33 $112,435 15 $110,517 APPLICATIONS APPROVED, NOT ACCEPTED 19 $96,946 9 $126,022 0 $0 APPLICATIONS DENIED 6 $92,883 5 $144,750 0 $0 APPLICATIONS WITHDRAWN 7 $146,943 0 $0 0 $0 FILES CLOSED FOR INCOMPLETENESS 2 $112,615 0 $0 0 $0
Aggregated Statistics For Year 1999(Based on 4 full and 6 partial tracts) A) Conventional B) Refinancings C) Non-occupant Loans on Number Average Value Number Average Value Number Average Value
LOANS ORIGINATED 141 $119,066 48 $123,975 5 $75,554 APPLICATIONS APPROVED, NOT ACCEPTED 6 $121,187 6 $104,343 0 $0 APPLICATIONS DENIED 0 $0 1 $206,610 0 $0 APPLICATIONS WITHDRAWN 3 $110,523 2 $116,045 0 $0 FILES CLOSED FOR INCOMPLETENESS 0 $0 4 $93,415 0 $0
2003 - 2018 National Fire Incident Reporting System (NFIRS) incidents See full 2006 National Fire Incident Reporting System statistics for zip code 99203, Washington
Most common first names in zip code 99203 among deceased individuals Name Count Lived (average)
John 233 78.0 years Mary 185 81.8 years William 177 78.5 years Robert 172 73.5 years Helen 118 82.7 years George 116 77.5 years James 100 76.6 years Margaret 96 82.2 years Ruth 95 81.8 years Dorothy 89 79.9 years
Most common last names in zip code 99203 among deceased individuals Last name Count Lived (average)
Johnson 88 79.3 years Anderson 69 77.7 years Smith 67 82.1 years Miller 51 76.5 years Brown 44 77.0 years Williams 37 78.0 years Nelson 36 82.8 years Peterson 34 78.5 years Davis 32 79.8 years Thompson 28 83.1 years
Businesses in zip code 99203
Name Count Name Count
Albertsons 1 Nike 2 Applebee's 1 Rite Aid 1 Cricket Wireless 1 Starbucks 3 FedEx 1 UPS 1 GNC 1 Vons 1 MasterBrand Cabinets 1 Walgreens 1 McDonald's 1 Wendy's 1

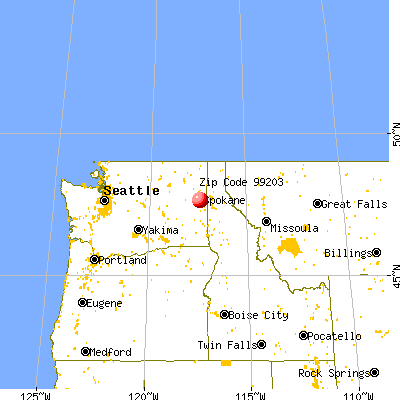


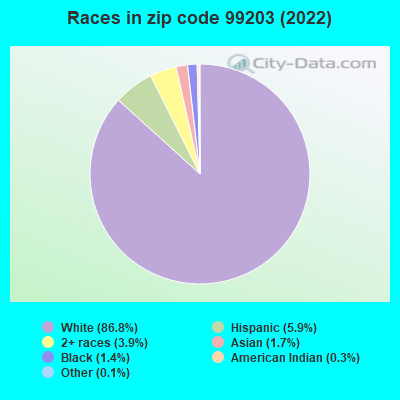


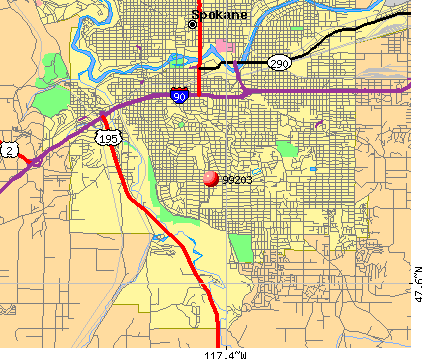 Nearest zip codes: 99204, 99202, 99201, 99207, 99223, 99205.
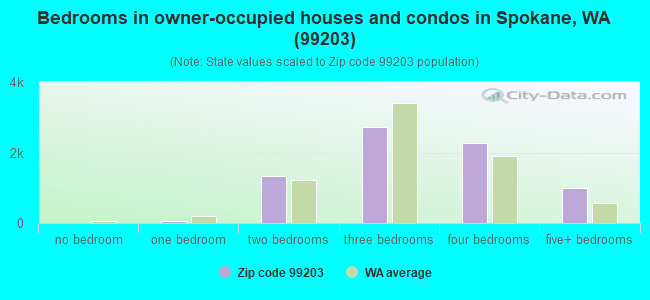


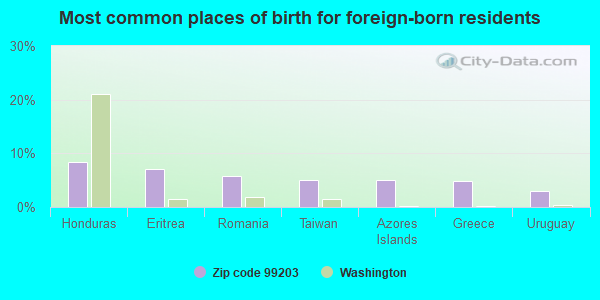
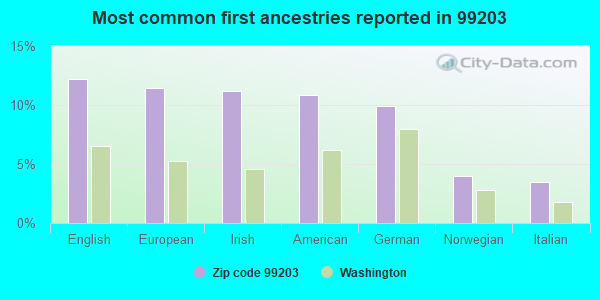
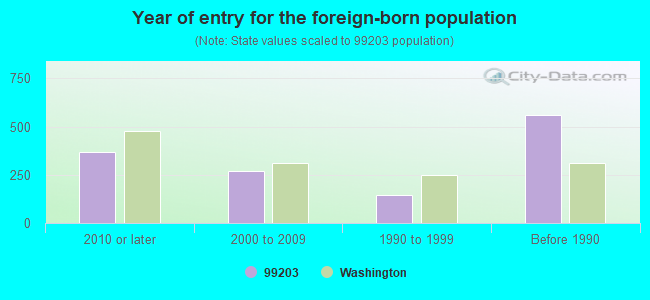

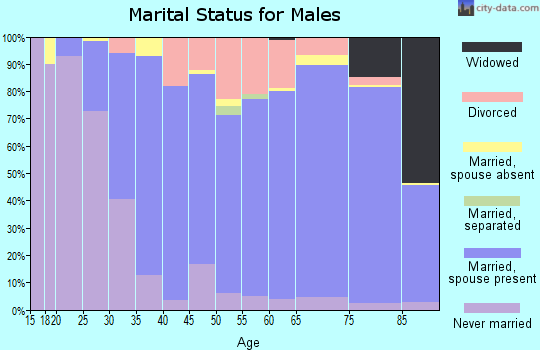

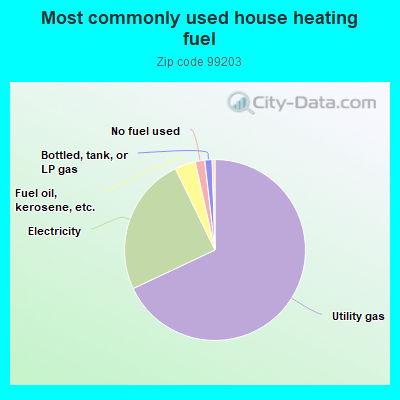
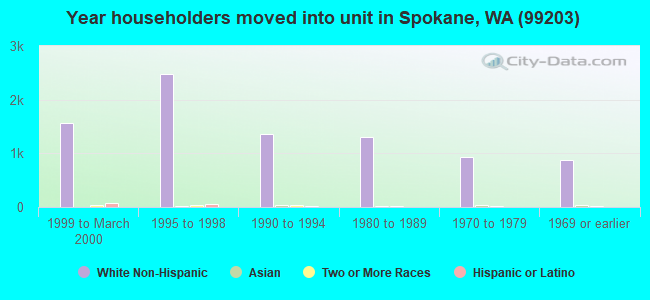
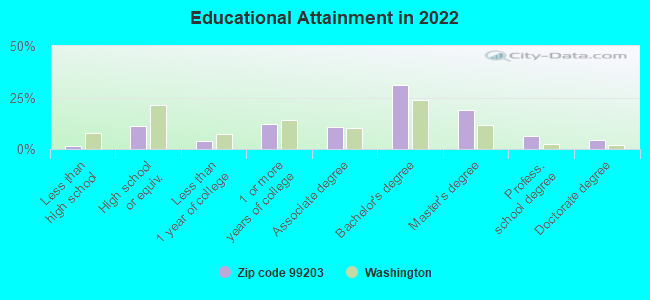

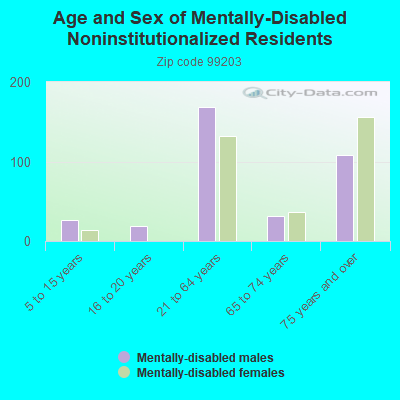
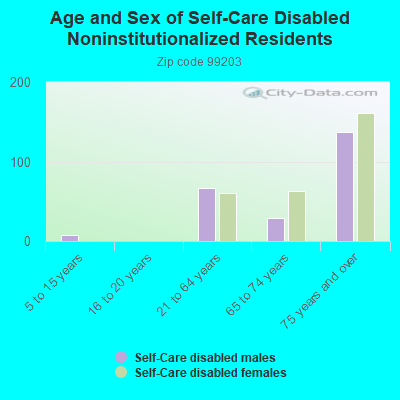
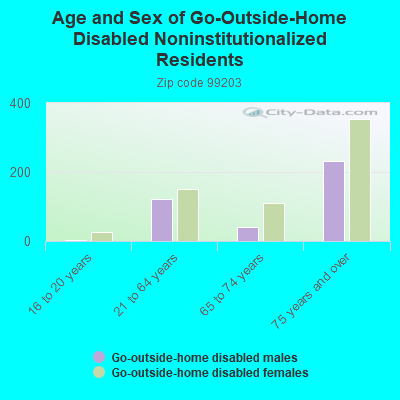
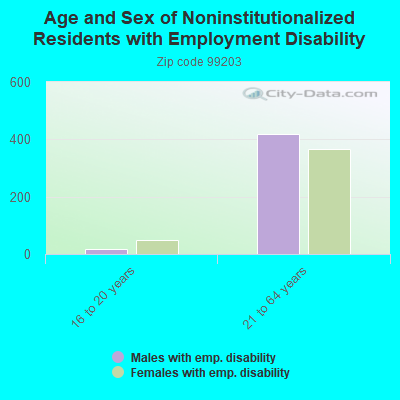
 According to the data from the years 2003 - 2018 the average number of fire incidents per year is 36. The highest number of fires - 55 took place in 2008, and the least - 16 in 2012. The data has a declining trend.
 When looking into fire subcategories, the most reports belonged to: Structure Fires (46.5%), and Outside Fires (38.5%).