Estimated zip code population in 2022: 35,308 Zip code population in 2010: 29,273 Zip code population in 2000: 25,222
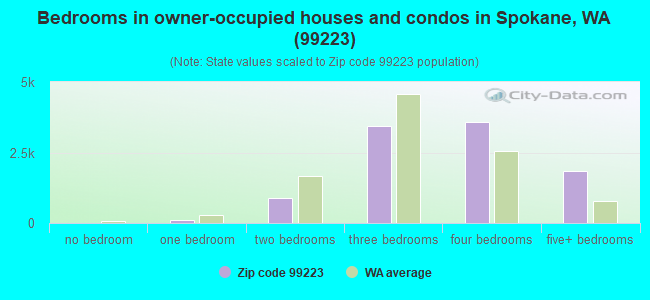
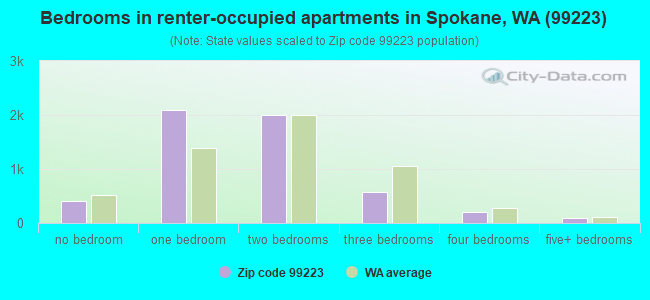
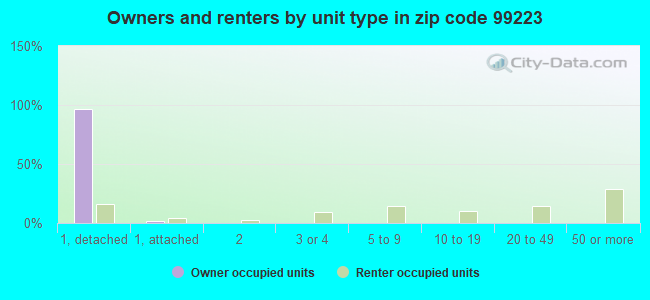
Houses and condos: 15,722 Renter-occupied apartments: 5,326
% of renters here:
35%
State:
36%
March 2022 cost of living index in zip code 99223: 95.4 (near average, U.S. average is 100)
Land area: 28.6 sq. mi. Water area: 0.0 sq. mi.
Population density: 1,233 people per square mile
(low).
OSM Map
General Map
Google Map
MSN Map
OSM Map
General Map
Google Map
MSN Map
OSM Map
General Map
Google Map
MSN Map
OSM Map
General Map
Google Map
MSN Map
Please wait while loading the map...
Real estate property taxes paid for housing units in 2022:
This zip code:
0.8% ($3,898)
Washington:
0.8% ($4,283)
Median real estate property taxes paid for housing units with mortgages in 2022: $3,807 (0.8%) Median real estate property taxes paid for housing units with no mortgage in 2022: $4,152 (0.9%)
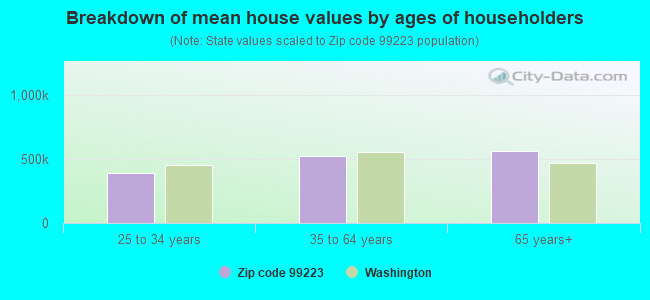
Estimated median house/condo value in 2022: $493,831
99223:
$493,831
Washington:
$569,500
According to our research of Washington and other state lists, there were 4 registered sex offenders living in 99223 zip code as of April 27, 2024. The ratio of all residents to sex offenders in zip code 99223 is 7,945 to 1. The ratio of registered sex offenders to all residents in this zip code is much lower than the state average.
Median resident age:
This zip code:
41.9 years
Washington median age:
38.4 years
Average household size:
This zip code:
2.3 people
Washington:
2.5 people
Averages for the 2020 tax year for zip code 99223, filed in 2021:
Average Adjusted Gross Income (AGI) in 2020: $99,622 (Individual Income Tax Returns)
Here:
$99,622
State:
$99,264
Salary/wage: $74,834 (reported on 77.4% of returns)
Here:
$74,834
State:
$80,347
(% of AGI for various income ranges: 1134.2% for AGIs below $25k, 3383.9% for AGIs $25k-50k, 5970.1% for AGIs $50k-75k, 8837.7% for AGIs $75k-100k, 16943.9% for AGIs $100k-200k, 79306.1% for AGIs over 200k)
Taxable interest for individuals: $2,365 (reported on 44.2% of returns)
This zip code:
$2,365
Washington:
$2,077
(% of AGI for various income ranges: 26.7% for AGIs below $25k, 25.7% for AGIs $25k-50k, 72.0% for AGIs $50k-75k, 139.3% for AGIs $75k-100k, 233.4% for AGIs $100k-200k, 2072.7% for AGIs over 200k)
Ordinary dividends: $12,432 (reported on 28.3% of returns)
Here:
$12,432
State:
$10,013
(% of AGI for various income ranges: 47.5% for AGIs below $25k, 75.1% for AGIs $25k-50k, 200.9% for AGIs $50k-75k, 290.7% for AGIs $75k-100k, 677.2% for AGIs $100k-200k, 8325.0% for AGIs over 200k)
Net capital gain/loss in AGI: +$33,946 (reported on 26.7% of returns)
Here:
+$33,946
State:
+$40,092
(% of AGI for various income ranges: 10.7% for AGIs below $25k, 41.7% for AGIs $25k-50k, 142.3% for AGIs $50k-75k, 317.3% for AGIs $75k-100k, 878.4% for AGIs $100k-200k, 28760.2% for AGIs over 200k)
Profit/loss from business: +$22,525 (reported on 14.5% of returns)
Here:
+$22,525
State:
+$18,312
(% of AGI for various income ranges: 95.7% for AGIs below $25k, 165.7% for AGIs $25k-50k, 281.8% for AGIs $50k-75k, 372.6% for AGIs $75k-100k, 722.0% for AGIs $100k-200k, 5790.5% for AGIs over 200k)
Taxable individual retirement arrangement distribution: $25,669 (reported on 13.2% of returns)
99223:
$25,669
Washington:
$24,221
(% of AGI for various income ranges: 84.1% for AGIs below $25k, 120.7% for AGIs $25k-50k, 304.9% for AGIs $50k-75k, 583.9% for AGIs $75k-100k, 1325.6% for AGIs $100k-200k, 3754.3% for AGIs over 200k)
Self-employed (Keogh) retirement plans: $25,186 (reported on 0.9% of returns)
99223:
$25,186
Washington:
$24,166
(% of AGI for various income ranges: 16.2% for AGIs $50k-75k, 49.0% for AGIs $100k-200k, 561.4% for AGIs over 200k)
Total itemized deductions: $40,434 (reported on 10.0% of returns)
Here:
$40,434
State:
$39,068
(% of AGI for various income ranges: 66.6% for AGIs below $25k, 113.5% for AGIs $25k-50k, 313.5% for AGIs $50k-75k, 438.6% for AGIs $75k-100k, 1011.9% for AGIs $100k-200k, 7833.2% for AGIs over 200k)
Charity contributions: $17,460 (reported on 8.4% of returns)
Here:
$17,460
State:
$15,331
(% of AGI for various income ranges: 4.7% for AGIs below $25k, 12.6% for AGIs $25k-50k, 46.2% for AGIs $50k-75k, 90.7% for AGIs $75k-100k, 268.0% for AGIs $100k-200k, 3984.8% for AGIs over 200k)
Taxes paid: $7,378 (reported on 10.0% of returns)
99223:
$7,378
State:
$7,774
(% of AGI for various income ranges: 11.0% for AGIs below $25k, 18.3% for AGIs $25k-50k, 60.9% for AGIs $50k-75k, 89.2% for AGIs $75k-100k, 218.8% for AGIs $100k-200k, 1291.6% for AGIs over 200k)
Earned income credit: $2,077 (reported on 10.5% of returns)
Here:
$2,077
State:
$2,020
(% of AGI for various income ranges: 64.1% for AGIs below $25k, 56.6% for AGIs $25k-50k, 1.3% for AGIs $50k-75k)
Percentage of individuals using paid preparers for their 2020 taxes: 93.5%
Here:
94%
State:
93%
(% for various income ranges: 92.3% for AGIs below $25k, 94.3% for AGIs $25k-50k, 93.5% for AGIs $50k-75k, 93.3% for AGIs $75k-100k, 93.4% for AGIs $100k-200k, 95.3% for AGIs over 200k)
Averages for the 2012 tax year for zip code 99223, filed in 2013:
Average Adjusted Gross Income (AGI) in 2012: $80,566 (Individual Income Tax Returns)
Here:
$80,566
State:
$69,533
Salary/wage: $61,851 (reported on 79.3% of returns)
Here:
$61,851
State:
$57,267
(% of AGI for various income ranges: 73.3% for AGIs below $25k, 73.7% for AGIs $25k-50k, 70.0% for AGIs $50k-75k, 68.8% for AGIs $75k-100k, 68.0% for AGIs $100k-200k, 47.4% for AGIs over 200k)
Taxable interest for individuals: $2,491 (reported on 44.8% of returns)
This zip code:
$2,491
Washington:
$1,816
(% of AGI for various income ranges: 2.0% for AGIs below $25k, 1.1% for AGIs $25k-50k, 1.3% for AGIs $50k-75k, 1.1% for AGIs $75k-100k, 1.4% for AGIs $100k-200k, 1.4% for AGIs over 200k)
Ordinary dividends: $8,801 (reported on 29.7% of returns)
Here:
$8,801
State:
$8,163
(% of AGI for various income ranges: 3.8% for AGIs below $25k, 2.1% for AGIs $25k-50k, 2.6% for AGIs $50k-75k, 2.4% for AGIs $75k-100k, 2.6% for AGIs $100k-200k, 4.3% for AGIs over 200k)
Net capital gain/loss in AGI: +$23,316 (reported on 25.9% of returns)
Here:
+$23,316
State:
+$21,568
(% of AGI for various income ranges: 0.3% for AGIs $25k-50k, 1.0% for AGIs $50k-75k, 1.0% for AGIs $75k-100k, 1.8% for AGIs $100k-200k, 17.2% for AGIs over 200k)
Profit/loss from business: +$18,320 (reported on 15.3% of returns)
Here:
+$18,320
State:
+$16,521
(% of AGI for various income ranges: 5.8% for AGIs below $25k, 3.3% for AGIs $25k-50k, 3.4% for AGIs $50k-75k, 2.8% for AGIs $75k-100k, 3.8% for AGIs $100k-200k, 3.3% for AGIs over 200k)
Taxable individual retirement arrangement distribution: $20,637 (reported on 14.2% of returns)
99223:
$20,637
Washington:
$18,648
(% of AGI for various income ranges: 4.2% for AGIs below $25k, 3.7% for AGIs $25k-50k, 3.8% for AGIs $50k-75k, 4.1% for AGIs $75k-100k, 5.1% for AGIs $100k-200k, 2.6% for AGIs over 200k)
Self-employment retirement plans: $18,500 (reported on 0.9% of returns)
99223:
$18,500
Washington:
$20,087
(% of AGI for various income ranges: 0.3% for AGIs $25k-50k, 0.2% for AGIs $100k-200k, 0.3% for AGIs over 200k)
Total itemized deductions: $24,053 (16% of AGI, reported on 37.4% of returns)
Here:
$24,053
State:
$23,872
Here:
16.1% of AGI
State:
18.2% of AGI
(% of AGI for various income ranges: 12.6% for AGIs below $25k, 12.0% for AGIs $25k-50k, 13.0% for AGIs $50k-75k, 13.7% for AGIs $75k-100k, 12.8% for AGIs $100k-200k, 8.6% for AGIs over 200k)
Charity contributions: $5,561 (reported on 32.0% of returns)
Here:
$5,561
State:
$4,465
(% of AGI for various income ranges: 1.1% for AGIs below $25k, 1.4% for AGIs $25k-50k, 1.8% for AGIs $50k-75k, 2.1% for AGIs $75k-100k, 2.4% for AGIs $100k-200k, 2.6% for AGIs over 200k)
Taxes paid: $6,549 (reported on 37.1% of returns)
99223:
$6,549
State:
$6,400
(% of AGI for various income ranges: 2.3% for AGIs below $25k, 2.7% for AGIs $25k-50k, 3.3% for AGIs $50k-75k, 3.6% for AGIs $75k-100k, 3.8% for AGIs $100k-200k, 2.5% for AGIs over 200k)
Earned income credit: $1,994 (reported on 12.4% of returns)
Here:
$1,994
State:
$2,073
(% of AGI for various income ranges: 4.6% for AGIs below $25k, 0.8% for AGIs $25k-50k)
Percentage of individuals using paid preparers for their 2012 taxes: 46.7%
Here:
47%
State:
43%
(% for various income ranges: 38.4% for AGIs below $25k, 41.8% for AGIs $25k-50k, 46.5% for AGIs $50k-75k, 51.4% for AGIs $75k-100k, 56.4% for AGIs $100k-200k, 77.8% for AGIs over 200k)
Averages for the 2004 tax year for zip code 99223, filed in 2005:
Average Adjusted Gross Income (AGI) in 2004: $63,696 (Individual Income Tax Returns)
Here:
$63,696
State:
$54,331
Salary/wage: $52,500 (reported on 80.3% of returns)
Here:
$52,500
State:
$45,761
(% of AGI for various income ranges: 149.6% for AGIs below $10k, 73.7% for AGIs $10k-25k, 75.3% for AGIs $25k-50k, 72.3% for AGIs $50k-75k, 73.2% for AGIs $75k-100k, 58.9% for AGIs over 100k)
Taxable interest for individuals: $2,877 (reported on 55.1% of returns)
This zip code:
$2,877
Washington:
$2,110
(% of AGI for various income ranges: 12.5% for AGIs below $10k, 2.8% for AGIs $10k-25k, 2.2% for AGIs $25k-50k, 2.2% for AGIs $50k-75k, 1.9% for AGIs $75k-100k, 2.6% for AGIs over 100k)
Taxable dividends: $4,983 (reported on 36.0% of returns)
Here:
$4,983
State:
$5,879
(% of AGI for various income ranges: 13.4% for AGIs below $10k, 2.9% for AGIs $10k-25k, 2.1% for AGIs $25k-50k, 2.3% for AGIs $50k-75k, 2.4% for AGIs $75k-100k, 3.0% for AGIs over 100k)
Net capital gain/loss: +$11,535 (reported on 32.5% of returns)
Here:
+$11,535
State:
+$15,835
(% of AGI for various income ranges: -0.6% for AGIs below $10k, 0.3% for AGIs $10k-25k, 0.6% for AGIs $25k-50k, 1.3% for AGIs $50k-75k, 2.6% for AGIs $75k-100k, 9.7% for AGIs over 100k)
Profit/loss from business: +$17,776 (reported on 16.4% of returns)
Here:
+$17,776
State:
+$13,994
(% of AGI for various income ranges: 0.3% for AGIs below $10k, 4.9% for AGIs $10k-25k, 3.5% for AGIs $25k-50k, 3.9% for AGIs $50k-75k, 3.9% for AGIs $75k-100k, 5.2% for AGIs over 100k)
IRA payment deduction: $3,226 (reported on 3.4% of returns)
99223:
$3,226
Washington:
$3,001
(% of AGI for various income ranges: 0.6% for AGIs below $10k, 0.2% for AGIs $10k-25k, 0.3% for AGIs $25k-50k, 0.3% for AGIs $50k-75k, 0.2% for AGIs $75k-100k, 0.1% for AGIs over 100k)
Self-employed pension: $15,379 (reported on 1.6% of returns)
Here:
$15,379
Washington:
$14,244
(% of AGI for various income ranges: 0.1% for AGIs $10k-25k, 0.1% for AGIs $50k-75k, 0.3% for AGIs $75k-100k, 0.6% for AGIs over 100k)
Total itemized deductions: $19,117 (18% of AGI, reported on 41.1% of returns)
Here:
$19,117
State:
$19,669
Here:
18.0% of AGI
State:
20.7% of AGI
(% of AGI for various income ranges: 29.5% for AGIs below $10k, 13.2% for AGIs $10k-25k, 14.2% for AGIs $25k-50k, 15.2% for AGIs $50k-75k, 14.8% for AGIs $75k-100k, 10.2% for AGIs over 100k)
Charity contributions deductions: $4,257 (4% of AGI, reported on 37.1% of returns)
Here:
$4,257
State:
$3,569
Here:
3.8% of AGI
State:
3.5% of AGI
(% of AGI for various income ranges: 1.8% for AGIs below $10k, 1.5% for AGIs $10k-25k, 1.8% for AGIs $25k-50k, 2.3% for AGIs $50k-75k, 2.7% for AGIs $75k-100k, 2.8% for AGIs over 100k)
Total tax: $11,883 (reported on 79.5% of returns)
99223:
$11,883
State:
$9,065
(% of AGI for various income ranges: 4.2% for AGIs below $10k, 4.5% for AGIs $10k-25k, 6.9% for AGIs $25k-50k, 9.0% for AGIs $50k-75k, 10.7% for AGIs $75k-100k, 20.3% for AGIs over 100k)
Earned income credit: $1,513 (reported on 9.1% of returns)
Here:
$1,513
State:
$1,607
Percentage of individuals using paid preparers for their 2004 taxes: 50.5%
Here:
50%
State:
49%
(% for various income ranges: 42.2% for AGIs below $10k, 46.6% for AGIs $10k-25k, 49.1% for AGIs $25k-50k, 49.9% for AGIs $50k-75k, 51.3% for AGIs $75k-100k, 67.5% for AGIs over 100k)
Likely homosexual households (counted as self-reported same-sex unmarried-partner households)
Lesbian couples: 0.0% of all households
Gay men: 0.1% of all households
Household received Food Stamps/SNAP in the past 12 months: 1,748 Household did not receive Food Stamps/SNAP in the past 12 months: 13,412
Women who had a birth in the past 12 months: 320 (276 now married, 47 unmarried) Women who did not have a birth in the past 12 months: 7,038 (3,488 now married, 3,539 unmarried)
Housing units in zip code 99223 with a mortgage: 6,690 (849 second mortgage, 228 home equity loan, 679 both second mortgage and home equity loan) Houses without a mortgage: 274
Median monthly owner costs for units with a mortgage: $1,891 Median monthly owner costs for units without a mortgage: $725
Residents with income below the poverty level in 2022:
This zip code:
8.5%
Whole state:
10.0%
Residents with income below 50% of the poverty level in 2022:
This zip code:
2.4%
Whole state:
4.6%
Median number of rooms in houses and condos:
Here:
7.7
State:
6.5
Median number of rooms in apartments:
Here:
3.4
State:
3.9
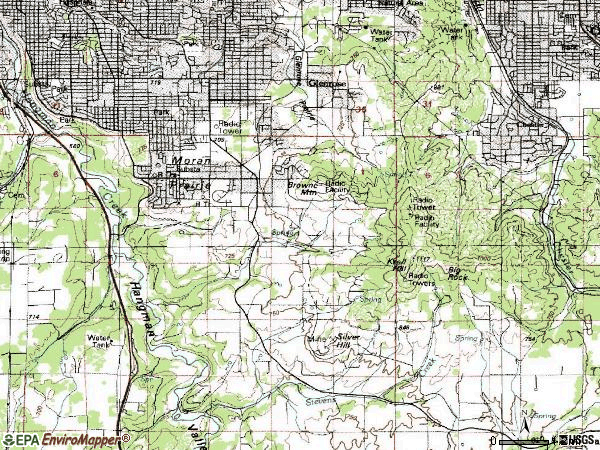
Notable locations in this zip code not listed on our city pages
Notable locations in zip code 99223: Hangman Valley Golf Course (A), Manito Golf Country Club (B), Immaculate Heart Retreat (C), Morning Star Ranch (D), Willow Springs (E), Pantops (F), Piedmont (G), Parkview (H), Willow Springs (I), Moran (J), Kiesling (K), Hillby (L), Spokane County Fire District 8 Station 81 (M), Spokane Fire Department Station 14 (N). Display/hide their locations on the map
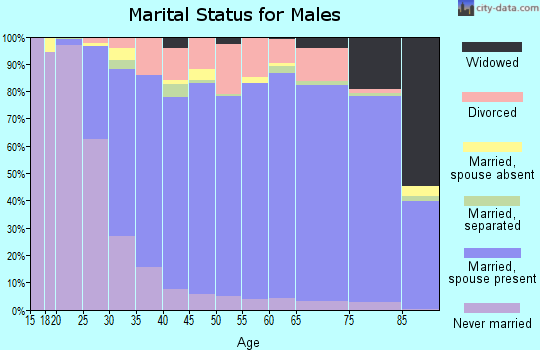
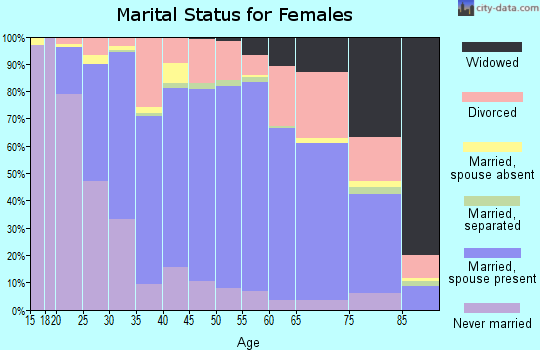
5,602 married couples with children.
1,694 single-parent households (811 men, 883 women).
90.5% of residents of 99223 zip code speak English at home.
2.8% of residents speak Spanish at home (69% very well, 16% well, 12% not well, 2% not at all).
2.7% of residents speak other Indo-European language at home (67% very well, 8% well, 19% not well, 5% not at all).
2.1% of residents speak Asian or Pacific Island language at home (43% very well, 30% well, 19% not well, 8% not at all).
1.7% of residents speak other language at home (47% very well, 20% well, 12% not well, 21% not at all).
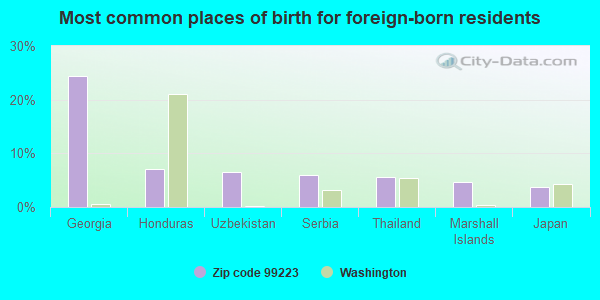
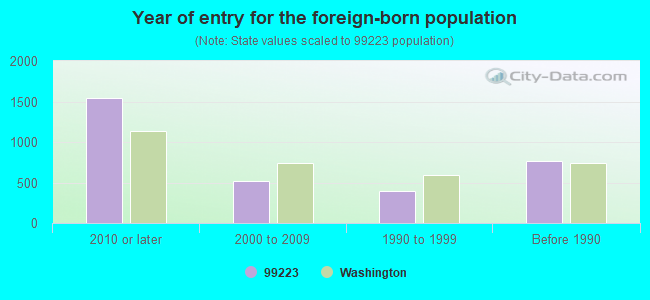
Foreign born population: 2,742 (7.8%) (54.4% of them are naturalized citizens)
Facilities with environmental interests located in this zip code:
CLASSIC CLEANERS 2 (E 3005 29TH in SPOKANE, WA)
Conditionally Exempt Small Quantity Generators, less than 100 kg/month of hazardous waste (Resource Conservation and Recovery Act (tracking hazardous waste)) STATE MASTER (Washington State Department of Ecology's Facility/Site identification system) - HAZWASTE-WAD988521258, CESQG Business SIC classification: DRYCLEANING PLANTS, EXCEPT RUG CLEANING; LAUNDRY AND GARMENT SERVICES Organizations: LEE CLIFFORD (CONTACT/OPERATOR)
ADAMS ELEMENTARY SCHOOL (2909 EAST 37TH AVENUE in SPOKANE, WA)
COMPLIANCE ACTIVITY (Tracking inspections of insecticide, fungicide, and rodenticide, and toxic substances) (National Center for Education Statistics) - STATE ID-2156 Organizations: SPOKANE SCH DIST 81 (SCHOOL DISTRICT)
ANGEL OF THE WINDS CASINO (3438 STOLUCKQUAMISH LANE in ARLINGTON, WA) . Tribal Land
ENFORCEMENT/COMPLIANCE ACTIVITY (Integrated Compliance Information System)
Housing units lacking complete plumbing facilities: 0.4% Housing units lacking complete kitchen facilities: 3.3%
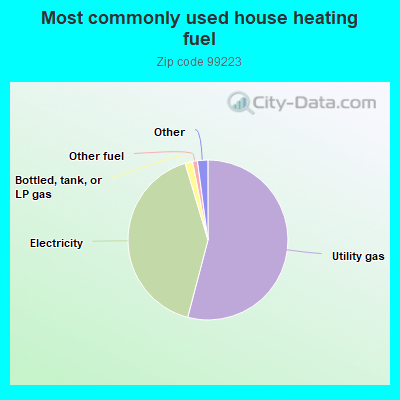
54.1%Utility gas
41.3%Electricity
1.5%Bottled, tank, or LP gas
1.0%Other fuel
0.9%Wood
0.9%Fuel oil, kerosene, etc.
Population in 1990: 19,056. Population change in the 1990s: +6,166 (+32.4%).
Place of birth for U.S.-born residents:
This state: 16,961
Northeast: 1,623
Midwest: 2,871
South: 2,564
West: 8,050
57% of the 99223 zip code residents lived in the same house 5 years ago. Out of people who lived in different houses, 64% lived in this county. Out of people who lived in different counties, 50% lived in Washington.
88% of the 99223 zip code residents lived in the same house 1 year ago. Out of people who lived in different houses, 60% moved from this county. Out of people who lived in different houses, 17% moved from different county within same state. Out of people who lived in different houses, 20% moved from different state. Out of people who lived in different houses, 3% moved from abroad.
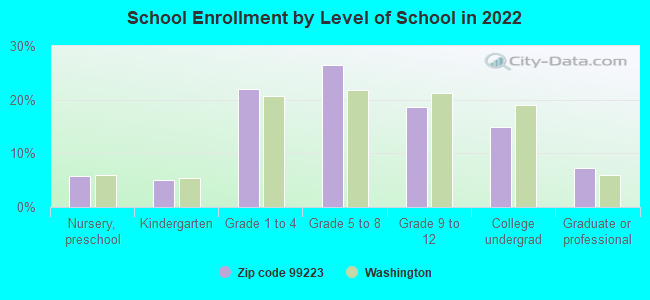
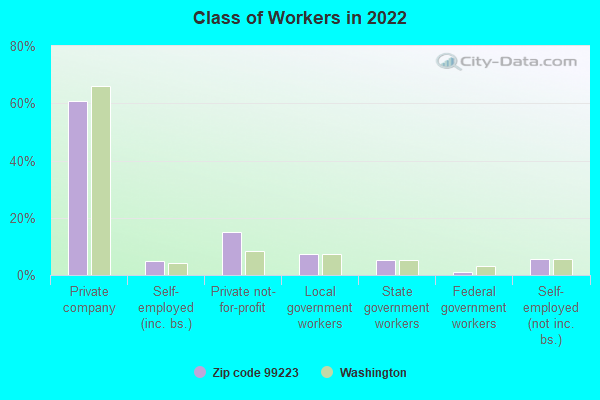
Private vs. public school enrollment:
Students in private schools in grades 1 to 8 (elementary and middle school): 844
Here:
21.4%
Washington:
12.4%
Students in private schools in grades 9 to 12 (high school): 200
Here:
13.2%
Washington:
9.2%
Students in private undergraduate colleges: 296
Here:
24.7%
Washington:
16.5%
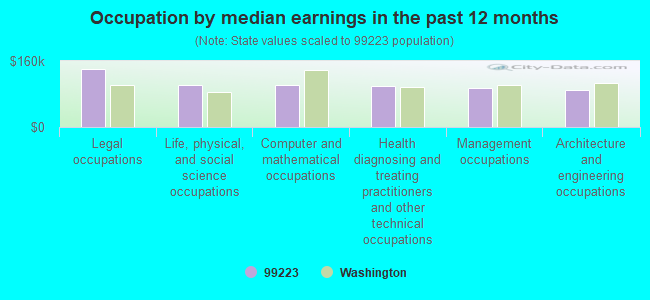
Occupation by median earnings in the past 12 months ($)
140,831Legal occupations
101,715Life, physical, and social science occupations
100,905Computer and mathematical occupations
99,060Health diagnosing and treating practitioners and other technical occupations
95,142Management occupations
90,823Architecture and engineering occupations
Companies with federal contracts located in this zip code (SPOKANE, WA):
24 HOUR FITNESS/OZ FITNESS (S5505 REGAL) : $30,228 in 5 contractsfrom 2002 to 2005
Contracts for Construction of Structures and Facilities -- Recreational Buildings, Other Education and Training Services, Tuition, Registration, and Membership Fees by Army Signed by year:2000: $0; 2001: $0; 2002: $9,140; 2003: $8,568; 2004: $7,988; 2005: $4,532; 2006: $0.
Biggest contracts:
$9,140 with Army for Construction of Structures and Facilities -- Recreational Buildings. Taking place in OR. Signed on 2002-10-30. Completion date: 2003-09-30.
$8,568 with Army for Other Education and Training Services. Taking place in OR. Signed on 2003-10-17. Completion date: 2004-09-30.
$7,988, same as above.Signed on 2004-10-25. Completion date: 2005-09-30.
$4,532 with Army for Tuition, Registration, and Membership Fees. Signed on 2005-10-25. Completion date: 2006-09-30.
SOUTH REGAL LUMBER YARD INC (5415 S REGAL ST; small business) : $26,222 in 7 contractsfrom 2004 to 2005
Contracts for Building Components, Prefabricated, Miscellaneous Construction Materials, Nonwood Construction Lumber and Related Materials, Tile, Brick, and Block by Army Signed by year:2000: $0; 2001: $0; 2002: $0; 2003: $0; 2004: $10,120; 2005: $16,102; 2006: $0.
Biggest contracts:
$7,950 with Army for Building Components, Prefabricated. Signed on 2005-05-17. Completion date: 2005-05-31.
$5,899 with Army for Miscellaneous Construction Materials. Signed on 2004-06-11. Completion date: 2004-06-17.
$5,230 with Army for Nonwood Construction Lumber and Related Materials. Signed on 2004-04-20. Completion date: 2004-04-26.
$4,958 with Army for Tile, Brick, and Block. Signed on 2005-06-14. Completion date: 2005-06-20.
INLAND TREE SERVICE INC (10220 S SHARON RD; small business) : $12,625 in 2 contractsfrom 2005 to 2006
$11,000 with Air Force for Tree Thinning Services. Signed on 2006-04-10. Completion date: 2006-04-28.
$1,625 with Air Force for Landscaping/Groundskeeping Services. Signed on 2005-09-13. Completion date: 2005-09-20.
CITADEL COMMUNICATIONS CORPORA (1601 E 57TH; small business)
$8,498 with Army for Advertising Services. Signed on 2006-05-23. Completion date: 2006-12-10.
SIGISMONTI, KIM (3514 E 36TH AVE; small business) : $6,300 in 2 contractsfrom 2002 to 2003
$16,000 with Army for Other Professional Services. Taking place in MD. Signed on 2002-04-15. Completion date: 2002-09-30.
-$9,700, same as above.Signed on 2003-06-09. Completion date: 2002-09-30.
C P F MONEY PROCESSING SYSTEMS (5412 S GARFIELD ST; small business)
$4,713 with Air Force for Miscellaneous Office Machines. Signed on 2005-07-21. Completion date: 2005-02-23.
CORRECTIONS LEARNING NETWORK (4202 S. REGAL; small business)
$317 with Bureau of Prisoners/Federal Prison System for . Taking place in TX. Signed on 2006-03-22. Completion date: 2006-04-05.
Top industries in this zip code by the number of employees in 2005:
2002 - 2018 National Fire Incident Reporting System (NFIRS) incidents
According to the data from the years 2002 - 2018 the average number of fire incidents per year is 55. The highest number of fires - 90 took place in 2003, and the least - 16 in 2013. The data has a growing trend.
When looking into fire subcategories, the most incidents belonged to: Outside Fires (40.9%), and Structure Fires (39.8%).
Fire incident types reported to NFIRS in Zip Code 99223

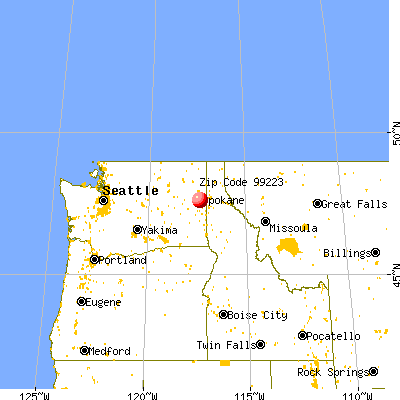


 Nearest zip codes: 99203, 99202, 99212, 99036, 99206, 99204.


 According to the data from the years 2002 - 2018 the average number of fire incidents per year is 55. The highest number of fires - 90 took place in 2003, and the least - 16 in 2013. The data has a growing trend.
 When looking into fire subcategories, the most incidents belonged to: Outside Fires (40.9%), and Structure Fires (39.8%).