Estimated zip code population in 2022: 10,203 Zip code population in 2010: 9,202 Zip code population in 2000: 8,455
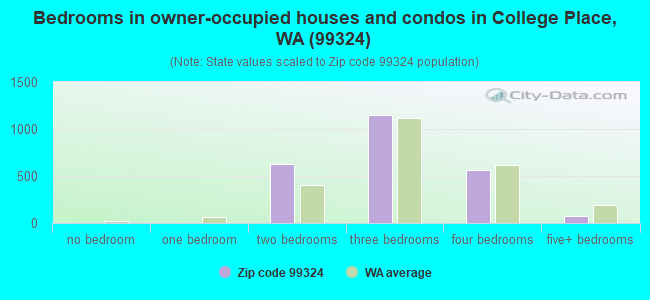
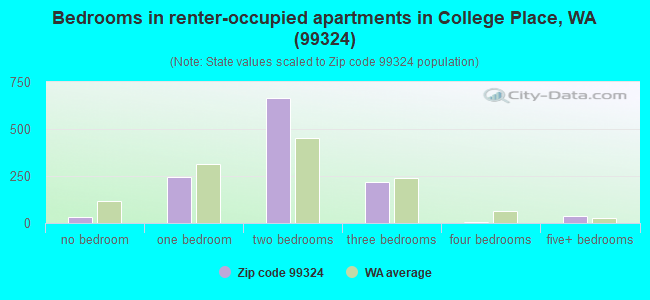
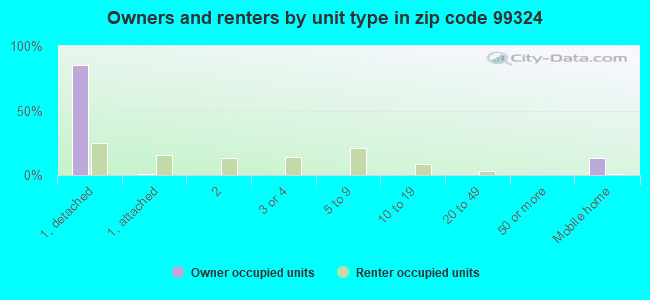
Houses and condos: 3,951 Renter-occupied apartments: 1,199
% of renters here:
33%
State:
36%
March 2022 cost of living index in zip code 99324: 90.3 (less than average, U.S. average is 100)
Land area: 3.0 sq. mi. Water area: 0.0 sq. mi.
Population density: 3,346 people per square mile
(average).
OSM Map
General Map
Google Map
MSN Map
OSM Map
General Map
Google Map
MSN Map
OSM Map
General Map
Google Map
MSN Map
OSM Map
General Map
Google Map
MSN Map
Please wait while loading the map...
Real estate property taxes paid for housing units in 2022:
This zip code:
0.9% ($3,127)
Washington:
0.8% ($4,283)
Median real estate property taxes paid for housing units with mortgages in 2022: $3,394 (0.8%) Median real estate property taxes paid for housing units with no mortgage in 2022: $2,605 (1.0%)
Business Search- 14 Million verified businesses
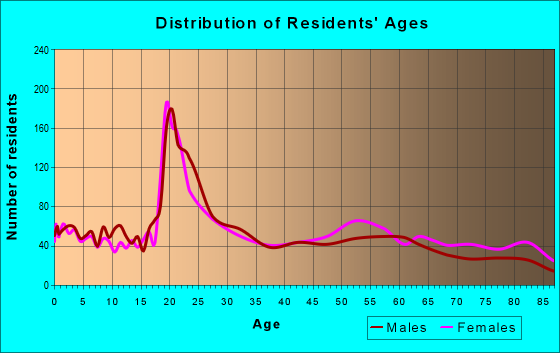
Males: 4,746
(46.5%)
Females: 5,456
(53.5%)
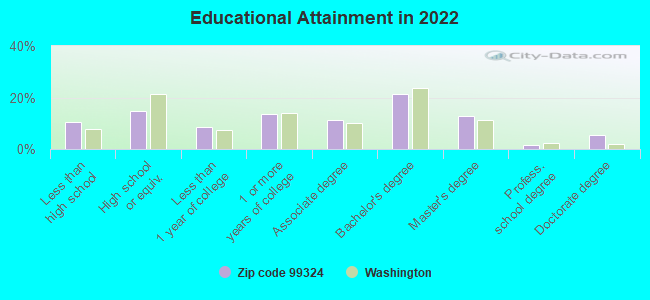
For population 25 years and over in 99324:
High school or higher: 89.2%
Bachelor's degree or higher: 41.2%
Graduate or professional degree: 19.8%
Unemployed: 4.5%
Mean travel time to work (commute): 11.7 minutes
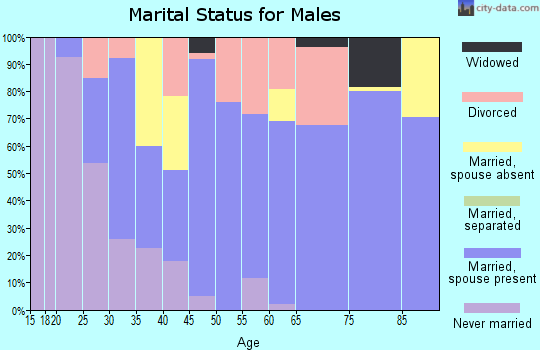
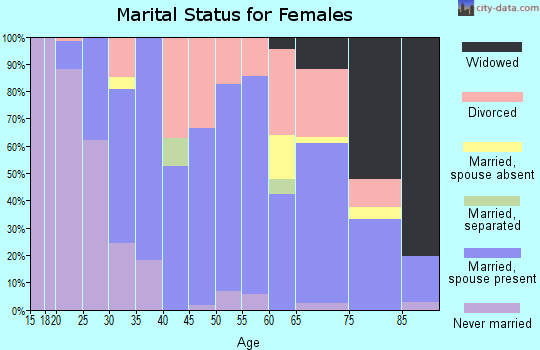
For population 15 years and over in 99324:
Never married: 39.0%
Now married: 47.6%
Separated: 1.8%
Widowed: 3.9%
Divorced: 7.7%
Zip code 99324 compared to state average:
Median house value below state average.
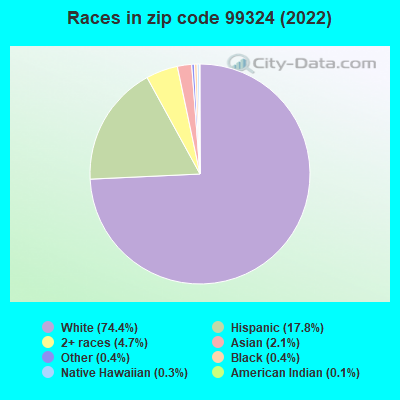
Black race population percentage significantly below state average.
Median age below state average.
Foreign-born population percentage below state average.
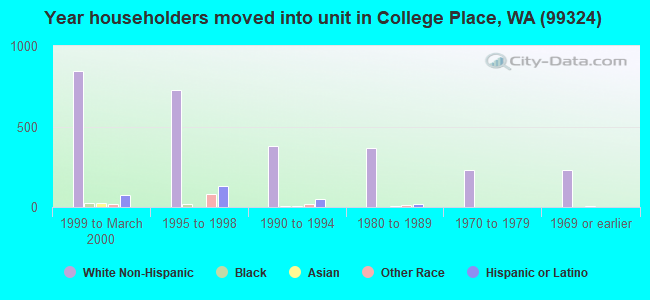
Length of stay since moving in significantly above state average.
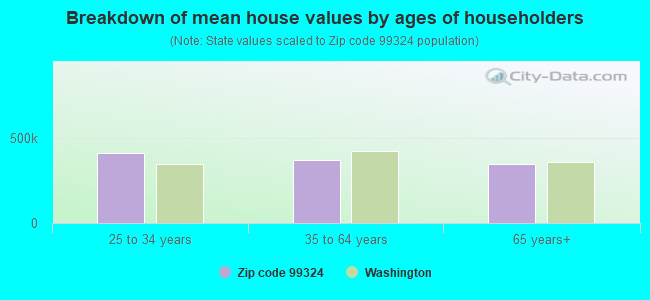
Estimated median house/condo value in 2022: $365,351
99324:
$365,351
Washington:
$569,500
According to our research of Washington and other state lists, there were 4 registered sex offenders living in 99324 zip code as of April 27, 2024. The ratio of all residents to sex offenders in zip code 99324 is 2,415 to 1. The ratio of registered sex offenders to all residents in this zip code is lower than the state average.
Median resident age:
This zip code:
34.0 years
Washington median age:
38.4 years
Average household size:
This zip code:
2.5 people
Washington:
2.5 people
Averages for the 2020 tax year for zip code 99324, filed in 2021:
Average Adjusted Gross Income (AGI) in 2020: $56,826 (Individual Income Tax Returns)
Here:
$56,826
State:
$99,264
Salary/wage: $51,177 (reported on 79.8% of returns)
Here:
$51,177
State:
$80,347
(% of AGI for various income ranges: 1215.5% for AGIs below $25k, 3488.7% for AGIs $25k-50k, 6548.2% for AGIs $50k-75k, 9238.8% for AGIs $75k-100k, 18289.6% for AGIs $100k-200k, 50260.0% for AGIs over 200k)
Taxable interest for individuals: $1,265 (reported on 29.9% of returns)
This zip code:
$1,265
Washington:
$2,077
(% of AGI for various income ranges: 30.0% for AGIs below $25k, 30.9% for AGIs $25k-50k, 49.0% for AGIs $50k-75k, 66.9% for AGIs $75k-100k, 152.9% for AGIs $100k-200k, 452.5% for AGIs over 200k)
Ordinary dividends: $3,644 (reported on 14.7% of returns)
Here:
$3,644
State:
$10,013
(% of AGI for various income ranges: 17.3% for AGIs below $25k, 30.0% for AGIs $25k-50k, 71.2% for AGIs $50k-75k, 91.2% for AGIs $75k-100k, 274.3% for AGIs $100k-200k, 1172.5% for AGIs over 200k)
Net capital gain/loss in AGI: +$10,726 (reported on 14.9% of returns)
Here:
+$10,726
State:
+$40,092
(% of AGI for various income ranges: 14.0% for AGIs below $25k, 23.2% for AGIs $25k-50k, 84.3% for AGIs $50k-75k, 148.8% for AGIs $75k-100k, 961.8% for AGIs $100k-200k, 7567.5% for AGIs over 200k)
Profit/loss from business: +$10,414 (reported on 13.1% of returns)
Here:
+$10,414
State:
+$18,312
(% of AGI for various income ranges: 56.7% for AGIs below $25k, 89.7% for AGIs $25k-50k, 169.8% for AGIs $50k-75k, 255.6% for AGIs $75k-100k, 667.9% for AGIs $100k-200k, 2547.5% for AGIs over 200k)
Taxable individual retirement arrangement distribution: $15,579 (reported on 9.9% of returns)
99324:
$15,579
Washington:
$24,221
(% of AGI for various income ranges: 57.6% for AGIs below $25k, 110.6% for AGIs $25k-50k, 159.4% for AGIs $50k-75k, 330.3% for AGIs $75k-100k, 1167.9% for AGIs $100k-200k)
Total itemized deductions: $35,588 (reported on 7.6% of returns)
Here:
$35,588
State:
$39,068
(% of AGI for various income ranges: 116.1% for AGIs below $25k, 167.1% for AGIs $25k-50k, 247.6% for AGIs $50k-75k, 618.8% for AGIs $75k-100k, 1273.6% for AGIs $100k-200k, 5732.5% for AGIs over 200k)
Charity contributions: $15,724 (reported on 6.7% of returns)
Here:
$15,724
State:
$15,331
(% of AGI for various income ranges: 16.9% for AGIs below $25k, 57.3% for AGIs $25k-50k, 89.8% for AGIs $50k-75k, 218.4% for AGIs $75k-100k, 561.8% for AGIs $100k-200k, 2870.0% for AGIs over 200k)
Taxes paid: $5,636 (reported on 7.6% of returns)
99324:
$5,636
State:
$7,774
(% of AGI for various income ranges: 16.9% for AGIs below $25k, 21.6% for AGIs $25k-50k, 47.5% for AGIs $50k-75k, 92.8% for AGIs $75k-100k, 217.1% for AGIs $100k-200k, 882.5% for AGIs over 200k)
Earned income credit: $2,122 (reported on 13.3% of returns)
Here:
$2,122
State:
$2,020
(% of AGI for various income ranges: 68.3% for AGIs below $25k, 62.4% for AGIs $25k-50k)
Percentage of individuals using paid preparers for their 2020 taxes: 94.3%
Here:
94%
State:
93%
(% for various income ranges: 93.5% for AGIs below $25k, 93.9% for AGIs $25k-50k, 93.1% for AGIs $50k-75k, 95.7% for AGIs $75k-100k, 96.3% for AGIs $100k-200k, 100.0% for AGIs over 200k)
Averages for the 2012 tax year for zip code 99324, filed in 2013:
Average Adjusted Gross Income (AGI) in 2012: $42,538 (Individual Income Tax Returns)
Here:
$42,538
State:
$69,533
Salary/wage: $38,565 (reported on 82.3% of returns)
Here:
$38,565
State:
$57,267
(% of AGI for various income ranges: 74.6% for AGIs below $25k, 78.5% for AGIs $25k-50k, 78.4% for AGIs $50k-75k, 75.1% for AGIs $75k-100k, 73.5% for AGIs $100k-200k, 57.8% for AGIs over 200k)
Taxable interest for individuals: $1,110 (reported on 31.9% of returns)
This zip code:
$1,110
Washington:
$1,816
(% of AGI for various income ranges: 1.3% for AGIs below $25k, 0.8% for AGIs $25k-50k, 0.9% for AGIs $50k-75k, 0.9% for AGIs $75k-100k, 0.6% for AGIs $100k-200k, 0.3% for AGIs over 200k)
Ordinary dividends: $3,104 (reported on 13.0% of returns)
Here:
$3,104
State:
$8,163
(% of AGI for various income ranges: 1.5% for AGIs below $25k, 0.8% for AGIs $25k-50k, 1.0% for AGIs $50k-75k, 0.6% for AGIs $75k-100k, 1.0% for AGIs $100k-200k, 0.8% for AGIs over 200k)
Net capital gain/loss in AGI: +$2,283 (reported on 9.4% of returns)
Here:
+$2,283
State:
+$21,568
(% of AGI for various income ranges: 0.5% for AGIs $50k-75k, 0.4% for AGIs $75k-100k, 1.8% for AGIs $100k-200k)
Profit/loss from business: +$10,284 (reported on 14.3% of returns)
Here:
+$10,284
State:
+$16,521
(% of AGI for various income ranges: 3.4% for AGIs below $25k, 2.9% for AGIs $25k-50k, 1.9% for AGIs $50k-75k, 2.9% for AGIs $75k-100k, 3.8% for AGIs $100k-200k, 8.8% for AGIs over 200k)
Taxable individual retirement arrangement distribution: $11,355 (reported on 10.9% of returns)
99324:
$11,355
Washington:
$18,648
(% of AGI for various income ranges: 2.9% for AGIs below $25k, 2.1% for AGIs $25k-50k, 2.3% for AGIs $50k-75k, 3.7% for AGIs $75k-100k, 4.8% for AGIs $100k-200k)
Total itemized deductions: $19,599 (27% of AGI, reported on 28.3% of returns)
Here:
$19,599
State:
$23,872
Here:
27.2% of AGI
State:
18.2% of AGI
(% of AGI for various income ranges: 13.7% for AGIs below $25k, 12.8% for AGIs $25k-50k, 12.4% for AGIs $50k-75k, 13.6% for AGIs $75k-100k, 13.5% for AGIs $100k-200k, 11.8% for AGIs over 200k)
Charity contributions: $7,095 (reported on 24.2% of returns)
Here:
$7,095
State:
$4,465
(% of AGI for various income ranges: 2.6% for AGIs below $25k, 3.5% for AGIs $25k-50k, 3.5% for AGIs $50k-75k, 4.1% for AGIs $75k-100k, 4.9% for AGIs $100k-200k, 6.7% for AGIs over 200k)
Taxes paid: $3,724 (reported on 28.1% of returns)
99324:
$3,724
State:
$6,400
(% of AGI for various income ranges: 1.9% for AGIs below $25k, 2.1% for AGIs $25k-50k, 2.3% for AGIs $50k-75k, 2.7% for AGIs $75k-100k, 3.0% for AGIs $100k-200k, 2.5% for AGIs over 200k)
Earned income credit: $2,062 (reported on 18.7% of returns)
Here:
$2,062
State:
$2,073
(% of AGI for various income ranges: 5.3% for AGIs below $25k, 1.1% for AGIs $25k-50k)
Percentage of individuals using paid preparers for their 2012 taxes: 44.2%
Here:
44%
State:
43%
(% for various income ranges: 39.9% for AGIs below $25k, 45.4% for AGIs $25k-50k, 46.2% for AGIs $50k-75k, 45.2% for AGIs $75k-100k, 55.6% for AGIs $100k-200k, 80.0% for AGIs over 200k)
Averages for the 2004 tax year for zip code 99324, filed in 2005:
Average Adjusted Gross Income (AGI) in 2004: $34,561 (Individual Income Tax Returns)
Here:
$34,561
State:
$54,331
Salary/wage: $31,254 (reported on 82.5% of returns)
Here:
$31,254
State:
$45,761
(% of AGI for various income ranges: 111.1% for AGIs below $10k, 71.4% for AGIs $10k-25k, 75.4% for AGIs $25k-50k, 80.3% for AGIs $50k-75k, 80.0% for AGIs $75k-100k, 60.0% for AGIs over 100k)
Taxable interest for individuals: $1,580 (reported on 45.9% of returns)
This zip code:
$1,580
Washington:
$2,110
(% of AGI for various income ranges: 5.0% for AGIs below $10k, 3.1% for AGIs $10k-25k, 2.1% for AGIs $25k-50k, 1.4% for AGIs $50k-75k, 2.3% for AGIs $75k-100k, 1.8% for AGIs over 100k)
Taxable dividends: $2,143 (reported on 16.6% of returns)
Here:
$2,143
State:
$5,879
(% of AGI for various income ranges: 1.9% for AGIs below $10k, 1.3% for AGIs $10k-25k, 1.0% for AGIs $25k-50k, 0.9% for AGIs $50k-75k, 1.0% for AGIs $75k-100k, 0.9% for AGIs over 100k)
Net capital gain/loss: +$8,035 (reported on 15.0% of returns)
Here:
+$8,035
State:
+$15,835
(% of AGI for various income ranges: -1.5% for AGIs below $10k, 1.2% for AGIs $10k-25k, 0.8% for AGIs $25k-50k, 1.2% for AGIs $50k-75k, 2.7% for AGIs $75k-100k, 12.3% for AGIs over 100k)
Profit/loss from business: +$12,627 (reported on 15.7% of returns)
Here:
+$12,627
State:
+$13,994
(% of AGI for various income ranges: 6.7% for AGIs below $10k, 3.4% for AGIs $10k-25k, 3.3% for AGIs $25k-50k, 2.6% for AGIs $50k-75k, 4.4% for AGIs $75k-100k, 14.8% for AGIs over 100k)
IRA payment deduction: $3,069 (reported on 2.6% of returns)
99324:
$3,069
Washington:
$3,001
(% of AGI for various income ranges: 0.1% for AGIs $10k-25k, 0.4% for AGIs $25k-50k, 0.4% for AGIs $50k-75k, 0.2% for AGIs over 100k)
Self-employed pension: $6,938 (reported on 0.5% of returns)
Here:
$6,938
Washington:
$14,244
Total itemized deductions: $17,344 (29% of AGI, reported on 30.3% of returns)
Here:
$17,344
State:
$19,669
Here:
28.7% of AGI
State:
20.7% of AGI
(% of AGI for various income ranges: 16.4% for AGIs below $10k, 14.0% for AGIs $10k-25k, 14.2% for AGIs $25k-50k, 15.6% for AGIs $50k-75k, 16.9% for AGIs $75k-100k, 15.2% for AGIs over 100k)
Charity contributions deductions: $6,569 (11% of AGI, reported on 27.6% of returns)
Here:
$6,569
State:
$3,569
Here:
10.6% of AGI
State:
3.5% of AGI
(% of AGI for various income ranges: 2.2% for AGIs below $10k, 4.3% for AGIs $10k-25k, 4.1% for AGIs $25k-50k, 5.1% for AGIs $50k-75k, 6.1% for AGIs $75k-100k, 7.2% for AGIs over 100k)
Total tax: $4,423 (reported on 68.4% of returns)
99324:
$4,423
State:
$9,065
(% of AGI for various income ranges: 2.5% for AGIs below $10k, 3.7% for AGIs $10k-25k, 6.3% for AGIs $25k-50k, 8.3% for AGIs $50k-75k, 10.0% for AGIs $75k-100k, 15.6% for AGIs over 100k)
Earned income credit: $1,582 (reported on 15.4% of returns)
Here:
$1,582
State:
$1,607
Percentage of individuals using paid preparers for their 2004 taxes: 51.2%
Here:
51%
State:
49%
(% for various income ranges: 43.0% for AGIs below $10k, 52.9% for AGIs $10k-25k, 54.3% for AGIs $25k-50k, 53.6% for AGIs $50k-75k, 51.4% for AGIs $75k-100k, 64.0% for AGIs over 100k)
Likely homosexual households (counted as self-reported same-sex unmarried-partner households)
Lesbian couples: 0.0% of all households
Gay men: 0.6% of all households
Household received Food Stamps/SNAP in the past 12 months: 310 Household did not receive Food Stamps/SNAP in the past 12 months: 3,298
Women who had a birth in the past 12 months: 193 (176 now married, 20 unmarried) Women who did not have a birth in the past 12 months: 2,445 (713 now married, 1,743 unmarried)
Housing units in zip code 99324 with a mortgage: 1,440 (72 second mortgage, 55 both second mortgage and home equity loan) Houses without a mortgage: 65
Median monthly owner costs for units with a mortgage: $1,657 Median monthly owner costs for units without a mortgage: $563
Residents with income below the poverty level in 2022:
This zip code:
10.8%
Whole state:
10.0%
Residents with income below 50% of the poverty level in 2022:
This zip code:
6.4%
Whole state:
4.6%
Median number of rooms in houses and condos:
Here:
6.0
State:
6.5
Median number of rooms in apartments:
Here:
3.9
State:
3.9
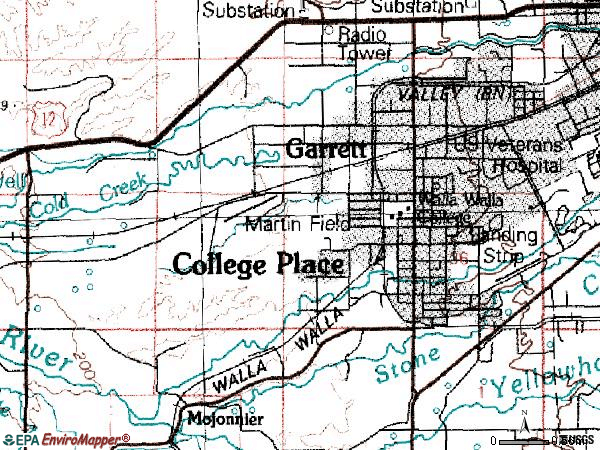
Notable locations in this zip code not listed on our city pages
Notable locations in zip code 99324: Tausick Swimming Pool (A), Village Square (B), College Place Fire Department (C). Display/hide their locations on the map
1,457 married couples with children.
481 single-parent households (115 men, 366 women).
83.7% of residents of 99324 zip code speak English at home.
12.5% of residents speak Spanish at home (66% very well, 18% well, 11% not well, 6% not at all).
1.5% of residents speak other Indo-European language at home (70% very well, 9% well, 21% not well).
1.9% of residents speak Asian or Pacific Island language at home (64% very well, 11% well, 25% not well).
0.3% of residents speak other language at home (100% very well).
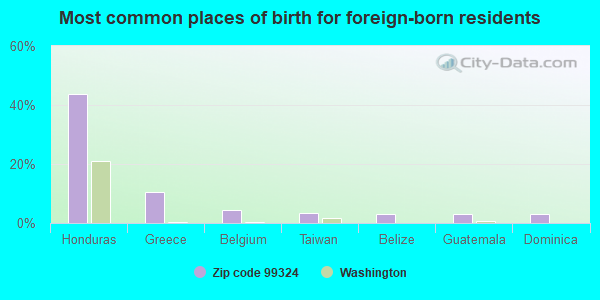
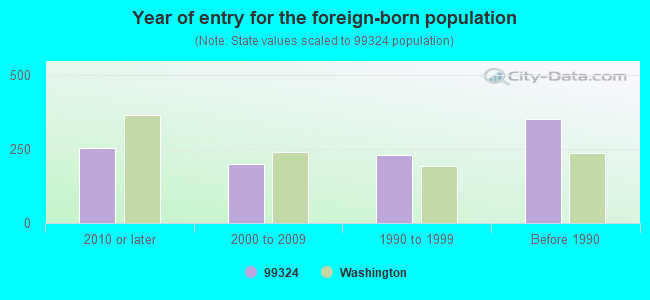
Foreign born population: 907 (8.9%) (65.5% of them are naturalized citizens)
This zip code:
8.9%
Whole state:
15.3%
44%Honduras
11%Greece
4%Belgium
3%Taiwan
3%Belize
3%Guatemala
3%Dominica
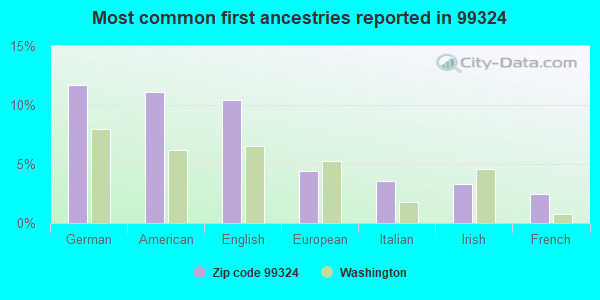
12%German
11%American
10%English
4%European
4%Italian
3%Irish
2%French
Year of entry for the foreign-born population
2522010 or later
1982000 to 2009
2311990 to 1999
351Before 1990
Facilities with environmental interests located in this zip code:
COLLEGE PLACE SCHOOL DISTRICT 250 (1755 SOUTH COLLEGE AVENUE in COLLEGE PLACE, WA)
COMPLIANCE ACTIVITY (Tracking inspections of insecticide, fungicide, and rodenticide, and toxic substances) STATE MASTER (Washington State Department of Ecology's Facility/Site identification system) - TOXICS-1593, UNDERGROUND STORAGE TANK PROGRAM Alternative names: COLLEGE PLACE SD 250
BKI INC COLLEGE PLACE (400 W WHITMAN DR in COLLEGE PLACE, WA)
(Resource Conservation and Recovery Act (tracking hazardous waste))
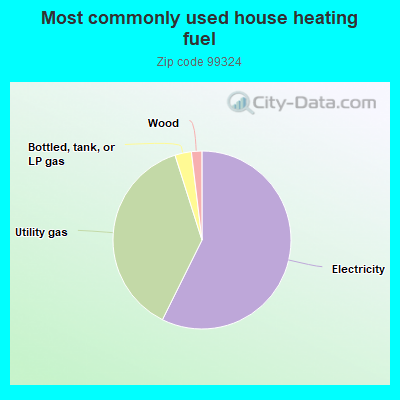
57.4%Electricity
37.8%Utility gas
3.0%Bottled, tank, or LP gas
1.9%Wood
Population in 1990: 6,904. Population change in the 1990s: +1,551 (+22.5%).
Place of birth for U.S.-born residents:
This state: 4,785
Northeast: 170
Midwest: 653
South: 743
West: 2,762
43% of the 99324 zip code residents lived in the same house 5 years ago. Out of people who lived in different houses, 45% lived in this county. Out of people who lived in different counties, 50% lived in Washington.
90% of the 99324 zip code residents lived in the same house 1 year ago. Out of people who lived in different houses, 42% moved from this county. Out of people who lived in different houses, 40% moved from different county within same state. Out of people who lived in different houses, 18% moved from different state. Out of people who lived in different houses, 4% moved from abroad.
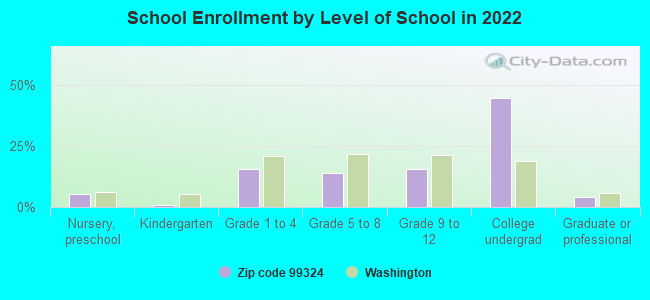
Private vs. public school enrollment:
Students in private schools in grades 1 to 8 (elementary and middle school): 285
Here:
30.8%
Washington:
12.4%
Students in private schools in grades 9 to 12 (high school): 83
Here:
17.1%
Washington:
9.2%
Students in private undergraduate colleges: 868
Here:
63.5%
Washington:
16.5%
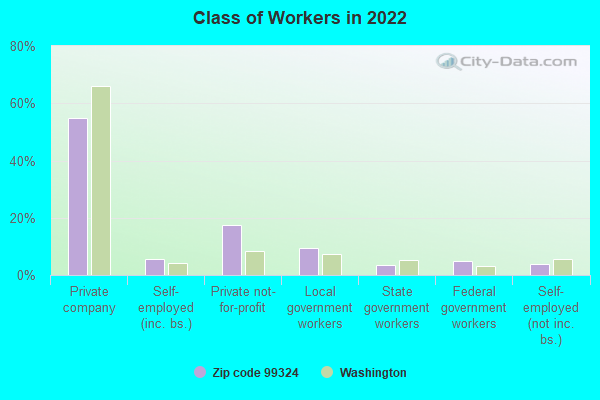
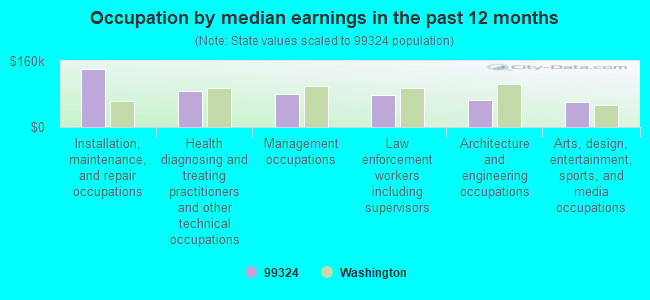
Occupation by median earnings in the past 12 months ($)
141,289Installation, maintenance, and repair occupations
86,636Health diagnosing and treating practitioners and other technical occupations
80,708Management occupations
76,791Law enforcement workers including supervisors
64,358Architecture and engineering occupations
61,441Arts, design, entertainment, sports, and media occupations
Companies with federal contracts located in this zip code:
ENVIRONMENTALISTS INC (105 N COLLEGE AVE in COLLEGE PLACE, WA; small business) : $2,540 in 10 contractsfrom 2003 to 2006
Contracts for General Health Care Services, Personal Services Contracts by Army, U.S. Army Corps of Engineers - civil program financing only Signed by year:2000: $0; 2001: $0; 2002: $0; 2003: $1,920; 2004: $620; 2005: $960; 2006: -$960.
Biggest contracts:
$960 with Army for General Health Care Services. Signed on 2005-12-02. Completion date: 2003-10-15.
$960 with U.S. Army Corps of Engineers - civil program financing only for General Health Care Services. Signed on 2004-11-02. Completion date: 2003-10-15.
$960 with Army for General Health Care Services. Signed on 2004-11-02. Completion date: 2003-10-15.
$960, same as above.Signed on 2003-12-03. Completion date: 2003-10-15.
Top industries in this zip code by the number of employees in 2005:
Educational Services: Colleges, Universities, and Professional Schools (over 1000 employees: 1 establishment)
Health Care and Social Assistance: Nursing Care Facilities (100-249: 1)
Accommodation and Food Services: Food Service Contractors (50-99: 1)
Health Care and Social Assistance: Homes for the Elderly (20-49: 2, 1-4: 1)
Construction: Plumbing, Heating, and Air-Conditioning Contractors (20-49: 1, 1-4: 1)
Administrative and Support and Waste Management and Remediation Services: Janitorial Services (5-9: 2, 1-4: 1)
People in group quarters in 2010:
660 people in college/university student housing
95 people in nursing facilities/skilled-nursing facilities
23 people in group homes intended for adults
21 people in emergency and transitional shelters (with sleeping facilities) for people experiencing homelessness
People in group quarters in 2000:
759 people in college dormitories (includes college quarters off campus)
61 people in nursing homes
51 people in other noninstitutional group quarters
6 people in other group homes
Fatal accident statistics in 2014:
Fatal accident count: 1
Vehicles involved in fatal accidents: 2
Fatal accidents caused by drunken drivers: 1
Fatalities: 1
Persons involved in fatal accidents: 2
Pedestrians involved in fatal accidents: 0
2002 - 2018 National Fire Incident Reporting System (NFIRS) incidents
According to the data from the years 2002 - 2018 the average number of fires per year is 22. The highest number of fire incidents - 54 took place in 2005, and the least - 1 in 2014. The data has a growing trend.
When looking into fire subcategories, the most incidents belonged to: Structure Fires (42.3%), and Outside Fires (37.6%).
Fire incident types reported to NFIRS in Zip Code 99324
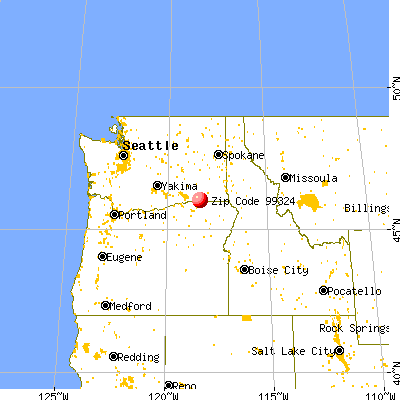


 Nearest zip codes: 99362, 97862, 97813, 97886, 99329, 99360.


 According to the data from the years 2002 - 2018 the average number of fires per year is 22. The highest number of fire incidents - 54 took place in 2005, and the least - 1 in 2014. The data has a growing trend.
 When looking into fire subcategories, the most incidents belonged to: Structure Fires (42.3%), and Outside Fires (37.6%).