Aiken, South Carolina

Aiken: South Boundary Avenue in the snow
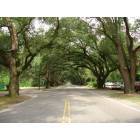
Aiken: Boundry Rd. Aiken, SC
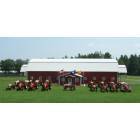
Aiken: Aiken Farm Fest Grounds

Aiken: Fall in Hopeland Gardens
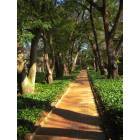
Aiken: Hopeland Gardens
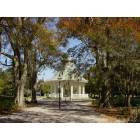
Aiken: Hopeland Gardens
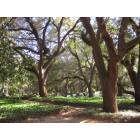
Aiken: Hopeland Gardens
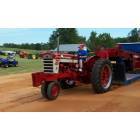
Aiken: Aiken Antique Power Association Tractor Pull
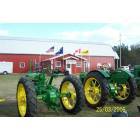
Aiken: Aiken Farm Fest
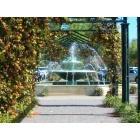
Aiken: Fountain on Newberry St.

Aiken: This little chef welcomes all customers of Casa Bella Italian Restraurant in downtown Aiken.
- see
24
more - add
your


Submit your own pictures of this city and show them to the world
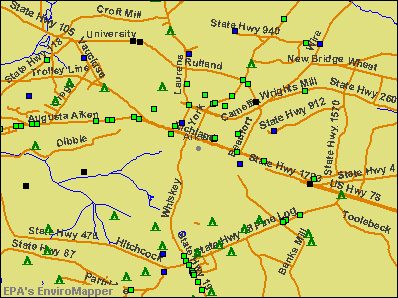
- OSM Map
- General Map
- Google Map
- MSN Map
Population change since 2000: +28.1%
 |
| Males: 14,800 | |
| Females: 17,663 |
| Median resident age: | 48.1 years |
| South Carolina median age: | 40.5 years |
Zip codes: 29801, 29803, 29851.
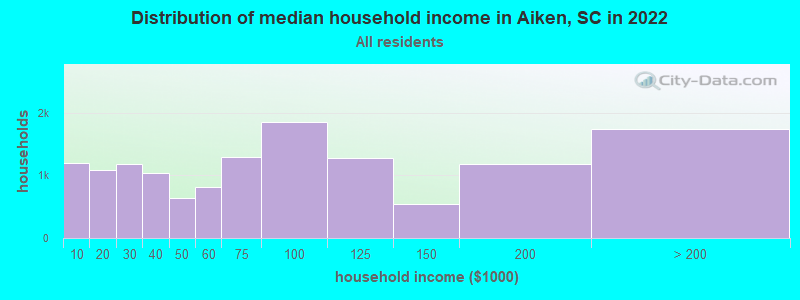
Aiken Zip Code Map| Aiken: | $71,181 |
| SC: | $64,115 |
Estimated per capita income in 2022: $41,318 (it was $23,172 in 2000)
Aiken city income, earnings, and wages data
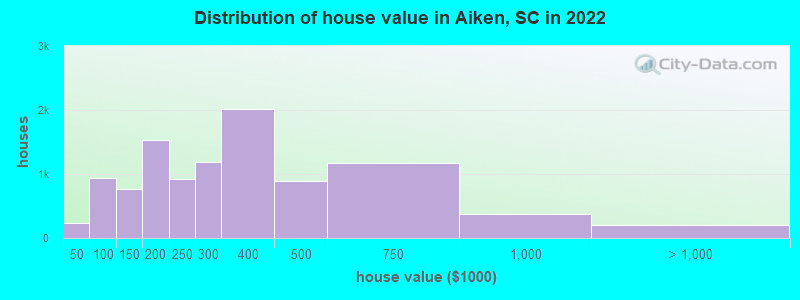
Estimated median house or condo value in 2022: $275,139 (it was $108,400 in 2000)
| Aiken: | $275,139 |
| SC: | $254,600 |
Mean prices in 2022: all housing units: $357,342; detached houses: $375,716; townhouses or other attached units: $220,056; in 2-unit structures: $242,213; in 3-to-4-unit structures: $78,711; in 5-or-more-unit structures: $260,494; mobile homes: $68,133
Median gross rent in 2022: $1,109.
(5.4% for White Non-Hispanic residents, 31.6% for Black residents, 15.6% for Hispanic or Latino residents, 16.7% for American Indian residents, 23.0% for two or more races residents)
Detailed information about poverty and poor residents in Aiken, SC


Compare current foreclosures in Aiken, SC:
| Photo | Address | Area | Beds / Baths | Price | Details |
|---|---|---|---|---|---|

|
#1
Rosemont Dr
Aiken, SC 29801
|
1,341 sq. feet
|
1 baths 3 beds |
show details | |

|
#2
Chesterfield St S
Aiken, SC 29801
|
9,538 sq. feet
|
9 baths 6 beds |
show details | |

|
#3
Sumter St NE
Aiken, SC 29801
|
1,418 sq. feet
|
2 baths 4 beds |
show details | |

|
#4
Pipeline Rd
Aiken, SC 29801
|
1,410 sq. feet
|
1 baths - beds |
show details | |

|
#5
Alderman St NE
Aiken, SC 29801
|
1,575 sq. feet
|
1 baths - beds |
show details | |

|
#6
Williams Ln
Aiken, SC 29801
|
1,444 sq. feet
|
1 baths - beds |
show details | |

|
#7
Monterey Dr
Aiken, SC 29803
|
1,578 sq. feet
|
1 baths - beds |
show details | |

|
#8
Old Camp Long Rd
Aiken, SC 29805
|
1,132 sq. feet
|
1 baths - beds |
show details | |

|
#9
Fox Haven Dr
Aiken, SC 29803
|
1,402 sq. feet
|
2 baths - beds |
show details | |

|
#10
Woodbine Rd
Aiken, SC 29803
|
2,364 sq. feet
|
3 baths - beds |
show details |
| Photo | Address | Area | Beds / Baths | Price | Details |
|---|---|---|---|---|---|

|
#11
Cooks Bridge Rd
Aiken, SC 29805
|
1,352 sq. feet
|
1 baths - beds |
show details | |

|
#12
Oriole St
Aiken, SC 29803
|
2,020 sq. feet
|
2 baths - beds |
show details | |

|
#13
Converse Dr
Aiken, SC 29803
|
1,797 sq. feet
|
1 baths - beds |
show details | |

|
#14
Jefferson Ter NE
Aiken, SC 29801
|
832 sq. feet
|
1 baths - beds |
show details | |

|
#15
Midway Cir
Aiken, SC 29803
|
1,638 sq. feet
|
2 baths - beds |
show details | |

|
#16
Morris Rd
Aiken, SC 29805
|
1,280 sq. feet
|
1 baths - beds |
show details | |

|
#17
Greenville St NW
Aiken, SC 29801
|
1,692 sq. feet
|
1 baths - beds |
show details | |

|
#18
Westmont Dr
Aiken, SC 29801
|
1,136 sq. feet
|
1 baths - beds |
show details | |

|
#19
Clemson Dr
Aiken, SC 29803
|
1,435 sq. feet
|
1 baths - beds |
show details | |

|
#20
Georgann Ln
Aiken, SC 29803
|
1,826 sq. feet
|
2 baths - beds |
show details |
| Photo | Address | Area | Beds / Baths | Price | Details |
|---|---|---|---|---|---|

|
#21
Henry St
Aiken, SC 29803
|
1,145 sq. feet
|
1 baths - beds |
show details | |

|
#22
Lancaster St NW
Aiken, SC 29801
|
1,941 sq. feet
|
2 baths - beds |
show details | |

|
#23
Perrin St NW
Aiken, SC 29801
|
1,008 sq. feet
|
1 baths - beds |
show details | |

|
#24
Orangeburg St SE
Aiken, SC 29801
|
1,540 sq. feet
|
2 baths - beds |
show details | |

|
#25
Outing Club Rd
Aiken, SC 29801
|
1,506 sq. feet
|
2 baths - beds |
show details | |

|
#26
Gregg Ave
Aiken, SC 29801
|
1,635 sq. feet
|
2 baths - beds |
show details | |

|
#27
Odom St
Aiken, SC 29803
|
1,590 sq. feet
|
1 baths - beds |
show details | |

|
#28
Midlothian Ct E
Aiken, SC 29803
|
2,670 sq. feet
|
3 baths - beds |
show details | |

|
#29
Old Friar Rd
Aiken, SC 29801
|
1,694 sq. feet
|
2 baths - beds |
show details | |

|
#30
Greengate Cir Apt E
Aiken, SC 29803
|
- sq. feet
|
- baths - beds |
show details |
| Photo | Address | Area | Beds / Baths | Price | Details |
|---|---|---|---|---|---|

|
#31
Monetta St SE
Aiken, SC 29801
|
- sq. feet
|
- baths - beds |
show details | |

|
#32
Chesterfield St N
Aiken, SC 29801
|
- sq. feet
|
- baths - beds |
show details | |

|
#33
Telegraph Dr
Aiken, SC 29801
|
- sq. feet
|
- baths - beds |
show details | |

|
#34
Gray Mare Hollow Rd
Aiken, SC 29803
|
- sq. feet
|
- baths - beds |
show details | |

|
#35
Mossback Cir
Aiken, SC 29803
|
- sq. feet
|
- baths - beds |
show details | |

|
#36
Hampton Ave NW
Aiken, SC 29801
|
- sq. feet
|
- baths - beds |
show details | |

|
#37
White Gate Loop
Aiken, SC 29801
|
- sq. feet
|
- baths - beds |
show details | |

|
#38
Old Wagener Rd
Aiken, SC 29801
|
1,904 sq. feet
|
- baths - beds |
show details | |

|
#39
Old Friar Rd
Aiken, SC 29801
|
1,024 sq. feet
|
- baths - beds |
show details | |

|
#40
Brewster Way
Aiken, SC 29803
|
- sq. feet
|
- baths - beds |
show details |
| Photo | Address | Area | Beds / Baths | Price | Details |
|---|---|---|---|---|---|

|
#41
Viburnum Ct
Aiken, SC 29803
|
- sq. feet
|
- baths - beds |
show details | |

|
#42
Tyler St
Aiken, SC 29803
|
- sq. feet
|
- baths - beds |
show details | |

|
#43
Silver Bluff Rd
Aiken, SC 29803
|
960 sq. feet
|
- baths - beds |
show details | |

|
#44
Williams Ln
Aiken, SC 29801
|
- sq. feet
|
- baths - beds |
show details | |

|
#45
Dillon Ave NW
Aiken, SC 29801
|
- sq. feet
|
- baths - beds |
show details | |

|
#46
Sunridge Rd Apt B
Aiken, SC 29803
|
- sq. feet
|
- baths - beds |
show details | |

|
#47
Hanford Dr
Aiken, SC 29803
|
- sq. feet
|
- baths - beds |
show details | |

|
#48
Foreman Floyd Cir
Aiken, SC 29803
|
- sq. feet
|
- baths - beds |
show details | |

|
#49
Twilight Ln Apt 2204
Aiken, SC 29801
|
- sq. feet
|
- baths - beds |
show details | |

|
Check over 1 million property listings on Foreclosure.com!
|
browse all offers | |||


- 18,62156.7%White alone
- 11,66635.5%Black alone
- 9142.8%Hispanic
- 7712.3%Asian alone
- 6792.1%Two or more races
- 810.2%American Indian alone
- 520.2%Other race alone
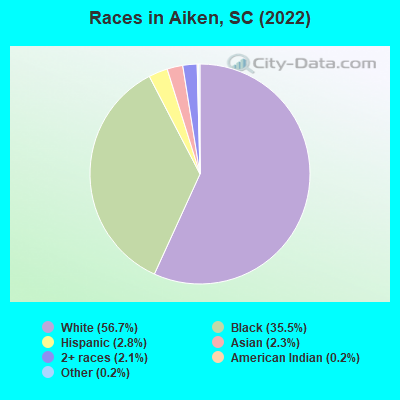
Races in Aiken detailed stats: ancestries, foreign born residents, place of birth
According to our research of South Carolina and other state lists, there were 10 registered sex offenders living in Aiken, South Carolina as of May 10, 2024.
The ratio of all residents to sex offenders in Aiken is 3,120 to 1.
The ratio of registered sex offenders to all residents in this city is lower than the state average.
Type |
2009 |
2010 |
2011 |
2012 |
2013 |
2014 |
2015 |
2016 |
2017 |
2018 |
2019 |
2020 |
2021 |
2022 |
|---|---|---|---|---|---|---|---|---|---|---|---|---|---|---|
| Murders (per 100,000) | 1 (3.4) | 1 (3.4) | 1 (3.3) | 7 (23.4) | 1 (3.3) | 1 (3.3) | 0 (0.0) | 1 (3.2) | 4 (12.8) | 3 (9.7) | 4 (12.9) | 5 (16.1) | 12 (38.4) | 2 (6.3) |
| Rapes (per 100,000) | 8 (26.8) | 7 (23.7) | 12 (40.2) | 7 (23.4) | 7 (23.4) | 15 (49.2) | 28 (92.1) | 30 (97.4) | 30 (96.3) | 22 (71.2) | 23 (74.4) | 9 (29.0) | 12 (38.4) | 19 (59.4) |
| Robberies (per 100,000) | 45 (150.9) | 38 (128.7) | 36 (120.5) | 40 (133.7) | 32 (106.8) | 25 (82.1) | 50 (164.4) | 43 (139.6) | 24 (77.0) | 36 (116.6) | 32 (103.5) | 33 (106.4) | 32 (102.3) | 13 (40.6) |
| Assaults (per 100,000) | 74 (248.1) | 64 (216.8) | 67 (224.3) | 58 (193.9) | 55 (183.5) | 65 (213.4) | 98 (322.2) | 186 (603.9) | 111 (356.2) | 75 (242.9) | 119 (384.8) | 204 (657.9) | 153 (489.3) | 156 (487.7) |
| Burglaries (per 100,000) | 212 (710.7) | 167 (565.6) | 173 (579.2) | 246 (822.5) | 216 (720.8) | 243 (797.8) | 202 (664.1) | 296 (961.0) | 205 (657.9) | 203 (657.4) | 162 (523.9) | 146 (470.9) | 84 (268.6) | 80 (250.1) |
| Thefts (per 100,000) | 955 (3,202) | 986 (3,340) | 1,075 (3,599) | 1,291 (4,316) | 1,208 (4,031) | 1,214 (3,986) | 1,309 (4,304) | 1,408 (4,571) | 1,058 (3,396) | 1,002 (3,245) | 1,241 (4,013) | 1,261 (4,067) | 1,014 (3,243) | 971 (3,036) |
| Auto thefts (per 100,000) | 50 (167.6) | 44 (149.0) | 49 (164.1) | 78 (260.8) | 58 (193.6) | 57 (187.1) | 94 (309.1) | 99 (321.4) | 85 (272.8) | 72 (233.2) | 98 (316.9) | 100 (322.5) | 88 (281.4) | 62 (193.8) |
| Arson (per 100,000) | 0 (0.0) | 0 (0.0) | 4 (13.4) | 1 (3.3) | 4 (13.3) | 3 (9.8) | 5 (16.4) | 6 (19.5) | 13 (41.7) | 8 (25.9) | 6 (19.4) | 3 (9.7) | 4 (12.8) | 2 (6.3) |
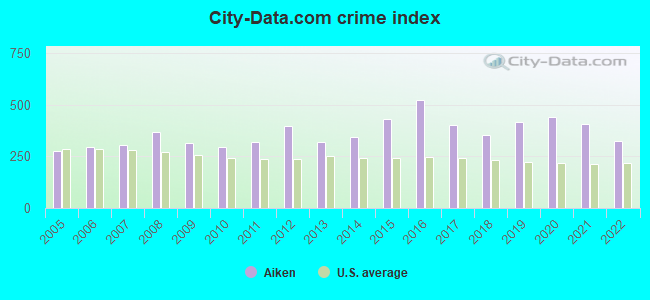
| City-Data.com crime index | 314.3 | 292.8 | 317.5 | 395.5 | 321.3 | 343.5 | 430.8 | 522.9 | 400.8 | 354.4 | 415.9 | 440.4 | 407.0 | 324.2 |
The City-Data.com crime index weighs serious crimes and violent crimes more heavily. Higher means more crime, U.S. average is 246.1. It adjusts for the number of visitors and daily workers commuting into cities.
Crime rate in Aiken detailed stats: murders, rapes, robberies, assaults, burglaries, thefts, arson
Full-time law enforcement employees in 2021, including police officers: 140 (87 officers - 70 male; 17 female).
| Officers per 1,000 residents here: | 2.78 |
| South Carolina average: | 2.21 |
 Recent articles from our blog. Our writers, many of them Ph.D. graduates or candidates, create easy-to-read articles on a wide variety of topics.


Latest news from Aiken, SC collected exclusively by city-data.com from local newspapers, TV, and radio stations
Ancestries: American (28.9%), English (7.4%), Irish (5.1%), German (4.8%), Scottish (3.4%), African (3.1%).
Current Local Time: EST time zone
Elevation: 530 feet
Land area: 16.2 square miles.
Population density: 2,007 people per square mile (low).
1,369 residents are foreign born (1.7% Asia, 1.0% Europe, 0.8% Latin America).
| This city: | 4.2% |
| South Carolina: | 5.3% |
Median real estate property taxes paid for housing units with mortgages in 2022: $1,120 (0.4%)
Median real estate property taxes paid for housing units with no mortgage in 2022: $1,228 (0.4%)
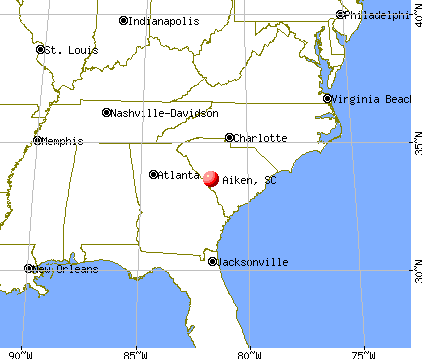
Nearest city with pop. 50,000+: Augusta, GA  (18.3 miles , pop. 138,000).
Nearest city with pop. 200,000+: Charlotte, NC (125.4 miles , pop. 540,828).
Nearest city with pop. 1,000,000+: Philadelphia, PA (575.5 miles , pop. 1,517,550).
Nearest cities:
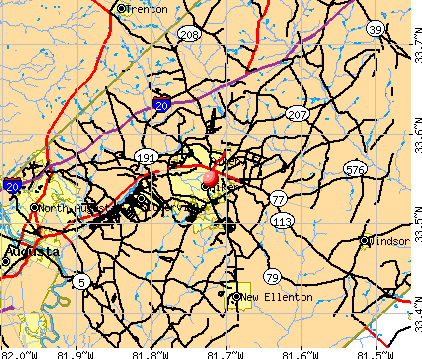
), ), ), ), ), ), )Latitude: 33.55 N, Longitude: 81.72 W
Daytime population change due to commuting: +15,954 (+48.6%)
Workers who live and work in this city: 7,591 (53.5%)
Area code: 803
Aiken tourist attractions:
Aiken, South Carolina accommodation & food services, waste management - Economy and Business Data
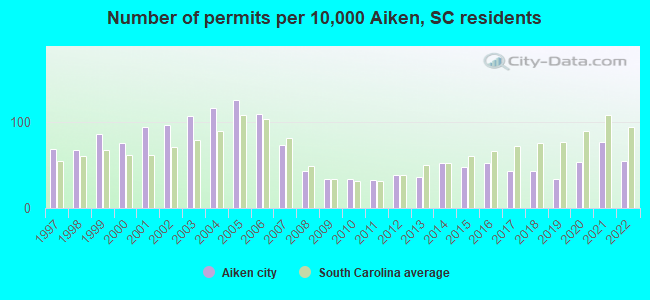
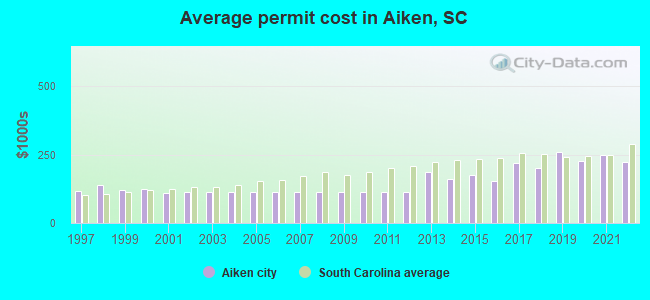
Single-family new house construction building permits:
- 2022: 140 buildings, average cost: $223,400
- 2021: 195 buildings, average cost: $249,000
- 2020: 137 buildings, average cost: $227,700
- 2019: 85 buildings, average cost: $260,700
- 2018: 108 buildings, average cost: $200,200
- 2017: 110 buildings, average cost: $219,200
- 2016: 134 buildings, average cost: $153,800
- 2015: 121 buildings, average cost: $174,700
- 2014: 132 buildings, average cost: $161,700
- 2013: 91 buildings, average cost: $187,700
- 2012: 99 buildings, average cost: $112,000
- 2011: 83 buildings, average cost: $112,000
- 2010: 85 buildings, average cost: $112,000
- 2009: 85 buildings, average cost: $112,000
- 2008: 109 buildings, average cost: $112,000
- 2007: 188 buildings, average cost: $112,000
- 2006: 278 buildings, average cost: $112,000
- 2005: 320 buildings, average cost: $112,000
- 2004: 297 buildings, average cost: $112,100
- 2003: 272 buildings, average cost: $111,800
- 2002: 247 buildings, average cost: $112,700
- 2001: 238 buildings, average cost: $108,900
- 2000: 192 buildings, average cost: $126,400
- 1999: 217 buildings, average cost: $119,800
- 1998: 172 buildings, average cost: $139,000
- 1997: 175 buildings, average cost: $118,100
| Here: | 3.6% |
| South Carolina: | 3.1% |
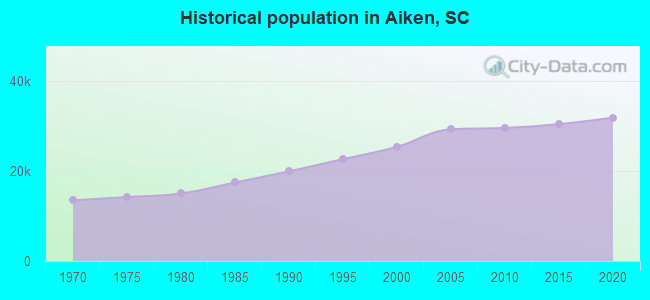
Population change in the 1990s: +4,454 (+21.3%).
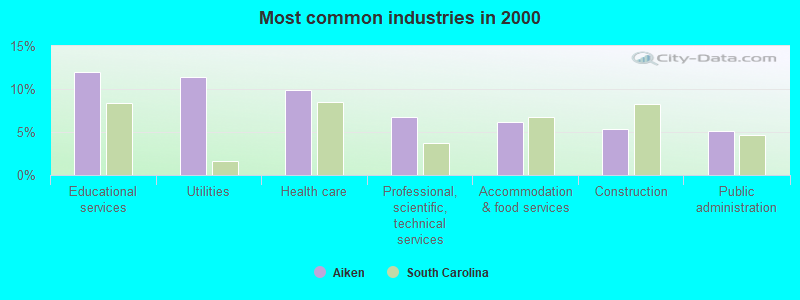
- Educational services (12.0%)
- Utilities (11.4%)
- Health care (9.9%)
- Professional, scientific, technical services (6.7%)
- Accommodation & food services (6.1%)
- Construction (5.3%)
- Public administration (5.1%)
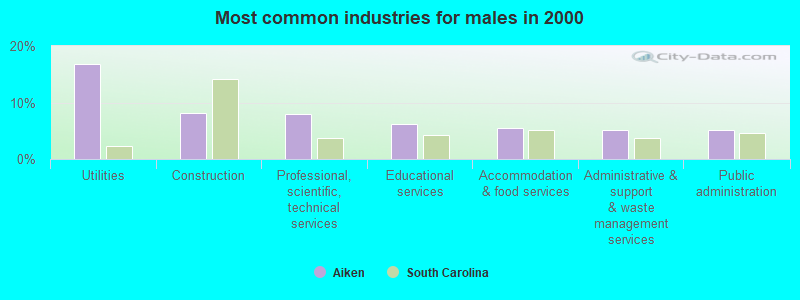
- Utilities (16.9%)
- Construction (8.1%)
- Professional, scientific, technical services (8.0%)
- Educational services (6.2%)
- Accommodation & food services (5.5%)
- Administrative & support & waste management services (5.2%)
- Public administration (5.2%)
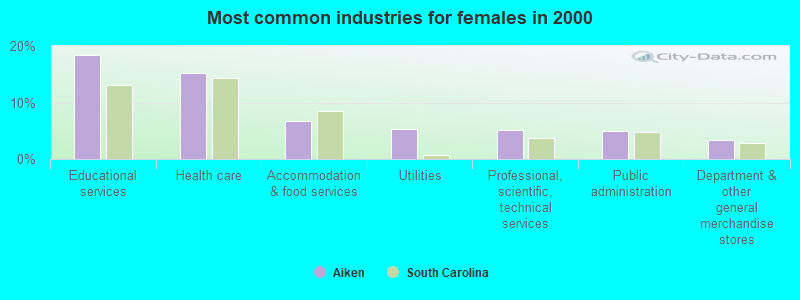
- Educational services (18.4%)
- Health care (15.2%)
- Accommodation & food services (6.8%)
- Utilities (5.3%)
- Professional, scientific, technical services (5.2%)
- Public administration (5.0%)
- Department & other general merchandise stores (3.4%)
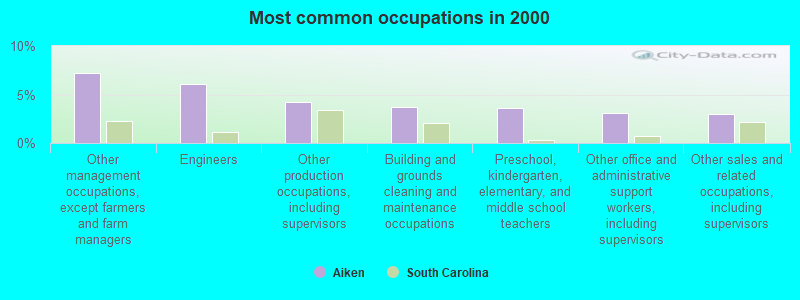
- Other management occupations, except farmers and farm managers (7.2%)
- Engineers (6.1%)
- Other production occupations, including supervisors (4.2%)
- Building and grounds cleaning and maintenance occupations (3.7%)
- Preschool, kindergarten, elementary, and middle school teachers (3.6%)
- Other office and administrative support workers, including supervisors (3.1%)
- Other sales and related occupations, including supervisors (3.0%)
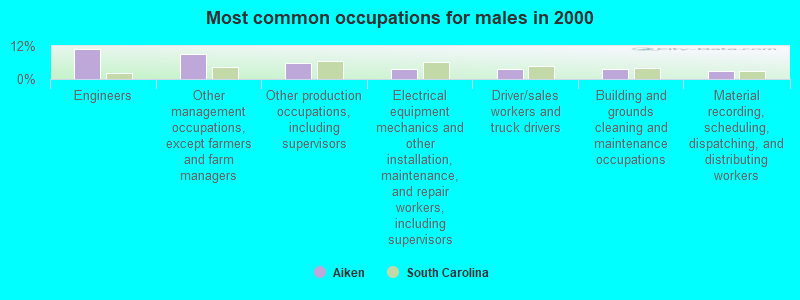
- Engineers (11.1%)
- Other management occupations, except farmers and farm managers (9.3%)
- Other production occupations, including supervisors (5.7%)
- Electrical equipment mechanics and other installation, maintenance, and repair workers, including supervisors (3.7%)
- Driver/sales workers and truck drivers (3.6%)
- Building and grounds cleaning and maintenance occupations (3.5%)
- Material recording, scheduling, dispatching, and distributing workers (3.1%)
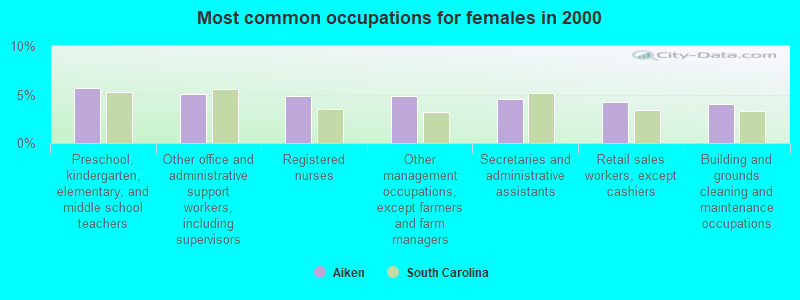
- Preschool, kindergarten, elementary, and middle school teachers (5.7%)
- Other office and administrative support workers, including supervisors (5.1%)
- Registered nurses (4.9%)
- Other management occupations, except farmers and farm managers (4.9%)
- Secretaries and administrative assistants (4.5%)
- Retail sales workers, except cashiers (4.2%)
- Building and grounds cleaning and maintenance occupations (4.0%)
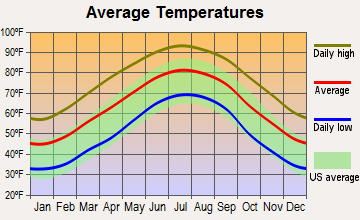
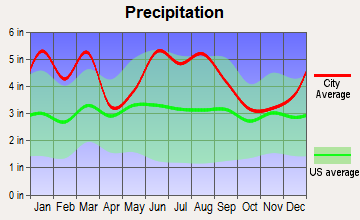
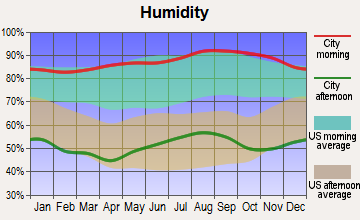
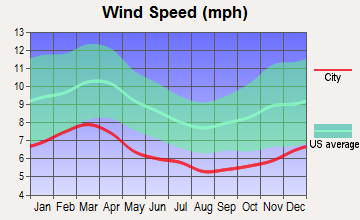
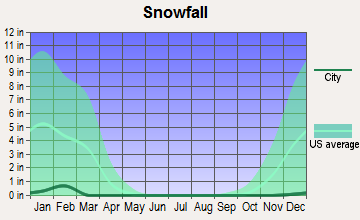
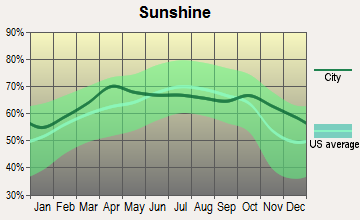
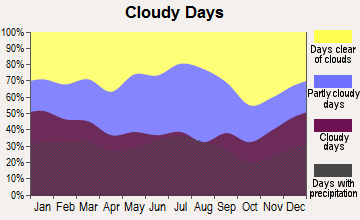
Average climate in Aiken, South Carolina
Based on data reported by over 4,000 weather stations
|
|

(lower is better)
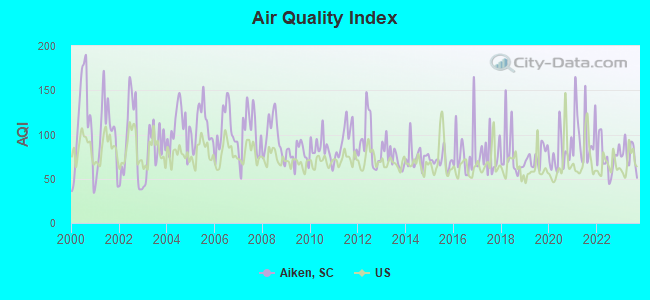
Air Quality Index (AQI) level in 2023 was 76.5. This is about average.
| City: | 76.5 |
| U.S.: | 72.6 |
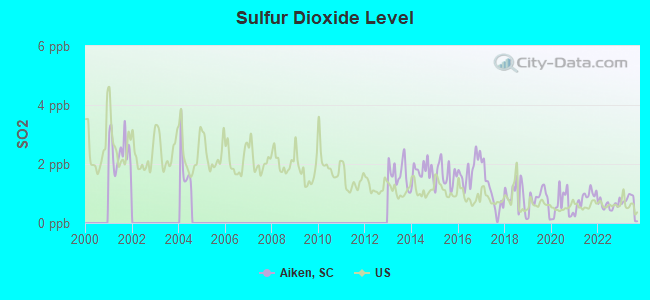
Sulfur Dioxide (SO2) [ppb] level in 2023 was 0.658. This is significantly better than average. Closest monitor was 1.5 miles away from the city center.
| City: | 0.658 |
| U.S.: | 1.515 |

Ozone [ppb] level in 2023 was 29.5. This is about average. Closest monitor was 14.9 miles away from the city center.
| City: | 29.5 |
| U.S.: | 33.3 |
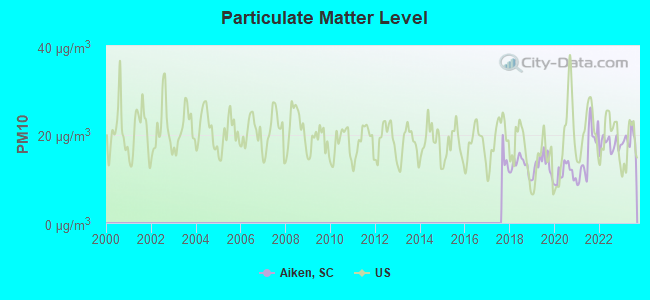
Particulate Matter (PM10) [µg/m3] level in 2023 was 19.0. This is about average. Closest monitor was 14.9 miles away from the city center.
| City: | 19.0 |
| U.S.: | 19.2 |
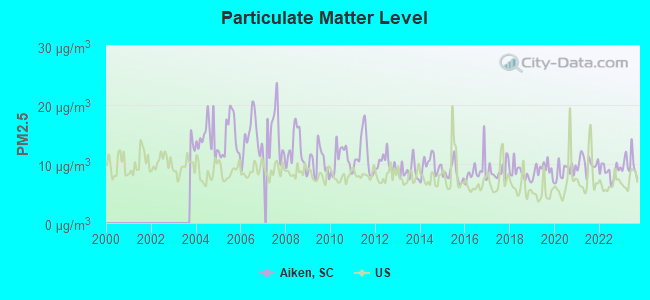
Particulate Matter (PM2.5) [µg/m3] level in 2023 was 9.99. This is worse than average. Closest monitor was 14.9 miles away from the city center.
| City: | 9.99 |
| U.S.: | 8.11 |
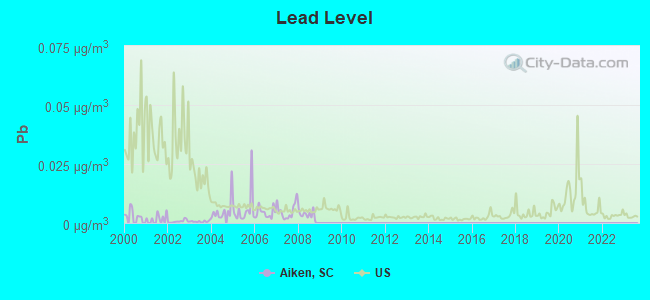
Lead (Pb) [µg/m3] level in 2008 was 0.00372. This is significantly better than average. Closest monitor was 12.8 miles away from the city center.
| City: | 0.00372 |
| U.S.: | 0.00931 |
Tornado activity:
Aiken-area historical tornado activity is near South Carolina state average. It is 11% greater than the overall U.S. average.
On 5/7/1998, a category F3 (max. wind speeds 158-206 mph) tornado 10.2 miles away from the Aiken city center killed one person and injured 9 people and caused $1 million in damages.
On 5/7/1998, a category F3 tornado 25.8 miles away from the city center caused $300,000 in damages.
Earthquake activity:
Aiken-area historical earthquake activity is significantly above South Carolina state average. It is 19% smaller than the overall U.S. average.On 8/2/1974 at 08:52:09, a magnitude 4.9 (4.3 MB, 4.9 LG, Class: Light, Intensity: IV - V) earthquake occurred 49.5 miles away from the city center
On 11/22/1974 at 05:25:55, a magnitude 4.7 (4.7 MB) earthquake occurred 101.6 miles away from Aiken center
On 8/9/2020 at 12:07:37, a magnitude 5.1 (5.1 MW, Depth: 4.7 mi, Class: Moderate, Intensity: VI - VII) earthquake occurred 205.5 miles away from the city center
On 2/15/2014 at 03:23:38, a magnitude 4.1 (4.1 MW, Depth: 3.2 mi) earthquake occurred 28.3 miles away from the city center
On 8/21/1992 at 16:31:55, a magnitude 4.4 (4.1 MB, 4.1 LG, 4.4 LG, Depth: 6.2 mi) earthquake occurred 99.0 miles away from Aiken center
On 8/23/2011 at 17:51:04, a magnitude 5.8 (5.8 MW, Depth: 3.7 mi) earthquake occurred 368.8 miles away from the city center
Magnitude types: regional Lg-wave magnitude (LG), body-wave magnitude (MB), moment magnitude (MW)
Natural disasters:
The number of natural disasters in Aiken County (13) is near the US average (15).Major Disasters (Presidential) Declared: 5
Emergencies Declared: 5
Causes of natural disasters: Storms: 4, Floods: 3, Hurricanes: 3, Winter Storms: 3, Drought: 1, Ice Storm: 1, Tornado: 1, Wind: 1, Other: 1 (Note: some incidents may be assigned to more than one category).
Main business address for: SECURITY FEDERAL CORPORATION (SAVINGS INSTITUTION, FEDERALLY CHARTERED).
Hospitals in Aiken:
- AIKEN REGIONAL MEDICAL CENTER (Proprietary, provides emergency services, 302 UNIVERSITY PARKWAY)
- DUPONT II COMM. RES. (101 DUPONT DR.)
- LAURENS ICF/MR (728 LAURENS ST)
- LINDEN STREET (136 LINDEN STREET)
- REGENCY HOSPICE OF SOUTH CAROLINA AIKEN (105 SUMMERWOOD WAY SUITE D)
- SANDERS COMMUNITY RESIDENCE (625 CHESTERFIELD STREET)
- SOUTHERN CARE AIKEN (35 VARDEN DRIVE, SUITE A & B)
Nursing Homes in Aiken:
- ANCHOR HEALTH AND REHAB OF AIKEN (550 EAST GATE DRIVE)
- AZALEAWOODS REHAB AND NURSING CENTER, LLC (123 DUPONT DR)
- PEPPER HILL NURSING AND REHAB CENTER, LLC (3525 AUGUSTUS ROAD)
- UNIHEALTH POST ACUTE CARE - AIKEN, LLC (830 LAURENS STREET NORTH)
Dialysis Facilities in Aiken:
Home Health Centers in Aiken:
Airports and heliports located in Aiken:
- Aiken Municipal Airport (AIK) (Runways: 2, Air Taxi Ops: 2,600, Itinerant Ops: 14,000, Local Ops: 26,800, Military Ops: 500)
- Wexford Landing Airport (4SC7) (Runways: 1)
- Savannah River Site (Department Of Energy) Heliport (SC30)
Colleges/Universities in Aiken:
- University of South Carolina-Aiken (Full-time enrollment: 2,815; Location: 471 University Pkwy; Public; Website: web.usca.edu; Offers Master's degree)
- Aiken School of Cosmetology (Full-time enrollment: 46; Location: 225 Richland Ave East; Private, for-profit; Website: www.aikenschoolofcosmetology.com)
- Lacy Cosmetology School-Aiken (Full-time enrollment: 22; Location: 3084 Whiskey Rd; Private, for-profit; Website: www.lacyschools.com)
Other colleges/universities with over 2000 students near Aiken:
- Aiken Technical College (about 8 miles; Graniteville, SC; Full-time enrollment: 2,107)
- Georgia Regents University (about 17 miles; Augusta, GA; FT enrollment: 6,862)
- Augusta Technical College (about 21 miles; Augusta, GA; FT enrollment: 3,494)
- Denmark Technical College (about 39 miles; Denmark, SC; FT enrollment: 2,050)
- Midlands Technical College (about 45 miles; West Columbia, SC; FT enrollment: 8,916)
- South Carolina State University (about 51 miles; Orangeburg, SC; FT enrollment: 3,481)
- University of South Carolina-Columbia (about 51 miles; Columbia, SC; FT enrollment: 27,789)
Public high schools in Aiken:
- AIKEN HIGH (Students: 1,481, Location: 449 RUTLAND DRIVE, Grades: 9-12)
- SILVER BLUFF HIGH (Students: 701, Location: 64 DESOTO DRIVE, Grades: 9-12)
- AIKEN PERFORMING ARTS ACADEMY CHARTER (Students: 54, Location: 130 AVERY LANE, Grades: 9-12, Charter school)
- SOUTH AIKEN HIGH (Location: 232 EAST PINE LOG ROAD, Grades: 9-12)
Private high schools in Aiken:
Biggest public elementary/middle schools in Aiken:
- NORTH AIKEN ELEMENTARY (Students: 1,513, Location: 100 BEARS ROCK ROAD, Grades: PK-5)
- M. B. KENNEDY MIDDLE (Students: 917, Location: 274 EAST PINE LOG ROAD, Grades: 6-8)
- REDCLIFFE ELEMENTARY (Students: 817, Location: 22 DOUBLE SPRINGS ROAD, Grades: PK-5)
- AIKEN ELEMENTARY (Students: 814, Location: 2050 PINE LOG ROAD, Grades: PK-5)
- CHUKKER CREEK ELEMENTARY (Students: 775, Location: 1830 CHUKKER CREEK ROAD, Grades: PK-5)
- AIKEN MIDDLE (Students: 627, Location: 101 GATOR LANE, Grades: 6-8)
- MILLBROOK ELEMENTARY (Students: 621, Location: 255 EAST PINE LOG ROAD, Grades: PK-5)
- J. D. LEVER ELEMENTARY (Students: 586, Location: 2404 COLUMBIA HIGHWAY, Grades: PK-5)
- OAKWOOD-WINDSOR ELEMENTARY (Students: 478, Location: 3773 CHARLESTON HIGHWAY, Grades: PK-5)
- HORSE CREEK ACADEMY (Location: 1200 TOOLEBACK ROAD, Grades: KG-8, Charter school)
Private elementary/middle schools in Aiken:
Points of interest:
Notable locations in Aiken: Whitney Polo Field (A), Harriman Polo Field (B), Highland Park Country Club (C), Hounds Lake Country Club (D), Powderhouse Polo Field (E), Post Polo Ranch (F), Aiken Mile Track (G), Aiken Sewage Disposal (H), Palmetto Golf Club (I), Aiken Youth Center (J), Weeks Recreation Center (K), Aiken Public Safety Headquarters (L), Aiken Public Safety Station 3 (M), Aiken City Hall (N), Aiken County Courthouse (O), Aiken Public Safety Station 2 (P), Aiken County Jail (Q), Aiken County Library (R). Display/hide their locations on the map
Shopping Centers: The Market Place Shopping Center (1), Centre South Shopping Center (2), Heritage Shopping Center (3), Hitchcock Plaza Shopping Center (4), Kalmia Plaza Shopping Center (5), Mitchell Shopping Center (6), Northside Plaza Shopping Center (7), Rich Plaza Shopping Center (8), Silver Bluff Shopping Center (9). Display/hide their locations on the map
Main business address in Aiken: SECURITY FEDERAL CORPORATION (A). Display/hide its location on the map
Churches in Aiken include: Second Baptist Church (A), North Aiken Baptist Church (B), Wayside Church (C), First Baptist Church (D), First Christian Church (E), Cumberland Church (F), Bethlehem Lutheran Church (G), Millbrook Baptist Church (H), Marion Street Baptist Church (I). Display/hide their locations on the map
Cemeteries: Millbrook Cemetery (1), Saint Thaddeus Cemetery (2), Bethany Cemetery (3), First Baptist Cemetery (4). Display/hide their locations on the map
Lakes and reservoirs: Robinson Pond (A), Holley Lake (B), Hounds Lake (C). Display/hide their locations on the map
Parks in Aiken include: Virginia Acres Park (1), Hopeland Gardens (2). Display/hide their locations on the map
Tourist attractions: Aiken County Historical Museum Gift Store (433 Newberry Street Southwest) (1), Aiken County Historical Museum (433 Newberry Street Southwest) (2), Carolina Golf Range & Batting Facility (Amusement & Theme Parks; 4234 Whiskey Road) (3), Kennedy Business Services- Inc. (Arcades & Amusements; 157 Balsam Lane) (4), All States Charter & Tours Inc (Tours & Charters; 1619 Hampton Avenue Northwest) (5). Display/hide their approximate locations on the map
Hotels: American Hearth Inn (3935 Richland Avenue West) (1), Carriage House Inn (139 Laurens Street Southwest) (2), GuestHouse Intl Aiken (110 Frontage Road) (3), Deluxe Inn (1919 Edgefield Highway) (4), Best Western Executive Inn (3560 Richland Ave W) (5), Hampton Inn Aiken (100 Tamil Drive @ Whiskey Road) (6), Hotel Aiken (235 Richland Avenue West) (7), Fairfield Inn & Suites Aiken SC (185 Colony Parkway) (8), Fairfield Inn & Suites by Marriott (185 Colony Parkway) (9). Display/hide their approximate locations on the map
Courts: Aiken County Government - Courts & Legal- Magistrates- Aiken Magist (1680 Richland Avenue West) (1), U S Government - U S District Court- Visiting Judge (Court House) (2), Aiken County Government - Courts & Legal- Probate Court- Estates (109 Park Avenue Southeast) (3), Aiken County Government - Taxes- Personal Property (828 Richland Avenue West) (4), Aiken County Government - Recreation Department (902 Vaucluse Road) (5), Aiken County Government - Courts & Legal- Clerk of Court (109 Park Avenue Southeast) (6), U S Government - U S District Court- U S Attorney (Court House Building) (7), U S Government - U S District Court- U S Marshall Ofc (223 Park Avenue Southeast) (8). Display/hide their approximate locations on the map
Birthplace of: Big Show - Professional wrestler, John Berry (singer) - Country musician, Anna Camp - Actress, Corey Chavous - 2005 NFL player (Minnesota Vikings, born: Jan 15, 1976), D'Wayne Bates - Football player, De'Angelo Bryant - Football player, Etta Jones - Jazz singer, Gertrude Sanford Legendre - Spy, Hansford T. Johnson - General, Julia Brownley - California politician.
Drinking water stations with addresses in Aiken and their reported violations in the past:
AIKEN CITY OF (0210001) (Population served: 41,162, Surface water):Past health violations:COLLEGE ACRES PUBLIC W/D (0220002) (Population served: 1,350, Groundwater):
- MCL, Average - Between JAN-2014 and MAR-2014, Contaminant: Combined Radium (-226 and -228). Follow-up actions: St Admin Penalty assessed (SEP-13-2010), St AO (w/penalty) issued (SEP-13-2010), St Public Notif requested (MAY-01-2014), St Violation/Reminder Notice (MAY-01-2014)
- MCL, Average - Between JAN-2010 and MAR-2010, Contaminant: Combined Radium (-226 and -228). Follow-up actions: St Formal NOV issued (JUN-25-2010), St Public Notif requested (JUL-01-2010), St Violation/Reminder Notice (JUL-01-2010), St Show-cause Hearing (JUL-14-2010), St AO (w/penalty) issued (SEP-13-2010), St Admin Penalty assessed (SEP-13-2010)
Past monitoring violations:CAMERON MHP (0260038) (Population served: 81, Groundwater):
- Failure Submit IDSE/Subpart V Plan Rpt - In JUL-02-2010, Contaminant: DBP STAGE 2. Follow-up actions: St Formal NOV issued (OCT-15-2010), St Admin Penalty assessed (NOV-01-2010), St AO (w/penalty) issued (NOV-01-2010), St Show-cause Hearing (NOV-01-2010), St Compliance achieved (APR-03-2012)
- Monitoring, Routine (IDSE) - In APR-02-2010, Contaminant: DBP STAGE 2. Follow-up actions: St Compliance achieved (OCT-01-2010), St Formal NOV issued (OCT-15-2010), St Show-cause Hearing (NOV-01-2010), St Admin Penalty assessed (NOV-01-2010), St AO (w/penalty) issued (NOV-01-2010)
- One minor monitoring violation
Past monitoring violations:WINDSOR GENERAL STORE (0270907) (Population served: 50, Groundwater):
- Monitoring, Repeat Major (TCR) - In NOV-2006, Contaminant: Coliform (TCR). Follow-up actions: St Public Notif requested (DEC-28-2006), St Violation/Reminder Notice (DEC-28-2006), St Compliance achieved (JUL-23-2007)
- One minor monitoring violation
Past monitoring violations:WEYERHAUSER COMPANY (0240004) (Population served: 34, Groundwater):
- One routine major monitoring violation
Past health violations:C&H HOME PARK (0260037) (Population served: 21, Groundwater):
- MCL, Single Sample - Between APR-2009 and JUN-2009, Contaminant: Nitrate. Follow-up actions: St Formal NOV issued (DEC-14-2009), St Violation/Reminder Notice (DEC-14-2009), St Public Notif requested (DEC-14-2009), St Public Notif received (DEC-22-2009), St Show-cause Hearing (DEC-22-2009), St Compliance achieved (JAN-01-2010), St Variance/Exemption issued (JAN-08-2010), St Compliance Meeting conducted (JAN-08-2010)
Past health violations:Past monitoring violations:
- MCL, Monthly (TCR) - In NOV-2009, Contaminant: Coliform. Follow-up actions: St Public Notif requested (FEB-03-2010), St Violation/Reminder Notice (FEB-03-2010), St Public Notif received (MAR-01-2010), St Compliance achieved (JUL-01-2010)
- Monitoring, Source Water (GWR) - In MAY-01-2014, Contaminant: E. COLI. Follow-up actions: St Violation/Reminder Notice (JUN-17-2014), St Public Notif requested (JUN-17-2014)
- One minor monitoring violation
Drinking water stations with addresses in Aiken that have no violations reported:
- MONTMORENCI W/D (0220008) (Population served: 3,442, Primary Water Source Type: Groundwater)
- AIKEN-VALE SVC C CITY OF (0250009) (Population served: 145, Primary Water Source Type: Groundwater)
| This city: | 2.2 people |
| South Carolina: | 2.5 people |
| This city: | 62.3% |
| Whole state: | 67.5% |
| This city: | 4.4% |
| Whole state: | 6.0% |
Likely homosexual households (counted as self-reported same-sex unmarried-partner households)
- Lesbian couples: 0.3% of all households
- Gay men: 0.3% of all households
People in group quarters in Aiken in 2010:
- 804 people in college/university student housing
- 427 people in nursing facilities/skilled-nursing facilities
- 45 people in group homes intended for adults
- 42 people in group homes for juveniles (non-correctional)
- 29 people in other noninstitutional facilities
- 21 people in emergency and transitional shelters (with sleeping facilities) for people experiencing homelessness
- 14 people in residential treatment centers for adults
People in group quarters in Aiken in 2000:
- 534 people in nursing homes
- 321 people in college dormitories (includes college quarters off campus)
- 201 people in local jails and other confinement facilities (including police lockups)
- 126 people in other noninstitutional group quarters
- 60 people in homes for the mentally retarded
- 19 people in mental (psychiatric) hospitals or wards
- 2 people in religious group quarters
Banks with most branches in Aiken (2011 data):
- Security Federal Bank: 1665 Richland Avenue Branch, Southside Branch, at 100 Laurens St Sw, 1705 Whiskey Rd Branch. Info updated 2012/01/04: Bank assets: $916.4 mil, Deposits: $695.8 mil, local headquarters, positive income, Commercial Lending Specialization, 13 total offices, Holding Company: Security Federal Corporation
- First Citizens Bank and Trust Company, Inc.: Aiken Main Office Branch, Whiskey Road Branch, Centre South Branch. Info updated 2011/08/24: Bank assets: $8,104.0 mil, Deposits: $6,880.8 mil, headquarters in Columbia, SC, positive income, 197 total offices, Holding Company: First Citizens Bancorporation, Inc.
- Woodforest National Bank: Aiken Branch at 2035 Whiskey Road, branch established on 2007/10/17; Richland Avenue Branch at 3583 Richland Avenue West, branch established on 2007/10/24. Info updated 2011/05/10: Bank assets: $3,488.9 mil, Deposits: $3,097.6 mil, headquarters in Houston, TX, positive income, Commercial Lending Specialization, 766 total offices, Holding Company: Woodforest Financial Group Employee Stock Ownership Plan (With 401(K) Provisions)
- Wells Fargo Bank, National Association: Aiken Main at 111 Laurens Street, N.W., branch established on 1963/12/23; Heritage Square Branch at 1797 Whiskey Road, branch established on 1974/05/13. Info updated 2011/04/05: Bank assets: $1,161,490.0 mil, Deposits: $905,653.0 mil, headquarters in Sioux Falls, SD, positive income, 6395 total offices, Holding Company: Wells Fargo & Company
- Georgia Bank & Trust Company of Augusta: Pine Log Road Branch at 1001 Pine Log Rd, branch established on 2008/03/05; Southern Bank & Trust Aiken Branch at 149 Laurens Street, Nw, branch established on 2006/09/12. Info updated 2011/12/15: Bank assets: $1,610.4 mil, Deposits: $1,419.7 mil, headquarters in Augusta, GA, positive income, Commercial Lending Specialization, 12 total offices, Holding Company: Southeastern Bank Financial Corporation
- Regions Bank: South Aiken Branch at 1799 Whiskey Road, branch established on 1951/12/17; Aiken Main Branch at 107 Chesterfield Street South, branch established on 1951/12/17. Info updated 2011/02/24: Bank assets: $123,368.2 mil, Deposits: $98,301.3 mil, headquarters in Birmingham, AL, positive income, Commercial Lending Specialization, 1778 total offices, Holding Company: Regions Financial Corporation
- TD Bank, National Association: Aiken Main Branch at 142 Chesterfield Street S., branch established on 1988/08/05; Whiskey Road Branch at 2286 Whiskey Road, branch established on 1989/08/28. Info updated 2010/10/04: Bank assets: $188,912.6 mil, Deposits: $153,149.8 mil, headquarters in Wilmington, DE, positive income, 1314 total offices, Holding Company: Toronto-Dominion Bank, The
- Bank of America, National Association: Aiken Mall Branch at 150 Aiken Mall Drive, branch established on 1992/07/23; Aiken Main Branch at 167 Laurens Street, S.W., branch established on 1906/01/01. Info updated 2009/11/18: Bank assets: $1,451,969.3 mil, Deposits: $1,077,176.8 mil, headquarters in Charlotte, NC, positive income, 5782 total offices, Holding Company: Bank Of America Corporation
- Savannah River Banking Company: at 407 Silver Bluff Road, branch established on 2007/08/01. Info updated 2011/08/15: Bank assets: $154.9 mil, Deposits: $126.3 mil, local headquarters, positive income, Commercial Lending Specialization, 2 total offices, Holding Company: Savannah River Financial Corporation
For population 15 years and over in Aiken:
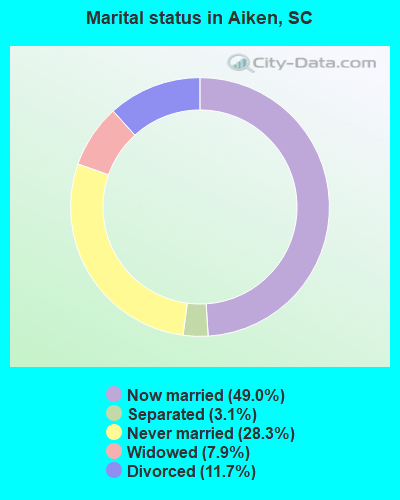
- Never married: 28.3%
- Now married: 49.0%
- Separated: 3.1%
- Widowed: 7.9%
- Divorced: 11.7%
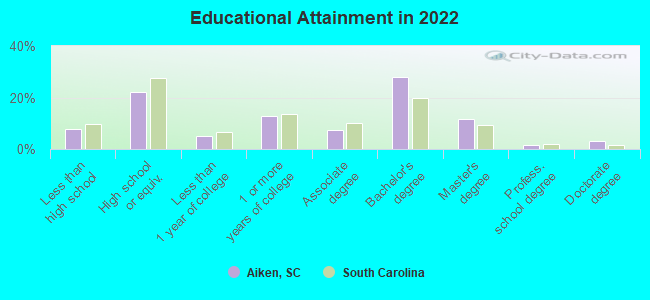
For population 25 years and over in Aiken:
- High school or higher: 92.0%
- Bachelor's degree or higher: 43.1%
- Graduate or professional degree: 16.5%
- Unemployed: 6.6%
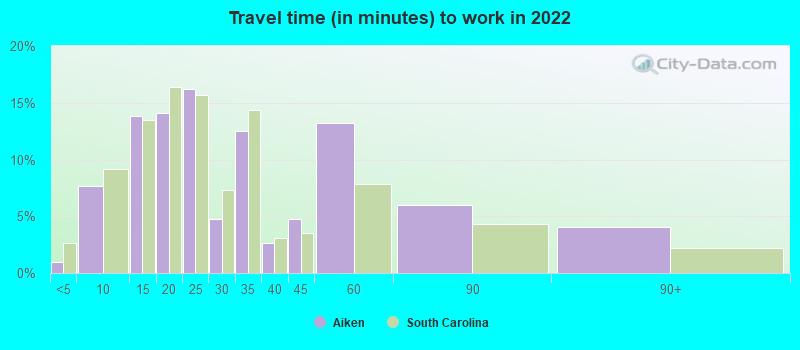
- Mean travel time to work (commute): 21.1 minutes
| Here: | 11.0 |
| South Carolina average: | 11.1 |
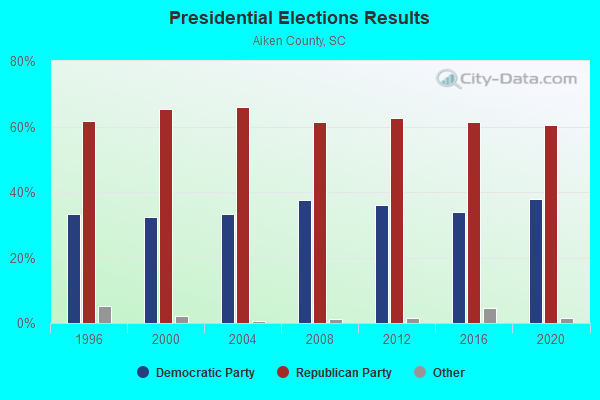
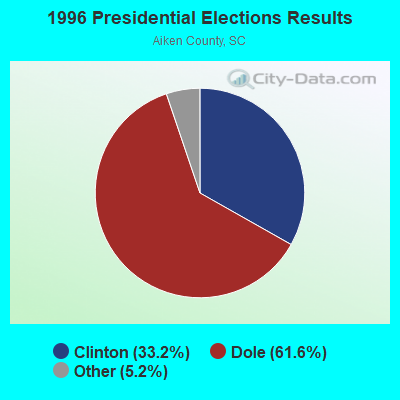
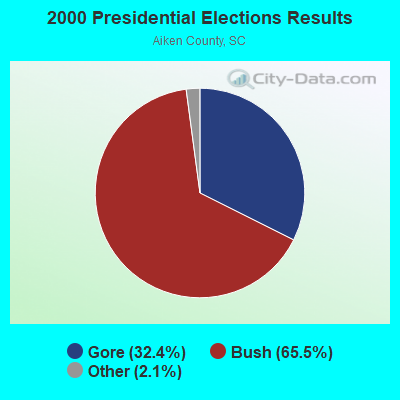
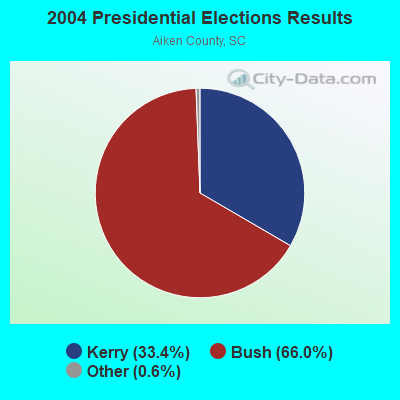
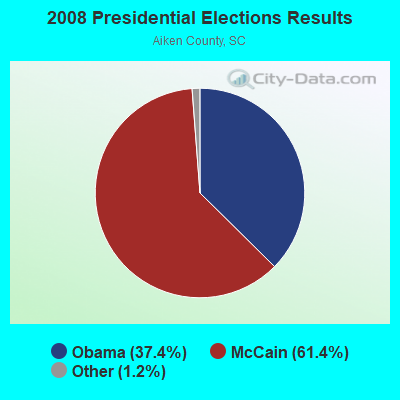
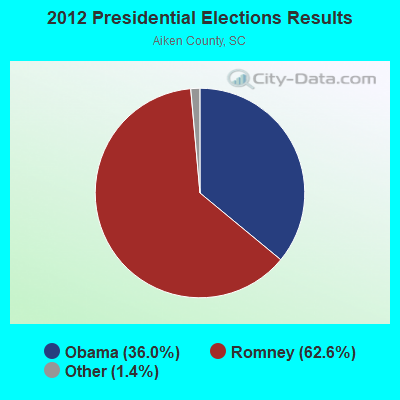


Graphs represent county-level data. Detailed 2008 Election Results
Religion statistics for Aiken, SC (based on Aiken County data)
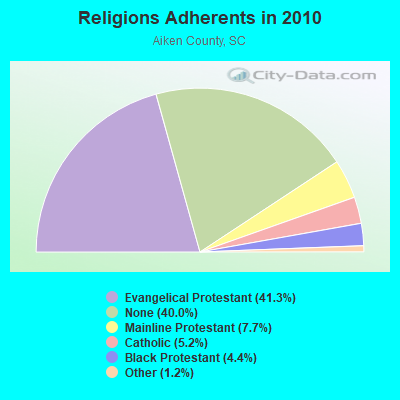
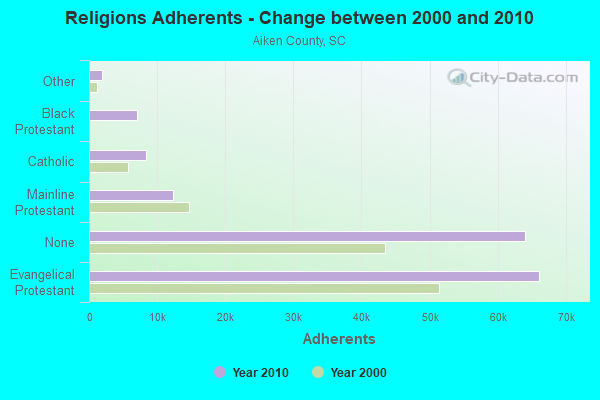
| Religion | Adherents | Congregations |
|---|---|---|
| Evangelical Protestant | 66,138 | 191 |
| Mainline Protestant | 12,303 | 34 |
| Catholic | 8,400 | 4 |
| Black Protestant | 7,116 | 22 |
| Other | 1,949 | 13 |
| Orthodox | 104 | 3 |
| None | 64,089 | - |
Food Environment Statistics:
| Aiken County: | 1.77 / 10,000 pop. |
| South Carolina: | 1.99 / 10,000 pop. |
| This county: | 0.13 / 10,000 pop. |
| State: | 0.15 / 10,000 pop. |
| Aiken County: | 0.79 / 10,000 pop. |
| South Carolina: | 0.85 / 10,000 pop. |
| Aiken County: | 4.92 / 10,000 pop. |
| State: | 5.38 / 10,000 pop. |
| Here: | 4.73 / 10,000 pop. |
| State: | 7.75 / 10,000 pop. |
| This county: | 10.7% |
| South Carolina: | 10.6% |
| Aiken County: | 31.2% |
| South Carolina: | 29.4% |
| This county: | 19.9% |
| State: | 13.4% |
Health and Nutrition:
| This city: | 51.3% |
| South Carolina: | 49.2% |
| Aiken: | 48.4% |
| South Carolina: | 46.2% |
| Here: | 28.8 |
| South Carolina: | 29.0 |
| This city: | 20.6% |
| South Carolina: | 20.4% |
| Here: | 11.4% |
| South Carolina: | 11.0% |
| This city: | 6.8 |
| State: | 6.8 |
| Here: | 35.2% |
| South Carolina: | 34.4% |
| Here: | 56.2% |
| South Carolina: | 55.6% |
| This city: | 79.1% |
| South Carolina: | 79.9% |
More about Health and Nutrition of Aiken, SC Residents
| Local government employment and payroll (March 2022) | |||||
| Function | Full-time employees | Monthly full-time payroll | Average yearly full-time wage | Part-time employees | Monthly part-time payroll |
|---|---|---|---|---|---|
| Police Protection - Officers | 87 | $454,281 | $62,659 | 0 | $0 |
| Water Supply | 55 | $210,315 | $45,887 | 3 | $2,545 |
| Parks and Recreation | 53 | $183,082 | $41,453 | 23 | $27,437 |
| Solid Waste Management | 51 | $159,191 | $37,457 | 0 | $0 |
| Financial Administration | 33 | $173,530 | $63,102 | 6 | $6,739 |
| Police - Other | 29 | $122,737 | $50,788 | 1 | $1,752 |
| Firefighters | 23 | $80,295 | $41,893 | 14 | $6,356 |
| Other Government Administration | 13 | $72,084 | $66,539 | 11 | $11,133 |
| Sewerage | 12 | $38,753 | $38,753 | 0 | $0 |
| Streets and Highways | 8 | $23,761 | $35,642 | 0 | $0 |
| Judicial and Legal | 4 | $17,036 | $51,108 | 0 | $0 |
| Other and Unallocable | 1 | $7,024 | $84,288 | 18 | $2,312 |
| Totals for Government | 369 | $1,542,089 | $50,149 | 76 | $58,272 |
Aiken government finances - Expenditure in 2021 (per resident):
- Current Operations - General - Other: $14,288,000 ($440.13)
Sewerage: $10,147,000 ($312.57)
Police Protection: $8,869,000 ($273.20)
Water Utilities: $5,201,000 ($160.21)
Parks and Recreation: $4,245,000 ($130.76)
Solid Waste Management: $3,024,000 ($93.15)
Central Staff Services: $2,055,000 ($63.30)
General Public Buildings: $1,696,000 ($52.24)
Regular Highways: $1,298,000 ($39.98)
Financial Administration: $669,000 ($20.61)
Judicial and Legal Services: $489,000 ($15.06)
Housing and Community Development: $224,000 ($6.90)
Air Transportation: $188,000 ($5.79)
- Other Capital Outlay - General - Other: $1,446,000 ($44.54)
Parks and Recreation: $1,154,000 ($35.55)
Regular Highways: $1,127,000 ($34.72)
Police Protection: $902,000 ($27.79)
Sewerage: $129,000 ($3.97)
General Public Building: $85,000 ($2.62)
Central Staff Services: $42,000 ($1.29)
Water Utilities: $31,000 ($0.95)
Protective Inspection and Regulation - Other: $27,000 ($0.83)
- Total Salaries and Wages: $17,556,000 ($540.80)
Aiken government finances - Revenue in 2021 (per resident):
- Charges - Sewerage: $9,388,000 ($289.19)
Solid Waste Management: $3,027,000 ($93.24)
Other: $2,368,000 ($72.94)
Parks and Recreation: $698,000 ($21.50)
Regular Highways: $398,000 ($12.26)
Air Transportation: $64,000 ($1.97)
- Federal Intergovernmental - Housing and Community Development: $179,000 ($5.51)
Other: $114,000 ($3.51)
- Local Intergovernmental - Other: $712,000 ($21.93)
- Miscellaneous - Special Assessments: $1,780,000 ($54.83)
Fines and Forfeits: $1,136,000 ($34.99)
General Revenue - Other: $406,000 ($12.51)
Interest Earnings: $319,000 ($9.83)
Rents: $275,000 ($8.47)
Donations From Private Sources: $145,000 ($4.47)
Sale of Property: $7,000 ($0.22)
- Revenue - Water Utilities: $8,913,000 ($274.56)
- State Intergovernmental - General Local Government Support: $499,000 ($15.37)
Other: $421,000 ($12.97)
Highways: $129,000 ($3.97)
- Tax - Property: $13,090,000 ($403.23)
Occupation and Business License - Other: $8,030,000 ($247.36)
Other: $7,160,000 ($220.56)
Public Utility License: $3,044,000 ($93.77)
Other Selective Sales: $2,290,000 ($70.54)
Other License: $1,075,000 ($33.11)
Alcoholic Beverage License: $100,000 ($3.08)
Aiken government finances - Cash and Securities in 2021 (per resident):
- Bond Funds - Cash and Securities: $18,597,000 ($572.87)
- Other Funds - Cash and Securities: $31,329,000 ($965.07)
7.51% of this county's 2021 resident taxpayers lived in other counties in 2020 ($64,067 average adjusted gross income)
| Here: | 7.51% |
| South Carolina average: | 8.89% |
0.03% of residents moved from foreign countries ($243 average AGI)
Aiken County: 0.03% South Carolina average: 0.04%
Top counties from which taxpayers relocated into this county between 2020 and 2021:
| from Richmond County, GA | |
| from Columbia County, GA | |
| from Edgefield County, SC |
| Businesses in Aiken, SC | ||||
| Name | Count | Name | Count | |
|---|---|---|---|---|
| ALDI | 1 | Maurices | 1 | |
| AT&T | 2 | McDonald's | 4 | |
| Academy Sports + Outdoors | 1 | New Balance | 1 | |
| Advance Auto Parts | 3 | Nike | 7 | |
| Aeropostale | 1 | Old Navy | 1 | |
| Applebee's | 1 | Outback | 1 | |
| Arby's | 1 | Outback Steakhouse | 1 | |
| AutoZone | 1 | Papa John's Pizza | 2 | |
| Baskin-Robbins | 1 | Payless | 1 | |
| Bath & Body Works | 1 | Penske | 1 | |
| Bed Bath & Beyond | 1 | PetSmart | 1 | |
| Blockbuster | 1 | Pizza Hut | 3 | |
| Burger King | 3 | Popeyes | 1 | |
| CVS | 3 | Publix Super Markets | 1 | |
| Chevrolet | 1 | Quality | 2 | |
| Chick-Fil-A | 1 | Quiznos | 2 | |
| Circle K | 3 | RadioShack | 1 | |
| Curves | 1 | Red Lobster | 1 | |
| Days Inn | 2 | Rite Aid | 1 | |
| Domino's Pizza | 2 | Ruby Tuesday | 1 | |
| Dunkin Donuts | 1 | Rue21 | 1 | |
| Econo Lodge | 1 | Ryan's Grill | 1 | |
| FedEx | 14 | SAS Shoes | 1 | |
| Finish Line | 1 | SONIC Drive-In | 2 | |
| Firestone Complete Auto Care | 1 | Sears | 2 | |
| Foot Locker | 1 | Sleep Inn | 1 | |
| GNC | 1 | Sprint Nextel | 1 | |
| GameStop | 2 | Staples | 1 | |
| Goodwill | 2 | Starbucks | 1 | |
| H&R Block | 2 | Subway | 7 | |
| Hardee's | 2 | Super 8 | 1 | |
| Hilton | 1 | T-Mobile | 3 | |
| Hobby Lobby | 1 | T.J.Maxx | 1 | |
| Home Depot | 1 | Taco Bell | 1 | |
| Howard Johnson | 1 | Target | 1 | |
| IHOP | 1 | The Room Place | 1 | |
| JCPenney | 1 | Tire Kingdom | 1 | |
| Jones New York | 1 | Toys"R"Us | 1 | |
| Just Tires | 1 | True Value | 2 | |
| KFC | 2 | U-Haul | 5 | |
| Knights Inn | 1 | UPS | 17 | |
| Kroger | 1 | Vans | 1 | |
| La-Z-Boy | 1 | Verizon Wireless | 2 | |
| LensCrafters | 1 | Waffle House | 5 | |
| Little Caesars Pizza | 1 | Walgreens | 2 | |
| Lowe's | 1 | Walmart | 2 | |
| Marriott | 1 | YMCA | 1 | |
Strongest AM radio stations in Aiken:
- WRDW (1480 AM; 10 kW; AUGUSTA, GA; Owner: WCHZ LICENSE, LLC)
- WFAM (1050 AM; 5 kW; AUGUSTA, GA; Owner: J.J. & B. BROADCASTING, INC.)
- WTEL (1630 AM; 10 kW; AUGUSTA, GA; Owner: WCHZ LICENSE, LLC)
- WTHB (1550 AM; 5 kW; AUGUSTA, GA)
- WBAJ (890 AM; daytime; 50 kW; BLYTHEWOOD, SC; Owner: FAMILY FIRST)
- WGAC (580 AM; 5 kW; AUGUSTA, GA; Owner: WGAC LICENSE, LLC)
- WPCH (1380 AM; 4 kW; NORTH AUGUSTA, SC; Owner: CAPSTAR TX LIMITED PARTNERSHIP)
- WCEO (840 AM; daytime; 50 kW; COLUMBIA, SC; Owner: EASTERN BROADCASTING GROUP, INC.)
- WLFJ (660 AM; daytime; 50 kW; GREENVILLE, SC; Owner: CLEAR CHANNEL BROADCASTING LICENSES, INC.)
- WLGO (1170 AM; daytime; 10 kW; LEXINGTON, SC; Owner: LEVAS COMMUNICATIONS, LLC)
- WBCU (1460 AM; 50 kW; UNION, SC)
- WBLR (1430 AM; 5 kW; BATESBURG, SC; Owner: BARINOWSKI INVESTMENT COMPANY)
- WCSZ (1070 AM; 50 kW; SANS SOUCI, SC; Owner: WHYZ RADIO, L.P.)
Strongest FM radio stations in Aiken:
- WKSP (96.3 FM; AIKEN, SC; Owner: CAPSTAR TX LIMITED PARTNERSHIP)
- WAFJ (88.3 FM; BELVEDERE, SC; Owner: RADIO TRAINING NETWORK, INC.)
- WZNY (105.7 FM; AUGUSTA, GA; Owner: CAPSTAR TX LIMITED PARTNERSHIP)
- WAJY (102.7 FM; NEW ELLENTON, SC; Owner: WGAC LICENSE, LLC)
- WBBQ-FM (104.3 FM; AUGUSTA, GA; Owner: CAPSTAR TX LIMITED PARTNERSHIP)
- WKXC-FM (99.5 FM; AIKEN, SC; Owner: WGAC LICENSE, LLC)
- WLPE (91.7 FM; AUGUSTA, GA; Owner: AUGUSTA RADIO FELLOWSHIP INSTITUTE, INC.)
- WSLT (98.3 FM; CLEARWATER, SC; Owner: WGAC LICENSE, LLC)
- WEKL (102.3 FM; AUGUSTA, GA; Owner: CAPSTAR TX LIMITED PARTNERSHIP)
- WKSX-FM (92.7 FM; JOHNSTON, SC; Owner: EDGEFIELD-SALUDA RADIO COMPANY, INC.)
- WACG-FM (90.7 FM; AUGUSTA, GA; Owner: GEORGIA PUBLIC TELECOMMUNICATIONS COMMISSION)
- WAAW (94.7 FM; WILLISTON, SC; Owner: FRANK NEELY)
- WAKB (96.9 FM; WRENS, GA; Owner: RADIO ONE OF AUGUSTA, LLC)
- WBAW-FM (99.1 FM; BARNWELL, SC; Owner: BULLIE BROADCASTING CORPORATION)
- WFXA-FM (103.1 FM; AUGUSTA, GA; Owner: RADIO ONE OF AUGUSTA, LLC)
- WMHK (89.7 FM; COLUMBIA, SC; Owner: COLUMBIA BIBLE COLLEGE B/CING CO.)
- WGOR (93.9 FM; MARTINEZ, GA; Owner: WGOR LICENSE, LLC)
- WZMJ (93.1 FM; BATESBURG, SC; Owner: URBAN RADIO OF SOUTH CAROLINA, LLC)
TV broadcast stations around Aiken:
- WAGT (Channel 26; AUGUSTA, GA; Owner: WAGT TELEVISION, INC.)
- WJBF (Channel 6; AUGUSTA, GA; Owner: MEDIA GENERAL BROADCASTING OF SO. CAROLINA HOLDINGS, INC.)
- WRDW-TV (Channel 12; AUGUSTA, GA; Owner: WRDW LICENSEE CORP.)
- WFXG (Channel 54; AUGUSTA, GA; Owner: FISHER BROADCASTING - GEORGIA, L.L.C.)
- W56EE (Channel 56; JOHNSTON, SC; Owner: DOVE BROADCASTING, INC.)
- WBPI-LP (Channel 49; AUGUSTA, GA; Owner: WATCHMAN BROADCASTING PRODUCTIONS INTERNATIONAL, INC.)
- W58CZ (Channel 58; AUGUSTA, GA; Owner: TRINITY BROADCASTING NETWORK)
- WCES-TV (Channel 20; WRENS, GA; Owner: GEORGIA PUBLIC TELECOMMUNICATIONS COMMISSION)
- WEBA-TV (Channel 14; ALLENDALE, SC; Owner: SOUTH CAROLINA EDUCATIONAL TV COMMISSION)
- WAAU-LP (Channel 18; AUGUSTA, GA; Owner: THOMAS J. PIPER)
- National Bridge Inventory (NBI) Statistics
- 24Number of bridges
- 180ft / 55.4mTotal length
- $2,227,000Total costs
- 153,025Total average daily traffic
- 21,907Total average daily truck traffic
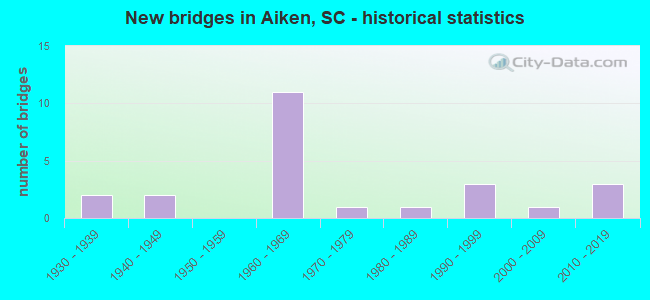
- New bridges - historical statistics
- 21930-1939
- 21940-1949
- 111960-1969
- 11970-1979
- 11980-1989
- 31990-1999
- 12000-2009
- 32010-2019
FCC Registered Antenna Towers: 479 (See the full list of FCC Registered Antenna Towers)
FCC Registered Private Land Mobile Towers: 2 (See the full list of FCC Registered Private Land Mobile Towers in Aiken, SC)
FCC Registered Broadcast Land Mobile Towers: 67 (See the full list of FCC Registered Broadcast Land Mobile Towers)
FCC Registered Microwave Towers: 41 (See the full list of FCC Registered Microwave Towers in this town)
FCC Registered Paging Towers: 4 (See the full list of FCC Registered Paging Towers)
FCC Registered Maritime Coast & Aviation Ground Towers: 5 (See the full list of FCC Registered Maritime Coast & Aviation Ground Towers)
FCC Registered Amateur Radio Licenses: 447 (See the full list of FCC Registered Amateur Radio Licenses in Aiken)
FAA Registered Aircraft Manufacturers and Dealers: 7 (See the full list of FAA Registered Manufacturers and Dealers in Aiken)
FAA Registered Aircraft: 84 (See the full list of FAA Registered Aircraft)
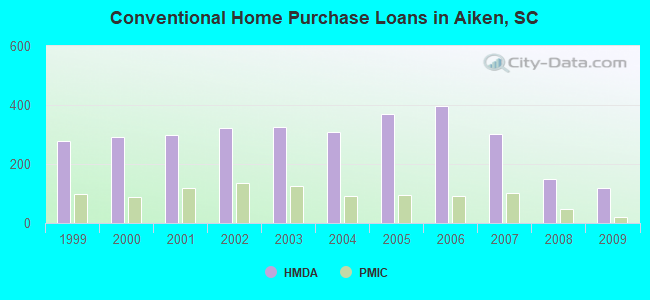
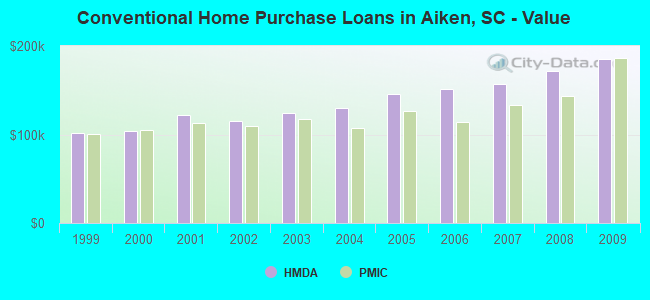
| Home Mortgage Disclosure Act Aggregated Statistics For Year 2009 (Based on 2 full and 5 partial tracts) | ||||||||||||||
| A) FHA, FSA/RHS & VA Home Purchase Loans | B) Conventional Home Purchase Loans | C) Refinancings | D) Home Improvement Loans | E) Loans on Dwellings For 5+ Families | F) Non-occupant Loans on < 5 Family Dwellings (A B C & D) | G) Loans On Manufactured Home Dwelling (A B C & D) | ||||||||
|---|---|---|---|---|---|---|---|---|---|---|---|---|---|---|
| Number | Average Value | Number | Average Value | Number | Average Value | Number | Average Value | Number | Average Value | Number | Average Value | Number | Average Value | |
| LOANS ORIGINATED | 71 | $135,994 | 118 | $185,530 | 452 | $184,288 | 21 | $128,000 | 1 | $1,057,060 | 57 | $169,334 | 3 | $35,257 |
| APPLICATIONS APPROVED, NOT ACCEPTED | 5 | $154,126 | 6 | $132,255 | 39 | $181,533 | 6 | $94,350 | 0 | $0 | 5 | $89,640 | 0 | $0 |
| APPLICATIONS DENIED | 13 | $102,960 | 14 | $119,165 | 111 | $178,061 | 8 | $49,870 | 0 | $0 | 11 | $120,356 | 3 | $49,497 |
| APPLICATIONS WITHDRAWN | 2 | $88,415 | 12 | $250,688 | 97 | $166,549 | 3 | $219,200 | 0 | $0 | 6 | $145,633 | 2 | $83,515 |
| FILES CLOSED FOR INCOMPLETENESS | 2 | $96,485 | 5 | $174,272 | 31 | $154,982 | 1 | $183,840 | 0 | $0 | 6 | $154,263 | 0 | $0 |
Detailed HMDA statistics for the following Tracts: 0212.01 , 0212.02, 0212.03, 0213.00, 0214.00, 0215.00, 0216.02
| Private Mortgage Insurance Companies Aggregated Statistics For Year 2009 (Based on 2 full and 5 partial tracts) | ||||||
| A) Conventional Home Purchase Loans | B) Refinancings | C) Non-occupant Loans on < 5 Family Dwellings (A & B) | ||||
|---|---|---|---|---|---|---|
| Number | Average Value | Number | Average Value | Number | Average Value | |
| LOANS ORIGINATED | 21 | $186,386 | 12 | $175,252 | 3 | $107,323 |
| APPLICATIONS APPROVED, NOT ACCEPTED | 5 | $185,864 | 4 | $237,860 | 0 | $0 |
| APPLICATIONS DENIED | 4 | $115,595 | 2 | $155,185 | 0 | $0 |
| APPLICATIONS WITHDRAWN | 1 | $123,020 | 0 | $0 | 0 | $0 |
| FILES CLOSED FOR INCOMPLETENESS | 0 | $0 | 1 | $152,030 | 0 | $0 |
Detailed PMIC statistics for the following Tracts: 0212.01 , 0212.02, 0212.03, 0213.00, 0214.00, 0215.00, 0216.02
2003 - 2018 National Fire Incident Reporting System (NFIRS) incidents
- Fire incident types reported to NFIRS in Aiken, SC
- 1,50840.8%Outside Fires
- 1,50640.8%Structure Fires
- 61816.7%Mobile Property/Vehicle Fires
- 611.7%Other
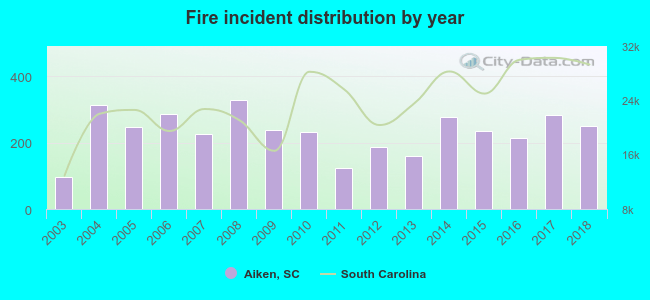 According to the data from the years 2003 - 2018 the average number of fires per year is 231. The highest number of reported fires - 327 took place in 2008, and the least - 95 in 2003. The data has a growing trend.
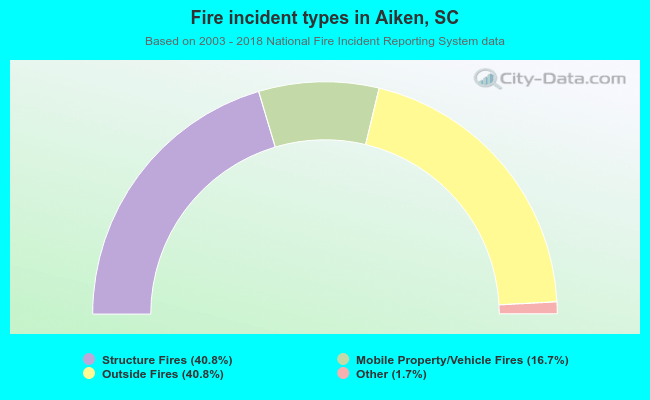 When looking into fire subcategories, the most incidents belonged to: Outside Fires (40.8%), and Structure Fires (40.8%).
Fire-safe hotels and motels in Aiken, South Carolina:
- Days Inn Downtown, 1204 Richland Ave W, Aiken, South Carolina 29801 , Phone: (803) 649-5524, Fax: (803) 649-5524
- The Willcox Inn, 100 Colleton Ave SW, Aiken, South Carolina 29801 , Phone: (803) 648-1898, Fax: (803) 648-6664
- Clarion Inn & Suites, 155 Colony Pkwy, Aiken, South Carolina 29803 , Phone: (803) 648-0999, Fax: (803) 648-9799
- Americas Best Value Inn, 2577 Whiskey Rd, Aiken, South Carolina 29803 , Phone: (803) 641-8800
- Quality Inn, 110 E Frontage Rd, Aiken, South Carolina 29805 , Phone: (803) 502-0900, Fax: (803) 502-0903
- Days Inn, 2654 Columbia Hwy, Aiken, South Carolina 29805 , Phone: (803) 642-5692, Fax: (803) 642-5692
- Fairfield Inn & Suites Aiken, 185 Colony Pkwy, Aiken, South Carolina 29803 , Phone: (803) 648-7808, Fax: (803) 649-6515
- Country Inn & Suites, 3270 Whiskey Rd, Aiken, South Carolina 29803 , Phone: (803) 649-4024, Fax: (803) 649-4012
- 3 other hotels and motels
| Most common first names in Aiken, SC among deceased individuals | ||
| Name | Count | Lived (average) |
|---|---|---|
| James | 420 | 70.1 years |
| John | 368 | 73.8 years |
| William | 319 | 74.2 years |
| Mary | 309 | 77.9 years |
| Robert | 212 | 72.6 years |
| George | 182 | 73.4 years |
| Willie | 166 | 71.8 years |
| Charles | 165 | 73.1 years |
| Annie | 133 | 78.1 years |
| Margaret | 127 | 78.4 years |
| Most common last names in Aiken, SC among deceased individuals | ||
| Last name | Count | Lived (average) |
|---|---|---|
| Johnson | 215 | 71.7 years |
| Williams | 209 | 71.7 years |
| Smith | 160 | 76.3 years |
| Jones | 128 | 73.3 years |
| Brown | 118 | 73.4 years |
| Jackson | 92 | 70.5 years |
| Scott | 78 | 75.5 years |
| Walker | 77 | 72.1 years |
| Thomas | 66 | 67.4 years |
| Davis | 60 | 74.0 years |
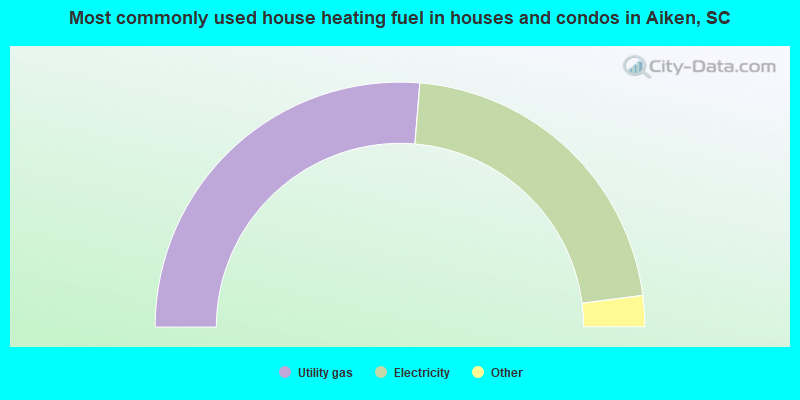
- 52.6%Utility gas
- 43.3%Electricity
- 3.1%Bottled, tank, or LP gas
- 0.7%Solar energy
- 0.2%Wood
- 0.2%Fuel oil, kerosene, etc.
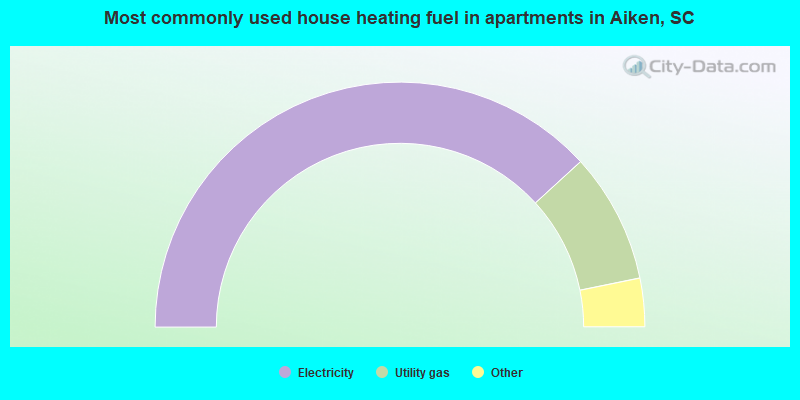
- 76.5%Electricity
- 17.2%Utility gas
- 3.7%Bottled, tank, or LP gas
- 2.4%No fuel used
- 0.2%Fuel oil, kerosene, etc.
Aiken compared to South Carolina state average:
- Unemployed percentage below state average.
- Black race population percentage above state average.
- Hispanic race population percentage below state average.
- Median age above state average.
- Length of stay since moving in significantly above state average.
- Number of college students above state average.
- Percentage of population with a bachelor's degree or higher above state average.
Aiken on our top lists:
- #77 on the list of "Top 101 cities with the most full-time park and recreation workers per 1000 residents (population 5,000+)"
- #88 on the list of "Top 101 cities with the largest racial income disparity between any two races with at least 2,000 householders"
- #72 (29851) on the list of "Top 101 zip codes with the largest percentage of United States first ancestries (pop 5,000+)"
- #11 on the list of "Top 101 counties with the highest percentage of residents that keep firearms around their homes"
- #44 on the list of "Top 101 counties with the largest decrease in the number of births per 1000 residents 2000-2006 to 2007-2013 (pop 50,000+)"
- #67 on the list of "Top 101 counties with the worst general health status score of residents (1-5), 3 years of data"
- #72 on the list of "Top 101 counties with the largest number of people moving in compared to moving out (pop. 50,000+)"

|
|
Total of 213 patent applications in 2008-2024.