Cedar Falls, Iowa Submit your own pictures of this city and show them to the world
OSM Map
General Map
Google Map
MSN Map
OSM Map
General Map
Google Map
MSN Map
OSM Map
General Map
Google Map
MSN Map
OSM Map
General Map
Google Map
MSN Map
Please wait while loading the map...
Population in 2022: 40,746 (95% urban, 5% rural). Population change since 2000: +12.7%Males: 19,190 Females: 21,556
March 2022 cost of living index in Cedar Falls: 86.2 (less than average, U.S. average is 100) Percentage of residents living in poverty in 2022: 17.0%for White Non-Hispanic residents , 40.4% for Black residents , 26.3% for Hispanic or Latino residents , 57.9% for American Indian residents , 40.0% for other race residents , 18.4% for two or more races residents )
Profiles of local businesses
Business Search - 14 Million verified businesses
Data:
Median household income ($)
Median household income (% change since 2000)
Household income diversity
Ratio of average income to average house value (%)
Ratio of average income to average rent
Median household income ($) - White
Median household income ($) - Black or African American
Median household income ($) - Asian
Median household income ($) - Hispanic or Latino
Median household income ($) - American Indian and Alaska Native
Median household income ($) - Multirace
Median household income ($) - Other Race
Median household income for houses/condos with a mortgage ($)
Median household income for apartments without a mortgage ($)
Races - White alone (%)
Races - White alone (% change since 2000)
Races - Black alone (%)
Races - Black alone (% change since 2000)
Races - American Indian alone (%)
Races - American Indian alone (% change since 2000)
Races - Asian alone (%)
Races - Asian alone (% change since 2000)
Races - Hispanic (%)
Races - Hispanic (% change since 2000)
Races - Native Hawaiian and Other Pacific Islander alone (%)
Races - Native Hawaiian and Other Pacific Islander alone (% change since 2000)
Races - Two or more races (%)
Races - Two or more races (% change since 2000)
Races - Other race alone (%)
Races - Other race alone (% change since 2000)
Racial diversity
Unemployment (%)
Unemployment (% change since 2000)
Unemployment (%) - White
Unemployment (%) - Black or African American
Unemployment (%) - Asian
Unemployment (%) - Hispanic or Latino
Unemployment (%) - American Indian and Alaska Native
Unemployment (%) - Multirace
Unemployment (%) - Other Race
Population density (people per square mile)
Population - Males (%)
Population - Females (%)
Population - Males (%) - White
Population - Males (%) - Black or African American
Population - Males (%) - Asian
Population - Males (%) - Hispanic or Latino
Population - Males (%) - American Indian and Alaska Native
Population - Males (%) - Multirace
Population - Males (%) - Other Race
Population - Females (%) - White
Population - Females (%) - Black or African American
Population - Females (%) - Asian
Population - Females (%) - Hispanic or Latino
Population - Females (%) - American Indian and Alaska Native
Population - Females (%) - Multirace
Population - Females (%) - Other Race
Coronavirus confirmed cases (Apr 26, 2024)
Deaths caused by coronavirus (Apr 26, 2024)
Coronavirus confirmed cases (per 100k population) (Apr 26, 2024)
Deaths caused by coronavirus (per 100k population) (Apr 26, 2024)
Daily increase in number of cases (Apr 26, 2024)
Weekly increase in number of cases (Apr 26, 2024)
Cases doubled (in days) (Apr 26, 2024)
Hospitalized patients (Apr 18, 2022)
Negative test results (Apr 18, 2022)
Total test results (Apr 18, 2022)
COVID Vaccine doses distributed (per 100k population) (Sep 19, 2023)
COVID Vaccine doses administered (per 100k population) (Sep 19, 2023)
COVID Vaccine doses distributed (Sep 19, 2023)
COVID Vaccine doses administered (Sep 19, 2023)
Likely homosexual households (%)
Likely homosexual households (% change since 2000)
Likely homosexual households - Lesbian couples (%)
Likely homosexual households - Lesbian couples (% change since 2000)
Likely homosexual households - Gay men (%)
Likely homosexual households - Gay men (% change since 2000)
Cost of living index
Median gross rent ($)
Median contract rent ($)
Median monthly housing costs ($)
Median house or condo value ($)
Median house or condo value ($ change since 2000)
Mean house or condo value by units in structure - 1, detached ($)
Mean house or condo value by units in structure - 1, attached ($)
Mean house or condo value by units in structure - 2 ($)
Mean house or condo value by units in structure by units in structure - 3 or 4 ($)
Mean house or condo value by units in structure - 5 or more ($)
Mean house or condo value by units in structure - Boat, RV, van, etc. ($)
Mean house or condo value by units in structure - Mobile home ($)
Median house or condo value ($) - White
Median house or condo value ($) - Black or African American
Median house or condo value ($) - Asian
Median house or condo value ($) - Hispanic or Latino
Median house or condo value ($) - American Indian and Alaska Native
Median house or condo value ($) - Multirace
Median house or condo value ($) - Other Race
Median resident age
Resident age diversity
Median resident age - Males
Median resident age - Females
Median resident age - White
Median resident age - Black or African American
Median resident age - Asian
Median resident age - Hispanic or Latino
Median resident age - American Indian and Alaska Native
Median resident age - Multirace
Median resident age - Other Race
Median resident age - Males - White
Median resident age - Males - Black or African American
Median resident age - Males - Asian
Median resident age - Males - Hispanic or Latino
Median resident age - Males - American Indian and Alaska Native
Median resident age - Males - Multirace
Median resident age - Males - Other Race
Median resident age - Females - White
Median resident age - Females - Black or African American
Median resident age - Females - Asian
Median resident age - Females - Hispanic or Latino
Median resident age - Females - American Indian and Alaska Native
Median resident age - Females - Multirace
Median resident age - Females - Other Race
Commute - mean travel time to work (minutes)
Travel time to work - Less than 5 minutes (%)
Travel time to work - Less than 5 minutes (% change since 2000)
Travel time to work - 5 to 9 minutes (%)
Travel time to work - 5 to 9 minutes (% change since 2000)
Travel time to work - 10 to 19 minutes (%)
Travel time to work - 10 to 19 minutes (% change since 2000)
Travel time to work - 20 to 29 minutes (%)
Travel time to work - 20 to 29 minutes (% change since 2000)
Travel time to work - 30 to 39 minutes (%)
Travel time to work - 30 to 39 minutes (% change since 2000)
Travel time to work - 40 to 59 minutes (%)
Travel time to work - 40 to 59 minutes (% change since 2000)
Travel time to work - 60 to 89 minutes (%)
Travel time to work - 60 to 89 minutes (% change since 2000)
Travel time to work - 90 or more minutes (%)
Travel time to work - 90 or more minutes (% change since 2000)
Marital status - Never married (%)
Marital status - Now married (%)
Marital status - Separated (%)
Marital status - Widowed (%)
Marital status - Divorced (%)
Median family income ($)
Median family income (% change since 2000)
Median non-family income ($)
Median non-family income (% change since 2000)
Median per capita income ($)
Median per capita income (% change since 2000)
Median family income ($) - White
Median family income ($) - Black or African American
Median family income ($) - Asian
Median family income ($) - Hispanic or Latino
Median family income ($) - American Indian and Alaska Native
Median family income ($) - Multirace
Median family income ($) - Other Race
Median year house/condo built
Median year apartment built
Year house built - Built 2005 or later (%)
Year house built - Built 2000 to 2004 (%)
Year house built - Built 1990 to 1999 (%)
Year house built - Built 1980 to 1989 (%)
Year house built - Built 1970 to 1979 (%)
Year house built - Built 1960 to 1969 (%)
Year house built - Built 1950 to 1959 (%)
Year house built - Built 1940 to 1949 (%)
Year house built - Built 1939 or earlier (%)
Average household size
Household density (households per square mile)
Average household size - White
Average household size - Black or African American
Average household size - Asian
Average household size - Hispanic or Latino
Average household size - American Indian and Alaska Native
Average household size - Multirace
Average household size - Other Race
Occupied housing units (%)
Vacant housing units (%)
Owner occupied housing units (%)
Renter occupied housing units (%)
Vacancy status - For rent (%)
Vacancy status - For sale only (%)
Vacancy status - Rented or sold, not occupied (%)
Vacancy status - For seasonal, recreational, or occasional use (%)
Vacancy status - For migrant workers (%)
Vacancy status - Other vacant (%)
Residents with income below the poverty level (%)
Residents with income below 50% of the poverty level (%)
Children below poverty level (%)
Poor families by family type - Married-couple family (%)
Poor families by family type - Male, no wife present (%)
Poor families by family type - Female, no husband present (%)
Poverty status for native-born residents (%)
Poverty status for foreign-born residents (%)
Poverty among high school graduates not in families (%)
Poverty among people who did not graduate high school not in families (%)
Residents with income below the poverty level (%) - White
Residents with income below the poverty level (%) - Black or African American
Residents with income below the poverty level (%) - Asian
Residents with income below the poverty level (%) - Hispanic or Latino
Residents with income below the poverty level (%) - American Indian and Alaska Native
Residents with income below the poverty level (%) - Multirace
Residents with income below the poverty level (%) - Other Race
Air pollution - Air Quality Index (AQI)
Air pollution - CO
Air pollution - NO2
Air pollution - SO2
Air pollution - Ozone
Air pollution - PM10
Air pollution - PM25
Air pollution - Pb
Crime - Murders per 100,000 population
Crime - Rapes per 100,000 population
Crime - Robberies per 100,000 population
Crime - Assaults per 100,000 population
Crime - Burglaries per 100,000 population
Crime - Thefts per 100,000 population
Crime - Auto thefts per 100,000 population
Crime - Arson per 100,000 population
Crime - City-data.com crime index
Crime - Violent crime index
Crime - Property crime index
Crime - Murders per 100,000 population (5 year average)
Crime - Rapes per 100,000 population (5 year average)
Crime - Robberies per 100,000 population (5 year average)
Crime - Assaults per 100,000 population (5 year average)
Crime - Burglaries per 100,000 population (5 year average)
Crime - Thefts per 100,000 population (5 year average)
Crime - Auto thefts per 100,000 population (5 year average)
Crime - Arson per 100,000 population (5 year average)
Crime - City-data.com crime index (5 year average)
Crime - Violent crime index (5 year average)
Crime - Property crime index (5 year average)
1996 Presidential Elections Results (%) - Democratic Party (Clinton)
1996 Presidential Elections Results (%) - Republican Party (Dole)
1996 Presidential Elections Results (%) - Other
2000 Presidential Elections Results (%) - Democratic Party (Gore)
2000 Presidential Elections Results (%) - Republican Party (Bush)
2000 Presidential Elections Results (%) - Other
2004 Presidential Elections Results (%) - Democratic Party (Kerry)
2004 Presidential Elections Results (%) - Republican Party (Bush)
2004 Presidential Elections Results (%) - Other
2008 Presidential Elections Results (%) - Democratic Party (Obama)
2008 Presidential Elections Results (%) - Republican Party (McCain)
2008 Presidential Elections Results (%) - Other
2012 Presidential Elections Results (%) - Democratic Party (Obama)
2012 Presidential Elections Results (%) - Republican Party (Romney)
2012 Presidential Elections Results (%) - Other
2016 Presidential Elections Results (%) - Democratic Party (Clinton)
2016 Presidential Elections Results (%) - Republican Party (Trump)
2016 Presidential Elections Results (%) - Other
2020 Presidential Elections Results (%) - Democratic Party (Biden)
2020 Presidential Elections Results (%) - Republican Party (Trump)
2020 Presidential Elections Results (%) - Other
Ancestries Reported - Arab (%)
Ancestries Reported - Czech (%)
Ancestries Reported - Danish (%)
Ancestries Reported - Dutch (%)
Ancestries Reported - English (%)
Ancestries Reported - French (%)
Ancestries Reported - French Canadian (%)
Ancestries Reported - German (%)
Ancestries Reported - Greek (%)
Ancestries Reported - Hungarian (%)
Ancestries Reported - Irish (%)
Ancestries Reported - Italian (%)
Ancestries Reported - Lithuanian (%)
Ancestries Reported - Norwegian (%)
Ancestries Reported - Polish (%)
Ancestries Reported - Portuguese (%)
Ancestries Reported - Russian (%)
Ancestries Reported - Scotch-Irish (%)
Ancestries Reported - Scottish (%)
Ancestries Reported - Slovak (%)
Ancestries Reported - Subsaharan African (%)
Ancestries Reported - Swedish (%)
Ancestries Reported - Swiss (%)
Ancestries Reported - Ukrainian (%)
Ancestries Reported - United States (%)
Ancestries Reported - Welsh (%)
Ancestries Reported - West Indian (%)
Ancestries Reported - Other (%)
Educational Attainment - No schooling completed (%)
Educational Attainment - Less than high school (%)
Educational Attainment - High school or equivalent (%)
Educational Attainment - Less than 1 year of college (%)
Educational Attainment - 1 or more years of college (%)
Educational Attainment - Associate degree (%)
Educational Attainment - Bachelor's degree (%)
Educational Attainment - Master's degree (%)
Educational Attainment - Professional school degree (%)
Educational Attainment - Doctorate degree (%)
School Enrollment - Nursery, preschool (%)
School Enrollment - Kindergarten (%)
School Enrollment - Grade 1 to 4 (%)
School Enrollment - Grade 5 to 8 (%)
School Enrollment - Grade 9 to 12 (%)
School Enrollment - College undergrad (%)
School Enrollment - Graduate or professional (%)
School Enrollment - Not enrolled in school (%)
School enrollment - Public schools (%)
School enrollment - Private schools (%)
School enrollment - Not enrolled (%)
Median number of rooms in houses and condos
Median number of rooms in apartments
Housing units lacking complete plumbing facilities (%)
Housing units lacking complete kitchen facilities (%)
Density of houses
Urban houses (%)
Rural houses (%)
Households with people 60 years and over (%)
Households with people 65 years and over (%)
Households with people 75 years and over (%)
Households with one or more nonrelatives (%)
Households with no nonrelatives (%)
Population in households (%)
Family households (%)
Nonfamily households (%)
Population in families (%)
Family households with own children (%)
Median number of bedrooms in owner occupied houses
Mean number of bedrooms in owner occupied houses
Median number of bedrooms in renter occupied houses
Mean number of bedrooms in renter occupied houses
Median number of vehichles in owner occupied houses
Mean number of vehichles in owner occupied houses
Median number of vehichles in renter occupied houses
Mean number of vehichles in renter occupied houses
Mortgage status - with mortgage (%)
Mortgage status - with second mortgage (%)
Mortgage status - with home equity loan (%)
Mortgage status - with both second mortgage and home equity loan (%)
Mortgage status - without a mortgage (%)
Average family size
Average family size - White
Average family size - Black or African American
Average family size - Asian
Average family size - Hispanic or Latino
Average family size - American Indian and Alaska Native
Average family size - Multirace
Average family size - Other Race
Geographical mobility - Same house 1 year ago (%)
Geographical mobility - Moved within same county (%)
Geographical mobility - Moved from different county within same state (%)
Geographical mobility - Moved from different state (%)
Geographical mobility - Moved from abroad (%)
Place of birth - Born in state of residence (%)
Place of birth - Born in other state (%)
Place of birth - Native, outside of US (%)
Place of birth - Foreign born (%)
Housing units in structures - 1, detached (%)
Housing units in structures - 1, attached (%)
Housing units in structures - 2 (%)
Housing units in structures - 3 or 4 (%)
Housing units in structures - 5 to 9 (%)
Housing units in structures - 10 to 19 (%)
Housing units in structures - 20 to 49 (%)
Housing units in structures - 50 or more (%)
Housing units in structures - Mobile home (%)
Housing units in structures - Boat, RV, van, etc. (%)
House/condo owner moved in on average (years ago)
Renter moved in on average (years ago)
Year householder moved into unit - Moved in 1999 to March 2000 (%)
Year householder moved into unit - Moved in 1995 to 1998 (%)
Year householder moved into unit - Moved in 1990 to 1994 (%)
Year householder moved into unit - Moved in 1980 to 1989 (%)
Year householder moved into unit - Moved in 1970 to 1979 (%)
Year householder moved into unit - Moved in 1969 or earlier (%)
Means of transportation to work - Drove car alone (%)
Means of transportation to work - Carpooled (%)
Means of transportation to work - Public transportation (%)
Means of transportation to work - Bus or trolley bus (%)
Means of transportation to work - Streetcar or trolley car (%)
Means of transportation to work - Subway or elevated (%)
Means of transportation to work - Railroad (%)
Means of transportation to work - Ferryboat (%)
Means of transportation to work - Taxicab (%)
Means of transportation to work - Motorcycle (%)
Means of transportation to work - Bicycle (%)
Means of transportation to work - Walked (%)
Means of transportation to work - Other means (%)
Working at home (%)
Industry diversity
Most Common Industries - Agriculture, forestry, fishing and hunting, and mining (%)
Most Common Industries - Agriculture, forestry, fishing and hunting (%)
Most Common Industries - Mining, quarrying, and oil and gas extraction (%)
Most Common Industries - Construction (%)
Most Common Industries - Manufacturing (%)
Most Common Industries - Wholesale trade (%)
Most Common Industries - Retail trade (%)
Most Common Industries - Transportation and warehousing, and utilities (%)
Most Common Industries - Transportation and warehousing (%)
Most Common Industries - Utilities (%)
Most Common Industries - Information (%)
Most Common Industries - Finance and insurance, and real estate and rental and leasing (%)
Most Common Industries - Finance and insurance (%)
Most Common Industries - Real estate and rental and leasing (%)
Most Common Industries - Professional, scientific, and management, and administrative and waste management services (%)
Most Common Industries - Professional, scientific, and technical services (%)
Most Common Industries - Management of companies and enterprises (%)
Most Common Industries - Administrative and support and waste management services (%)
Most Common Industries - Educational services, and health care and social assistance (%)
Most Common Industries - Educational services (%)
Most Common Industries - Health care and social assistance (%)
Most Common Industries - Arts, entertainment, and recreation, and accommodation and food services (%)
Most Common Industries - Arts, entertainment, and recreation (%)
Most Common Industries - Accommodation and food services (%)
Most Common Industries - Other services, except public administration (%)
Most Common Industries - Public administration (%)
Occupation diversity
Most Common Occupations - Management, business, science, and arts occupations (%)
Most Common Occupations - Management, business, and financial occupations (%)
Most Common Occupations - Management occupations (%)
Most Common Occupations - Business and financial operations occupations (%)
Most Common Occupations - Computer, engineering, and science occupations (%)
Most Common Occupations - Computer and mathematical occupations (%)
Most Common Occupations - Architecture and engineering occupations (%)
Most Common Occupations - Life, physical, and social science occupations (%)
Most Common Occupations - Education, legal, community service, arts, and media occupations (%)
Most Common Occupations - Community and social service occupations (%)
Most Common Occupations - Legal occupations (%)
Most Common Occupations - Education, training, and library occupations (%)
Most Common Occupations - Arts, design, entertainment, sports, and media occupations (%)
Most Common Occupations - Healthcare practitioners and technical occupations (%)
Most Common Occupations - Health diagnosing and treating practitioners and other technical occupations (%)
Most Common Occupations - Health technologists and technicians (%)
Most Common Occupations - Service occupations (%)
Most Common Occupations - Healthcare support occupations (%)
Most Common Occupations - Protective service occupations (%)
Most Common Occupations - Fire fighting and prevention, and other protective service workers including supervisors (%)
Most Common Occupations - Law enforcement workers including supervisors (%)
Most Common Occupations - Food preparation and serving related occupations (%)
Most Common Occupations - Building and grounds cleaning and maintenance occupations (%)
Most Common Occupations - Personal care and service occupations (%)
Most Common Occupations - Sales and office occupations (%)
Most Common Occupations - Sales and related occupations (%)
Most Common Occupations - Office and administrative support occupations (%)
Most Common Occupations - Natural resources, construction, and maintenance occupations (%)
Most Common Occupations - Farming, fishing, and forestry occupations (%)
Most Common Occupations - Construction and extraction occupations (%)
Most Common Occupations - Installation, maintenance, and repair occupations (%)
Most Common Occupations - Production, transportation, and material moving occupations (%)
Most Common Occupations - Production occupations (%)
Most Common Occupations - Transportation occupations (%)
Most Common Occupations - Material moving occupations (%)
People in Group quarters - Institutionalized population (%)
People in Group quarters - Correctional institutions (%)
People in Group quarters - Federal prisons and detention centers (%)
People in Group quarters - Halfway houses (%)
People in Group quarters - Local jails and other confinement facilities (including police lockups) (%)
People in Group quarters - Military disciplinary barracks (%)
People in Group quarters - State prisons (%)
People in Group quarters - Other types of correctional institutions (%)
People in Group quarters - Nursing homes (%)
People in Group quarters - Hospitals/wards, hospices, and schools for the handicapped (%)
People in Group quarters - Hospitals/wards and hospices for chronically ill (%)
People in Group quarters - Hospices or homes for chronically ill (%)
People in Group quarters - Military hospitals or wards for chronically ill (%)
People in Group quarters - Other hospitals or wards for chronically ill (%)
People in Group quarters - Hospitals or wards for drug/alcohol abuse (%)
People in Group quarters - Mental (Psychiatric) hospitals or wards (%)
People in Group quarters - Schools, hospitals, or wards for the mentally retarded (%)
People in Group quarters - Schools, hospitals, or wards for the physically handicapped (%)
People in Group quarters - Institutions for the deaf (%)
People in Group quarters - Institutions for the blind (%)
People in Group quarters - Orthopedic wards and institutions for the physically handicapped (%)
People in Group quarters - Wards in general hospitals for patients who have no usual home elsewhere (%)
People in Group quarters - Wards in military hospitals for patients who have no usual home elsewhere (%)
People in Group quarters - Juvenile institutions (%)
People in Group quarters - Long-term care (%)
People in Group quarters - Homes for abused, dependent, and neglected children (%)
People in Group quarters - Residential treatment centers for emotionally disturbed children (%)
People in Group quarters - Training schools for juvenile delinquents (%)
People in Group quarters - Short-term care, detention or diagnostic centers for delinquent children (%)
People in Group quarters - Type of juvenile institution unknown (%)
People in Group quarters - Noninstitutionalized population (%)
People in Group quarters - College dormitories (includes college quarters off campus) (%)
People in Group quarters - Military quarters (%)
People in Group quarters - On base (%)
People in Group quarters - Barracks, unaccompanied personnel housing (UPH), (Enlisted/Officer), ;and similar group living quarters for military personnel (%)
People in Group quarters - Transient quarters for temporary residents (%)
People in Group quarters - Military ships (%)
People in Group quarters - Group homes (%)
People in Group quarters - Homes or halfway houses for drug/alcohol abuse (%)
People in Group quarters - Homes for the mentally ill (%)
People in Group quarters - Homes for the mentally retarded (%)
People in Group quarters - Homes for the physically handicapped (%)
People in Group quarters - Other group homes (%)
People in Group quarters - Religious group quarters (%)
People in Group quarters - Dormitories (%)
People in Group quarters - Agriculture workers' dormitories on farms (%)
People in Group quarters - Job Corps and vocational training facilities (%)
People in Group quarters - Other workers' dormitories (%)
People in Group quarters - Crews of maritime vessels (%)
People in Group quarters - Other nonhousehold living situations (%)
People in Group quarters - Other noninstitutional group quarters (%)
Residents speaking English at home (%)
Residents speaking English at home - Born in the United States (%)
Residents speaking English at home - Native, born elsewhere (%)
Residents speaking English at home - Foreign born (%)
Residents speaking Spanish at home (%)
Residents speaking Spanish at home - Born in the United States (%)
Residents speaking Spanish at home - Native, born elsewhere (%)
Residents speaking Spanish at home - Foreign born (%)
Residents speaking other language at home (%)
Residents speaking other language at home - Born in the United States (%)
Residents speaking other language at home - Native, born elsewhere (%)
Residents speaking other language at home - Foreign born (%)
Class of Workers - Employee of private company (%)
Class of Workers - Self-employed in own incorporated business (%)
Class of Workers - Private not-for-profit wage and salary workers (%)
Class of Workers - Local government workers (%)
Class of Workers - State government workers (%)
Class of Workers - Federal government workers (%)
Class of Workers - Self-employed workers in own not incorporated business and Unpaid family workers (%)
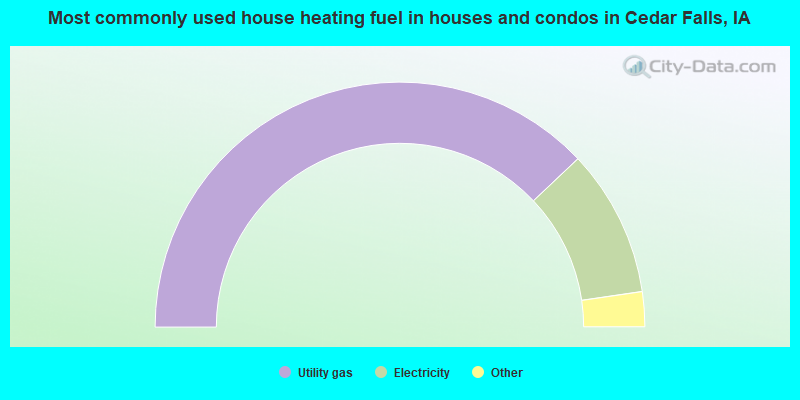
House heating fuel used in houses and condos - Utility gas (%)
House heating fuel used in houses and condos - Bottled, tank, or LP gas (%)
House heating fuel used in houses and condos - Electricity (%)
House heating fuel used in houses and condos - Fuel oil, kerosene, etc. (%)
House heating fuel used in houses and condos - Coal or coke (%)
House heating fuel used in houses and condos - Wood (%)
House heating fuel used in houses and condos - Solar energy (%)
House heating fuel used in houses and condos - Other fuel (%)
House heating fuel used in houses and condos - No fuel used (%)
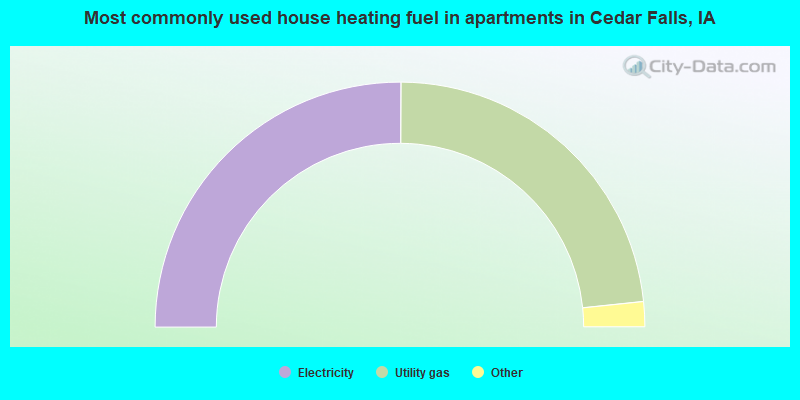
House heating fuel used in apartments - Utility gas (%)
House heating fuel used in apartments - Bottled, tank, or LP gas (%)
House heating fuel used in apartments - Electricity (%)
House heating fuel used in apartments - Fuel oil, kerosene, etc. (%)
House heating fuel used in apartments - Coal or coke (%)
House heating fuel used in apartments - Wood (%)
House heating fuel used in apartments - Solar energy (%)
House heating fuel used in apartments - Other fuel (%)
House heating fuel used in apartments - No fuel used (%)
Armed forces status - In Armed Forces (%)
Armed forces status - Civilian (%)
Armed forces status - Civilian - Veteran (%)
Armed forces status - Civilian - Nonveteran (%)
Fatal accidents locations in years 2005-2021
Fatal accidents locations in 2005
Fatal accidents locations in 2006
Fatal accidents locations in 2007
Fatal accidents locations in 2008
Fatal accidents locations in 2009
Fatal accidents locations in 2010
Fatal accidents locations in 2011
Fatal accidents locations in 2012
Fatal accidents locations in 2013
Fatal accidents locations in 2014
Fatal accidents locations in 2015
Fatal accidents locations in 2016
Fatal accidents locations in 2017
Fatal accidents locations in 2018
Fatal accidents locations in 2019
Fatal accidents locations in 2020
Fatal accidents locations in 2021
Alcohol use - People drinking some alcohol every month (%)
Alcohol use - People not drinking at all (%)
Alcohol use - Average days/month drinking alcohol
Alcohol use - Average drinks/week
Alcohol use - Average days/year people drink much
Audiometry - Average condition of hearing (%)
Audiometry - People that can hear a whisper from across a quiet room (%)
Audiometry - People that can hear normal voice from across a quiet room (%)
Audiometry - Ears ringing, roaring, buzzing (%)
Audiometry - Had a job exposure to loud noise (%)
Audiometry - Had off-work exposure to loud noise (%)
Blood Pressure & Cholesterol - Has high blood pressure (%)
Blood Pressure & Cholesterol - Checking blood pressure at home (%)
Blood Pressure & Cholesterol - Frequently checking blood cholesterol (%)
Blood Pressure & Cholesterol - Has high cholesterol level (%)
Consumer Behavior - Money monthly spent on food at supermarket/grocery store
Consumer Behavior - Money monthly spent on food at other stores
Consumer Behavior - Money monthly spent on eating out
Consumer Behavior - Money monthly spent on carryout/delivered foods
Consumer Behavior - Income spent on food at supermarket/grocery store (%)
Consumer Behavior - Income spent on food at other stores (%)
Consumer Behavior - Income spent on eating out (%)
Consumer Behavior - Income spent on carryout/delivered foods (%)
Current Health Status - General health condition (%)
Current Health Status - Blood donors (%)
Current Health Status - Has blood ever tested for HIV virus (%)
Current Health Status - Left-handed people (%)
Dermatology - People using sunscreen (%)
Diabetes - Diabetics (%)
Diabetes - Had a blood test for high blood sugar (%)
Diabetes - People taking insulin (%)
Diet Behavior & Nutrition - Diet health (%)
Diet Behavior & Nutrition - Milk product consumption (# of products/month)
Diet Behavior & Nutrition - Meals not home prepared (#/week)
Diet Behavior & Nutrition - Meals from fast food or pizza place (#/week)
Diet Behavior & Nutrition - Ready-to-eat foods (#/month)
Diet Behavior & Nutrition - Frozen meals/pizza (#/month)
Drug Use - People that ever used marijuana or hashish (%)
Drug Use - Ever used hard drugs (%)
Drug Use - Ever used any form of cocaine (%)
Drug Use - Ever used heroin (%)
Drug Use - Ever used methamphetamine (%)
Health Insurance - People covered by health insurance (%)
Kidney Conditions-Urology - Avg. # of times urinating at night
Medical Conditions - People with asthma (%)
Medical Conditions - People with anemia (%)
Medical Conditions - People with psoriasis (%)
Medical Conditions - People with overweight (%)
Medical Conditions - Elderly people having difficulties in thinking or remembering (%)
Medical Conditions - People who ever received blood transfusion (%)
Medical Conditions - People having trouble seeing even with glass/contacts (%)
Medical Conditions - People with arthritis (%)
Medical Conditions - People with gout (%)
Medical Conditions - People with congestive heart failure (%)
Medical Conditions - People with coronary heart disease (%)
Medical Conditions - People with angina pectoris (%)
Medical Conditions - People who ever had heart attack (%)
Medical Conditions - People who ever had stroke (%)
Medical Conditions - People with emphysema (%)
Medical Conditions - People with thyroid problem (%)
Medical Conditions - People with chronic bronchitis (%)
Medical Conditions - People with any liver condition (%)
Medical Conditions - People who ever had cancer or malignancy (%)
Mental Health - People who have little interest in doing things (%)
Mental Health - People feeling down, depressed, or hopeless (%)
Mental Health - People who have trouble sleeping or sleeping too much (%)
Mental Health - People feeling tired or having little energy (%)
Mental Health - People with poor appetite or overeating (%)
Mental Health - People feeling bad about themself (%)
Mental Health - People who have trouble concentrating on things (%)
Mental Health - People moving or speaking slowly or too fast (%)
Mental Health - People having thoughts they would be better off dead (%)
Oral Health - Average years since last visit a dentist
Oral Health - People embarrassed because of mouth (%)
Oral Health - People with gum disease (%)
Oral Health - General health of teeth and gums (%)
Oral Health - Average days a week using dental floss/device
Oral Health - Average days a week using mouthwash for dental problem
Oral Health - Average number of teeth
Pesticide Use - Households using pesticides to control insects (%)
Pesticide Use - Households using pesticides to kill weeds (%)
Physical Activity - People doing vigorous-intensity work activities (%)
Physical Activity - People doing moderate-intensity work activities (%)
Physical Activity - People walking or bicycling (%)
Physical Activity - People doing vigorous-intensity recreational activities (%)
Physical Activity - People doing moderate-intensity recreational activities (%)
Physical Activity - Average hours a day doing sedentary activities
Physical Activity - Average hours a day watching TV or videos
Physical Activity - Average hours a day using computer
Physical Functioning - People having limitations keeping them from working (%)
Physical Functioning - People limited in amount of work they can do (%)
Physical Functioning - People that need special equipment to walk (%)
Physical Functioning - People experiencing confusion/memory problems (%)
Physical Functioning - People requiring special healthcare equipment (%)
Prescription Medications - Average number of prescription medicines taking
Preventive Aspirin Use - Adults 40+ taking low-dose aspirin (%)
Reproductive Health - Vaginal deliveries (%)
Reproductive Health - Cesarean deliveries (%)
Reproductive Health - Deliveries resulted in a live birth (%)
Reproductive Health - Pregnancies resulted in a delivery (%)
Reproductive Health - Women breastfeeding newborns (%)
Reproductive Health - Women that had a hysterectomy (%)
Reproductive Health - Women that had both ovaries removed (%)
Reproductive Health - Women that have ever taken birth control pills (%)
Reproductive Health - Women taking birth control pills (%)
Reproductive Health - Women that have ever used Depo-Provera or injectables (%)
Reproductive Health - Women that have ever used female hormones (%)
Sexual Behavior - People 18+ that ever had sex (vaginal, anal, or oral) (%)
Sexual Behavior - Males 18+ that ever had vaginal sex with a woman (%)
Sexual Behavior - Males 18+ that ever performed oral sex on a woman (%)
Sexual Behavior - Males 18+ that ever had anal sex with a woman (%)
Sexual Behavior - Males 18+ that ever had any sex with a man (%)
Sexual Behavior - Females 18+ that ever had vaginal sex with a man (%)
Sexual Behavior - Females 18+ that ever performed oral sex on a man (%)
Sexual Behavior - Females 18+ that ever had anal sex with a man (%)
Sexual Behavior - Females 18+ that ever had any kind of sex with a woman (%)
Sexual Behavior - Average age people first had sex
Sexual Behavior - Average number of female sex partners in lifetime (males 18+)
Sexual Behavior - Average number of female vaginal sex partners in lifetime (males 18+)
Sexual Behavior - Average age people first performed oral sex on a woman (18+)
Sexual Behavior - Average number of woman performed oral sex on in lifetime (18+)
Sexual Behavior - Average number of male sex partners in lifetime (males 18+)
Sexual Behavior - Average number of male anal sex partners in lifetime (males 18+)
Sexual Behavior - Average age people first performed oral sex on a man (18+)
Sexual Behavior - Average number of male oral sex partners in lifetime (18+)
Sexual Behavior - People using protection when performing oral sex (%)
Sexual Behavior - Average number of times people have vaginal or anal sex a year
Sexual Behavior - People having sex without condom (%)
Sexual Behavior - Average number of male sex partners in lifetime (females 18+)
Sexual Behavior - Average number of male vaginal sex partners in lifetime (females 18+)
Sexual Behavior - Average number of female sex partners in lifetime (females 18+)
Sexual Behavior - Circumcised males 18+ (%)
Sleep Disorders - Average hours sleeping at night
Sleep Disorders - People that has trouble sleeping (%)
Smoking-Cigarette Use - People smoking cigarettes (%)
Taste & Smell - People 40+ having problems with smell (%)
Taste & Smell - People 40+ having problems with taste (%)
Taste & Smell - People 40+ that ever had wisdom teeth removed (%)
Taste & Smell - People 40+ that ever had tonsils teeth removed (%)
Taste & Smell - People 40+ that ever had a loss of consciousness because of a head injury (%)
Taste & Smell - People 40+ that ever had a broken nose or other serious injury to face or skull (%)
Taste & Smell - People 40+ that ever had two or more sinus infections (%)
Weight - Average height (inches)
Weight - Average weight (pounds)
Weight - Average BMI
Weight - People that are obese (%)
Weight - People that ever were obese (%)
Weight - People trying to lose weight (%)
According to our research of Iowa and other state lists, there were 19 registered sex offenders living in Cedar Falls, Iowa as of April 26, 2024 . The ratio of all residents to sex offenders in Cedar Falls is 2,168 to 1.The ratio of registered sex offenders to all residents in this city is much lower than the state average.
Officers per 1,000 residents here:
1.62Iowa average:
1.76
Latest news from Cedar Falls, IA collected exclusively by city-data.com from local newspapers, TV, and radio stations
Ancestries: German (34.3%), American (8.7%), European (6.1%), Irish (5.5%), English (5.5%), Norwegian (5.1%).
Current Local Time:
Incorporated on 02/24/1858
Land area: 28.3 square miles.
Population density: 1,440 people per square mile (low).
2,041 residents are foreign born (3.0% Asia , 1.1% Latin America , 0.6% Europe ).
Median real estate property taxes paid for housing units with mortgages in 2022: $3,591 (1.4%)Median real estate property taxes paid for housing units with no mortgage in 2022: $3,685 (1.5%)
Nearest city with pop. 50,000+: Waterloo, IA
Nearest city with pop. 200,000+: Madison, WI
Nearest city with pop. 1,000,000+: Chicago, IL
Nearest cities:
Latitude: 42.52 N, Longitude: 92.45 W
Daytime population change due to commuting: +4,755 (+11.8%)Workers who live and work in this city: 14,235 (63.0%)
Property values in Cedar Falls, IA
Single-family new house construction building permits:
2022: 70 buildings , average cost: $272,6002021: 92 buildings , average cost: $314,3002020: 114 buildings , average cost: $281,8002019: 91 buildings , average cost: $269,7002018: 106 buildings , average cost: $263,1002017: 121 buildings , average cost: $249,7002016: 151 buildings , average cost: $219,4002015: 107 buildings , average cost: $252,3002014: 151 buildings , average cost: $263,6002013: 126 buildings , average cost: $218,9002012: 190 buildings , average cost: $191,9002011: 184 buildings , average cost: $188,0002010: 212 buildings , average cost: $189,8002009: 160 buildings , average cost: $196,9002008: 141 buildings , average cost: $220,8002007: 220 buildings , average cost: $206,2002006: 206 buildings , average cost: $210,9002005: 199 buildings , average cost: $208,3002004: 184 buildings , average cost: $206,3002003: 156 buildings , average cost: $218,9002002: 98 buildings , average cost: $200,5002001: 112 buildings , average cost: $199,4002000: 107 buildings , average cost: $173,1001999: 73 buildings , average cost: $172,4001998: 69 buildings , average cost: $182,3001997: 56 buildings , average cost: $143,900Unemployment in December 2023: Population change in the 1990s: +2,251 (+6.6%).
Most common occupations in Cedar Falls, IA (%)
Both Males Females
Retail sales workers, except cashiers (4.8%)
Other sales and related occupations, including supervisors (4.2%)
Other management occupations, except farmers and farm managers (3.7%)
Other office and administrative support workers, including supervisors (3.6%)
Secretaries and administrative assistants (3.6%)
Postsecondary teachers (3.3%)
Preschool, kindergarten, elementary, and middle school teachers (3.2%)
Other sales and related occupations, including supervisors (5.3%)
Other management occupations, except farmers and farm managers (4.6%)
Retail sales workers, except cashiers (4.0%)
Metal workers and plastic workers (3.3%)
Material recording, scheduling, dispatching, and distributing workers (3.2%)
Engineers (3.2%)
Postsecondary teachers (3.1%)
Secretaries and administrative assistants (6.8%)
Other office and administrative support workers, including supervisors (5.5%)
Retail sales workers, except cashiers (5.5%)
Preschool, kindergarten, elementary, and middle school teachers (5.1%)
Waiters and waitresses (4.5%)
Postsecondary teachers (3.5%)
Supervisors and other personal care and service workers, except child care workers (3.4%)
Air pollution and air quality trends(lower is better)
AQI PM2.5
Tornado activity:
Cedar Falls-area historical tornado activity is slightly above Iowa state average. It is 109% greater than the overall U.S. average.
On 5/25/2008, a category F5 (max. wind speeds 261-318 mph) tornado 22.2 miles away from the Cedar Falls city center killed 9 people and injured 70 people and caused $100 million in damages.
On 5/15/1968, a category F5 tornado 28.2 miles away from the city center killed 5 people and injured 156 people and caused between $5,000,000 and $50,000,000 in damages.
Earthquake activity:
Cedar Falls-area historical earthquake activity is significantly above Iowa state average. It is 131% greater than the overall U.S. average. On 4/18/2008 at 09:36:59, a magnitude 5.4 (5.1 MB, 4.8 MS, 5.4 MW, 5.2 MW, Class: Moderate, Intensity: VI - VII) earthquake occurred 369.8 miles away from Cedar Falls center On 6/10/1987 at 23:48:54, a magnitude 5.1 (4.9 MB, 4.4 MS, 4.6 MS, 5.1 LG) earthquake occurred 350.4 miles away from Cedar Falls center On 4/18/2008 at 09:36:59, a magnitude 5.2 (5.2 MW, Depth: 8.9 mi) earthquake occurred 369.8 miles away from the city center On 6/28/2004 at 06:10:52, a magnitude 4.2 (4.2 MW, Depth: 6.2 mi, Class: Light, Intensity: IV - V) earthquake occurred 196.6 miles away from Cedar Falls center On 7/9/1975 at 14:54:15, a magnitude 4.6 (4.6 MB) earthquake occurred 281.4 miles away from the city center On 9/3/2016 at 12:02:44, a magnitude 5.8 (5.8 MW, Depth: 3.5 mi) earthquake occurred 484.8 miles away from Cedar Falls center Magnitude types: regional Lg-wave magnitude (LG), body-wave magnitude (MB), surface-wave magnitude (MS), moment magnitude (MW) Natural disasters: The number of natural disasters in Black Hawk County (18) is near the US average (15).Major Disasters (Presidential) Declared: 17Emergencies Declared: 1Floods: 14, Storms: 11, Tornadoes: 6, Heavy Rains: 2, Hurricane: 1, Wind: 1, Winter Storm: 1, Other: 1 (Note: some incidents may be assigned to more than one category). Hospitals and medical centers in Cedar Falls: CARLTON DRIVE GROUP HOME (3916 CARLTON DRIVE) HIGHLAND DRIVE GROUP HOME (202 HIGHLAND DRIVE) ROWND STREET GROUP HOME (2714 ROWND STREET) SARTORI MEMORIAL HOSPITAL (Voluntary non-profit - Church, 515 COLLEGE STREET) THEIMER GROUP HOME (1605 THEIMER) CEDAR FALLS HEALTH CARE CENTER (1728 WEST EIGHTH STREET)
MARTIN HEALTH CENTER, INC (420 EAST 11TH STREET)
NEWALDAYA LIFESCAPES (7511 UNIVERSITY AVENUE)
WINDSOR NURSING AND REHAB CENTER (2305 CRESCENT DRIVE)
Colleges/Universities in Cedar Falls: University of Northern Iowa Full-time enrollment: 10,816; Location: 1227 W 27th St; Public; Website: www.uni.edu; Offers Doctor's degree )
Kaplan University-Cedar Falls Campus Full-time enrollment: 880; Location: 7009 Nordic Drive; Private, for-profit; Website: www.kaplanuniversity.edu/cedar-falls-iowa.aspx; Offers Master's degree )
La James International College-Cedar Falls Full-time enrollment: 128; Location: 6322 University Ave; Private, for-profit; Website: www.lajamesinternational.com)
Other colleges/universities with over 2000 students near Cedar Falls:
Hawkeye Community College (about 9 miles; Waterloo, IA ; Full-time enrollment: 7,160)
Upper Iowa University (about 40 miles; Fayette, IA ; FT enrollment: 5,275)
Northeast Iowa Community College-Calmar (about 54 miles; Calmar, IA ; FT enrollment: 3,365)
North Iowa Area Community College (about 56 miles; Mason City, IA ; FT enrollment: 2,235)
Kirkwood Community College (about 59 miles; Cedar Rapids, IA ; FT enrollment: 11,503)
Luther College (about 64 miles; Decorah, IA ; FT enrollment: 2,700)
Iowa State University (about 71 miles; Ames, IA ; FT enrollment: 28,662)
Public high schools in Cedar Falls:
Private high school in Cedar Falls: VALLEY LUTHERAN SCHOOL Students: 100, Location: 4520 ROWND ST, Grades: 6-12)
Public elementary/middle schools in Cedar Falls: CEDAR HEIGHTS ELEMENTARY SCHOOL Students: 468, Location: 2417 RAINBOW DR, Grades: PK-6)HELEN A HANSEN ELEMENTARY SCHOOL Students: 454, Location: 616 HOLMES DR, Grades: PK-6)SOUTHDALE ELEMENTARY SCHOOL Students: 412, Location: 627 ORCHARD DR, Grades: PK-6)ORCHARD HILL ELEMENTARY SCHOOL Students: 324, Location: 3909 ROWND ST, Grades: KG-6)NORTH CEDAR ELEMENTARY SCHOOL Students: 192, Location: 2419 FERN AVE, Grades: PK-6)LINCOLN ELEMENTARY SCHOOL Location: 321 8TH STREET, Grades: KG-6)
Private elementary/middle school in Cedar Falls:
See full list of schools located in Cedar Falls Library in Cedar Falls: CEDAR FALLS PUBLIC LIBRARY Operating income: $1,491,110; Location: 524 MAIN ST; 129,314 books ; 3,555 audio materials ; 3,288 video materials ; 4 local licensed databases ; 25 state licensed databases ; 261 print serial subscriptions ; 1 electronic serial subscriptions )
User-submitted facts and corrections:
Please list Wartburg College in Waverly, IA as a nearby college. It is only 20 minutes from Cedar Falls and it is a great college!
Notable locations in Cedar Falls: (A) , Washington Park Golf Course (B) , Walters Ridge Golf Course (C) , Pheasant Ridge Golf Course (D) , Jennings Court (E) , Hillside Courts (F) , Center for Energy and Environmental Education (G) , Industrial Technology Center (H) , College Courts (I) , Visitor and Information Center (J) , Gallagher-Bluedorn Performing Arts Center (K) , Shull Hall (L) , Noehren Hall (M) , Redeker Center (N) , Biology Research Complex (O) , Latham Hall (P) , Gilchrist Hall (Q) , Rider Hall (R) , Hagemann Hall (S) , McCollum Science Hall (T) . Display/hide their locations on the map
Shopping Centers: (1) , College Square Mall (2) . Display/hide their locations on the map
Churches in Cedar Falls include: (A) , Trinity Wesleyan Church (B) , Cedar Falls Church of Christ (C) , First Christian Science Church (D) , First Church of Christ Scientist (E) , First United Methodist Church (F) , Saint Patrick Church (G) , First Baptist Church (H) , First Presbyterian Church (I) . Display/hide their locations on the map
Cemeteries: (1) , Fairview Cemetery (2) , Greenwood Cemetery (3) , Hillside Cemetery (4) . Display/hide their locations on the map
Reservoirs: (A) , Prairie Lakes (B) . Display/hide their locations on the map
Streams, rivers, and creeks: (A) , Dry Run (B) . Display/hide their locations on the map
Parks in Cedar Falls include: (1) , Historic Cedar Falls State Historical Marker (2) , First Settlers in Black Hawk County Historical Marker (3) , Sturgis Park (4) , Dedication to Peter Melendy Historical Marker (5) , Peter Melendy Park (6) , Dedication to Zimri Streeter Historical Marker (7) , Prairie Lakes Park (8) , Eldorado Heights Park (9) . Display/hide their locations on the map
Tourist attractions: (1) , Hearst Center for the Arts (Museums; 304 West Seerley Boulevard) (2) , George WYTH House & Viking Pump Museum (303 Franklin Street) (3) , Cedar Falls Historical Society (Museums; 303 Franklin Street) (4) , Cedar Falls Historical (Museums; 121 Center Street) (5) , Hartman Reserve Nature (Nature Centers; 657 Reserve Drive) (6) , Stimulus Entertainment (Arcades & Amusements; 3029 Rainbow Drive) (7) , Short's Travel Managament Inc (Tours & Charters; 6301 University Avenue) (8) . Display/hide their approximate locations on the map
Hotels: (1) , Trails End Lodge (122 Washington Street) (2) , Greenstreets (5826 University Avenue) (3) , Red Fox Inn (1900 Heritage Way) (4) , Americinn Lodge & Suites (5818 Nordic Drive) (5) , Country Inn-Stes Cedar Falls (2910 South Main Street) (6) , Black Hawk Hotel (115 Main Street) (7) , Days Inn Cedar Falls IA (5826 University Avenue Building 2) (8) , University Inn (4711 University Avenue) (9) . Display/hide their approximate locations on the map
Birthplace of: Gil Gutknecht - Politician, Marc Andreessen - Blogger, Nick Ring - Box, Gerald Guralnik - Physicist, John H. Livingston - Aviator, Terry Stotts - Basketball player-coach, Roger Jepsen - Politician, Gary Kroeger - Game show host, Matt Wagner (baseball) - Baseball player, Troy Stedman - Football player.
Black Hawk County has a predicted average indoor radon screening level greater than 4 pCi/L (pico curies per liter) - Highest Potential Drinking water stations with addresses in Cedar Falls and their reported violations in the past:
CEDAR FALLS MUNICIPAL WATER UTILITIES (Population served: 39,260, Groundwater):
Past health violations:
MCL, Monthly (TCR) - In NOV-2005, Contaminant: Coliform. Follow-up actions: St Violation/Reminder Notice (NOV-03-2005), St Public Notif received (NOV-28-2005), St Compliance achieved (MAY-31-2006)
MCL, Monthly (TCR) - In OCT-2005, Contaminant: Coliform. Follow-up actions: St Violation/Reminder Notice (OCT-13-2005), St Public Notif received (NOV-28-2005), St Compliance achieved (MAY-31-2006)
Past monitoring violations:
3 regular monitoring violations
Drinking water stations with addresses in Cedar Falls that have no violations reported:
CEDAR FALLS MOBILE HOME VILLAGE (Address: 4107 HORSESHOE DR Population served: 440, Primary Water Source Type: Groundwater)
DIETRICK MOBILE HOME PARK (Address: 34304 160TH ST Population served: 212, Primary Water Source Type: Groundwater)
PHEASANT RIDGE PRO SHOP (Address: 110 E 13TH ST Population served: 155, Primary Water Source Type: Groundwater)
ROBINSON-DRESSER SPORTS COMPLEX (Address: 2001 FAIRVIEW DR Population served: 128, Primary Water Source Type: Groundwater)
Average household size: This city:
2.4 peopleIowa:
2.4 people
Percentage of family households: This city:
55.4%Whole state:
64.7%
Percentage of households with unmarried partners: This city:
5.3%Whole state:
6.7%
Likely homosexual households (counted as self-reported same-sex unmarried-partner households)
Lesbian couples: 0.3% of all households Gay men: 0.2% of all households
People in group quarters in Cedar Falls in 2010:
4,186 people in college/university student housing
354 people in nursing facilities/skilled-nursing facilities
29 people in group homes intended for adults
4 people in workers' group living quarters and job corps centers
People in group quarters in Cedar Falls in 2000:
4,005 people in college dormitories (includes college quarters off campus)
524 people in nursing homes
111 people in other noninstitutional group quarters
32 people in other nonhousehold living situations
13 people in homes for the mentally retarded
5 people in religious group quarters
4 people in other group homes
Arena or stadium:
UNI-Dome. University of Northern Iowa.
Banks with most branches in Cedar Falls (2011 data):
U.S. Bank National Association: Cedar Falls Washington Branch, Cedar Heights Branch, Cedar Falls College Square Mall Bran. Info updated 2012/01/30: Bank assets: $330,470.8 mil, Deposits: $236,091.5 mil, headquarters in Cincinnati, OH, positive income , 3121 total offices , Holding Company: U.S. Bancorp
Lincoln Savings Bank: at 301 Washington Street, branch established on 1902/01/01; Viking Road Branch at 225 West Viking Road, branch established on 2003/10/15. Info updated 2006/11/03: Bank assets: $582.9 mil, Deposits: $430.7 mil, local headquarters , positive income , Agricultural Specialization, 14 total offices , Holding Company: Lincoln Bancorp
Regions Bank: Depot Branch at 422 Main, branch established on 1987/07/01; University Avenue Branch at 4417 University Avenue, branch established on 1961/07/11. Info updated 2011/02/24: Bank assets: $123,368.2 mil, Deposits: $98,301.3 mil, headquarters in Birmingham, AL, positive income , Commercial Lending Specialization, 1778 total offices , Holding Company: Regions Financial Corporation
Wells Fargo Bank, National Association: Cedar Falls Branch at 302 Main Street, branch established on 1928/10/27; College Square Branch at 6309 University Avenue, branch established on 1985/12/31. Info updated 2011/04/05: Bank assets: $1,161,490.0 mil, Deposits: $905,653.0 mil, headquarters in Sioux Falls, SD, positive income , 6395 total offices , Holding Company: Wells Fargo & Company
First National Bank: West Branch at 2421 White Tail Drive, branch established on 1999/04/16; Cedar Falls Branch at 602 Main Street, branch established on 1917/05/23. Info updated 2006/11/03: Bank assets: $287.8 mil, Deposits: $248.0 mil, headquarters in Waverly, IA, positive income , Agricultural Specialization, 6 total offices , Holding Company: First Of Waverly Corporation
Community National Bank: University Avenue Branch at 6004 University Avenue, branch established on 2000/05/22; Cedar Falls Branch at 2322 West 1st Street, branch established on 1997/08/18. Info updated 2006/11/03: Bank assets: $225.1 mil, Deposits: $199.6 mil, headquarters in Waterloo, IA, positive income , Commercial Lending Specialization, 6 total offices , Holding Company: Community National Bancorporation
BankIowa of Cedar Rapids: University Avenue Branch at 6804 University Avenue, branch established on 1905/01/01. Info updated 2006/11/03: Bank assets: $464.4 mil, Deposits: $375.8 mil, headquarters in Cedar Rapids, IA, positive income , Commercial Lending Specialization, 11 total offices , Holding Company: Fidelity Ban Corporation
Liberty Bank, F.S.B.: Cedar Falls Branch at 205 West 2nd Street, branch established on 2007/08/01. Info updated 2011/07/21: Bank assets: $934.1 mil, Deposits: $843.6 mil, headquarters in West Des Moines, IA, negative income in the last year , Commercial Lending Specialization, 27 total offices
MidWestOne Bank: Cedar Falls - Branch 37 at 4510 Prairie Pkwy, branch established on 2008/01/09. Info updated 2008/09/04: Bank assets: $1,676.4 mil, Deposits: $1,308.1 mil, headquarters in Iowa City, IA, positive income , Commercial Lending Specialization, 26 total offices , Holding Company: Midwestone Financial Group, Inc.
2 other banks with 2 local branches
For population 15 years and over in Cedar Falls:
Never married: 47.6%Now married: 40.0%Separated: 1.2%Widowed: 4.5%Divorced: 6.7% For population 25 years and over in Cedar Falls:
High school or higher: 97.2%Bachelor's degree or higher: 49.1%Graduate or professional degree: 20.7%Unemployed: 4.0%Mean travel time to work (commute): 12.7 minutes
Education Gini index (Inequality in education) Here:
9.7Iowa average:
10.5
Religion statistics for Cedar Falls, IA (based on Black Hawk County data)
Religion Adherents Congregations Mainline Protestant 24,947 54 Catholic 20,049 11 Evangelical Protestant 14,577 77 Black Protestant 9,116 11 Other 2,392 11 Orthodox 60 1 None 59,949 -
Source: Clifford Grammich, Kirk Hadaway, Richard Houseal, Dale E.Jones, Alexei Krindatch, Richie Stanley and Richard H.Taylor. 2012. 2010 U.S.Religion Census: Religious Congregations & Membership Study. Association of Statisticians of American Religious Bodies. Jones, Dale E., et al. 2002. Congregations and Membership in the United States 2000. Nashville, TN: Glenmary Research Center. Graphs represent county-level data
Food Environment Statistics: Number of grocery stores : 21Here :
1.65 / 10,000 pop.Iowa :
2.14 / 10,000 pop.
Number of supercenters and club stores : 3Black Hawk County :
0.24 / 10,000 pop.Iowa :
0.23 / 10,000 pop.
Number of convenience stores (no gas) : 5This county :
0.39 / 10,000 pop.Iowa :
0.43 / 10,000 pop.
Number of convenience stores (with gas) : 59Black Hawk County :
4.64 / 10,000 pop.Iowa :
5.55 / 10,000 pop.
Number of full-service restaurants : 94Here :
7.39 / 10,000 pop.Iowa :
8.01 / 10,000 pop.
Adult diabetes rate : Black Hawk County :
7.9%Iowa :
7.8%
Low-income preschool obesity rate : Black Hawk County :
14.0%Iowa :
14.5%
Health and Nutrition: Healthy diet rate : This city:
52.5%Iowa:
49.5%
Average overall health of teeth and gums : Cedar Falls:
53.5%Iowa:
46.1%
People feeling badly about themselves : Cedar Falls:
19.8%Iowa:
21.4%
People not drinking alcohol at all : Average hours sleeping at night : General health condition : Cedar Falls:
61.4%Iowa:
55.9%
Average condition of hearing : Cedar Falls:
81.0%Iowa:
77.7%
More about Health and Nutrition of Cedar Falls, IA Residents
Local government employment and payroll (March 2022)
Function
Full-time employees
Monthly full-time payroll
Average yearly full-time wage
Part-time employees
Monthly part-time payroll
Electric Power
123 $903,958 $88,191 0 $0 Police Protection - Officers
49 $360,156 $88,201 0 $0 Gas Supply
35 $258,274 $88,551 0 $0 Streets and Highways
31 $163,244 $63,191 0 $0 Firefighters
26 $193,150 $89,146 0 $0 Other Government Administration
24 $173,492 $86,746 11 $9,323 Water Supply
18 $129,137 $86,091 0 $0 Other and Unallocable
17 $96,277 $67,960 1 $2,854 Sewerage
15 $78,680 $62,944 0 $0 Parks and Recreation
14 $81,530 $69,883 74 $66,891 Local Libraries
12 $52,297 $52,297 21 $37,570 Financial Administration
10 $73,317 $87,980 4 $11,100 Solid Waste Management
7 $34,554 $59,235 8 $28,730 Housing and Community Development (Local)
2 $7,509 $45,054 3 $6,762 Judicial and Legal
1 $13,600 $163,200 0 $0 Police - Other
1 $4,462 $53,544 15 $17,488
Totals for Government
385 $2,623,636 $81,776 137 $180,720
Cedar Falls government finances - Expenditure in 2021 (per resident):
Construction - General - Other: $10,443,000 ($256.30)
Electric Utilities: $5,513,000 ($135.30)Miscellaneous Commercial Activities - Other: $2,122,000 ($52.08)Water Utilities: $1,267,000 ($31.10)Gas Utilities: $1,106,000 ($27.14)Current Operations - Electric Utilities: $34,334,000 ($842.63)
Miscellaneous Commercial Activities - Other: $14,282,000 ($350.51)Regular Highways: $11,527,000 ($282.90)Gas Utilities: $10,696,000 ($262.50)Police Protection: $6,520,000 ($160.02)Parks and Recreation: $4,636,000 ($113.78)Local Fire Protection: $4,035,000 ($99.03)Sewerage: $3,915,000 ($96.08)Water Utilities: $3,477,000 ($85.33)Solid Waste Management: $2,853,000 ($70.02)Libraries: $2,122,000 ($52.08)General - Other: $1,870,000 ($45.89)Housing and Community Development: $1,828,000 ($44.86)Financial Administration: $1,345,000 ($33.01)Central Staff Services: $1,334,000 ($32.74)General Public Buildings: $960,000 ($23.56)Protective Inspection and Regulation - Other: $867,000 ($21.28)Judicial and Legal Services: $538,000 ($13.20)Parking Facilities: $283,000 ($6.95)Hospitals: $204,000 ($5.01)Health - Other: $132,000 ($3.24)Electric Utilities - Interest on Debt: $725,000 ($17.79)
General - Interest on Debt: $586,000 ($14.38)
Intergovernmental to Local - Other - General - Other: $125,000 ($3.07)
Other - Sewerage: $12,000 ($0.29)Other Capital Outlay - Electric Utilities: $2,050,000 ($50.31)
Miscellaneous Commercial Activities - Other: $1,206,000 ($29.60)Gas Utilities: $28,000 ($0.69)Water Utilities: $20,000 ($0.49)Total Salaries and Wages: $32,659,000 ($801.53)
Cedar Falls government finances - Revenue in 2021 (per resident):
Charges - Miscellaneous Commercial Activities: $21,415,000 ($525.57)
Sewerage: $8,122,000 ($199.33)Solid Waste Management: $3,068,000 ($75.30)Other: $1,116,000 ($27.39)Parks and Recreation: $921,000 ($22.60)Parking Facilities: $98,000 ($2.41)Federal Intergovernmental - Housing and Community Development: $1,734,000 ($42.56)
Other: $963,000 ($23.63)Public Welfare: $39,000 ($0.96)Local Intergovernmental - Other: $1,058,000 ($25.97)
General Local Government Support: $520,000 ($12.76)Miscellaneous - General Revenue - Other: $3,846,000 ($94.39)
Interest Earnings: $1,838,000 ($45.11)Rents: $374,000 ($9.18)Sale of Property: $152,000 ($3.73)Fines and Forfeits: $110,000 ($2.70)Special Assessments: $40,000 ($0.98)Revenue - Electric Utilities: $45,083,000 ($1106.44)
Gas Utilities: $11,958,000 ($293.48)Water Utilities: $5,043,000 ($123.77)State Intergovernmental - Highways: $6,146,000 ($150.84)
Other: $748,000 ($18.36)General Local Government Support: $697,000 ($17.11)Tax - Property: $27,040,000 ($663.62)
General Sales and Gross Receipts: $6,008,000 ($147.45)Other License: $1,532,000 ($37.60)Other Selective Sales: $783,000 ($19.22)Public Utilities Sales: $627,000 ($15.39)
Cedar Falls government finances - Debt in 2021 (per resident):
Long Term Debt - Beginning Outstanding - Unspecified Public Purpose: $35,862,000 ($880.14)
Outstanding Unspecified Public Purpose: $34,537,000 ($847.62)Retired Unspecified Public Purpose: $4,756,000 ($116.72)Issue, Unspecified Public Purpose: $3,430,000 ($84.18)
Cedar Falls government finances - Cash and Securities in 2021 (per resident):
Other Funds - Cash and Securities: $188,354,000 ($4622.64)
Sinking Funds - Cash and Securities: $4,215,000 ($103.45)
Businesses in Cedar Falls, IA
Name Count Name Count
ALDI 1 Kohl's 1 Ace Hardware 1 La-Z-Boy 1 Advance Auto Parts 1 Lane Furniture 1 Aeropostale 1 LensCrafters 1 AmericInn 1 Little Caesars Pizza 1 American Eagle Outfitters 1 Long John Silver's 1 Applebee's 1 MasterBrand Cabinets 2 Arby's 1 Maurices 1 Ashley Furniture 1 McDonald's 2 Bath & Body Works 1 New Balance 1 Blockbuster 1 Nike 5 Buffalo Wild Wings 1 Nissan 1 CVS 1 Panera Bread 1 Carson Pirie Scott 1 Papa John's Pizza 1 Chevrolet 1 Payless 1 Chuck E. Cheese's 1 Pizza Hut 2 Clarion 1 Quiznos 1 Cold Stone Creamery 1 RadioShack 1 Comfort Suites 1 Ryder Rental & Truck Leasing 1 Curves 1 Starbucks 2 Dairy Queen 1 Suburban 1 Days Inn 1 Subway 4 Express 1 Super 8 1 Famous Footwear 1 Target 1 FedEx 7 The Room Place 1 GNC 1 Toyota 1 GameStop 2 UPS 9 H&R Block 2 Victoria's Secret 1 Holiday Inn 1 Village Inn 1 Honda 1 Volkswagen 1 Jimmy John's 1 Walgreens 1 Jones New York 1 Walmart 1 KFC 1 Wendy's 1 Kincaid 1 Wingate 1
Strongest AM radio stations in Cedar Falls:
KCNZ (1250 AM; 10 kW; CEDAR FALLS, IA; Owner: FIFE COMMUNICATION COMPANY, L.C.)
KDNZ (1650 AM; 10 kW; CEDAR FALLS, IA; Owner: FIFE COMMUNICATIONS CO., LLC)
KXEL (1540 AM; 50 kW; WATERLOO, IA; Owner: KXEL BROADCASTING COMPANY, INC.)
KWLO (1330 AM; 5 kW; WATERLOO, IA; Owner: KXEL BROADCASTING COMPANY, INC.)
KNWS (1090 AM; daytime; 1 kW; WATERLOO, IA; Owner: NORTHWESTERN COLLEGE)
WHO (1040 AM; 50 kW; DES MOINES, IA; Owner: CITICASTERS LICENSES, L.P.)
KWOF (850 AM; daytime; 0 kW; WATERLOO, IA; Owner: FRIENDSHIP COMMUNICATIONS,INC.)
KKHQ (950 AM; 5 kW; OELWEIN, IA; Owner: CUMULUS LICENSING CORP.)
KWAY (1470 AM; 1 kW; WAVERLY, IA; Owner: AEL SUHR ENTERPRISES, INC.)
WMT (600 AM; 5 kW; CEDAR RAPIDS, IA; Owner: CITICASTERS LICENSES, L.P.)
KFAN (1130 AM; 50 kW; MINNEAPOLIS, MN; Owner: AMFM RADIO LICENSES, L.L.C.)
WCTS (1030 AM; 50 kW; MAPLEWOOD, MN; Owner: CNTL. BAPT. THEO/AL SEMI MINNEAPOLIS)
WCCO (830 AM; 50 kW; MINNEAPOLIS, MN; Owner: INFINITY MEDIA CORPORATION)
Strongest FM radio stations in Cedar Falls:
KOEL (98.5 FM; CEDAR FALLS, IA; Owner: CUMULUS LICENSING CORP.)
KOKZ (105.7 FM; WATERLOO, IA; Owner: KXEL BROADCASTING COMPANY, INC.)
KOEL-FM (92.3 FM; OELWEIN, IA; Owner: CUMULUS LICENSING CORP.)
KHKE (89.5 FM; CEDAR FALLS, IA; Owner: UNIVERSITY OF NORTHERN IOWA)
KFMW (107.9 FM; WATERLOO, IA; Owner: KXEL BROADCASTING COMPANY, INC.)
KCVM (96.1 FM; HUDSON, IA; Owner: FIFE COMMUNICATION COMPANY, L.C.)
KUNI (90.9 FM; CEDAR FALLS, IA; Owner: UNIVERSITY OF NORTHERN IOWA)
KNWS-FM (101.9 FM; WATERLOO, IA; Owner: NORTHWESTERN COLLEGE)
KBBG (88.1 FM; WATERLOO, IA; Owner: AFRO AMERICAN COMMUNITY B/CSTING,INC)
KWAY-FM (99.3 FM; WAVERLY, IA; Owner: AEL SUHR ENTERPRISES, INC.)
KCRR (97.7 FM; GRUNDY CENTER, IA; Owner: CUMULUS LICENSING CORP.)
TV broadcast stations around Cedar Falls:
K44FK (Channel 44; WATERLOO, IA; Owner: TRINITY BROADCASTING NETWORK)
KWWL (Channel 7; WATERLOO, IA; Owner: RAYCOM AMERICA, INC.)
KGAN (Channel 2; CEDAR RAPIDS, IA; Owner: KGAN LICENSEE, LLC)
KCRG-TV (Channel 9; CEDAR RAPIDS, IA; Owner: CEDAR RAPIDS TELEVISION CO.)
KRIN (Channel 32; WATERLOO, IA; Owner: IOWA PUBLIC BROADCASTING BOARD)
KPXR (Channel 48; CEDAR RAPIDS, IA; Owner: PAXSON COMMUNICATIONS LICENSE COMPANY, LLC)
KYIN (Channel 24; MASON CITY, IA; Owner: IOWA PUBLIC BROADCASTING BOARD)
KFXA (Channel 28; CEDAR RAPIDS, IA; Owner: SECOND GENERATION OF IOWA, LTD.)
National Bridge Inventory (NBI) Statistics 120 Number of bridges2,228ft / 679m Total length586,732 Total average daily traffic44,479 Total average daily truck traffic
New bridges - historical statistics
2 1900-1909 4 1950-1959 6 1960-1969 8 1970-1979 16 1980-1989 64 1990-1999 11 2000-2009 9 2010-2019
See full National Bridge Inventory statistics for Cedar Falls, IA
Home Mortgage Disclosure Act Aggregated Statistics For Year 2009(Based on 6 full and 2 partial tracts) A) FHA, FSA/RHS & VA B) Conventional C) Refinancings D) Home Improvement Loans E) Loans on Dwellings For 5+ Families F) Non-occupant Loans on G) Loans On Manufactured Number Average Value Number Average Value Number Average Value Number Average Value Number Average Value Number Average Value Number Average Value
LOANS ORIGINATED 165 $145,939 389 $148,417 824 $144,871 36 $74,971 7 $378,193 84 $95,501 3 $22,157 APPLICATIONS APPROVED, NOT ACCEPTED 9 $144,627 34 $147,836 62 $163,022 1 $107,370 1 $2,788,000 2 $165,820 2 $58,255 APPLICATIONS DENIED 5 $119,564 22 $165,015 88 $155,325 19 $72,279 0 $0 8 $97,469 3 $25,990 APPLICATIONS WITHDRAWN 10 $125,414 29 $160,499 108 $163,312 2 $163,870 0 $0 5 $95,800 0 $0 FILES CLOSED FOR INCOMPLETENESS 1 $112,440 1 $309,980 17 $188,974 0 $0 0 $0 1 $180,000 0 $0
Aggregated Statistics For Year 2008(Based on 6 full and 2 partial tracts) A) FHA, FSA/RHS & VA B) Conventional C) Refinancings D) Home Improvement Loans E) Loans on Dwellings For 5+ Families F) Non-occupant Loans on G) Loans On Manufactured Number Average Value Number Average Value Number Average Value Number Average Value Number Average Value Number Average Value Number Average Value
LOANS ORIGINATED 85 $146,162 414 $143,308 298 $134,753 31 $45,062 5 $645,400 95 $110,277 6 $18,085 APPLICATIONS APPROVED, NOT ACCEPTED 4 $144,770 50 $147,827 39 $128,885 5 $73,312 0 $0 12 $121,240 4 $34,592 APPLICATIONS DENIED 6 $149,680 35 $103,751 82 $130,369 18 $46,609 0 $0 9 $92,890 13 $27,999 APPLICATIONS WITHDRAWN 9 $118,200 35 $155,905 51 $152,901 6 $57,287 0 $0 4 $146,905 0 $0 FILES CLOSED FOR INCOMPLETENESS 0 $0 13 $162,741 11 $133,558 4 $53,728 0 $0 2 $111,500 0 $0
Aggregated Statistics For Year 2007(Based on 6 full and 2 partial tracts) A) FHA, FSA/RHS & VA B) Conventional C) Refinancings D) Home Improvement Loans E) Loans on Dwellings For 5+ Families F) Non-occupant Loans on G) Loans On Manufactured Number Average Value Number Average Value Number Average Value Number Average Value Number Average Value Number Average Value Number Average Value
LOANS ORIGINATED 13 $124,942 568 $121,825 241 $114,023 56 $47,320 5 $795,996 118 $88,883 2 $23,390 APPLICATIONS APPROVED, NOT ACCEPTED 0 $0 56 $107,185 50 $114,421 8 $59,470 0 $0 8 $93,750 2 $14,890 APPLICATIONS DENIED 1 $163,740 48 $116,746 105 $110,018 16 $47,661 0 $0 10 $183,985 11 $20,664 APPLICATIONS WITHDRAWN 6 $131,303 25 $131,971 46 $148,240 5 $56,144 0 $0 4 $103,430 1 $22,000 FILES CLOSED FOR INCOMPLETENESS 0 $0 8 $130,290 14 $137,133 1 $15,000 0 $0 4 $125,500 0 $0
Aggregated Statistics For Year 2006(Based on 6 full and 2 partial tracts) A) FHA, FSA/RHS & VA B) Conventional C) Refinancings D) Home Improvement Loans E) Loans on Dwellings For 5+ Families F) Non-occupant Loans on G) Loans On Manufactured Number Average Value Number Average Value Number Average Value Number Average Value Number Average Value Number Average Value Number Average Value
LOANS ORIGINATED 26 $143,613 660 $118,194 268 $101,189 50 $29,357 3 $391,813 129 $92,828 6 $18,235 APPLICATIONS APPROVED, NOT ACCEPTED 0 $0 32 $150,780 51 $103,847 9 $48,106 0 $0 10 $66,234 2 $31,185 APPLICATIONS DENIED 2 $150,905 52 $80,755 102 $98,785 30 $43,711 0 $0 9 $61,500 20 $19,702 APPLICATIONS WITHDRAWN 0 $0 54 $122,393 76 $123,720 3 $90,880 0 $0 11 $97,015 0 $0 FILES CLOSED FOR INCOMPLETENESS 0 $0 16 $146,649 19 $136,197 0 $0 0 $0 0 $0 0 $0
Aggregated Statistics For Year 2005(Based on 6 full and 2 partial tracts) A) FHA, FSA/RHS & VA B) Conventional C) Refinancings D) Home Improvement Loans E) Loans on Dwellings For 5+ Families F) Non-occupant Loans on G) Loans On Manufactured Number Average Value Number Average Value Number Average Value Number Average Value Number Average Value Number Average Value Number Average Value
LOANS ORIGINATED 16 $137,286 605 $113,998 432 $109,281 63 $37,134 5 $1,509,136 166 $96,286 12 $18,953 APPLICATIONS APPROVED, NOT ACCEPTED 0 $0 43 $92,483 50 $99,072 13 $57,749 0 $0 4 $89,000 4 $23,142 APPLICATIONS DENIED 1 $175,000 62 $75,921 150 $103,105 20 $48,100 0 $0 7 $77,511 28 $22,141 APPLICATIONS WITHDRAWN 0 $0 61 $109,372 108 $114,500 3 $45,773 0 $0 13 $68,590 4 $60,500 FILES CLOSED FOR INCOMPLETENESS 0 $0 16 $90,668 36 $122,546 0 $0 0 $0 2 $67,000 0 $0
Aggregated Statistics For Year 2004(Based on 6 full and 2 partial tracts) A) FHA, FSA/RHS & VA B) Conventional C) Refinancings D) Home Improvement Loans E) Loans on Dwellings For 5+ Families F) Non-occupant Loans on G) Loans On Manufactured Number Average Value Number Average Value Number Average Value Number Average Value Number Average Value Number Average Value Number Average Value
LOANS ORIGINATED 11 $116,644 514 $113,960 408 $104,304 66 $38,243 5 $810,126 136 $95,849 11 $20,123 APPLICATIONS APPROVED, NOT ACCEPTED 0 $0 32 $126,384 52 $100,294 9 $37,463 0 $0 2 $92,500 3 $78,153 APPLICATIONS DENIED 7 $103,256 51 $77,272 134 $104,631 25 $28,950 0 $0 9 $98,409 23 $21,638 APPLICATIONS WITHDRAWN 2 $116,000 38 $105,406 117 $110,720 9 $19,112 0 $0 6 $104,875 0 $0 FILES CLOSED FOR INCOMPLETENESS 1 $123,000 11 $92,400 23 $115,771 5 $39,688 0 $0 2 $85,145 1 $32,590
Aggregated Statistics For Year 2003(Based on 6 full and 2 partial tracts) A) FHA, FSA/RHS & VA B) Conventional C) Refinancings D) Home Improvement Loans E) Loans on Dwellings For 5+ Families F) Non-occupant Loans on Number Average Value Number Average Value Number Average Value Number Average Value Number Average Value Number Average Value
LOANS ORIGINATED 14 $100,291 517 $107,482 1,171 $103,780 68 $23,045 8 $226,394 155 $85,359 APPLICATIONS APPROVED, NOT ACCEPTED 0 $0 29 $82,891 80 $92,321 10 $28,425 0 $0 12 $80,374 APPLICATIONS DENIED 0 $0 25 $86,146 167 $91,562 11 $20,738 1 $196,000 16 $89,071 APPLICATIONS WITHDRAWN 3 $142,000 38 $99,462 166 $107,298 5 $45,416 0 $0 11 $80,701 FILES CLOSED FOR INCOMPLETENESS 0 $0 7 $110,454 23 $104,423 1 $19,150 0 $0 3 $85,000
Aggregated Statistics For Year 2002(Based on 4 full and 2 partial tracts) A) FHA, FSA/RHS & VA B) Conventional C) Refinancings D) Home Improvement Loans E) Loans on Dwellings For 5+ Families F) Non-occupant Loans on Number Average Value Number Average Value Number Average Value Number Average Value Number Average Value Number Average Value
LOANS ORIGINATED 20 $109,642 384 $106,563 697 $101,016 60 $27,136 4 $394,848 70 $74,376 APPLICATIONS APPROVED, NOT ACCEPTED 0 $0 25 $81,046 54 $99,371 14 $26,129 0 $0 2 $127,110 APPLICATIONS DENIED 2 $91,380 44 $59,666 80 $85,296 15 $16,865 1 $197,000 3 $71,530 APPLICATIONS WITHDRAWN 2 $75,455 18 $92,906 95 $105,453 9 $17,379 0 $0 2 $94,635 FILES CLOSED FOR INCOMPLETENESS 0 $0 7 $94,861 15 $109,829 1 $15,980 0 $0 4 $68,595
Aggregated Statistics For Year 2001(Based on 4 full and 2 partial tracts) A) FHA, FSA/RHS & VA B) Conventional C) Refinancings D) Home Improvement Loans E) Loans on Dwellings For 5+ Families F) Non-occupant Loans on Number Average Value Number Average Value Number Average Value Number Average Value Number Average Value Number Average Value
LOANS ORIGINATED 30 $97,400 395 $91,802 544 $97,908 90 $21,714 5 $1,674,978 60 $66,980 APPLICATIONS APPROVED, NOT ACCEPTED 1 $79,000 26 $69,041 33 $77,641 7 $20,423 0 $0 1 $21,150 APPLICATIONS DENIED 2 $102,690 78 $34,924 83 $87,614 9 $19,253 0 $0 3 $83,443 APPLICATIONS WITHDRAWN 1 $35,140 21 $97,425 60 $92,244 6 $46,618 0 $0 3 $88,943 FILES CLOSED FOR INCOMPLETENESS 0 $0 2 $170,000 16 $95,571 0 $0 0 $0 0 $0
Aggregated Statistics For Year 2000(Based on 4 full and 2 partial tracts) A) FHA, FSA/RHS & VA B) Conventional C) Refinancings D) Home Improvement Loans E) Loans on Dwellings For 5+ Families F) Non-occupant Loans on Number Average Value Number Average Value Number Average Value Number Average Value Number Average Value Number Average Value
LOANS ORIGINATED 17 $84,649 321 $86,012 187 $62,869 92 $22,334 1 $1,485,000 42 $58,915 APPLICATIONS APPROVED, NOT ACCEPTED 0 $0 17 $70,479 29 $50,217 9 $22,736 1 $5,726,000 1 $40,000 APPLICATIONS DENIED 3 $89,570 47 $39,844 59 $78,480 18 $12,179 0 $0 6 $23,523 APPLICATIONS WITHDRAWN 2 $79,930 17 $96,995 28 $76,497 3 $16,253 0 $0 2 $66,000 FILES CLOSED FOR INCOMPLETENESS 1 $74,000 0 $0 4 $69,948 0 $0 0 $0 0 $0
Aggregated Statistics For Year 1999(Based on 5 full and 2 partial tracts) A) FHA, FSA/RHS & VA B) Conventional C) Refinancings D) Home Improvement Loans E) Loans on Dwellings For 5+ Families F) Non-occupant Loans on Number Average Value Number Average Value Number Average Value Number Average Value Number Average Value Number Average Value
LOANS ORIGINATED 36 $82,665 396 $88,231 440 $65,504 90 $18,791 4 $1,135,748 69 $70,193 APPLICATIONS APPROVED, NOT ACCEPTED 0 $0 27 $51,920 56 $44,565 10 $31,719 1 $4,860 8 $32,866 APPLICATIONS DENIED 0 $0 76 $35,629 106 $65,138 15 $22,881 0 $0 7 $66,427 APPLICATIONS WITHDRAWN 1 $71,000 18 $82,752 42 $68,594 1 $8,980 0 $0 1 $56,500 FILES CLOSED FOR INCOMPLETENESS 0 $0 1 $63,890 6 $67,557 0 $0 0 $0 0 $0
Detailed HMDA statistics for the following Tracts:
0022.00
, 0023.01 , 0023.02 , 0024.00 , 0025.00 , 0026.01 , 0026.03 , 0026.04
Private Mortgage Insurance Companies Aggregated Statistics For Year 2009(Based on 6 full and 2 partial tracts) A) Conventional B) Refinancings C) Non-occupant Loans on Number Average Value Number Average Value Number Average Value
LOANS ORIGINATED 107 $161,228 68 $173,601 1 $65,000 APPLICATIONS APPROVED, NOT ACCEPTED 17 $165,319 13 $166,402 0 $0 APPLICATIONS DENIED 2 $245,970 2 $214,830 0 $0 APPLICATIONS WITHDRAWN 6 $140,167 1 $262,120 0 $0 FILES CLOSED FOR INCOMPLETENESS 1 $102,000 1 $95,000 0 $0
Aggregated Statistics For Year 2008(Based on 6 full and 2 partial tracts) A) Conventional B) Refinancings C) Non-occupant Loans on Number Average Value Number Average Value Number Average Value
LOANS ORIGINATED 152 $154,176 47 $176,388 10 $104,400 APPLICATIONS APPROVED, NOT ACCEPTED 22 $151,519 9 $148,040 1 $88,000 APPLICATIONS DENIED 7 $141,346 1 $247,000 1 $65,000 APPLICATIONS WITHDRAWN 9 $193,727 5 $139,038 1 $105,000 FILES CLOSED FOR INCOMPLETENESS 1 $112,200 0 $0 0 $0
Aggregated Statistics For Year 2007(Based on 6 full and 2 partial tracts) A) Conventional B) Refinancings C) Non-occupant Loans on Number Average Value Number Average Value Number Average Value
LOANS ORIGINATED 153 $146,653 34 $164,109 12 $89,153 APPLICATIONS APPROVED, NOT ACCEPTED 12 $144,360 2 $201,115 0 $0 APPLICATIONS DENIED 0 $0 0 $0 0 $0 APPLICATIONS WITHDRAWN 11 $148,137 0 $0 0 $0 FILES CLOSED FOR INCOMPLETENESS 0 $0 0 $0 0 $0
Aggregated Statistics For Year 2006(Based on 6 full and 2 partial tracts) A) Conventional B) Refinancings C) Non-occupant Loans on Number Average Value Number Average Value Number Average Value
LOANS ORIGINATED 133 $134,135 26 $138,323 8 $98,608 APPLICATIONS APPROVED, NOT ACCEPTED 17 $133,004 5 $166,410 2 $132,000 APPLICATIONS DENIED 3 $113,333 0 $0 1 $159,000 APPLICATIONS WITHDRAWN 6 $184,517 1 $166,330 1 $132,000 FILES CLOSED FOR INCOMPLETENESS 0 $0 0 $0 0 $0
Aggregated Statistics For Year 2005(Based on 6 full and 2 partial tracts) A) Conventional B) Refinancings C) Non-occupant Loans on Number Average Value Number Average Value Number Average Value
LOANS ORIGINATED 81 $118,023 35 $139,868 18 $89,985 APPLICATIONS APPROVED, NOT ACCEPTED 21 $109,977 7 $109,551 4 $78,500 APPLICATIONS DENIED 1 $55,810 1 $188,000 1 $49,220 APPLICATIONS WITHDRAWN 5 $122,020 3 $106,000 3 $108,333 FILES CLOSED FOR INCOMPLETENESS 1 $83,000 0 $0 0 $0
Aggregated Statistics For Year 2004(Based on 6 full and 2 partial tracts) A) Conventional B) Refinancings C) Non-occupant Loans on Number Average Value Number Average Value Number Average Value
LOANS ORIGINATED 81 $121,394 41 $134,108 19 $97,223 APPLICATIONS APPROVED, NOT ACCEPTED 14 $143,621 12 $124,122 2 $96,000 APPLICATIONS DENIED 1 $199,000 0 $0 1 $199,000 APPLICATIONS WITHDRAWN 2 $95,500 1 $168,010 0 $0 FILES CLOSED FOR INCOMPLETENESS 2 $83,000 0 $0 0 $0
Aggregated Statistics For Year 2003(Based on 6 full and 2 partial tracts) A) Conventional B) Refinancings C) Non-occupant Loans on Number Average Value Number Average Value Number Average Value
LOANS ORIGINATED 97 $110,263 105 $126,496 9 $81,136 APPLICATIONS APPROVED, NOT ACCEPTED 16 $121,308 24 $126,080 4 $93,000 APPLICATIONS DENIED 0 $0 0 $0 0 $0 APPLICATIONS WITHDRAWN 4 $94,750 7 $128,553 0 $0 FILES CLOSED FOR INCOMPLETENESS 1 $81,000 0 $0 0 $0
Aggregated Statistics For Year 2002(Based on 4 full and 2 partial tracts) A) Conventional B) Refinancings C) Non-occupant Loans on Number Average Value Number Average Value Number Average Value
LOANS ORIGINATED 94 $109,478 58 $134,851 6 $104,460 APPLICATIONS APPROVED, NOT ACCEPTED 14 $118,309 15 $105,507 2 $113,820 APPLICATIONS DENIED 1 $77,590 2 $133,500 0 $0 APPLICATIONS WITHDRAWN 3 $91,507 4 $101,500 1 $114,000 FILES CLOSED FOR INCOMPLETENESS 0 $0 0 $0 0 $0
Aggregated Statistics For Year 2001(Based on 4 full and 2 partial tracts) A) Conventional B) Refinancings C) Non-occupant Loans on Number Average Value Number Average Value Number Average Value
LOANS ORIGINATED 95 $99,148 33 $107,566 6 $71,785 APPLICATIONS APPROVED, NOT ACCEPTED 7 $102,677 7 $157,991 0 $0 APPLICATIONS DENIED 0 $0 2 $144,500 0 $0 APPLICATIONS WITHDRAWN 1 $124,230 1 $59,000 0 $0 FILES CLOSED FOR INCOMPLETENESS 0 $0 0 $0 0 $0
Aggregated Statistics For Year 2000(Based on 4 full and 2 partial tracts) A) Conventional B) Refinancings C) Non-occupant Loans on Number Average Value Number Average Value Number Average Value
LOANS ORIGINATED 58 $112,905 12 $111,516 0 $0 APPLICATIONS APPROVED, NOT ACCEPTED 3 $84,013 2 $65,000 1 $59,000 APPLICATIONS DENIED 3 $82,000 2 $141,185 0 $0 APPLICATIONS WITHDRAWN 0 $0 0 $0 0 $0 FILES CLOSED FOR INCOMPLETENESS 0 $0 0 $0 0 $0
Aggregated Statistics For Year 1999(Based on 5 full and 2 partial tracts) A) Conventional B) Refinancings C) Non-occupant Loans on Number Average Value Number Average Value Number Average Value
LOANS ORIGINATED 113 $95,159 20 $85,011 3 $80,000 APPLICATIONS APPROVED, NOT ACCEPTED 6 $101,847 1 $94,600 0 $0 APPLICATIONS DENIED 3 $119,297 1 $74,000 0 $0 APPLICATIONS WITHDRAWN 3 $99,973 1 $65,000 0 $0 FILES CLOSED FOR INCOMPLETENESS 0 $0 0 $0 0 $0
Detailed PMIC statistics for the following Tracts:
0022.00
, 0023.01 , 0023.02 , 0024.00 , 0025.00 , 0026.01 , 0026.03 , 0026.04 Fire-safe hotels and motels in Cedar Falls, Iowa:
Clarion Inn Hotel, 5826 University Ave Bldg 1, Cedar Falls, Iowa 50613 Phone: (319) 277-2230, Fax: (319) 277-0364
Americinn Lodge And Suites, 5818 Nordic Dr, Cedar Falls, Iowa 50613 Phone: (319) 277-6166, Fax: (319) 266-7970
Best Western Plus, 1614 Technology Pkwy, Cedar Falls, Iowa 50613 Phone: (319) 277-2400, Fax: (319) 277-2411
Days Inn Cedar Falls, 5826 University Ave Bldg 2, Cedar Falls, Iowa 50613 Phone: (317) 266-1222, Fax: (319) 266-3011
Comfort Suites, 7402 Nordic Dr, Cedar Falls, Iowa 50613 Phone: (319) 273-9999, Fax: (319) 277-2559
Super 8 Cedar Falls, 7515 Nordic Dr, Cedar Falls, Iowa 50613 Phone: (319) 266-6988, Fax: (319) 266-6985
Hilton Garden Inn, 7213 Nordic Dr, Cedar Falls, Iowa 50613 Phone: (319) 266-6611
Suburban Extended, 300 Viking Rd, Cedar falls, Iowa 50613 Phone: (319) 268-2222, Fax: (319) 268-2223
2 other hotels and motels
All 10 fire-safe hotels and motels in Cedar Falls, Iowa
Most common first names in Cedar Falls, IA among deceased individuals Name Count Lived (average)
John 180 78.1 years Mary 156 80.5 years Robert 123 75.2 years William 119 77.3 years Helen 101 82.4 years James 96 75.2 years Donald 93 74.0 years Margaret 89 84.2 years George 88 81.6 years Dorothy 86 81.1 years
Most common last names in Cedar Falls, IA among deceased individuals Last name Count Lived (average)
Smith 91 79.0 years Miller 87 79.8 years Johnson 76 79.6 years Hansen 69 79.4 years Petersen 50 82.8 years Nelson 47 76.1 years Jensen 45 81.6 years Christensen 43 80.0 years Brown 39 82.6 years Anderson 38 80.5 years
Cedar Falls compared to Iowa state average:
Unemployed percentage significantly below state average. Black race population percentage significantly below state average. Hispanic race population percentage below state average. Median age significantly below state average. Length of stay since moving in above state average. Number of college students above state average. Percentage of population with a bachelor's degree or higher significantly above state average. Cedar Falls on our top lists :
#47 on the list of "Top 101 cities with the largest racial income disparity between any two races with at least 200 householders"
#36 on the list of "Top 101 counties with the largest increase in the number of births per 1000 residents 2000-2006 to 2007-2013 (pop 50,000+)"
#71 on the list of "Top 101 counties with the highest Particulate Matter (PM10 ) Annual air pollution readings in 2012 (µg/m3 )"
#101 on the list of "Top 101 counties with the most Black Protestant adherents"
Top Patent Applicants
Henry J. May (15)
Danan Dou (11)
Andrew K. Rekow (8)
Taner Tuken (8)
Paul Thomas Bruss (8)
Gregory Jon Holcomb (8)
Clayton P. Neumann (6)
Tony J. Huegerich (6)
Erik L. Piper (6)
Scott R. Wiens (6)
Total of 357 patent applications in 2008-2024.


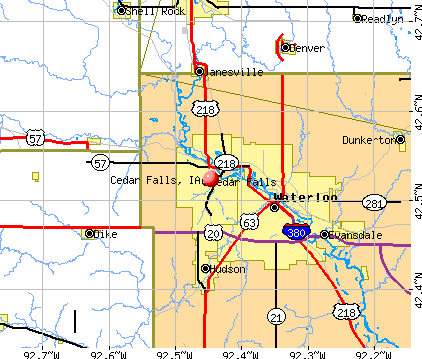


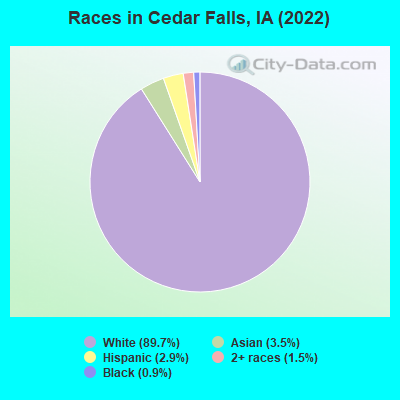
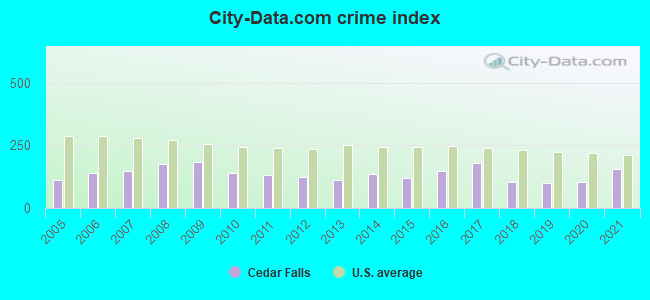
 Recent articles from our blog. Our writers, many of them Ph.D. graduates or candidates, create easy-to-read articles on a wide variety of topics.


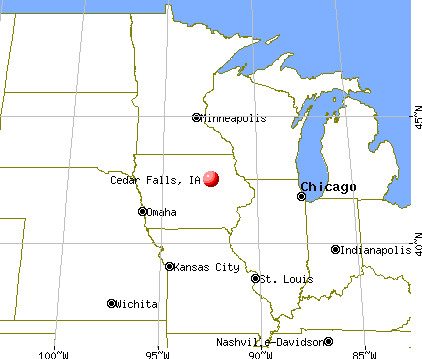
 (5.5 miles
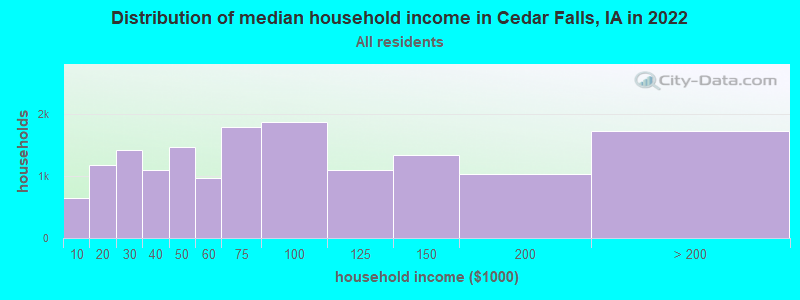
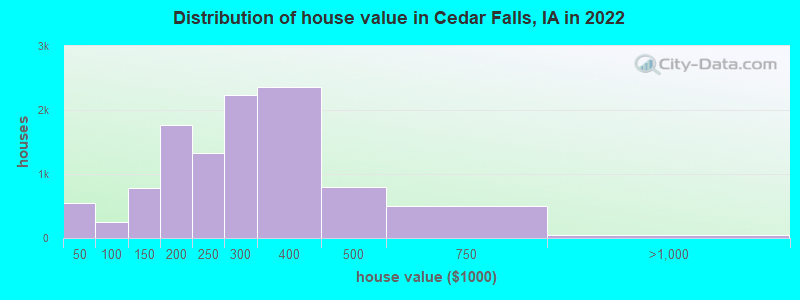
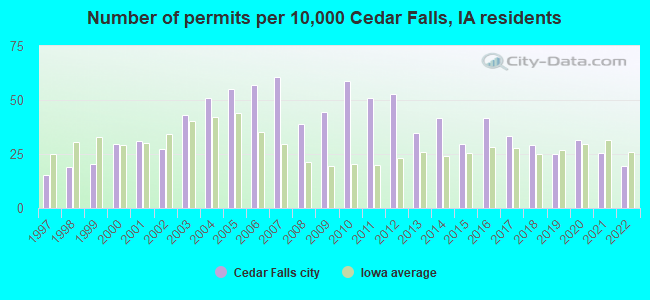
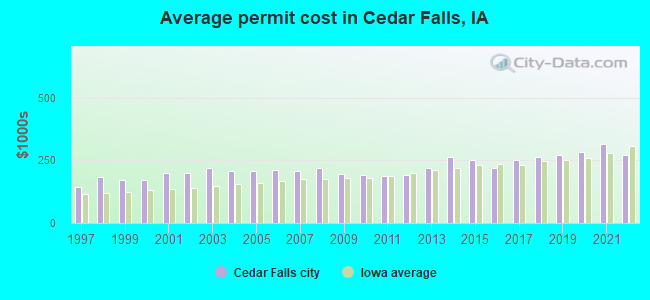
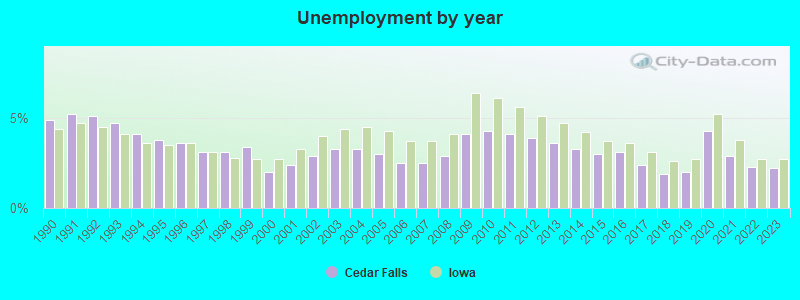
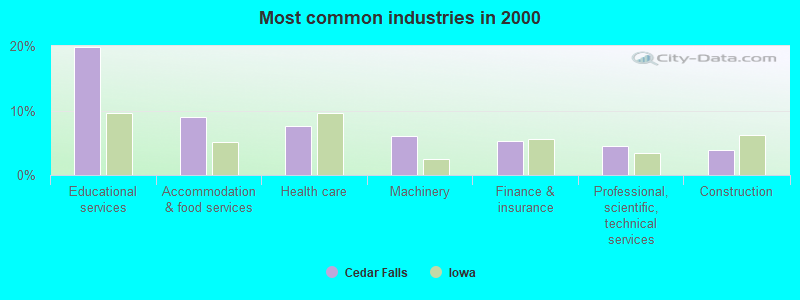
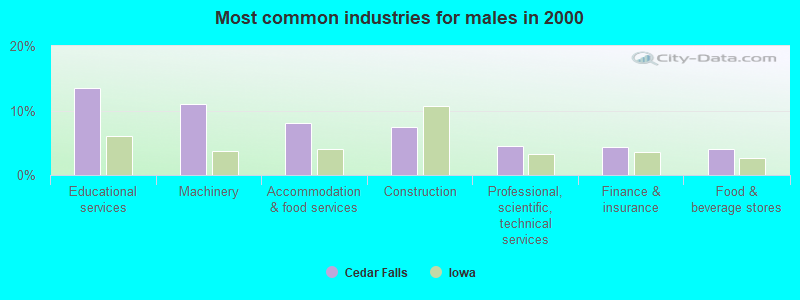
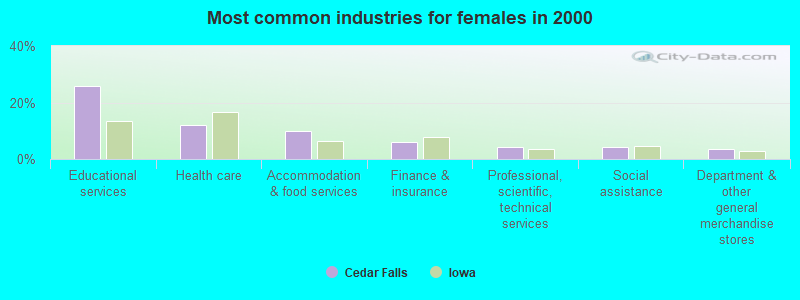
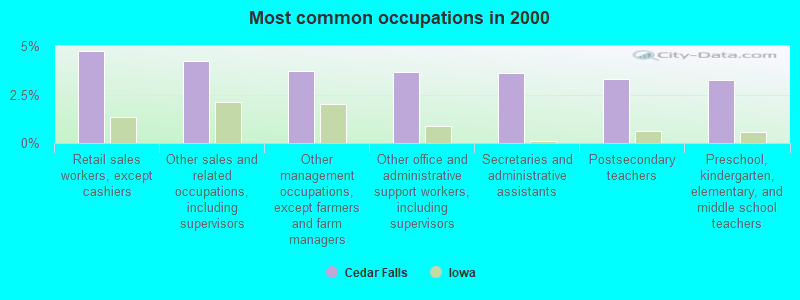
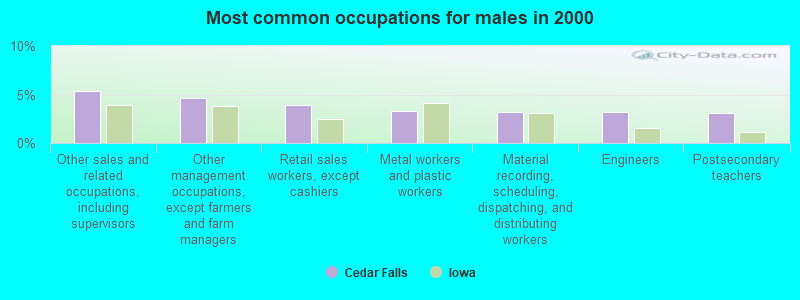
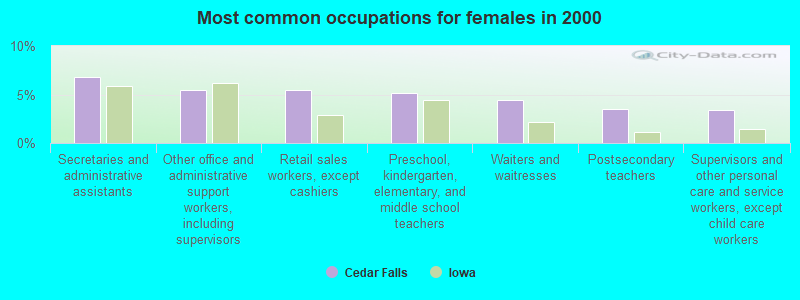
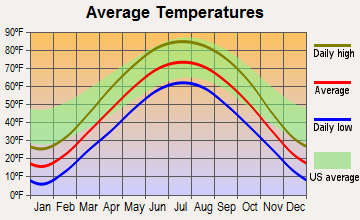
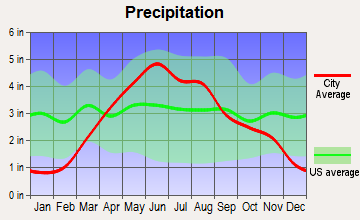
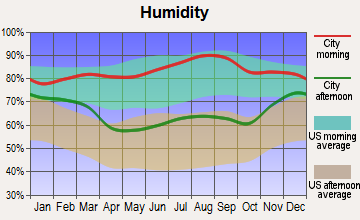
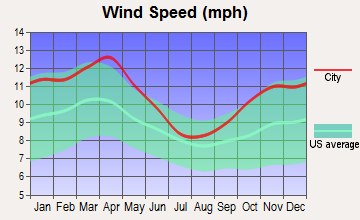
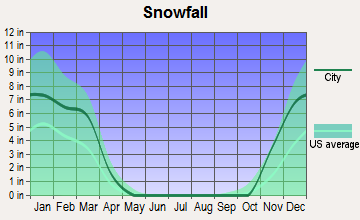
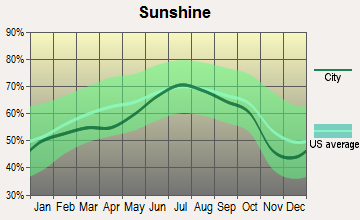
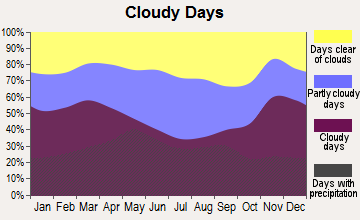
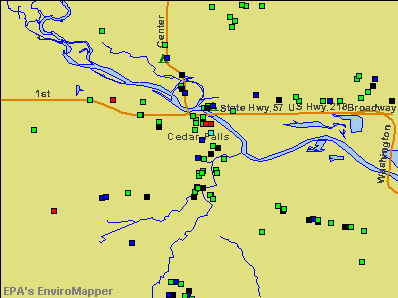

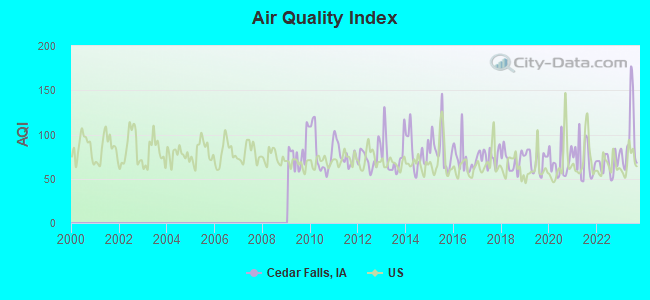
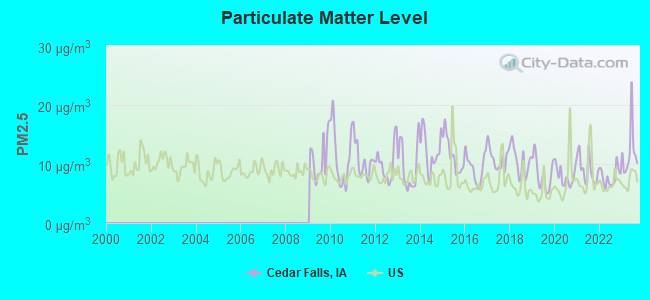
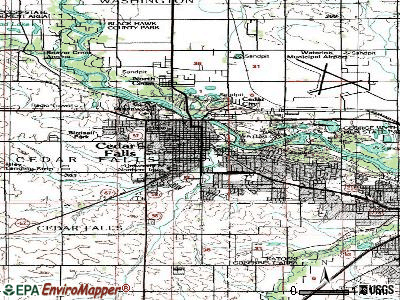
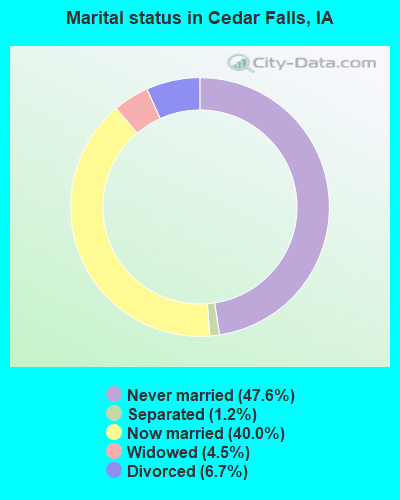
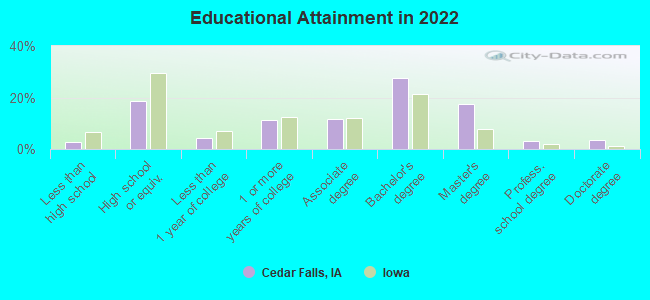
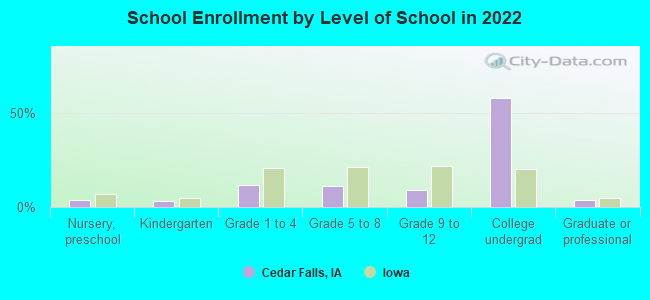
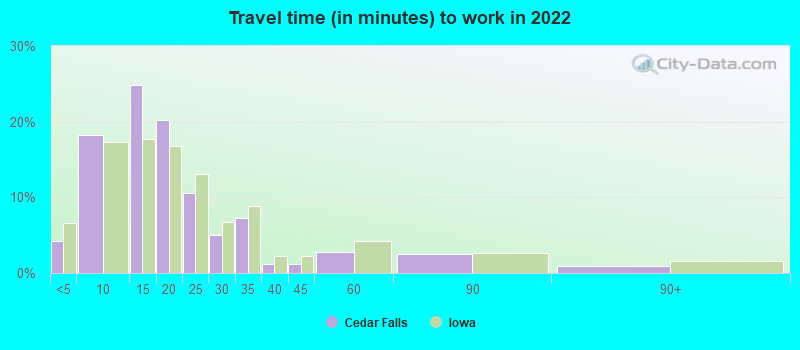
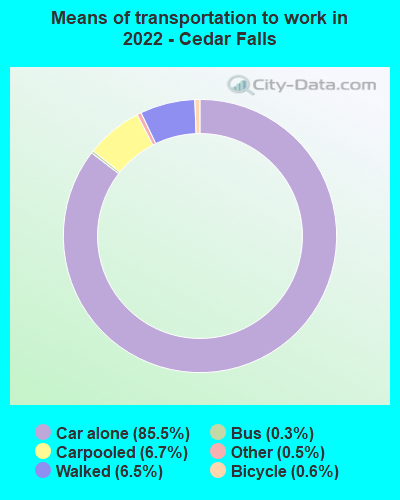
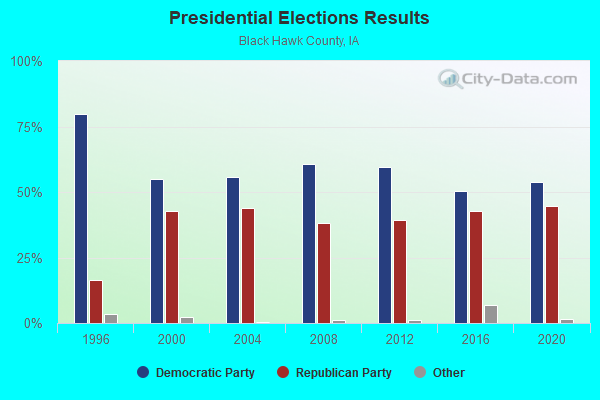
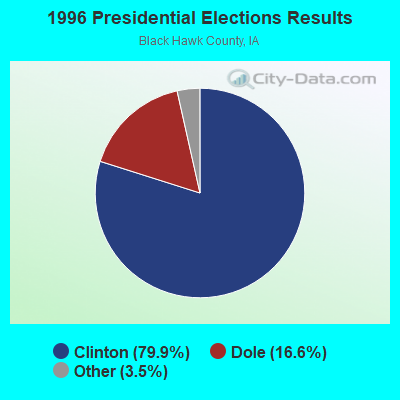
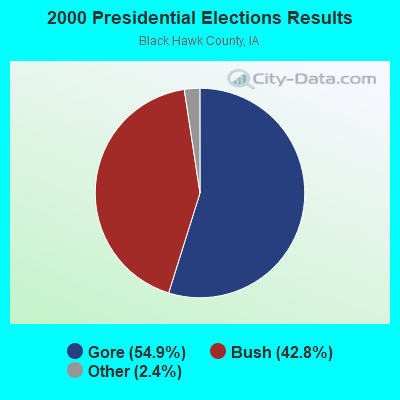
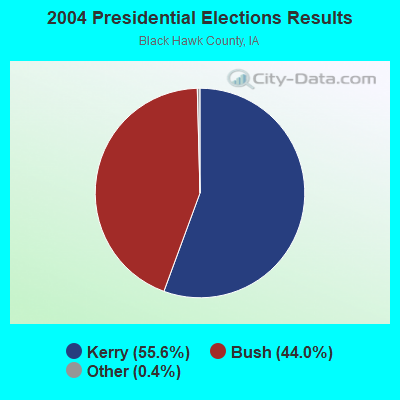
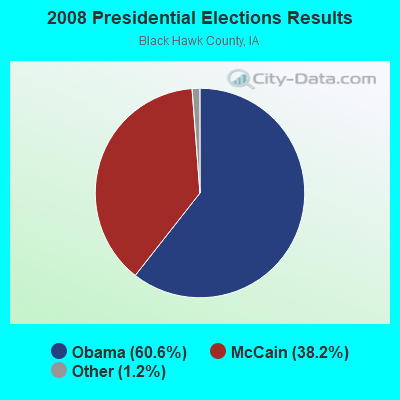
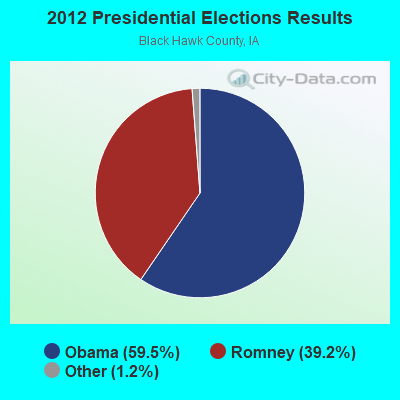
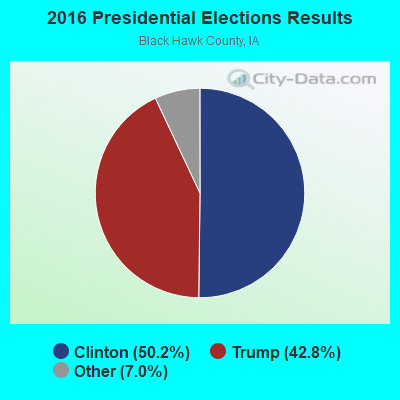
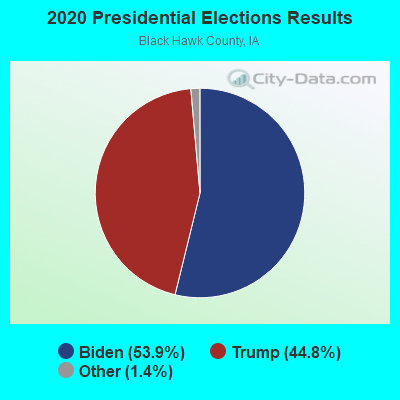
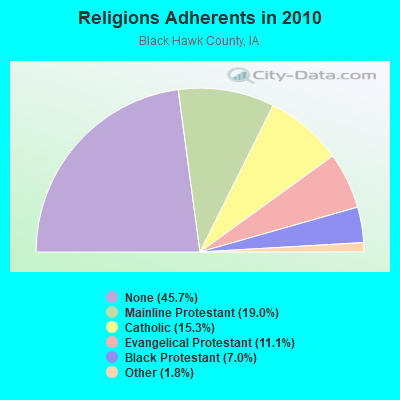
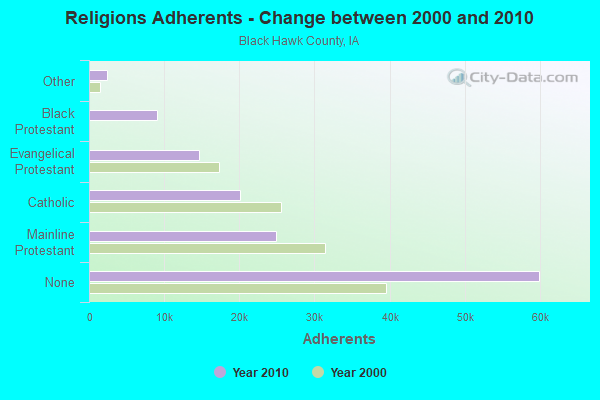

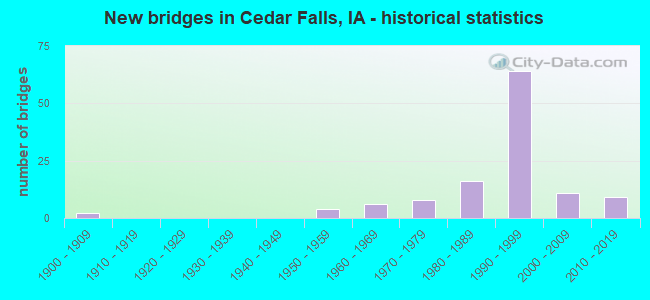
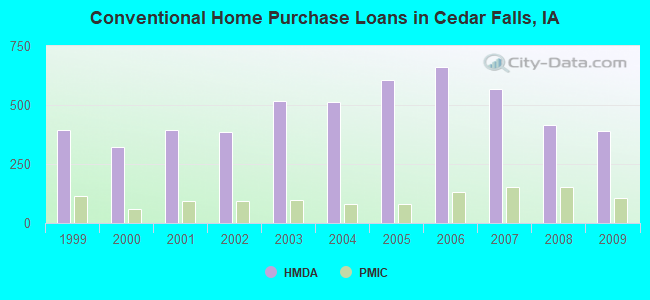
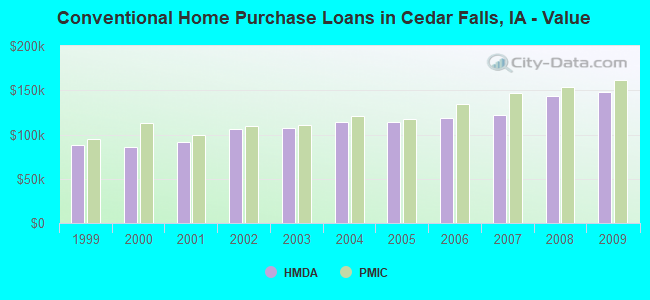
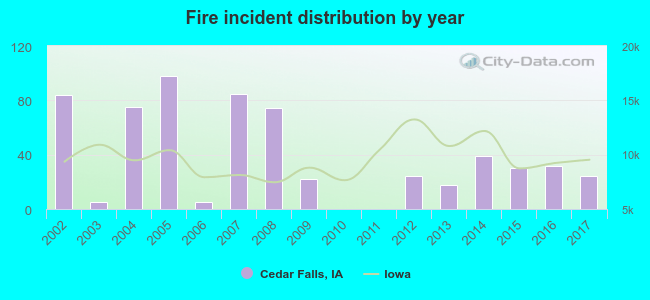 According to the data from the years 2002 - 2017 the average number of fires per year is 38. The highest number of fires - 98 took place in 2005, and the least - 0 in 2010. The data has a decreasing trend.
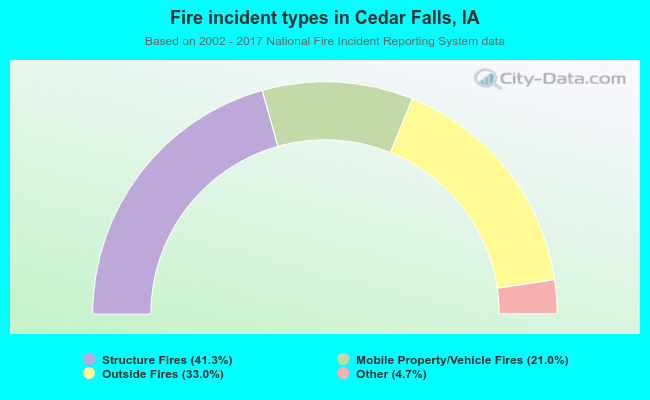 When looking into fire subcategories, the most incidents belonged to: Structure Fires (41.3%), and Outside Fires (33.0%).