Douglasville, Georgia Submit your own pictures of this city and show them to the world
OSM Map
General Map
Google Map
MSN Map
OSM Map
General Map
Google Map
MSN Map
OSM Map
General Map
Google Map
MSN Map
OSM Map
General Map
Google Map
MSN Map
Please wait while loading the map...
Population in 2022: 37,948 (99% urban, 1% rural). Population change since 2000: +89.1%Males: 18,068 Females: 19,880
March 2022 cost of living index in Douglasville: 101.2 (near average, U.S. average is 100) Percentage of residents living in poverty in 2022: 11.9%for White Non-Hispanic residents , 10.9% for Black residents , 24.2% for Hispanic or Latino residents , 8.4% for other race residents , 15.1% for two or more races residents )
Profiles of local businesses
Business Search - 14 Million verified businesses
Data:
Median household income ($)
Median household income (% change since 2000)
Household income diversity
Ratio of average income to average house value (%)
Ratio of average income to average rent
Median household income ($) - White
Median household income ($) - Black or African American
Median household income ($) - Asian
Median household income ($) - Hispanic or Latino
Median household income ($) - American Indian and Alaska Native
Median household income ($) - Multirace
Median household income ($) - Other Race
Median household income for houses/condos with a mortgage ($)
Median household income for apartments without a mortgage ($)
Races - White alone (%)
Races - White alone (% change since 2000)
Races - Black alone (%)
Races - Black alone (% change since 2000)
Races - American Indian alone (%)
Races - American Indian alone (% change since 2000)
Races - Asian alone (%)
Races - Asian alone (% change since 2000)
Races - Hispanic (%)
Races - Hispanic (% change since 2000)
Races - Native Hawaiian and Other Pacific Islander alone (%)
Races - Native Hawaiian and Other Pacific Islander alone (% change since 2000)
Races - Two or more races (%)
Races - Two or more races (% change since 2000)
Races - Other race alone (%)
Races - Other race alone (% change since 2000)
Racial diversity
Unemployment (%)
Unemployment (% change since 2000)
Unemployment (%) - White
Unemployment (%) - Black or African American
Unemployment (%) - Asian
Unemployment (%) - Hispanic or Latino
Unemployment (%) - American Indian and Alaska Native
Unemployment (%) - Multirace
Unemployment (%) - Other Race
Population density (people per square mile)
Population - Males (%)
Population - Females (%)
Population - Males (%) - White
Population - Males (%) - Black or African American
Population - Males (%) - Asian
Population - Males (%) - Hispanic or Latino
Population - Males (%) - American Indian and Alaska Native
Population - Males (%) - Multirace
Population - Males (%) - Other Race
Population - Females (%) - White
Population - Females (%) - Black or African American
Population - Females (%) - Asian
Population - Females (%) - Hispanic or Latino
Population - Females (%) - American Indian and Alaska Native
Population - Females (%) - Multirace
Population - Females (%) - Other Race
Coronavirus confirmed cases (Apr 27, 2024)
Deaths caused by coronavirus (Apr 27, 2024)
Coronavirus confirmed cases (per 100k population) (Apr 27, 2024)
Deaths caused by coronavirus (per 100k population) (Apr 27, 2024)
Daily increase in number of cases (Apr 27, 2024)
Weekly increase in number of cases (Apr 27, 2024)
Cases doubled (in days) (Apr 27, 2024)
Hospitalized patients (Apr 18, 2022)
Negative test results (Apr 18, 2022)
Total test results (Apr 18, 2022)
COVID Vaccine doses distributed (per 100k population) (Sep 19, 2023)
COVID Vaccine doses administered (per 100k population) (Sep 19, 2023)
COVID Vaccine doses distributed (Sep 19, 2023)
COVID Vaccine doses administered (Sep 19, 2023)
Likely homosexual households (%)
Likely homosexual households (% change since 2000)
Likely homosexual households - Lesbian couples (%)
Likely homosexual households - Lesbian couples (% change since 2000)
Likely homosexual households - Gay men (%)
Likely homosexual households - Gay men (% change since 2000)
Cost of living index
Median gross rent ($)
Median contract rent ($)
Median monthly housing costs ($)
Median house or condo value ($)
Median house or condo value ($ change since 2000)
Mean house or condo value by units in structure - 1, detached ($)
Mean house or condo value by units in structure - 1, attached ($)
Mean house or condo value by units in structure - 2 ($)
Mean house or condo value by units in structure by units in structure - 3 or 4 ($)
Mean house or condo value by units in structure - 5 or more ($)
Mean house or condo value by units in structure - Boat, RV, van, etc. ($)
Mean house or condo value by units in structure - Mobile home ($)
Median house or condo value ($) - White
Median house or condo value ($) - Black or African American
Median house or condo value ($) - Asian
Median house or condo value ($) - Hispanic or Latino
Median house or condo value ($) - American Indian and Alaska Native
Median house or condo value ($) - Multirace
Median house or condo value ($) - Other Race
Median resident age
Resident age diversity
Median resident age - Males
Median resident age - Females
Median resident age - White
Median resident age - Black or African American
Median resident age - Asian
Median resident age - Hispanic or Latino
Median resident age - American Indian and Alaska Native
Median resident age - Multirace
Median resident age - Other Race
Median resident age - Males - White
Median resident age - Males - Black or African American
Median resident age - Males - Asian
Median resident age - Males - Hispanic or Latino
Median resident age - Males - American Indian and Alaska Native
Median resident age - Males - Multirace
Median resident age - Males - Other Race
Median resident age - Females - White
Median resident age - Females - Black or African American
Median resident age - Females - Asian
Median resident age - Females - Hispanic or Latino
Median resident age - Females - American Indian and Alaska Native
Median resident age - Females - Multirace
Median resident age - Females - Other Race
Commute - mean travel time to work (minutes)
Travel time to work - Less than 5 minutes (%)
Travel time to work - Less than 5 minutes (% change since 2000)
Travel time to work - 5 to 9 minutes (%)
Travel time to work - 5 to 9 minutes (% change since 2000)
Travel time to work - 10 to 19 minutes (%)
Travel time to work - 10 to 19 minutes (% change since 2000)
Travel time to work - 20 to 29 minutes (%)
Travel time to work - 20 to 29 minutes (% change since 2000)
Travel time to work - 30 to 39 minutes (%)
Travel time to work - 30 to 39 minutes (% change since 2000)
Travel time to work - 40 to 59 minutes (%)
Travel time to work - 40 to 59 minutes (% change since 2000)
Travel time to work - 60 to 89 minutes (%)
Travel time to work - 60 to 89 minutes (% change since 2000)
Travel time to work - 90 or more minutes (%)
Travel time to work - 90 or more minutes (% change since 2000)
Marital status - Never married (%)
Marital status - Now married (%)
Marital status - Separated (%)
Marital status - Widowed (%)
Marital status - Divorced (%)
Median family income ($)
Median family income (% change since 2000)
Median non-family income ($)
Median non-family income (% change since 2000)
Median per capita income ($)
Median per capita income (% change since 2000)
Median family income ($) - White
Median family income ($) - Black or African American
Median family income ($) - Asian
Median family income ($) - Hispanic or Latino
Median family income ($) - American Indian and Alaska Native
Median family income ($) - Multirace
Median family income ($) - Other Race
Median year house/condo built
Median year apartment built
Year house built - Built 2005 or later (%)
Year house built - Built 2000 to 2004 (%)
Year house built - Built 1990 to 1999 (%)
Year house built - Built 1980 to 1989 (%)
Year house built - Built 1970 to 1979 (%)
Year house built - Built 1960 to 1969 (%)
Year house built - Built 1950 to 1959 (%)
Year house built - Built 1940 to 1949 (%)
Year house built - Built 1939 or earlier (%)
Average household size
Household density (households per square mile)
Average household size - White
Average household size - Black or African American
Average household size - Asian
Average household size - Hispanic or Latino
Average household size - American Indian and Alaska Native
Average household size - Multirace
Average household size - Other Race
Occupied housing units (%)
Vacant housing units (%)
Owner occupied housing units (%)
Renter occupied housing units (%)
Vacancy status - For rent (%)
Vacancy status - For sale only (%)
Vacancy status - Rented or sold, not occupied (%)
Vacancy status - For seasonal, recreational, or occasional use (%)
Vacancy status - For migrant workers (%)
Vacancy status - Other vacant (%)
Residents with income below the poverty level (%)
Residents with income below 50% of the poverty level (%)
Children below poverty level (%)
Poor families by family type - Married-couple family (%)
Poor families by family type - Male, no wife present (%)
Poor families by family type - Female, no husband present (%)
Poverty status for native-born residents (%)
Poverty status for foreign-born residents (%)
Poverty among high school graduates not in families (%)
Poverty among people who did not graduate high school not in families (%)
Residents with income below the poverty level (%) - White
Residents with income below the poverty level (%) - Black or African American
Residents with income below the poverty level (%) - Asian
Residents with income below the poverty level (%) - Hispanic or Latino
Residents with income below the poverty level (%) - American Indian and Alaska Native
Residents with income below the poverty level (%) - Multirace
Residents with income below the poverty level (%) - Other Race
Air pollution - Air Quality Index (AQI)
Air pollution - CO
Air pollution - NO2
Air pollution - SO2
Air pollution - Ozone
Air pollution - PM10
Air pollution - PM25
Air pollution - Pb
Crime - Murders per 100,000 population
Crime - Rapes per 100,000 population
Crime - Robberies per 100,000 population
Crime - Assaults per 100,000 population
Crime - Burglaries per 100,000 population
Crime - Thefts per 100,000 population
Crime - Auto thefts per 100,000 population
Crime - Arson per 100,000 population
Crime - City-data.com crime index
Crime - Violent crime index
Crime - Property crime index
Crime - Murders per 100,000 population (5 year average)
Crime - Rapes per 100,000 population (5 year average)
Crime - Robberies per 100,000 population (5 year average)
Crime - Assaults per 100,000 population (5 year average)
Crime - Burglaries per 100,000 population (5 year average)
Crime - Thefts per 100,000 population (5 year average)
Crime - Auto thefts per 100,000 population (5 year average)
Crime - Arson per 100,000 population (5 year average)
Crime - City-data.com crime index (5 year average)
Crime - Violent crime index (5 year average)
Crime - Property crime index (5 year average)
1996 Presidential Elections Results (%) - Democratic Party (Clinton)
1996 Presidential Elections Results (%) - Republican Party (Dole)
1996 Presidential Elections Results (%) - Other
2000 Presidential Elections Results (%) - Democratic Party (Gore)
2000 Presidential Elections Results (%) - Republican Party (Bush)
2000 Presidential Elections Results (%) - Other
2004 Presidential Elections Results (%) - Democratic Party (Kerry)
2004 Presidential Elections Results (%) - Republican Party (Bush)
2004 Presidential Elections Results (%) - Other
2008 Presidential Elections Results (%) - Democratic Party (Obama)
2008 Presidential Elections Results (%) - Republican Party (McCain)
2008 Presidential Elections Results (%) - Other
2012 Presidential Elections Results (%) - Democratic Party (Obama)
2012 Presidential Elections Results (%) - Republican Party (Romney)
2012 Presidential Elections Results (%) - Other
2016 Presidential Elections Results (%) - Democratic Party (Clinton)
2016 Presidential Elections Results (%) - Republican Party (Trump)
2016 Presidential Elections Results (%) - Other
2020 Presidential Elections Results (%) - Democratic Party (Biden)
2020 Presidential Elections Results (%) - Republican Party (Trump)
2020 Presidential Elections Results (%) - Other
Ancestries Reported - Arab (%)
Ancestries Reported - Czech (%)
Ancestries Reported - Danish (%)
Ancestries Reported - Dutch (%)
Ancestries Reported - English (%)
Ancestries Reported - French (%)
Ancestries Reported - French Canadian (%)
Ancestries Reported - German (%)
Ancestries Reported - Greek (%)
Ancestries Reported - Hungarian (%)
Ancestries Reported - Irish (%)
Ancestries Reported - Italian (%)
Ancestries Reported - Lithuanian (%)
Ancestries Reported - Norwegian (%)
Ancestries Reported - Polish (%)
Ancestries Reported - Portuguese (%)
Ancestries Reported - Russian (%)
Ancestries Reported - Scotch-Irish (%)
Ancestries Reported - Scottish (%)
Ancestries Reported - Slovak (%)
Ancestries Reported - Subsaharan African (%)
Ancestries Reported - Swedish (%)
Ancestries Reported - Swiss (%)
Ancestries Reported - Ukrainian (%)
Ancestries Reported - United States (%)
Ancestries Reported - Welsh (%)
Ancestries Reported - West Indian (%)
Ancestries Reported - Other (%)
Educational Attainment - No schooling completed (%)
Educational Attainment - Less than high school (%)
Educational Attainment - High school or equivalent (%)
Educational Attainment - Less than 1 year of college (%)
Educational Attainment - 1 or more years of college (%)
Educational Attainment - Associate degree (%)
Educational Attainment - Bachelor's degree (%)
Educational Attainment - Master's degree (%)
Educational Attainment - Professional school degree (%)
Educational Attainment - Doctorate degree (%)
School Enrollment - Nursery, preschool (%)
School Enrollment - Kindergarten (%)
School Enrollment - Grade 1 to 4 (%)
School Enrollment - Grade 5 to 8 (%)
School Enrollment - Grade 9 to 12 (%)
School Enrollment - College undergrad (%)
School Enrollment - Graduate or professional (%)
School Enrollment - Not enrolled in school (%)
School enrollment - Public schools (%)
School enrollment - Private schools (%)
School enrollment - Not enrolled (%)
Median number of rooms in houses and condos
Median number of rooms in apartments
Housing units lacking complete plumbing facilities (%)
Housing units lacking complete kitchen facilities (%)
Density of houses
Urban houses (%)
Rural houses (%)
Households with people 60 years and over (%)
Households with people 65 years and over (%)
Households with people 75 years and over (%)
Households with one or more nonrelatives (%)
Households with no nonrelatives (%)
Population in households (%)
Family households (%)
Nonfamily households (%)
Population in families (%)
Family households with own children (%)
Median number of bedrooms in owner occupied houses
Mean number of bedrooms in owner occupied houses
Median number of bedrooms in renter occupied houses
Mean number of bedrooms in renter occupied houses
Median number of vehichles in owner occupied houses
Mean number of vehichles in owner occupied houses
Median number of vehichles in renter occupied houses
Mean number of vehichles in renter occupied houses
Mortgage status - with mortgage (%)
Mortgage status - with second mortgage (%)
Mortgage status - with home equity loan (%)
Mortgage status - with both second mortgage and home equity loan (%)
Mortgage status - without a mortgage (%)
Average family size
Average family size - White
Average family size - Black or African American
Average family size - Asian
Average family size - Hispanic or Latino
Average family size - American Indian and Alaska Native
Average family size - Multirace
Average family size - Other Race
Geographical mobility - Same house 1 year ago (%)
Geographical mobility - Moved within same county (%)
Geographical mobility - Moved from different county within same state (%)
Geographical mobility - Moved from different state (%)
Geographical mobility - Moved from abroad (%)
Place of birth - Born in state of residence (%)
Place of birth - Born in other state (%)
Place of birth - Native, outside of US (%)
Place of birth - Foreign born (%)
Housing units in structures - 1, detached (%)
Housing units in structures - 1, attached (%)
Housing units in structures - 2 (%)
Housing units in structures - 3 or 4 (%)
Housing units in structures - 5 to 9 (%)
Housing units in structures - 10 to 19 (%)
Housing units in structures - 20 to 49 (%)
Housing units in structures - 50 or more (%)
Housing units in structures - Mobile home (%)
Housing units in structures - Boat, RV, van, etc. (%)
House/condo owner moved in on average (years ago)
Renter moved in on average (years ago)
Year householder moved into unit - Moved in 1999 to March 2000 (%)
Year householder moved into unit - Moved in 1995 to 1998 (%)
Year householder moved into unit - Moved in 1990 to 1994 (%)
Year householder moved into unit - Moved in 1980 to 1989 (%)
Year householder moved into unit - Moved in 1970 to 1979 (%)
Year householder moved into unit - Moved in 1969 or earlier (%)
Means of transportation to work - Drove car alone (%)
Means of transportation to work - Carpooled (%)
Means of transportation to work - Public transportation (%)
Means of transportation to work - Bus or trolley bus (%)
Means of transportation to work - Streetcar or trolley car (%)
Means of transportation to work - Subway or elevated (%)
Means of transportation to work - Railroad (%)
Means of transportation to work - Ferryboat (%)
Means of transportation to work - Taxicab (%)
Means of transportation to work - Motorcycle (%)
Means of transportation to work - Bicycle (%)
Means of transportation to work - Walked (%)
Means of transportation to work - Other means (%)
Working at home (%)
Industry diversity
Most Common Industries - Agriculture, forestry, fishing and hunting, and mining (%)
Most Common Industries - Agriculture, forestry, fishing and hunting (%)
Most Common Industries - Mining, quarrying, and oil and gas extraction (%)
Most Common Industries - Construction (%)
Most Common Industries - Manufacturing (%)
Most Common Industries - Wholesale trade (%)
Most Common Industries - Retail trade (%)
Most Common Industries - Transportation and warehousing, and utilities (%)
Most Common Industries - Transportation and warehousing (%)
Most Common Industries - Utilities (%)
Most Common Industries - Information (%)
Most Common Industries - Finance and insurance, and real estate and rental and leasing (%)
Most Common Industries - Finance and insurance (%)
Most Common Industries - Real estate and rental and leasing (%)
Most Common Industries - Professional, scientific, and management, and administrative and waste management services (%)
Most Common Industries - Professional, scientific, and technical services (%)
Most Common Industries - Management of companies and enterprises (%)
Most Common Industries - Administrative and support and waste management services (%)
Most Common Industries - Educational services, and health care and social assistance (%)
Most Common Industries - Educational services (%)
Most Common Industries - Health care and social assistance (%)
Most Common Industries - Arts, entertainment, and recreation, and accommodation and food services (%)
Most Common Industries - Arts, entertainment, and recreation (%)
Most Common Industries - Accommodation and food services (%)
Most Common Industries - Other services, except public administration (%)
Most Common Industries - Public administration (%)
Occupation diversity
Most Common Occupations - Management, business, science, and arts occupations (%)
Most Common Occupations - Management, business, and financial occupations (%)
Most Common Occupations - Management occupations (%)
Most Common Occupations - Business and financial operations occupations (%)
Most Common Occupations - Computer, engineering, and science occupations (%)
Most Common Occupations - Computer and mathematical occupations (%)
Most Common Occupations - Architecture and engineering occupations (%)
Most Common Occupations - Life, physical, and social science occupations (%)
Most Common Occupations - Education, legal, community service, arts, and media occupations (%)
Most Common Occupations - Community and social service occupations (%)
Most Common Occupations - Legal occupations (%)
Most Common Occupations - Education, training, and library occupations (%)
Most Common Occupations - Arts, design, entertainment, sports, and media occupations (%)
Most Common Occupations - Healthcare practitioners and technical occupations (%)
Most Common Occupations - Health diagnosing and treating practitioners and other technical occupations (%)
Most Common Occupations - Health technologists and technicians (%)
Most Common Occupations - Service occupations (%)
Most Common Occupations - Healthcare support occupations (%)
Most Common Occupations - Protective service occupations (%)
Most Common Occupations - Fire fighting and prevention, and other protective service workers including supervisors (%)
Most Common Occupations - Law enforcement workers including supervisors (%)
Most Common Occupations - Food preparation and serving related occupations (%)
Most Common Occupations - Building and grounds cleaning and maintenance occupations (%)
Most Common Occupations - Personal care and service occupations (%)
Most Common Occupations - Sales and office occupations (%)
Most Common Occupations - Sales and related occupations (%)
Most Common Occupations - Office and administrative support occupations (%)
Most Common Occupations - Natural resources, construction, and maintenance occupations (%)
Most Common Occupations - Farming, fishing, and forestry occupations (%)
Most Common Occupations - Construction and extraction occupations (%)
Most Common Occupations - Installation, maintenance, and repair occupations (%)
Most Common Occupations - Production, transportation, and material moving occupations (%)
Most Common Occupations - Production occupations (%)
Most Common Occupations - Transportation occupations (%)
Most Common Occupations - Material moving occupations (%)
People in Group quarters - Institutionalized population (%)
People in Group quarters - Correctional institutions (%)
People in Group quarters - Federal prisons and detention centers (%)
People in Group quarters - Halfway houses (%)
People in Group quarters - Local jails and other confinement facilities (including police lockups) (%)
People in Group quarters - Military disciplinary barracks (%)
People in Group quarters - State prisons (%)
People in Group quarters - Other types of correctional institutions (%)
People in Group quarters - Nursing homes (%)
People in Group quarters - Hospitals/wards, hospices, and schools for the handicapped (%)
People in Group quarters - Hospitals/wards and hospices for chronically ill (%)
People in Group quarters - Hospices or homes for chronically ill (%)
People in Group quarters - Military hospitals or wards for chronically ill (%)
People in Group quarters - Other hospitals or wards for chronically ill (%)
People in Group quarters - Hospitals or wards for drug/alcohol abuse (%)
People in Group quarters - Mental (Psychiatric) hospitals or wards (%)
People in Group quarters - Schools, hospitals, or wards for the mentally retarded (%)
People in Group quarters - Schools, hospitals, or wards for the physically handicapped (%)
People in Group quarters - Institutions for the deaf (%)
People in Group quarters - Institutions for the blind (%)
People in Group quarters - Orthopedic wards and institutions for the physically handicapped (%)
People in Group quarters - Wards in general hospitals for patients who have no usual home elsewhere (%)
People in Group quarters - Wards in military hospitals for patients who have no usual home elsewhere (%)
People in Group quarters - Juvenile institutions (%)
People in Group quarters - Long-term care (%)
People in Group quarters - Homes for abused, dependent, and neglected children (%)
People in Group quarters - Residential treatment centers for emotionally disturbed children (%)
People in Group quarters - Training schools for juvenile delinquents (%)
People in Group quarters - Short-term care, detention or diagnostic centers for delinquent children (%)
People in Group quarters - Type of juvenile institution unknown (%)
People in Group quarters - Noninstitutionalized population (%)
People in Group quarters - College dormitories (includes college quarters off campus) (%)
People in Group quarters - Military quarters (%)
People in Group quarters - On base (%)
People in Group quarters - Barracks, unaccompanied personnel housing (UPH), (Enlisted/Officer), ;and similar group living quarters for military personnel (%)
People in Group quarters - Transient quarters for temporary residents (%)
People in Group quarters - Military ships (%)
People in Group quarters - Group homes (%)
People in Group quarters - Homes or halfway houses for drug/alcohol abuse (%)
People in Group quarters - Homes for the mentally ill (%)
People in Group quarters - Homes for the mentally retarded (%)
People in Group quarters - Homes for the physically handicapped (%)
People in Group quarters - Other group homes (%)
People in Group quarters - Religious group quarters (%)
People in Group quarters - Dormitories (%)
People in Group quarters - Agriculture workers' dormitories on farms (%)
People in Group quarters - Job Corps and vocational training facilities (%)
People in Group quarters - Other workers' dormitories (%)
People in Group quarters - Crews of maritime vessels (%)
People in Group quarters - Other nonhousehold living situations (%)
People in Group quarters - Other noninstitutional group quarters (%)
Residents speaking English at home (%)
Residents speaking English at home - Born in the United States (%)
Residents speaking English at home - Native, born elsewhere (%)
Residents speaking English at home - Foreign born (%)
Residents speaking Spanish at home (%)
Residents speaking Spanish at home - Born in the United States (%)
Residents speaking Spanish at home - Native, born elsewhere (%)
Residents speaking Spanish at home - Foreign born (%)
Residents speaking other language at home (%)
Residents speaking other language at home - Born in the United States (%)
Residents speaking other language at home - Native, born elsewhere (%)
Residents speaking other language at home - Foreign born (%)
Class of Workers - Employee of private company (%)
Class of Workers - Self-employed in own incorporated business (%)
Class of Workers - Private not-for-profit wage and salary workers (%)
Class of Workers - Local government workers (%)
Class of Workers - State government workers (%)
Class of Workers - Federal government workers (%)
Class of Workers - Self-employed workers in own not incorporated business and Unpaid family workers (%)
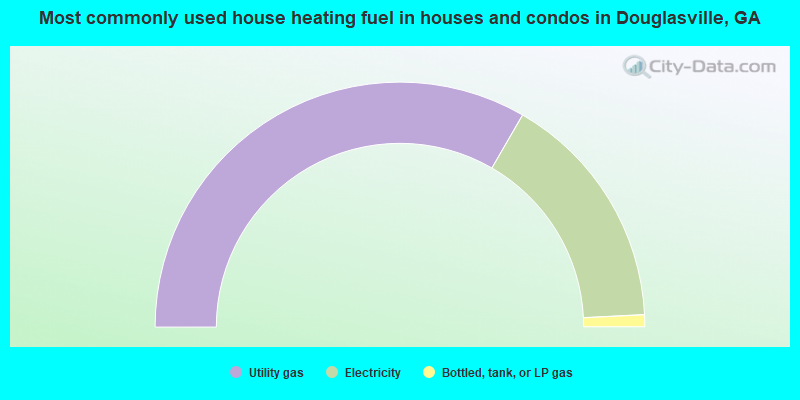
House heating fuel used in houses and condos - Utility gas (%)
House heating fuel used in houses and condos - Bottled, tank, or LP gas (%)
House heating fuel used in houses and condos - Electricity (%)
House heating fuel used in houses and condos - Fuel oil, kerosene, etc. (%)
House heating fuel used in houses and condos - Coal or coke (%)
House heating fuel used in houses and condos - Wood (%)
House heating fuel used in houses and condos - Solar energy (%)
House heating fuel used in houses and condos - Other fuel (%)
House heating fuel used in houses and condos - No fuel used (%)
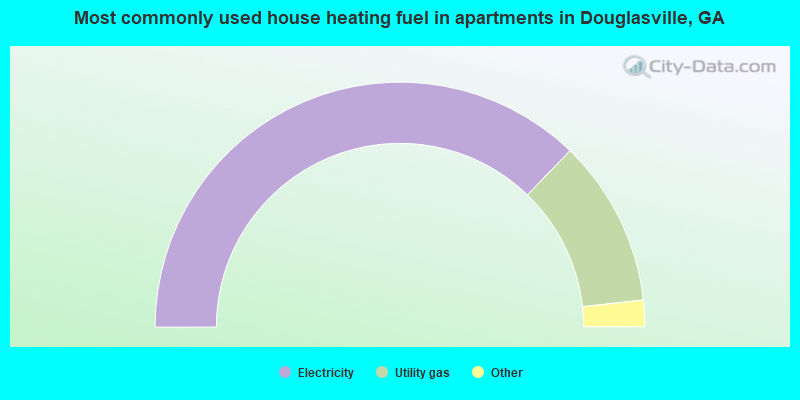
House heating fuel used in apartments - Utility gas (%)
House heating fuel used in apartments - Bottled, tank, or LP gas (%)
House heating fuel used in apartments - Electricity (%)
House heating fuel used in apartments - Fuel oil, kerosene, etc. (%)
House heating fuel used in apartments - Coal or coke (%)
House heating fuel used in apartments - Wood (%)
House heating fuel used in apartments - Solar energy (%)
House heating fuel used in apartments - Other fuel (%)
House heating fuel used in apartments - No fuel used (%)
Armed forces status - In Armed Forces (%)
Armed forces status - Civilian (%)
Armed forces status - Civilian - Veteran (%)
Armed forces status - Civilian - Nonveteran (%)
Fatal accidents locations in years 2005-2021
Fatal accidents locations in 2005
Fatal accidents locations in 2006
Fatal accidents locations in 2007
Fatal accidents locations in 2008
Fatal accidents locations in 2009
Fatal accidents locations in 2010
Fatal accidents locations in 2011
Fatal accidents locations in 2012
Fatal accidents locations in 2013
Fatal accidents locations in 2014
Fatal accidents locations in 2015
Fatal accidents locations in 2016
Fatal accidents locations in 2017
Fatal accidents locations in 2018
Fatal accidents locations in 2019
Fatal accidents locations in 2020
Fatal accidents locations in 2021
Alcohol use - People drinking some alcohol every month (%)
Alcohol use - People not drinking at all (%)
Alcohol use - Average days/month drinking alcohol
Alcohol use - Average drinks/week
Alcohol use - Average days/year people drink much
Audiometry - Average condition of hearing (%)
Audiometry - People that can hear a whisper from across a quiet room (%)
Audiometry - People that can hear normal voice from across a quiet room (%)
Audiometry - Ears ringing, roaring, buzzing (%)
Audiometry - Had a job exposure to loud noise (%)
Audiometry - Had off-work exposure to loud noise (%)
Blood Pressure & Cholesterol - Has high blood pressure (%)
Blood Pressure & Cholesterol - Checking blood pressure at home (%)
Blood Pressure & Cholesterol - Frequently checking blood cholesterol (%)
Blood Pressure & Cholesterol - Has high cholesterol level (%)
Consumer Behavior - Money monthly spent on food at supermarket/grocery store
Consumer Behavior - Money monthly spent on food at other stores
Consumer Behavior - Money monthly spent on eating out
Consumer Behavior - Money monthly spent on carryout/delivered foods
Consumer Behavior - Income spent on food at supermarket/grocery store (%)
Consumer Behavior - Income spent on food at other stores (%)
Consumer Behavior - Income spent on eating out (%)
Consumer Behavior - Income spent on carryout/delivered foods (%)
Current Health Status - General health condition (%)
Current Health Status - Blood donors (%)
Current Health Status - Has blood ever tested for HIV virus (%)
Current Health Status - Left-handed people (%)
Dermatology - People using sunscreen (%)
Diabetes - Diabetics (%)
Diabetes - Had a blood test for high blood sugar (%)
Diabetes - People taking insulin (%)
Diet Behavior & Nutrition - Diet health (%)
Diet Behavior & Nutrition - Milk product consumption (# of products/month)
Diet Behavior & Nutrition - Meals not home prepared (#/week)
Diet Behavior & Nutrition - Meals from fast food or pizza place (#/week)
Diet Behavior & Nutrition - Ready-to-eat foods (#/month)
Diet Behavior & Nutrition - Frozen meals/pizza (#/month)
Drug Use - People that ever used marijuana or hashish (%)
Drug Use - Ever used hard drugs (%)
Drug Use - Ever used any form of cocaine (%)
Drug Use - Ever used heroin (%)
Drug Use - Ever used methamphetamine (%)
Health Insurance - People covered by health insurance (%)
Kidney Conditions-Urology - Avg. # of times urinating at night
Medical Conditions - People with asthma (%)
Medical Conditions - People with anemia (%)
Medical Conditions - People with psoriasis (%)
Medical Conditions - People with overweight (%)
Medical Conditions - Elderly people having difficulties in thinking or remembering (%)
Medical Conditions - People who ever received blood transfusion (%)
Medical Conditions - People having trouble seeing even with glass/contacts (%)
Medical Conditions - People with arthritis (%)
Medical Conditions - People with gout (%)
Medical Conditions - People with congestive heart failure (%)
Medical Conditions - People with coronary heart disease (%)
Medical Conditions - People with angina pectoris (%)
Medical Conditions - People who ever had heart attack (%)
Medical Conditions - People who ever had stroke (%)
Medical Conditions - People with emphysema (%)
Medical Conditions - People with thyroid problem (%)
Medical Conditions - People with chronic bronchitis (%)
Medical Conditions - People with any liver condition (%)
Medical Conditions - People who ever had cancer or malignancy (%)
Mental Health - People who have little interest in doing things (%)
Mental Health - People feeling down, depressed, or hopeless (%)
Mental Health - People who have trouble sleeping or sleeping too much (%)
Mental Health - People feeling tired or having little energy (%)
Mental Health - People with poor appetite or overeating (%)
Mental Health - People feeling bad about themself (%)
Mental Health - People who have trouble concentrating on things (%)
Mental Health - People moving or speaking slowly or too fast (%)
Mental Health - People having thoughts they would be better off dead (%)
Oral Health - Average years since last visit a dentist
Oral Health - People embarrassed because of mouth (%)
Oral Health - People with gum disease (%)
Oral Health - General health of teeth and gums (%)
Oral Health - Average days a week using dental floss/device
Oral Health - Average days a week using mouthwash for dental problem
Oral Health - Average number of teeth
Pesticide Use - Households using pesticides to control insects (%)
Pesticide Use - Households using pesticides to kill weeds (%)
Physical Activity - People doing vigorous-intensity work activities (%)
Physical Activity - People doing moderate-intensity work activities (%)
Physical Activity - People walking or bicycling (%)
Physical Activity - People doing vigorous-intensity recreational activities (%)
Physical Activity - People doing moderate-intensity recreational activities (%)
Physical Activity - Average hours a day doing sedentary activities
Physical Activity - Average hours a day watching TV or videos
Physical Activity - Average hours a day using computer
Physical Functioning - People having limitations keeping them from working (%)
Physical Functioning - People limited in amount of work they can do (%)
Physical Functioning - People that need special equipment to walk (%)
Physical Functioning - People experiencing confusion/memory problems (%)
Physical Functioning - People requiring special healthcare equipment (%)
Prescription Medications - Average number of prescription medicines taking
Preventive Aspirin Use - Adults 40+ taking low-dose aspirin (%)
Reproductive Health - Vaginal deliveries (%)
Reproductive Health - Cesarean deliveries (%)
Reproductive Health - Deliveries resulted in a live birth (%)
Reproductive Health - Pregnancies resulted in a delivery (%)
Reproductive Health - Women breastfeeding newborns (%)
Reproductive Health - Women that had a hysterectomy (%)
Reproductive Health - Women that had both ovaries removed (%)
Reproductive Health - Women that have ever taken birth control pills (%)
Reproductive Health - Women taking birth control pills (%)
Reproductive Health - Women that have ever used Depo-Provera or injectables (%)
Reproductive Health - Women that have ever used female hormones (%)
Sexual Behavior - People 18+ that ever had sex (vaginal, anal, or oral) (%)
Sexual Behavior - Males 18+ that ever had vaginal sex with a woman (%)
Sexual Behavior - Males 18+ that ever performed oral sex on a woman (%)
Sexual Behavior - Males 18+ that ever had anal sex with a woman (%)
Sexual Behavior - Males 18+ that ever had any sex with a man (%)
Sexual Behavior - Females 18+ that ever had vaginal sex with a man (%)
Sexual Behavior - Females 18+ that ever performed oral sex on a man (%)
Sexual Behavior - Females 18+ that ever had anal sex with a man (%)
Sexual Behavior - Females 18+ that ever had any kind of sex with a woman (%)
Sexual Behavior - Average age people first had sex
Sexual Behavior - Average number of female sex partners in lifetime (males 18+)
Sexual Behavior - Average number of female vaginal sex partners in lifetime (males 18+)
Sexual Behavior - Average age people first performed oral sex on a woman (18+)
Sexual Behavior - Average number of woman performed oral sex on in lifetime (18+)
Sexual Behavior - Average number of male sex partners in lifetime (males 18+)
Sexual Behavior - Average number of male anal sex partners in lifetime (males 18+)
Sexual Behavior - Average age people first performed oral sex on a man (18+)
Sexual Behavior - Average number of male oral sex partners in lifetime (18+)
Sexual Behavior - People using protection when performing oral sex (%)
Sexual Behavior - Average number of times people have vaginal or anal sex a year
Sexual Behavior - People having sex without condom (%)
Sexual Behavior - Average number of male sex partners in lifetime (females 18+)
Sexual Behavior - Average number of male vaginal sex partners in lifetime (females 18+)
Sexual Behavior - Average number of female sex partners in lifetime (females 18+)
Sexual Behavior - Circumcised males 18+ (%)
Sleep Disorders - Average hours sleeping at night
Sleep Disorders - People that has trouble sleeping (%)
Smoking-Cigarette Use - People smoking cigarettes (%)
Taste & Smell - People 40+ having problems with smell (%)
Taste & Smell - People 40+ having problems with taste (%)
Taste & Smell - People 40+ that ever had wisdom teeth removed (%)
Taste & Smell - People 40+ that ever had tonsils teeth removed (%)
Taste & Smell - People 40+ that ever had a loss of consciousness because of a head injury (%)
Taste & Smell - People 40+ that ever had a broken nose or other serious injury to face or skull (%)
Taste & Smell - People 40+ that ever had two or more sinus infections (%)
Weight - Average height (inches)
Weight - Average weight (pounds)
Weight - Average BMI
Weight - People that are obese (%)
Weight - People that ever were obese (%)
Weight - People trying to lose weight (%)
Officers per 1,000 residents here:
2.55Georgia average:
2.45
Latest news from Douglasville, GA collected exclusively by city-data.com from local newspapers, TV, and radio stations
Ancestries: American (11.1%), Scottish (2.5%), Jamaican (1.9%), English (1.7%), African (1.6%), Kenyan (1.5%).
Current Local Time:
Land area: 21.4 square miles.
Population density: 1,775 people per square mile (low).
3,225 residents are foreign born (4.2% Latin America , 2.8% Africa , 1.1% Asia ).
This city:
9.0%Georgia:
10.4%
Median real estate property taxes paid for housing units with mortgages in 2022: $3,399 (0.9%)Median real estate property taxes paid for housing units with no mortgage in 2022: $1,802 (0.6%)
Nearest city with pop. 50,000+: Marietta, GA
Nearest city with pop. 200,000+: Atlanta, GA
Nearest city with pop. 1,000,000+: Chicago, IL
Nearest cities:
Latitude: 33.75 N, Longitude: 84.72 W
Daytime population change due to commuting: +4,617 (+12.9%)Workers who live and work in this city: 7,183 (37.4%)
Douglasville tourist attractions:
Single-family new house construction building permits:
2022: 166 buildings , average cost: $378,6002021: 251 buildings , average cost: $279,3002020: 155 buildings , average cost: $495,3002019: 220 buildings , average cost: $323,8002018: 172 buildings , average cost: $318,4002017: 177 buildings , average cost: $290,6002016: 154 buildings , average cost: $277,0002015: 55 buildings , average cost: $317,8002014: 44 buildings , average cost: $338,2002013: 81 buildings , average cost: $296,4002012: 56 buildings , average cost: $297,9002011: 11 buildings , average cost: $319,2002010: 14 buildings , average cost: $258,0002009: 23 buildings , average cost: $218,9002008: 82 buildings , average cost: $85,3002007: 262 buildings , average cost: $79,7002006: 514 buildings , average cost: $80,4002005: 386 buildings , average cost: $76,7002004: 334 buildings , average cost: $65,2002003: 467 buildings , average cost: $59,3002002: 532 buildings , average cost: $55,8002001: 243 buildings , average cost: $81,3002000: 221 buildings , average cost: $60,6001999: 198 buildings , average cost: $64,5001998: 194 buildings , average cost: $59,7001997: 174 buildings , average cost: $54,000Unemployment in December 2023:
Population change in the 1990s: +7,275 (+56.9%).
Most common occupations in Douglasville, GA (%)
Both Males Females
Other sales and related occupations, including supervisors (5.8%)
Other management occupations, except farmers and farm managers (5.4%)
Retail sales workers, except cashiers (3.9%)
Material recording, scheduling, dispatching, and distributing workers (3.9%)
Other production occupations, including supervisors (3.6%)
Secretaries and administrative assistants (3.6%)
Other office and administrative support workers, including supervisors (3.6%)
Other management occupations, except farmers and farm managers (7.2%)
Other sales and related occupations, including supervisors (6.5%)
Driver/sales workers and truck drivers (5.7%)
Electrical equipment mechanics and other installation, maintenance, and repair workers, including supervisors (5.5%)
Other production occupations, including supervisors (4.6%)
Retail sales workers, except cashiers (3.7%)
Material recording, scheduling, dispatching, and distributing workers (3.7%)
Secretaries and administrative assistants (7.6%)
Preschool, kindergarten, elementary, and middle school teachers (5.4%)
Other office and administrative support workers, including supervisors (5.1%)
Other sales and related occupations, including supervisors (5.0%)
Information and record clerks, except customer service representatives (4.8%)
Material recording, scheduling, dispatching, and distributing workers (4.1%)
Retail sales workers, except cashiers (4.1%)
Tornado activity:
Douglasville-area historical tornado activity is slightly above Georgia state average. It is 73% greater than the overall U.S. average.
On 11/22/1992, a category F4 (max. wind speeds 207-260 mph) tornado 12.2 miles away from the Douglasville city center injured 46 people and caused between $5,000,000 and $50,000,000 in damages.
On 3/29/1991, a category F3 (max. wind speeds 158-206 mph) tornado 7.0 miles away from the city center injured 25 people and caused between $5,000,000 and $50,000,000 in damages.
Earthquake activity:
Douglasville-area historical earthquake activity is significantly above Georgia state average. It is 63% greater than the overall U.S. average. On 4/29/2003 at 08:59:39, a magnitude 4.9 (4.4 MB, 4.6 MW, 4.9 LG, Class: Light, Intensity: IV - V) earthquake occurred 73.1 miles away from Douglasville center On 8/2/1974 at 08:52:09, a magnitude 4.9 (4.3 MB, 4.9 LG) earthquake occurred 128.7 miles away from the city center On 4/29/2003 at 08:59:39, a magnitude 4.6 (4.6 MW, Depth: 12.3 mi) earthquake occurred 73.1 miles away from the city center On 1/18/1999 at 07:00:53, a magnitude 4.8 (4.8 MB, 4.0 LG, Depth: 0.6 mi) earthquake occurred 147.8 miles away from the city center On 11/30/1973 at 07:48:41, a magnitude 4.7 (4.7 MB, 4.6 ML) earthquake occurred 148.2 miles away from the city center On 12/12/2018 at 09:14:43, a magnitude 4.4 (4.4 MW, Depth: 4.9 mi) earthquake occurred 128.8 miles away from Douglasville center Magnitude types: regional Lg-wave magnitude (LG), body-wave magnitude (MB), local magnitude (ML), moment magnitude (MW) Natural disasters: The number of natural disasters in Douglas County (12) is smaller than the US average (15).Major Disasters (Presidential) Declared: 7Emergencies Declared: 4Floods: 5, Storms: 5, Winter Storms: 3, Hurricanes: 2, Tornadoes: 2, Drought: 1, Snowfall: 1, Other: 1 (Note: some incidents may be assigned to more than one category). Hospitals and medical centers in Douglasville: WELLSTAR DOUGLAS HOSPITAL (Voluntary non-profit - Private, 8954 HOSPITAL DRIVE) DOUGLASVILLE NURSING AND REHABILITATION CENTER (4028 HWY 5)
ARBOR PLACE DIALYSIS (9559 HIGHWAY 5 STE #1)
DOUGLASVILLE DIALYSIS (3899 LONGVIEW DRIVE)
RENAL CARE GROUP-DOUGLAS COUNTY (4645 TIMBER RIDGE ROAD)
CENTRAL HOME HEALTH CARE, AN AMEDISYS COMPANY (3009 CHAPEL HILL ROAD, SUITE C)
Amtrak station near Douglasville: 20 miles: ATLANTA (1688 PEACHTREE ST. NW) Services: ticket office, partially wheelchair accessible, enclosed waiting area, public restrooms, public payphones, vending machines, paid short-term parking, paid long-term parking, taxi stand, public transit connection.
College/University in Douglasville: ITT Technical Institute-Douglasville Full-time enrollment: 102; Location: 5901 Stewart Parkway; Private, for-profit; Website: www.itt-tech.edu)
Colleges/universities with over 2000 students nearest to Douglasville:
Chattahoochee Technical College (about 16 miles; Marietta, GA ; Full-time enrollment: 8,173)
Southern Polytechnic State University (about 18 miles; Marietta, GA ; FT enrollment: 5,258)
Morehouse College (about 18 miles; Atlanta, GA ; FT enrollment: 2,379)
Clark Atlanta University (about 18 miles; Atlanta, GA ; FT enrollment: 3,201)
Spelman College (about 19 miles; Atlanta, GA ; FT enrollment: 2,383)
Atlanta Technical College (about 19 miles; Atlanta, GA ; FT enrollment: 4,217)
Atlanta Metropolitan State College (about 19 miles; Atlanta, GA ; FT enrollment: 2,437)
Public high schools in Douglasville: DOUGLAS COUNTY HIGH SCHOOL Students: 1,942, Location: 8705 CAMPBELLTON ST, Grades: 9-12)SOUTH PAULDING HIGH SCHOOL Students: 1,850, Location: 1364 WINN RD, Grades: 9-12)ALEXANDER HIGH SCHOOL Students: 1,839, Location: 6500 ALEXANDER PKWY, Grades: 9-12)CHAPEL HILL HIGH SCHOOL Location: 4899 CHAPEL HILL RD, Grades: 9-12)
YOUTH VILLAGES AT INNER HARBOUR Location: 4685 DORSETT SHOALS RD, Grades: 2-12)
NEW MANCHESTER HIGH SCHOOL Location: 4925 HIGHWAY 92/166, Grades: 9-12)
Private high schools in Douglasville: KING'S WAY CHRISTIAN SCHOOL Students: 349, Location: 6456 THE KINGS WAY, Grades: PK-12)
HARVESTER CHRISTIAN ACADEMY Students: 308, Location: 4241 CENTRAL CHURCH RD, Grades: PK-12)
HEIRWAY CHRISTIAN ACADEMY Students: 153, Location: 6758 SPRING ST, Grades: PK-12)
Biggest public elementary/middle schools in Douglasville: CHAPEL HILL MIDDLE SCHOOL Students: 1,848, Location: 3989 CHAPEL HILL RD, Grades: 6-8)CONNIE DUGAN ELEMENTARY SCHOOL Students: 1,038, Location: 1362 WINN RD, Grades: PK-5)IRMA C. AUSTIN MIDDLE SCHOOL Students: 983, Location: 3490 RIDGE RD, Grades: 6-8)FAIRPLAY MIDDLE SCHOOL Students: 948, Location: 8311 HIGHWAY 166, Grades: 6-8)NEW MANCHESTER ELEMENTARY SCHOOL Students: 872, Location: 2242 OLD LOWER RIVER RD, Grades: PK-5)YEAGER MIDDLE SCHOOL Students: 845, Location: 4000 KINGS HWY, Grades: 6-8)BILL ARP ELEMENTARY SCHOOL Students: 823, Location: 6550 ALEXANDER PKWY, Grades: KG-5)CHESTNUT LOG MIDDLE SCHOOL Students: 722, Location: 2544 POPE RD, Grades: 6-8)NORTH DOUGLAS ELEMENTARY SCHOOL Students: 598, Location: 1630 DORRIS RD, Grades: PK-5)ARBOR STATION ELEMENTARY SCHOOL Students: 586, Location: 9999 PARKWAY S, Grades: KG-5)Private elementary/middle schools in Douglasville: CHAPEL HILL CHRISTIAN SCHOOL Students: 157, Location: 5357 CHAPEL HILL RD, Grades: PK-4)MONTESSORI SCHOOL OF DOUGLAS COUNTY Students: 85, Location: 8014 DURALEE LN, Grades: PK-4)
ST Students: 75, Location: 6218 HOSPITAL WAY, Grades: PK-8)
DOUGLASVILLE SDA ELEMENTARY SCHOOL Students: 19, Location: 2836 BRIGHT STAR RD, Grades: 1-8)
See full list of schools located in Douglasville User-submitted facts and corrections:
The song "Somewhere Over the Rainbow" was actually written about Douglasville .
Notable locations in Douglasville: (A) , Western Pines Country Club (B) , Douglas County Sheriff Station (C) , Douglas County Fire Department Station 11 (D) , Mercer University Douglas County Center (E) , Douglas County Water and Sewer Administration Building (F) , Douglas County Fire Department Station 6 (G) , Douglas County Health Department (H) , Douglas County Chamber of Commerce (I) , Douglasville Police Station (J) , Douglasville City Hall (K) , Douglas County Fire Department Station 10 (L) , Douglas County Courthouse (M) , Douglas County Public Library (N) . Display/hide their locations on the map
Shopping Centers: (1) , Market Square Shopping Center (2) , Spring Market Shopping Center (3) , Douglas Village Shopping Center (4) , West Moreland Plaza Shopping Center (5) , Forest Mart Shopping Center (6) , Park Place Shopping Center (7) , Douglas Corner Shopping Center (8) , Douglas Crossing Shopping Center (9) . Display/hide their locations on the map
Churches in Douglasville include: (A) , Warren Chapel Methodist Episcopal Church (B) , Second Baptist Church (C) , Saint James Methodist Church (D) , Liberty Baptist Church (E) , Church of God (F) , True Gospel Church (G) . Display/hide their locations on the map
Cemetery: (1) . Display/hide its location on the map
Reservoirs: (A) , Crystal Lake (B) , Easons Lake (C) , Talerico Lake (D) , Shawnee Lake (E) , Leatherwood Lake (F) . Display/hide their locations on the map
Creeks: (A) , Slater Mill Creek (B) . Display/hide their locations on the map
Parks in Douglasville include: (1) , Wortham Park (2) . Display/hide their locations on the map
Tourist attractions: (1) , Douglas County Government - Small Claims- Magistrate Court- Magistrate Judges- Susan (Cultural Attractions- Events- & Facilities; 8700 Hospital Drive) (2) , Douglas County Government - Libraries (Cultural Attractions- Events- & Facilities; 6810 Selman Drive) (3) . Display/hide their approximate locations on the map
Hotels: (1) , Hampton Inn Atlanta/Douglasville (6371 Douglas Boulevard) (2) , Courtyard by Marriott Six Flags (950 Bob Arnold Boulevard) (3) , Hampton Inn (6371 Douglas Boulevard) (4) , Comfort Inn Douglasville (5487 Westmoreland Plaza) (5) , Atlanta Kitchen Equipment (4381 Industrial Access Road) (6) , Best Western Garden Inn and St (8304 Cherokee Boulevard) (7) , Days Inn (5489 Westmoreland Plaza) (8) , Atlanta-Days Inn Douglasville/Fairburn Road (5489 Westmoreland Plz) (9) . Display/hide their approximate locations on the map
Birthplace of: Josh Scogin - Rock singer, Daniel Davison - Heavy metal drummer, Cary Guffey - Child actor, Chris Denson - College football player (Princeton Tigers), Mario West - College basketball player (Georgia Tech Yellow Jackets), Terry Harper (baseball) - Baseball player.
Douglas County has a predicted average indoor radon screening level between 2 and 4 pCi/L (pico curies per liter) - Moderate Potential Drinking water stations with addresses in Douglasville and their reported violations in the past:
DOUGLASVILLE-DOUGLAS CO. AUTH. (Population served: 117,302, Surface water):
Past monitoring violations:
One routine major monitoring violation
Population served: 162, Groundwater):
Past monitoring violations:
One routine major monitoring violation
Average household size: This city:
2.6 peopleGeorgia:
2.6 people
Percentage of family households: This city:
66.2%Whole state:
68.5%
Percentage of households with unmarried partners: This city:
6.6%Whole state:
5.9%
Likely homosexual households (counted as self-reported same-sex unmarried-partner households)
Lesbian couples: 0.5% of all households Gay men: 0.3% of all households
People in group quarters in Douglasville in 2010:
798 people in local jails and other municipal confinement facilities
49 people in other noninstitutional facilities
34 people in group homes intended for adults
28 people in emergency and transitional shelters (with sleeping facilities) for people experiencing homelessness
23 people in correctional facilities intended for juveniles
5 people in correctional residential facilities
people in local jails and other confinement facilities (including police lockups) in 2000people in nursing homes in 2000Banks with most branches in Douglasville (2011 data):
SunTrust Bank: Arbor Place Branch, Cosby Station Branch, Fairburn Road Branch. Info updated 2010/05/27: Bank assets: $171,291.7 mil, Deposits: $129,833.2 mil, headquarters in Atlanta, GA, positive income , Commercial Lending Specialization, 1716 total offices , Holding Company: Suntrust Banks, Inc.
Regions Bank: Fairburn Road Branch, Bill Arp Branch, Douglasville Main Branch. Info updated 2011/02/24: Bank assets: $123,368.2 mil, Deposits: $98,301.3 mil, headquarters in Birmingham, AL, positive income , Commercial Lending Specialization, 1778 total offices , Holding Company: Regions Financial Corporation
Wells Fargo Bank, National Association: Douglasville/Highway 5 Branch, Douglasville Branch, Arbor Place Branch. Info updated 2011/04/05: Bank assets: $1,161,490.0 mil, Deposits: $905,653.0 mil, headquarters in Sioux Falls, SD, positive income , 6395 total offices , Holding Company: Wells Fargo & Company
Douglas County Bank: at 6157 Fairburn Road, branch established on 1974/06/25; Stewart Parkway Branch at 6100 Stewart Parkway, branch established on 1989/03/01. Info updated 2006/11/03: Bank assets: $327.1 mil, Deposits: $312.2 mil, local headquarters , negative income in the last year , Commercial Lending Specialization, 4 total offices , Holding Company: Thornton Holding Company, Inc.
Branch Banking and Trust Company: Douglasville Main Branch at 8458 Campbellton Street, branch established on 1960/08/04; Douglasville Branch at 3218 Highway 5, branch established on 1996/05/14. Info updated 2010/03/29: Bank assets: $168,867.6 mil, Deposits: $127,549.5 mil, headquarters in Winston Salem, NC, positive income , Commercial Lending Specialization, 1793 total offices , Holding Company: Bb&T Corporation
Synovus Bank: Church Street Branch at 6500 East Church Street, branch established on 2008/01/07; Chapel Hill Road Branch at 2991 Chapel Hill Road, branch established on 1987/10/06. Info updated 2011/01/25: Bank assets: $26,863.3 mil, Deposits: $22,415.0 mil, headquarters in Columbus, GA, positive income , Commercial Lending Specialization, 296 total offices , Holding Company: Synovus Financial Corp.
Community & Southern Bank: First Commerce Community Bank Branch at 9001 Hospital Drive, branch established on 2003/03/04; Chapel Hill Branch at 9360 The Landing Drive, branch established on 2006/04/10. Info updated 2010/09/20: Bank assets: $2,188.5 mil, Deposits: $1,690.2 mil, headquarters in Carrollton, GA, positive income , Commercial Lending Specialization, 39 total offices , Holding Company: Community & Southern Holdings, Inc.
Guaranty Bank: Hospital Drive Branch at 8501 Hospital Drive, branch established on 2008/05/01. Info updated 2011/07/21: Bank assets: $1,179.1 mil, Deposits: $1,102.7 mil, headquarters in Milwaukee, WI, negative income in the last year , Mortgage Lending Specialization, 166 total offices
Metro Bank: at 7475 Douglas Boulevard, branch established on 2008/01/28. Info updated 2008/01/29: Bank assets: $153.2 mil, Deposits: $129.6 mil, local headquarters , positive income , Commercial Lending Specialization, 2 total offices , Holding Company: Metro Bancshares, Inc.
5 other banks with 5 local branches
For population 15 years and over in Douglasville:
Never married: 39.0%Now married: 37.9%Separated: 2.7%Widowed: 4.4%Divorced: 16.0% For population 25 years and over in Douglasville:
High school or higher: 91.7%Bachelor's degree or higher: 36.5%Graduate or professional degree: 15.4%Unemployed: 5.4%Mean travel time to work (commute): 28.1 minutes
Education Gini index (Inequality in education) Here:
11.8Georgia average:
12.2
Religion statistics for Douglasville, GA (based on Douglas County data)
Religion Adherents Congregations Evangelical Protestant 45,976 93 Catholic 9,360 2 Mainline Protestant 7,944 12 Other 2,018 7 Black Protestant 747 4 None 66,358 -
Source: Clifford Grammich, Kirk Hadaway, Richard Houseal, Dale E.Jones, Alexei Krindatch, Richie Stanley and Richard H.Taylor. 2012. 2010 U.S.Religion Census: Religious Congregations & Membership Study. Association of Statisticians of American Religious Bodies. Jones, Dale E., et al. 2002. Congregations and Membership in the United States 2000. Nashville, TN: Glenmary Research Center. Graphs represent county-level data
Food Environment Statistics: Number of grocery stores : 16Douglas County :
1.29 / 10,000 pop.Georgia :
1.91 / 10,000 pop.
Number of supercenters and club stores : 3Douglas County :
0.24 / 10,000 pop.Georgia :
0.15 / 10,000 pop.
Number of convenience stores (no gas) : 6Here :
0.48 / 10,000 pop.Georgia :
0.86 / 10,000 pop.
Number of convenience stores (with gas) : 62This county :
4.99 / 10,000 pop.Georgia :
5.12 / 10,000 pop.
Number of full-service restaurants : 88Here :
7.08 / 10,000 pop.Georgia :
7.41 / 10,000 pop.
Adult diabetes rate : Douglas County :
9.9%Georgia :
10.4%
Adult obesity rate : Douglas County :
27.3%Georgia :
27.8%
Low-income preschool obesity rate : Douglas County :
10.9%Georgia :
14.6%
Health and Nutrition: Healthy diet rate : This city:
48.9%Georgia:
48.9%
Average overall health of teeth and gums : This city:
47.3%State:
46.5%
Average BMI : This city:
29.0Georgia:
28.9
People feeling badly about themselves : Douglasville:
20.5%Georgia:
20.4%
People not drinking alcohol at all : Douglasville:
10.9%Georgia:
10.8%
Average hours sleeping at night : Douglasville:
6.7Georgia:
6.7
Overweight people : This city:
33.5%State:
33.5%
General health condition : This city:
57.0%State:
56.2%
Average condition of hearing : This city:
81.9%Georgia:
80.8%
More about Health and Nutrition of Douglasville, GA Residents
Local government employment and payroll (March 2022)
Function
Full-time employees
Monthly full-time payroll
Average yearly full-time wage
Part-time employees
Monthly part-time payroll
Police Protection - Officers
83 $540,016 $78,075 0 $0 Solid Waste Management
29 $93,182 $38,558 0 $0 Other Government Administration
22 $131,834 $71,909 0 $0 Streets and Highways
21 $76,949 $43,971 0 $0 Parks and Recreation
19 $100,312 $63,355 25 $27,570 Police - Other
17 $66,958 $47,264 0 $0 Other and Unallocable
16 $68,174 $51,131 2 $3,333 Judicial and Legal
8 $31,174 $46,761 3 $4,934 Financial Administration
7 $49,376 $84,645 2 $6,779
Totals for Government
222 $1,157,973 $62,593 32 $42,616
Douglasville government finances - Expenditure in 2021 (per resident):
Current Operations - Police Protection: $11,113,000 ($292.85)
Solid Waste Management: $8,773,000 ($231.18)General - Other: $4,708,000 ($124.06)Parks and Recreation: $3,149,000 ($82.98)Central Staff Services: $1,886,000 ($49.70)Health - Other: $1,850,000 ($48.75)Regular Highways: $1,834,000 ($48.33)Judicial and Legal Services: $1,598,000 ($42.11)Financial Administration: $1,525,000 ($40.19)Housing and Community Development: $766,000 ($20.19)General Public Buildings: $650,000 ($17.13)Protective Inspection and Regulation - Other: $306,000 ($8.06)General - Interest on Debt: $993,000 ($26.17)
Intergovernmental to Local - Other - Local Fire Protection: $1,600,000 ($42.16)
Other - Correctional Institutions: $250,000 ($6.59)Other - General - Other: $250,000 ($6.59)Other Capital Outlay - Regular Highways: $1,450,000 ($38.21)
Police Protection: $604,000 ($15.92)General Public Building: $67,000 ($1.77)General - Other: $58,000 ($1.53)Parks and Recreation: $52,000 ($1.37)Financial Administration: $37,000 ($0.98)Judicial and Legal Services: $14,000 ($0.37)
Douglasville government finances - Revenue in 2021 (per resident):
Charges - Solid Waste Management: $5,302,000 ($139.72)
Parks and Recreation: $1,222,000 ($32.20)Other: $1,168,000 ($30.78)Federal Intergovernmental - Public Welfare: $1,779,000 ($46.88)
Other: $94,000 ($2.48)Local Intergovernmental - General Local Government Support: $10,173,000 ($268.08)
Other: $1,645,000 ($43.35)Miscellaneous - Fines and Forfeits: $616,000 ($16.23)
Sale of Property: $249,000 ($6.56)General Revenue - Other: $187,000 ($4.93)Interest Earnings: $97,000 ($2.56)State Intergovernmental - Other: $312,000 ($8.22)
General Local Government Support: $99,000 ($2.61)Tax - Property: $12,674,000 ($333.98)
Public Utilities Sales: $2,594,000 ($68.36)Insurance Premiums Sales: $2,442,000 ($64.35)Occupation and Business License - Other: $2,336,000 ($61.56)Other Selective Sales: $1,957,000 ($51.57)Alcoholic Beverage Sales: $1,334,000 ($35.15)Other License: $893,000 ($23.53)Alcoholic Beverage License: $320,000 ($8.43)Other: $25,000 ($0.66)
Douglasville government finances - Debt in 2021 (per resident):
Long Term Debt - Beginning Outstanding - Unspecified Public Purpose: $29,480,000 ($776.85)
Outstanding Unspecified Public Purpose: $27,124,000 ($714.77)Retired Unspecified Public Purpose: $2,356,000 ($62.08)
Douglasville government finances - Cash and Securities in 2021 (per resident):
Other Funds - Cash and Securities: $35,273,000 ($929.51)
Businesses in Douglasville, GA
Name Count Name Count
ALDI 1 LA Fitness 1 AT&T 4 La Quinta 1 Abercrombie & Fitch 1 La-Z-Boy 1 Ace Hardware 1 Lane Bryant 1 Advance Auto Parts 3 Lane Furniture 1 Aeropostale 1 LensCrafters 1 American Eagle Outfitters 1 Long John Silver's 1 Applebee's 1 Lowe's 1 Arby's 1 Macy's 1 AutoZone 3 Marshalls 1 Bath & Body Works 1 McDonald's 4 Bed Bath & Beyond 1 Men's Wearhouse 2 Best Western 1 Motherhood Maternity 2 Blockbuster 3 New York & Co 1 Buffalo Wild Wings 1 Nike 9 Burger King 1 Office Depot 1 CVS 1 OfficeMax 1 Charlotte Russe 1 Old Navy 1 Chick-Fil-A 3 Olive Garden 1 Chuck E. Cheese's 1 Outback 1 Church's Chicken 1 Outback Steakhouse 1 Cinnabon 1 Pac Sun 1 Circle K 1 Panda Express 1 Cold Stone Creamery 1 Payless 1 ColorTyme 1 Penske 1 Comfort Inn 1 PetSmart 1 Cracker Barrel 1 Pier 1 Imports 1 Curves 1 Pizza Hut 3 DHL 4 Plato's Closet 1 Dairy Queen 3 Publix Super Markets 2 Days Inn 1 Quality 1 Discount Tire 1 Quiznos 1 Domino's Pizza 3 RadioShack 1 Dunkin Donuts 1 Ramada 1 FedEx 13 Red Lobster 1 Finish Line 1 Rite Aid 4 Firestone Complete Auto Care 1 Rooms To Go 1 GNC 5 Rue21 1 GameStop 2 SONIC Drive-In 1 Gap 1 Sam's Club 1 Goodwill 2 Sears 3 Gymboree 1 Shoe Carnival 1 H&R Block 4 Sleep Inn 1 Hobby Lobby 1 Spencer Gifts 1 Holiday Inn 1 Sprint Nextel 1 Hollister Co. 1 Starbucks 2 Home Depot 1 T-Mobile 3 Hot Topic 1 Taco Bell 2 IHOP 1 Target 1 InTown Suites 1 Toys"R"Us 3 JCPenney 1 U-Haul 5 Johnny Rockets 1 UPS 13 Jones New York 3 Vans 2 Journeys 1 Verizon Wireless 2 Justice 1 Victoria's Secret 1 KFC 1 Waffle House 4 Kincaid 1 Walgreens 4 Kmart 1 Walmart 1 Kohl's 1 Wendy's 1 Kroger 4
Strongest AM radio stations in Douglasville:
WDCY (1520 AM; daytime; 2 kW; DOUGLASVILLE, GA; Owner: WORD CHRISTIAN BROADCASTING INC.)
WMLB (1160 AM; 50 kW; EAST POINT, GA; Owner: ATLANTA AREA BROADCASTING, INC.)
WAOS (1600 AM; 20 kW; AUSTELL, GA; Owner: LA FAVORITA, INC.)
WGST (640 AM; 50 kW; ATLANTA, GA; Owner: CITICASTERS LICENSES, L.P.)
WAOK (1380 AM; 50 kW; ATLANTA, GA; Owner: INFINITY BROADCASTING OPERATIONS, INC.)
WAZX (1550 AM; 50 kW; SMYRNA, GA; Owner: GA-MEX BROADCASTING, INC.)
WFTD (1080 AM; daytime; 50 kW; MARIETTA, GA; Owner: PRIETO ENTERPRISES, INC.)
WDWD (590 AM; 5 kW; ATLANTA, GA; Owner: ABC, INC.)
WSB (750 AM; 50 kW; ATLANTA, GA; Owner: CXR HOLDINGS, INC.)
WGUN (1010 AM; 50 kW; ATLANTA, GA; Owner: WGUN, INC.)
WCNN (680 AM; 50 kW; NORTH ATLANTA, GA; Owner: DICKEY BROADCASTING COMPANY)
WQXI (790 AM; 28 kW; ATLANTA, GA; Owner: JEFFERSON-PILOT COMMUNICATIONS COMPANY OF GEORGIA)
WKNG (1060 AM; daytime; 50 kW; TALLAPOOSA, GA; Owner: WKNG, INC.)
Strongest FM radio stations in Douglasville:
WWWQ (100.5 FM; ANNISTON, AL; Owner: WNNX LICO, INC.)
WNNX (99.7 FM; ATLANTA, GA; Owner: WNNX LICO, INC.)
WRFG (89.3 FM; ATLANTA, GA; Owner: RADIO FREE GEORGIA BROADCASTING FOUNDATION INC)
WKHX-FM (101.5 FM; MARIETTA, GA; Owner: ABC, INC.)
WSB-FM (98.5 FM; ATLANTA, GA; Owner: CXR HOLDINGS, INC.)
WSTR (94.1 FM; SMYRNA, GA; Owner: JEFFERSON-PILOT COMMUNICATIONS COMPANY OF GEORGIA)
WVEE (103.3 FM; ATLANTA, GA; Owner: INFINITY BROADCASTING OPERATIONS, INC.)
WZGC (92.9 FM; ATLANTA, GA; Owner: INFINITY BROADCASTING CORP. OF ATLANTA)
WALR-FM (104.1 FM; LA GRANGE, GA; Owner: CXR HOLDINGS, INC.)
WKLS (96.1 FM; ATLANTA, GA; Owner: CITICASTERS LICENSES, L.P.)
WLTM (94.9 FM; ATLANTA, GA; Owner: CITICASTERS LICENSES, L.P.)
WAMJ (102.5 FM; MABLETON, GA; Owner: NEW MABLETON BROADCASTING CORPORATION)
WHTA (107.9 FM; HAMPTON, GA; Owner: RADIO ONE LICENSES, LLC)
WPZE (97.5 FM; FAYETTEVILLE, GA; Owner: ROA LICENSES, LLC)
WBTR-FM (92.1 FM; CARROLLTON, GA; Owner: WYAI, INC.)
WLCL (105.7 FM; CANTON, GA; Owner: CHEROKEE BROADCASTING CO., INC.)
W214AS (90.7 FM; WALESKA, GA; Owner: CALVARY CHAPEL OF TWIN FALLS, INC.)
W221AW (92.1 FM; NORTH CANTON, GA; Owner: IMMANUEL BROADCASTING NETWORK, INC.)
WCCV (91.7 FM; CARTERSVILLE, GA; Owner: IMMANUEL BROADCASTING NETWORK, INC.)
WBZY-FM (96.7 FM; PEACHTREE CITY, GA; Owner: CITICASTERS LICENSES, L.P.)
TV broadcast stations around Douglasville:
WUVG (Channel 34; ATHENS, GA; Owner: UNIVISION ATLANTA LLC)
WSB-TV (Channel 2; ATLANTA, GA; Owner: WSB-TV HOLDINGS, INC.)
WAGA (Channel 5; ATLANTA, GA; Owner: FOX TELEVISION STATIONS, INC.)
WXIA-TV (Channel 11; ATLANTA, GA; Owner: GANNETT GEORGIA, L.P.)
WHSG (Channel 63; MONROE, GA; Owner: TRINITY BROADCASTING NETWORK)
WANN-LP (Channel 32; ATLANTA, GA; Owner: PRISM BROADCASTING NETWORK, INC.)
WDTA-LP (Channel 53; FAYETTEVILLE, GA; Owner: WORD OF GOD FELLOWSHIP, INC.)
WUPA (Channel 69; ATLANTA, GA; Owner: VIACOM STATIONS GROUP OF ATLANTA INC.)
WATL (Channel 36; ATLANTA, GA; Owner: WATL, LLC)
WTBS (Channel 17; ATLANTA, GA; Owner: SUPERSTATION, INC.)
WGCL-TV (Channel 46; ATLANTA, GA; Owner: MEREDITH CORPORATION)
WTHC-LP (Channel 42; ATLANTA, GA; Owner: THE ATLANTA CHANNEL, INC.)
WPBA (Channel 30; ATLANTA, GA; Owner: BOARD OF EDUCATION OF THE CITY OF ATLANTA)
W04DB (Channel 4; ATLANTA, GA; Owner: VVILPTV, INC.)
WANX-LP (Channel 26; ATLANTA, GA; Owner: PRISM BROADCASTING NETWORK, INC.)
WIRE-CA (Channel 40; ATLANTA, GA; Owner: COMMERCIAL BROADCASTING CORP.)
WSKC-LP (Channel 59; ATLANTA, GA; Owner: KM LPTV OF ATLANTA, L.L.C.)
W24AL (Channel 24; ATLANTA, GA; Owner: VENTANA TELEVISION, INC.)
WATC (Channel 57; ATLANTA, GA; Owner: COMMUNITY TELEVISION, INC.)
WPXA (Channel 14; ROME, GA; Owner: PAXSON ATLANTA LICENSE, INC.)
National Bridge Inventory (NBI) Statistics 66 Number of bridges856ft / 261m Total length $123,805,000 Total costs1,497,712 Total average daily traffic22,120 Total average daily truck traffic
New bridges - historical statistics
1 1940-1949 3 1950-1959 10 1960-1969 11 1970-1979 7 1980-1989 5 1990-1999 9 2000-2009 5 2010-2019 2 2020-2022
See full National Bridge Inventory statistics for Douglasville, GA
Home Mortgage Disclosure Act Aggregated Statistics For Year 2009(Based on 7 partial tracts) A) FHA, FSA/RHS & VA B) Conventional C) Refinancings D) Home Improvement Loans E) Loans on Dwellings For 5+ Families F) Non-occupant Loans on G) Loans On Manufactured Number Average Value Number Average Value Number Average Value Number Average Value Number Average Value Number Average Value Number Average Value
LOANS ORIGINATED 156 $136,703 70 $115,367 311 $153,406 9 $44,242 1 $19,958,780 72 $89,390 1 $21,660 APPLICATIONS APPROVED, NOT ACCEPTED 5 $154,128 4 $103,435 38 $174,875 2 $9,290 0 $0 2 $58,325 0 $0 APPLICATIONS DENIED 32 $129,140 16 $128,027 202 $159,815 26 $31,887 0 $0 18 $111,341 1 $56,550 APPLICATIONS WITHDRAWN 35 $133,741 9 $146,410 115 $167,264 5 $69,248 0 $0 8 $125,774 0 $0 FILES CLOSED FOR INCOMPLETENESS 6 $118,572 1 $132,540 32 $153,714 3 $135,267 0 $0 2 $96,930 0 $0
Aggregated Statistics For Year 2008(Based on 7 partial tracts) A) FHA, FSA/RHS & VA B) Conventional C) Refinancings D) Home Improvement Loans E) Loans on Dwellings For 5+ Families F) Non-occupant Loans on G) Loans On Manufactured Number Average Value Number Average Value Number Average Value Number Average Value Number Average Value Number Average Value Number Average Value
LOANS ORIGINATED 149 $152,332 141 $147,559 297 $142,499 21 $42,566 1 $2,892,600 130 $116,845 3 $17,560 APPLICATIONS APPROVED, NOT ACCEPTED 7 $167,780 19 $172,895 52 $128,423 6 $38,693 0 $0 12 $105,885 1 $77,970 APPLICATIONS DENIED 26 $150,101 36 $150,012 323 $148,496 62 $34,831 0 $0 56 $84,991 7 $18,406 APPLICATIONS WITHDRAWN 32 $143,894 26 $155,838 127 $157,646 4 $122,052 0 $0 14 $116,164 0 $0 FILES CLOSED FOR INCOMPLETENESS 3 $155,317 8 $162,399 27 $165,516 2 $156,180 0 $0 3 $109,233 0 $0
Aggregated Statistics For Year 2007(Based on 7 partial tracts) A) FHA, FSA/RHS & VA B) Conventional C) Refinancings D) Home Improvement Loans E) Loans on Dwellings For 5+ Families F) Non-occupant Loans on G) Loans On Manufactured Number Average Value Number Average Value Number Average Value Number Average Value Number Average Value Number Average Value Number Average Value
LOANS ORIGINATED 84 $160,707 441 $151,538 411 $146,103 49 $53,888 1 $11,287,510 169 $119,025 3 $45,350 APPLICATIONS APPROVED, NOT ACCEPTED 4 $127,850 58 $131,531 97 $138,892 15 $43,913 0 $0 19 $123,027 4 $28,505 APPLICATIONS DENIED 18 $155,149 135 $144,573 526 $155,440 99 $63,646 0 $0 76 $125,958 4 $37,220 APPLICATIONS WITHDRAWN 16 $141,574 84 $169,968 203 $158,554 21 $127,553 0 $0 28 $142,144 0 $0 FILES CLOSED FOR INCOMPLETENESS 2 $116,295 28 $148,302 64 $164,845 4 $88,272 0 $0 9 $145,748 0 $0
Aggregated Statistics For Year 2006(Based on 7 partial tracts) A) FHA, FSA/RHS & VA B) Conventional C) Refinancings D) Home Improvement Loans E) Loans on Dwellings For 5+ Families F) Non-occupant Loans on G) Loans On Manufactured Number Average Value Number Average Value Number Average Value Number Average Value Number Average Value Number Average Value Number Average Value
LOANS ORIGINATED 100 $155,337 847 $128,289 496 $122,266 76 $35,768 5 $395,766 273 $112,459 3 $58,147 APPLICATIONS APPROVED, NOT ACCEPTED 4 $142,970 111 $119,182 105 $118,229 21 $42,892 0 $0 35 $111,120 2 $15,785 APPLICATIONS DENIED 10 $138,165 255 $127,540 481 $135,035 131 $38,636 0 $0 104 $116,259 6 $39,358 APPLICATIONS WITHDRAWN 17 $169,712 185 $146,349 276 $132,012 25 $72,105 0 $0 56 $164,156 0 $0 FILES CLOSED FOR INCOMPLETENESS 1 $193,060 34 $118,946 85 $143,807 1 $81,240 0 $0 8 $139,064 0 $0
Aggregated Statistics For Year 2005(Based on 7 partial tracts) A) FHA, FSA/RHS & VA B) Conventional C) Refinancings D) Home Improvement Loans E) Loans on Dwellings For 5+ Families F) Non-occupant Loans on G) Loans On Manufactured Number Average Value Number Average Value Number Average Value Number Average Value Number Average Value Number Average Value Number Average Value
LOANS ORIGINATED 91 $144,809 750 $114,068 572 $123,397 66 $57,597 1 $392,540 259 $97,293 5 $26,720 APPLICATIONS APPROVED, NOT ACCEPTED 2 $105,035 86 $108,915 104 $127,982 10 $43,902 0 $0 22 $81,061 3 $22,083 APPLICATIONS DENIED 15 $139,284 203 $112,340 465 $132,640 120 $43,750 0 $0 59 $102,515 15 $50,163 APPLICATIONS WITHDRAWN 9 $145,678 142 $126,121 251 $141,285 36 $125,448 0 $0 31 $106,477 2 $41,400 FILES CLOSED FOR INCOMPLETENESS 1 $200,800 37 $124,418 112 $136,257 4 $51,862 0 $0 13 $104,821 0 $0
Aggregated Statistics For Year 2004(Based on 7 partial tracts) A) FHA, FSA/RHS & VA B) Conventional C) Refinancings D) Home Improvement Loans F) Non-occupant Loans on G) Loans On Manufactured Number Average Value Number Average Value Number Average Value Number Average Value Number Average Value Number Average Value
LOANS ORIGINATED 161 $143,245 581 $124,527 549 $122,330 48 $41,547 201 $94,946 4 $32,612 APPLICATIONS APPROVED, NOT ACCEPTED 3 $127,847 60 $140,366 109 $116,690 11 $39,257 15 $92,341 3 $37,113 APPLICATIONS DENIED 18 $140,450 170 $120,777 376 $124,367 76 $42,202 53 $112,175 8 $28,151 APPLICATIONS WITHDRAWN 19 $151,322 66 $142,895 182 $122,495 22 $61,157 20 $122,510 1 $87,320 FILES CLOSED FOR INCOMPLETENESS 2 $128,365 41 $117,283 88 $123,679 7 $41,927 5 $102,548 0 $0
Aggregated Statistics For Year 2003(Based on 7 partial tracts) A) FHA, FSA/RHS & VA B) Conventional C) Refinancings D) Home Improvement Loans F) Non-occupant Loans on Number Average Value Number Average Value Number Average Value Number Average Value Number Average Value
LOANS ORIGINATED 162 $133,054 416 $134,985 986 $123,181 28 $28,601 162 $107,272 APPLICATIONS APPROVED, NOT ACCEPTED 3 $172,327 38 $147,046 110 $114,461 7 $48,433 15 $93,521 APPLICATIONS DENIED 14 $122,859 83 $127,437 285 $118,296 45 $31,382 37 $100,025 APPLICATIONS WITHDRAWN 22 $126,794 43 $143,931 156 $113,492 6 $25,582 17 $95,839 FILES CLOSED FOR INCOMPLETENESS 1 $144,510 19 $135,207 50 $117,027 3 $50,520 2 $92,430
Aggregated Statistics For Year 2002(Based on 3 partial tracts) A) FHA, FSA/RHS & VA B) Conventional C) Refinancings D) Home Improvement Loans F) Non-occupant Loans on Number Average Value Number Average Value Number Average Value Number Average Value Number Average Value
LOANS ORIGINATED 42 $131,129 146 $154,514 338 $130,793 20 $36,464 37 $89,519 APPLICATIONS APPROVED, NOT ACCEPTED 1 $112,000 9 $122,908 45 $110,578 4 $32,500 2 $101,500 APPLICATIONS DENIED 4 $111,688 20 $148,608 100 $117,928 24 $28,990 8 $95,494 APPLICATIONS WITHDRAWN 2 $142,600 14 $144,349 74 $110,618 4 $13,992 3 $75,947 FILES CLOSED FOR INCOMPLETENESS 1 $124,130 3 $140,267 33 $122,214 1 $4,400 1 $90,170
Aggregated Statistics For Year 2001(Based on 3 partial tracts) A) FHA, FSA/RHS & VA B) Conventional C) Refinancings D) Home Improvement Loans F) Non-occupant Loans on Number Average Value Number Average Value Number Average Value Number Average Value Number Average Value
LOANS ORIGINATED 49 $119,499 131 $149,598 293 $122,272 20 $20,960 26 $99,230 APPLICATIONS APPROVED, NOT ACCEPTED 0 $0 8 $145,430 27 $113,795 5 $32,060 2 $107,215 APPLICATIONS DENIED 2 $100,135 21 $116,321 103 $97,730 17 $18,615 4 $71,100 APPLICATIONS WITHDRAWN 2 $101,610 9 $112,873 55 $100,987 4 $19,182 2 $106,305 FILES CLOSED FOR INCOMPLETENESS 0 $0 2 $111,560 15 $113,727 2 $41,985 0 $0
Aggregated Statistics For Year 2000(Based on 3 partial tracts) A) FHA, FSA/RHS & VA B) Conventional C) Refinancings D) Home Improvement Loans F) Non-occupant Loans on Number Average Value Number Average Value Number Average Value Number Average Value Number Average Value
LOANS ORIGINATED 50 $113,854 101 $130,613 88 $98,917 15 $23,277 12 $81,700 APPLICATIONS APPROVED, NOT ACCEPTED 2 $95,415 13 $105,141 21 $85,819 11 $34,775 0 $0 APPLICATIONS DENIED 6 $98,988 33 $82,040 79 $91,074 23 $21,536 5 $58,430 APPLICATIONS WITHDRAWN 4 $109,765 17 $98,172 42 $80,158 3 $40,163 1 $78,260 FILES CLOSED FOR INCOMPLETENESS 0 $0 4 $112,422 19 $96,405 0 $0 0 $0
Aggregated Statistics For Year 1999(Based on 5 partial tracts) A) FHA, FSA/RHS & VA B) Conventional C) Refinancings D) Home Improvement Loans F) Non-occupant Loans on Number Average Value Number Average Value Number Average Value Number Average Value Number Average Value
LOANS ORIGINATED 162 $98,956 265 $102,508 280 $82,623 30 $16,771 43 $67,743 APPLICATIONS APPROVED, NOT ACCEPTED 3 $107,843 46 $59,702 67 $65,182 23 $19,886 6 $74,647 APPLICATIONS DENIED 20 $90,076 248 $46,052 170 $64,851 64 $17,759 14 $63,631 APPLICATIONS WITHDRAWN 10 $96,283 35 $94,241 109 $78,126 8 $60,130 4 $53,870 FILES CLOSED FOR INCOMPLETENESS 1 $95,380 7 $98,900 29 $84,925 2 $21,405 0 $0
Detailed HMDA statistics for the following Tracts:
0801.01
, 0803.01 , 0803.02 , 0805.03 , 0805.05 , 0806.01 , 0806.02
Private Mortgage Insurance Companies Aggregated Statistics For Year 2009(Based on 7 partial tracts) A) Conventional B) Refinancings C) Non-occupant Loans on Number Average Value Number Average Value Number Average Value
LOANS ORIGINATED 10 $167,411 7 $161,777 0 $0 APPLICATIONS APPROVED, NOT ACCEPTED 5 $186,952 5 $183,998 0 $0 APPLICATIONS DENIED 2 $211,090 2 $137,090 0 $0 APPLICATIONS WITHDRAWN 3 $77,927 1 $200,910 1 $146,700 FILES CLOSED FOR INCOMPLETENESS 1 $172,610 0 $0 0 $0
Aggregated Statistics For Year 2008(Based on 7 partial tracts) A) Conventional B) Refinancings C) Non-occupant Loans on Number Average Value Number Average Value Number Average Value
LOANS ORIGINATED 61 $159,037 34 $154,419 19 $103,261 APPLICATIONS APPROVED, NOT ACCEPTED 22 $176,523 34 $203,691 7 $129,459 APPLICATIONS DENIED 5 $171,780 4 $155,570 3 $140,083 APPLICATIONS WITHDRAWN 3 $177,410 3 $103,873 2 $61,650 FILES CLOSED FOR INCOMPLETENESS 2 $143,060 4 $186,400 2 $158,000
Aggregated Statistics For Year 2007(Based on 7 partial tracts) A) Conventional B) Refinancings C) Non-occupant Loans on Number Average Value Number Average Value Number Average Value
LOANS ORIGINATED 177 $168,112 61 $174,417 30 $132,460 APPLICATIONS APPROVED, NOT ACCEPTED 19 $205,022 14 $155,642 4 $200,432 APPLICATIONS DENIED 6 $161,045 0 $0 0 $0 APPLICATIONS WITHDRAWN 6 $161,400 6 $172,860 3 $87,460 FILES CLOSED FOR INCOMPLETENESS 1 $124,160 1 $131,480 0 $0
Aggregated Statistics For Year 2006(Based on 7 partial tracts) A) Conventional B) Refinancings C) Non-occupant Loans on Number Average Value Number Average Value Number Average Value
LOANS ORIGINATED 108 $159,902 39 $162,549 25 $137,255 APPLICATIONS APPROVED, NOT ACCEPTED 5 $180,244 11 $169,310 2 $122,370 APPLICATIONS DENIED 3 $201,920 0 $0 2 $211,365 APPLICATIONS WITHDRAWN 4 $168,645 3 $155,410 1 $247,780 FILES CLOSED FOR INCOMPLETENESS 1 $91,660 0 $0 0 $0
Aggregated Statistics For Year 2005(Based on 7 partial tracts) A) Conventional B) Refinancings C) Non-occupant Loans on Number Average Value Number Average Value Number Average Value
LOANS ORIGINATED 64 $159,019 62 $136,074 34 $112,024 APPLICATIONS APPROVED, NOT ACCEPTED 11 $156,335 11 $169,184 2 $119,205 APPLICATIONS DENIED 1 $92,540 1 $239,120 0 $0 APPLICATIONS WITHDRAWN 4 $182,062 5 $124,322 1 $139,090 FILES CLOSED FOR INCOMPLETENESS 1 $184,000 0 $0 0 $0
Aggregated Statistics For Year 2004(Based on 7 partial tracts) A) Conventional B) Refinancings C) Non-occupant Loans on Number Average Value Number Average Value Number Average Value
LOANS ORIGINATED 100 $138,426 64 $139,459 33 $103,882 APPLICATIONS APPROVED, NOT ACCEPTED 17 $126,706 15 $133,637 5 $95,856 APPLICATIONS DENIED 2 $127,940 3 $120,753 4 $121,668 APPLICATIONS WITHDRAWN 5 $182,750 8 $125,668 2 $108,130 FILES CLOSED FOR INCOMPLETENESS 0 $0 1 $127,080 0 $0
Aggregated Statistics For Year 2003(Based on 7 partial tracts) A) Conventional B) Refinancings C) Non-occupant Loans on Number Average Value Number Average Value Number Average Value
LOANS ORIGINATED 106 $150,898 136 $133,145 28 $100,219 APPLICATIONS APPROVED, NOT ACCEPTED 18 $140,161 24 $142,530 7 $100,247 APPLICATIONS DENIED 2 $146,570 3 $141,650 0 $0 APPLICATIONS WITHDRAWN 8 $133,720 12 $125,882 1 $121,900 FILES CLOSED FOR INCOMPLETENESS 0 $0 0 $0 0 $0
Aggregated Statistics For Year 2002(Based on 3 partial tracts) A) Conventional B) Refinancings C) Non-occupant Loans on Number Average Value Number Average Value Number Average Value
LOANS ORIGINATED 50 $155,417 53 $158,192 8 $88,119 APPLICATIONS APPROVED, NOT ACCEPTED 9 $151,342 8 $138,134 3 $82,060 APPLICATIONS DENIED 1 $103,100 1 $147,450 0 $0 APPLICATIONS WITHDRAWN 0 $0 3 $145,463 0 $0 FILES CLOSED FOR INCOMPLETENESS 0 $0 0 $0 0 $0
Aggregated Statistics For Year 2001(Based on 3 partial tracts) A) Conventional B) Refinancings C) Non-occupant Loans on Number Average Value Number Average Value Number Average Value
LOANS ORIGINATED 42 $170,880 36 $154,098 3 $151,273 APPLICATIONS APPROVED, NOT ACCEPTED 5 $176,386 7 $143,099 2 $101,750 APPLICATIONS DENIED 0 $0 2 $171,010 1 $87,900 APPLICATIONS WITHDRAWN 1 $122,870 1 $187,390 0 $0 FILES CLOSED FOR INCOMPLETENESS 0 $0 0 $0 0 $0
Aggregated Statistics For Year 2000(Based on 3 partial tracts) A) Conventional B) Refinancings C) Non-occupant Loans on Number Average Value Number Average Value Number Average Value
LOANS ORIGINATED 34 $140,331 10 $139,066 3 $85,270 APPLICATIONS APPROVED, NOT ACCEPTED 4 $116,188 2 $150,240 1 $66,550 APPLICATIONS DENIED 1 $217,770 0 $0 0 $0 APPLICATIONS WITHDRAWN 1 $109,280 0 $0 0 $0 FILES CLOSED FOR INCOMPLETENESS 0 $0 0 $0 0 $0
Aggregated Statistics For Year 1999(Based on 5 partial tracts) A) Conventional B) Refinancings C) Non-occupant Loans on Number Average Value Number Average Value Number Average Value
LOANS ORIGINATED 85 $114,965 26 $103,380 11 $72,648 APPLICATIONS APPROVED, NOT ACCEPTED 6 $125,487 5 $121,358 2 $37,550 APPLICATIONS DENIED 4 $104,600 2 $81,305 1 $105,830 APPLICATIONS WITHDRAWN 2 $127,845 1 $193,120 0 $0 FILES CLOSED FOR INCOMPLETENESS 1 $51,700 1 $131,980 0 $0
Detailed PMIC statistics for the following Tracts:
0801.01
, 0803.01 , 0803.02 , 0805.03 , 0805.05 , 0806.01 , 0806.02 Fire-safe hotels and motels in Douglasville, Georgia:
Holiday Inn Express Atlanta West, 7101 Concourse Pkwy, Douglasville, Georgia 30134 Phone: (770) 920-9228, Fax: (770) 920-9482
Sleep Inn, 7055 Concourse Pkwy, Douglasville, Georgia 30134 Phone: (770) 920-8887, Fax: (770) 920-8803
In Town Suites Atlanta West, 5820 Plaza Pkwy, Douglasville, Georgia 30135 Phone: (770) 920-5252, Fax: (770) 947-8092
Comfort Inn, 5487 Westmoreland Plz, Douglasville, Georgia 30134 Phone: (678) 504-2000, Fax: (678) 504-2001
Holiday Inn Express, 5479 Westmoreland Plz, Douglasville, Georgia 30134 Phone: (770) 949-5730, Fax: (770) 949-2619
Americas Best Value Inn, 5481 Westmoreland Plz, Douglasville, Georgia 30134 Phone: (770) 949-4926, Fax: (770) 489-8305
Econo Lodge Inn & Suites, 8304 Cherokee Blvd, Douglasville, Georgia 30134 Phone: (770) 489-4863, Fax: (770) 489-7689
La Quinta Inns & Suites, 1000 Linnenkohl Dr, Douglasville, Georgia 30134 Phone: (866) 577-3838, Fax: (770) 577-2731
All 8 fire-safe hotels and motels in Douglasville, Georgia
Most common first names in Douglasville, GA among deceased individuals Name Count Lived (average)
James 327 70.8 years William 264 71.9 years John 236 71.0 years Mary 229 77.2 years Robert 163 69.0 years Charles 129 67.8 years George 93 72.2 years Annie 92 79.0 years Thomas 89 69.2 years Willie 77 75.4 years
Most common last names in Douglasville, GA among deceased individuals Last name Count Lived (average)
Smith 166 71.2 years Brown 84 74.6 years Williams 76 71.8 years Davis 73 73.6 years Johnson 65 70.1 years White 61 70.5 years Morris 58 72.7 years Jones 57 74.2 years Wilson 46 72.9 years Jackson 44 69.7 years
Douglasville compared to Georgia state average:
Unemployed percentage below state average. Black race population percentage significantly above state average. Median age below state average. Foreign-born population percentage above state average. Renting percentage above state average. House age below state average. Number of college students above state average. Percentage of population with a bachelor's degree or higher above state average. Douglasville on our top lists :
#10 on the list of "Top 101 cities with largest percentage of females in industries: transportation and warehousing (population 5,000+)"
#44 on the list of "Top 101 cities with the highest number of thefts per 100,000 residents, excludes tourist destinations and others with a lot of outsiders visiting based on city industries data (population 5,000+)"
#85 on the list of "Top 101 cities with the most residents born in Ghana (population 500+)"
#86 on the list of "Top 101 cities with the highest number of auto thefts per 100,000 residents, excludes tourist destinations and others with a lot of outsiders visiting based on city industries data (population 5,000+)"
#29 (30122) on the list of "Top 101 zip codes with the lowest 2012 average reported profit/loss from business (pop 5,000+)"
#33 on the list of "Top 101 counties with the lowest ground withdrawal of fresh water for public supply (pop. 50,000+)"
#80 on the list of "Top 101 counties with the highest percentage of residents relocating to other counties in 2011"
#91 on the list of "Top 101 counties with the highest percentage of residents relocating from other counties between 2010 and 2011"
Top Patent Applicants
Kenneth E. Flick (34)
Scott Rosencrance (23)
Michael Powell (13)
John W. Facemire (12)
Yaacov Ben-Yaacov (12)
Dwight Ringdahl (12)
John Richard Muse (11)
Boaz Ben-Yaacov (10)
Louis Mattos, Jr. (10)
Philip Sasse (9)
Total of 338 patent applications in 2008-2024.


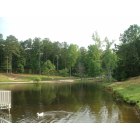

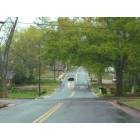

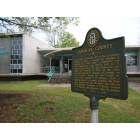


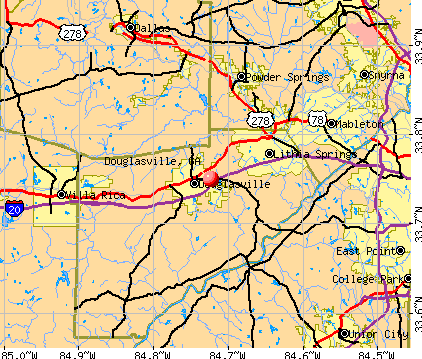


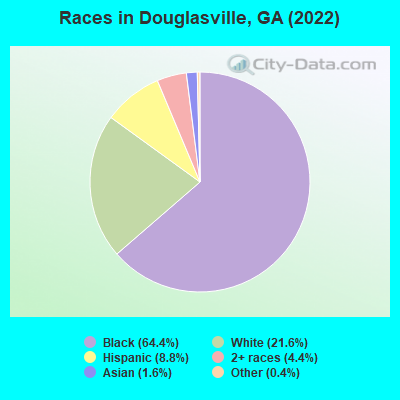
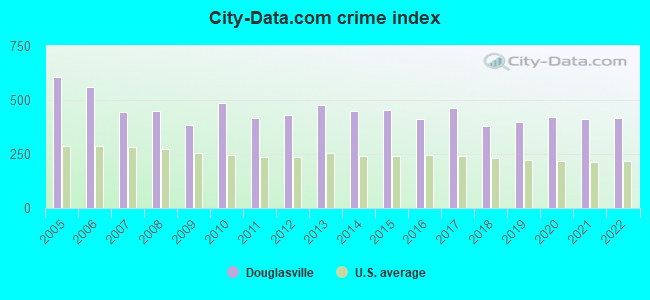
 Recent articles from our blog. Our writers, many of them Ph.D. graduates or candidates, create easy-to-read articles on a wide variety of topics.


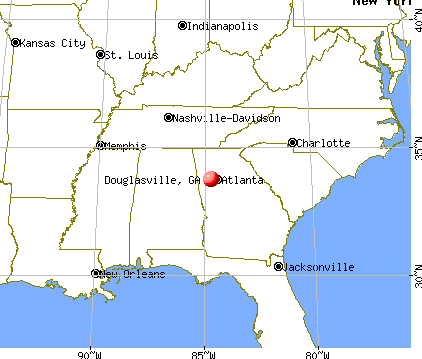
 (17.6 miles
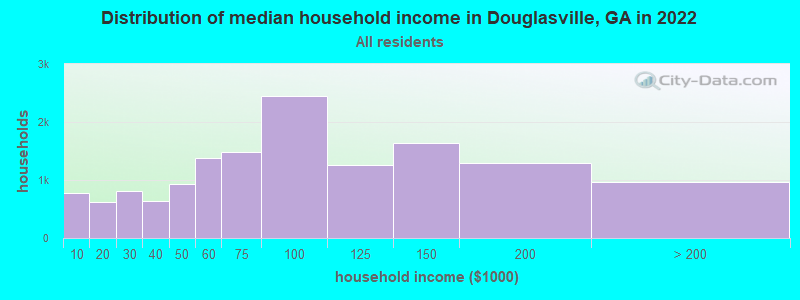
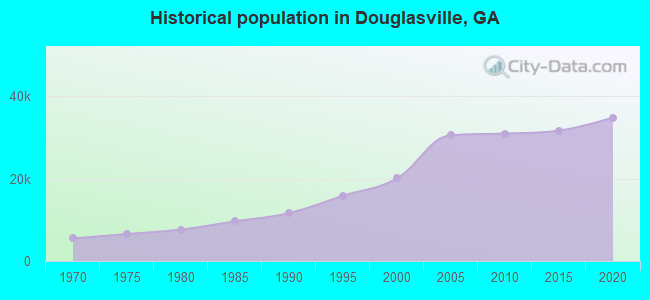
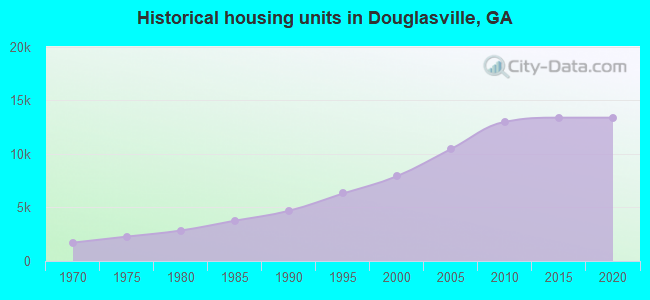
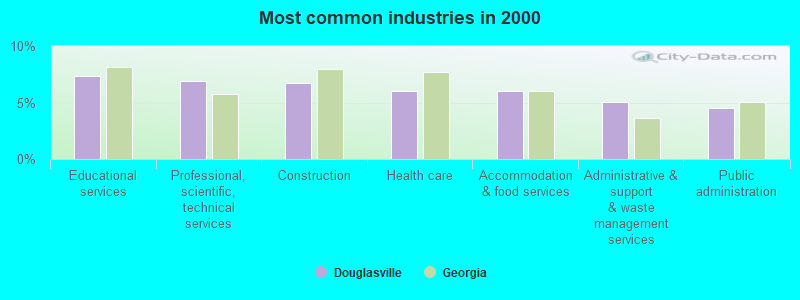
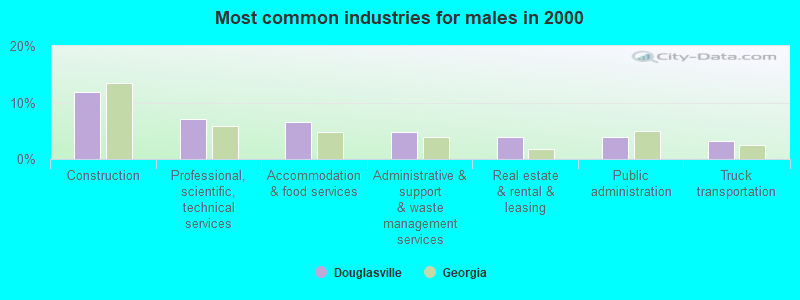
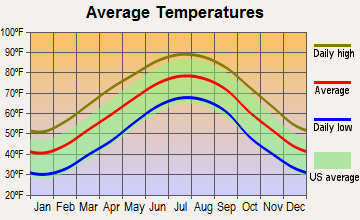
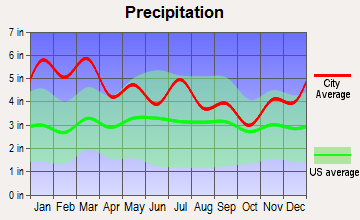
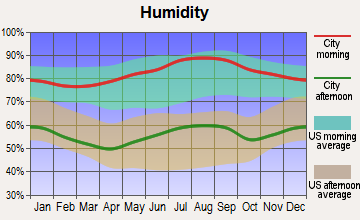
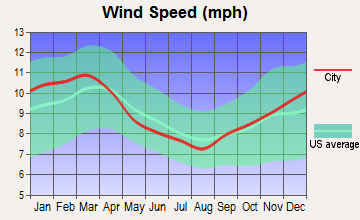
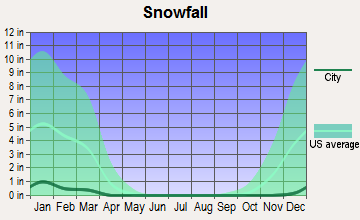
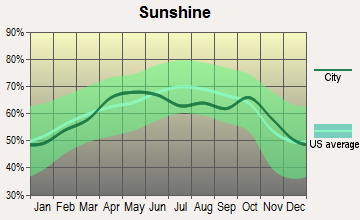
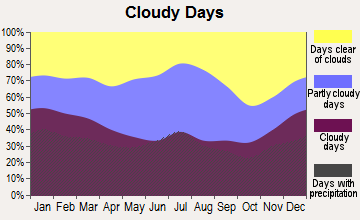
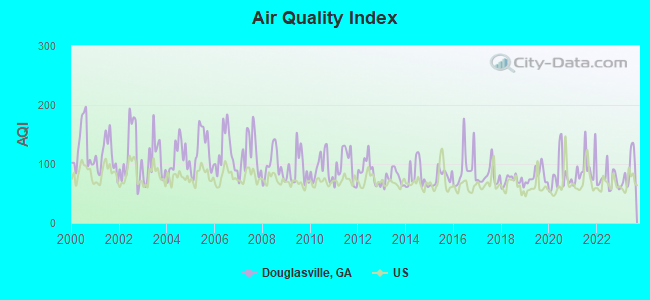
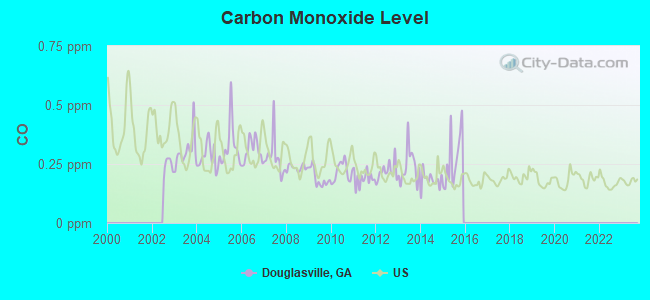
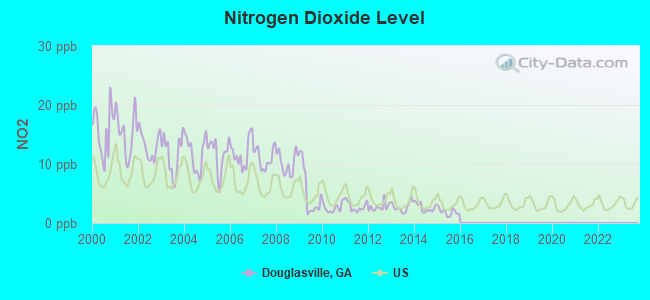
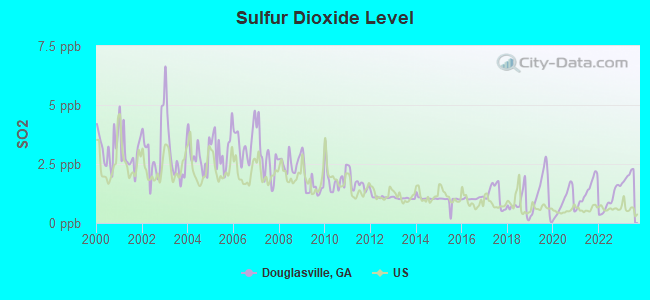
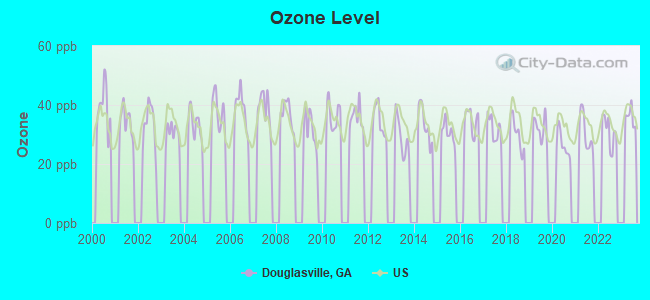
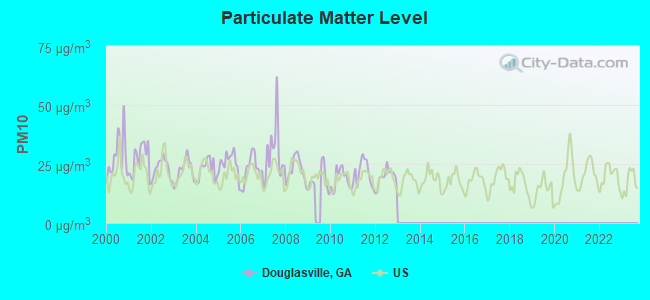
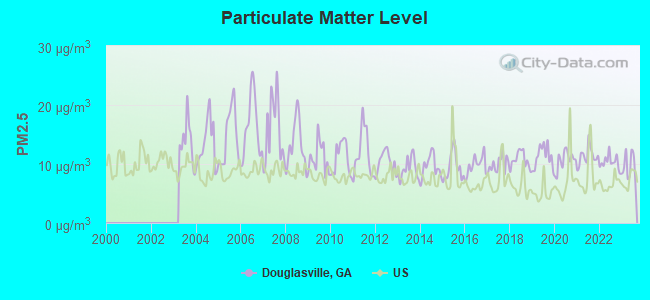
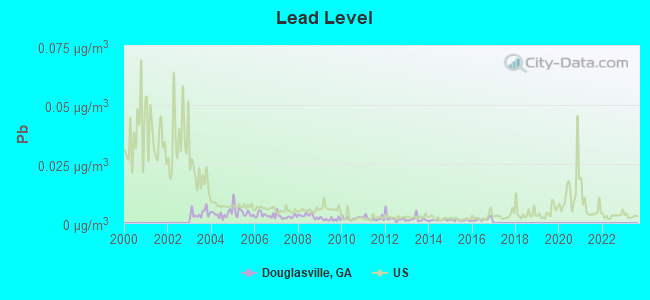

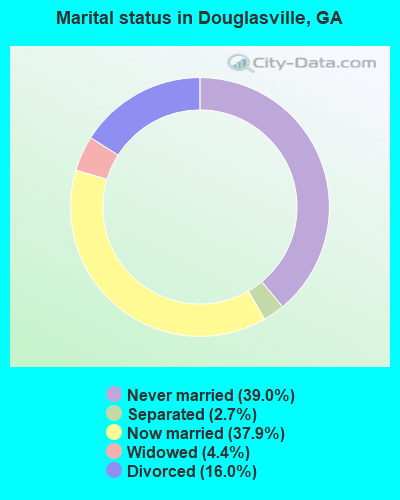
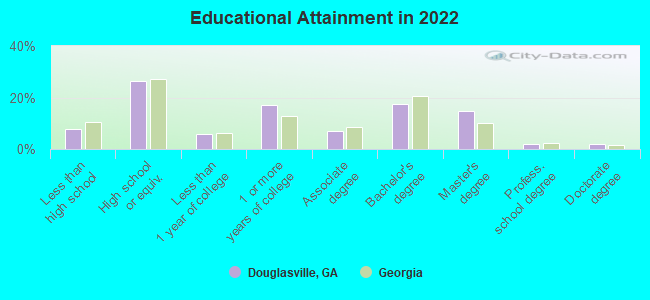
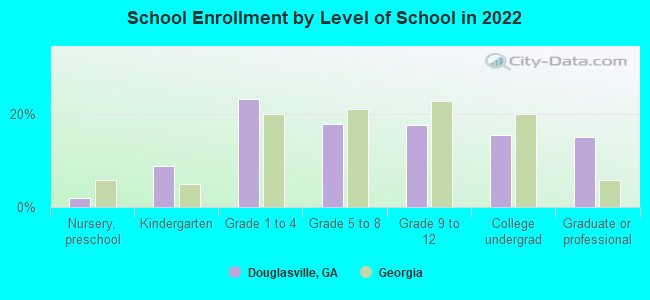
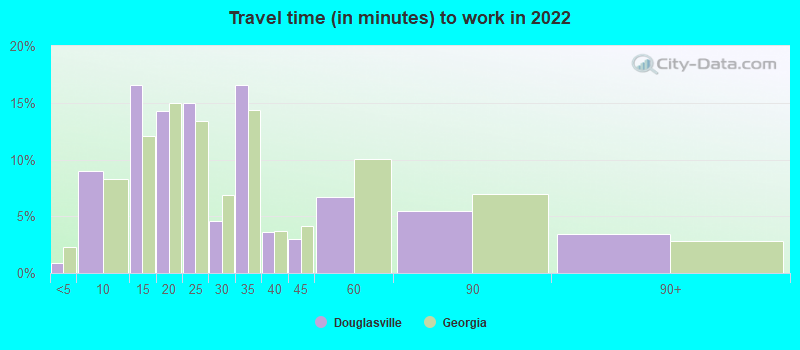
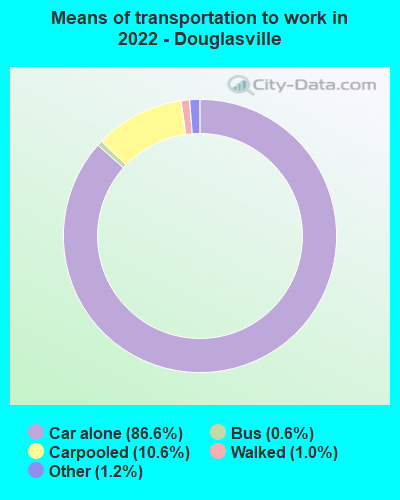
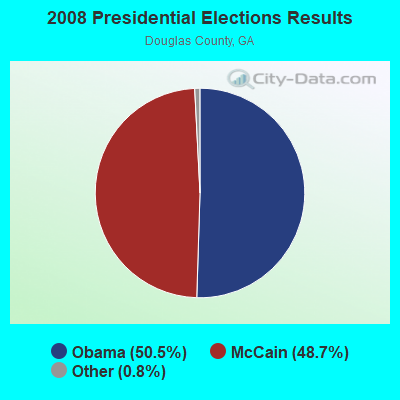

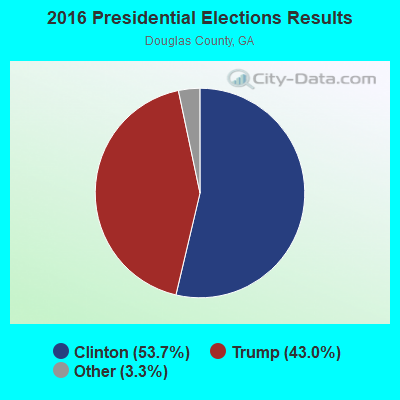
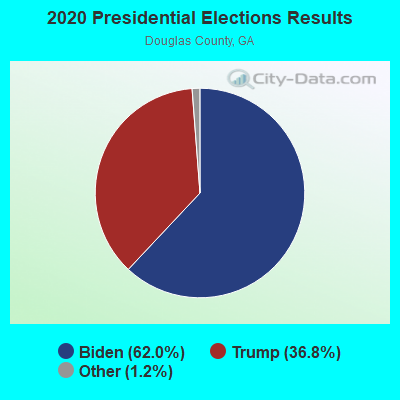
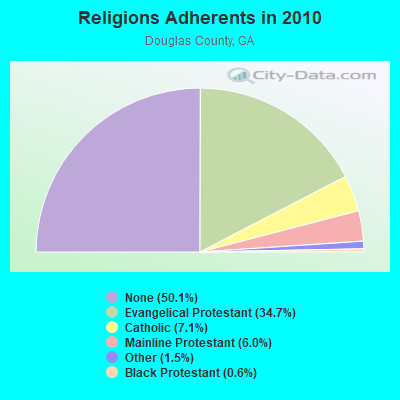
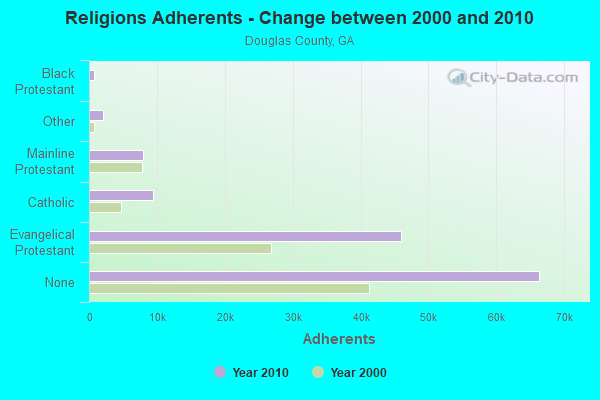
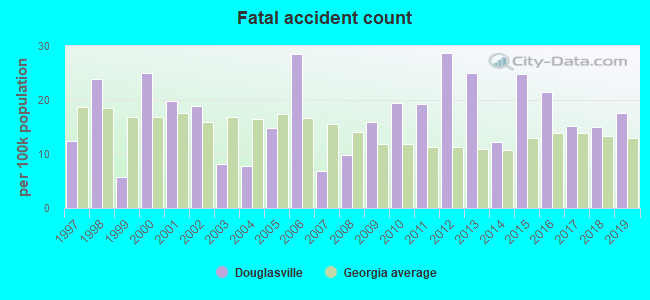
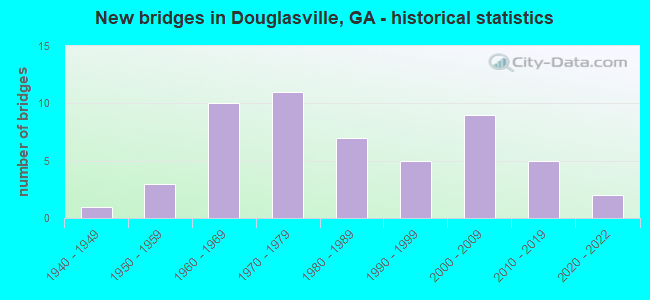
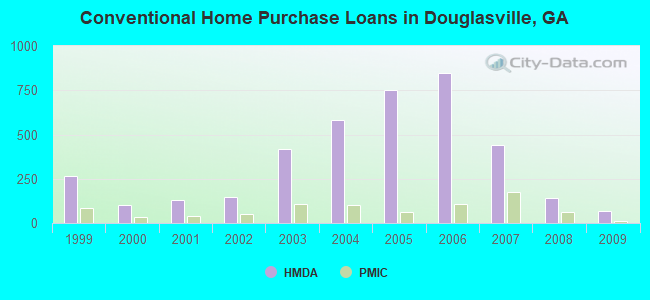
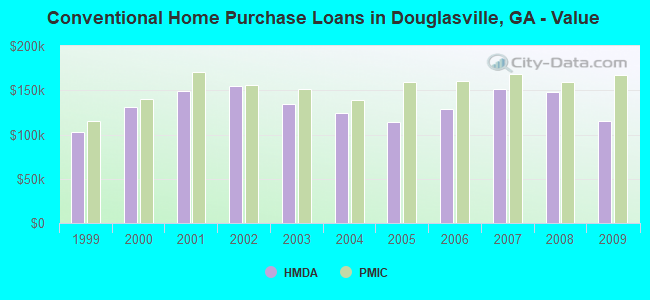
 According to the data from the years 2002 - 2018 the average number of fire incidents per year is 294. The highest number of fire incidents - 486 took place in 2007, and the least - 94 in 2018. The data has a decreasing trend.
 When looking into fire subcategories, the most reports belonged to: Outside Fires (45.1%), and Structure Fires (32.3%).