Gaithersburg, Maryland Submit your own pictures of this city and show them to the world
OSM Map
General Map
Google Map
MSN Map
OSM Map
General Map
Google Map
MSN Map
OSM Map
General Map
Google Map
MSN Map
OSM Map
General Map
Google Map
MSN Map
Please wait while loading the map...
Population in 2022: 68,952 (100% urban, 0% rural). Population change since 2000: +31.1%Males: 33,084 Females: 35,868
March 2022 cost of living index in Gaithersburg: 178.6 (very high, U.S. average is 100) Percentage of residents living in poverty in 2022: 5.9%for White Non-Hispanic residents , 18.3% for Black residents , 11.6% for Hispanic or Latino residents , 5.3% for American Indian residents , 16.2% for other race residents , 6.9% for two or more races residents )
Profiles of local businesses
Business Search - 14 Million verified businesses
Data:
Median household income ($)
Median household income (% change since 2000)
Household income diversity
Ratio of average income to average house value (%)
Ratio of average income to average rent
Median household income ($) - White
Median household income ($) - Black or African American
Median household income ($) - Asian
Median household income ($) - Hispanic or Latino
Median household income ($) - American Indian and Alaska Native
Median household income ($) - Multirace
Median household income ($) - Other Race
Median household income for houses/condos with a mortgage ($)
Median household income for apartments without a mortgage ($)
Races - White alone (%)
Races - White alone (% change since 2000)
Races - Black alone (%)
Races - Black alone (% change since 2000)
Races - American Indian alone (%)
Races - American Indian alone (% change since 2000)
Races - Asian alone (%)
Races - Asian alone (% change since 2000)
Races - Hispanic (%)
Races - Hispanic (% change since 2000)
Races - Native Hawaiian and Other Pacific Islander alone (%)
Races - Native Hawaiian and Other Pacific Islander alone (% change since 2000)
Races - Two or more races (%)
Races - Two or more races (% change since 2000)
Races - Other race alone (%)
Races - Other race alone (% change since 2000)
Racial diversity
Unemployment (%)
Unemployment (% change since 2000)
Unemployment (%) - White
Unemployment (%) - Black or African American
Unemployment (%) - Asian
Unemployment (%) - Hispanic or Latino
Unemployment (%) - American Indian and Alaska Native
Unemployment (%) - Multirace
Unemployment (%) - Other Race
Population density (people per square mile)
Population - Males (%)
Population - Females (%)
Population - Males (%) - White
Population - Males (%) - Black or African American
Population - Males (%) - Asian
Population - Males (%) - Hispanic or Latino
Population - Males (%) - American Indian and Alaska Native
Population - Males (%) - Multirace
Population - Males (%) - Other Race
Population - Females (%) - White
Population - Females (%) - Black or African American
Population - Females (%) - Asian
Population - Females (%) - Hispanic or Latino
Population - Females (%) - American Indian and Alaska Native
Population - Females (%) - Multirace
Population - Females (%) - Other Race
Coronavirus confirmed cases (Apr 26, 2024)
Deaths caused by coronavirus (Apr 26, 2024)
Coronavirus confirmed cases (per 100k population) (Apr 26, 2024)
Deaths caused by coronavirus (per 100k population) (Apr 26, 2024)
Daily increase in number of cases (Apr 26, 2024)
Weekly increase in number of cases (Apr 26, 2024)
Cases doubled (in days) (Apr 26, 2024)
Hospitalized patients (Apr 18, 2022)
Negative test results (Apr 18, 2022)
Total test results (Apr 18, 2022)
COVID Vaccine doses distributed (per 100k population) (Sep 19, 2023)
COVID Vaccine doses administered (per 100k population) (Sep 19, 2023)
COVID Vaccine doses distributed (Sep 19, 2023)
COVID Vaccine doses administered (Sep 19, 2023)
Likely homosexual households (%)
Likely homosexual households (% change since 2000)
Likely homosexual households - Lesbian couples (%)
Likely homosexual households - Lesbian couples (% change since 2000)
Likely homosexual households - Gay men (%)
Likely homosexual households - Gay men (% change since 2000)
Cost of living index
Median gross rent ($)
Median contract rent ($)
Median monthly housing costs ($)
Median house or condo value ($)
Median house or condo value ($ change since 2000)
Mean house or condo value by units in structure - 1, detached ($)
Mean house or condo value by units in structure - 1, attached ($)
Mean house or condo value by units in structure - 2 ($)
Mean house or condo value by units in structure by units in structure - 3 or 4 ($)
Mean house or condo value by units in structure - 5 or more ($)
Mean house or condo value by units in structure - Boat, RV, van, etc. ($)
Mean house or condo value by units in structure - Mobile home ($)
Median house or condo value ($) - White
Median house or condo value ($) - Black or African American
Median house or condo value ($) - Asian
Median house or condo value ($) - Hispanic or Latino
Median house or condo value ($) - American Indian and Alaska Native
Median house or condo value ($) - Multirace
Median house or condo value ($) - Other Race
Median resident age
Resident age diversity
Median resident age - Males
Median resident age - Females
Median resident age - White
Median resident age - Black or African American
Median resident age - Asian
Median resident age - Hispanic or Latino
Median resident age - American Indian and Alaska Native
Median resident age - Multirace
Median resident age - Other Race
Median resident age - Males - White
Median resident age - Males - Black or African American
Median resident age - Males - Asian
Median resident age - Males - Hispanic or Latino
Median resident age - Males - American Indian and Alaska Native
Median resident age - Males - Multirace
Median resident age - Males - Other Race
Median resident age - Females - White
Median resident age - Females - Black or African American
Median resident age - Females - Asian
Median resident age - Females - Hispanic or Latino
Median resident age - Females - American Indian and Alaska Native
Median resident age - Females - Multirace
Median resident age - Females - Other Race
Commute - mean travel time to work (minutes)
Travel time to work - Less than 5 minutes (%)
Travel time to work - Less than 5 minutes (% change since 2000)
Travel time to work - 5 to 9 minutes (%)
Travel time to work - 5 to 9 minutes (% change since 2000)
Travel time to work - 10 to 19 minutes (%)
Travel time to work - 10 to 19 minutes (% change since 2000)
Travel time to work - 20 to 29 minutes (%)
Travel time to work - 20 to 29 minutes (% change since 2000)
Travel time to work - 30 to 39 minutes (%)
Travel time to work - 30 to 39 minutes (% change since 2000)
Travel time to work - 40 to 59 minutes (%)
Travel time to work - 40 to 59 minutes (% change since 2000)
Travel time to work - 60 to 89 minutes (%)
Travel time to work - 60 to 89 minutes (% change since 2000)
Travel time to work - 90 or more minutes (%)
Travel time to work - 90 or more minutes (% change since 2000)
Marital status - Never married (%)
Marital status - Now married (%)
Marital status - Separated (%)
Marital status - Widowed (%)
Marital status - Divorced (%)
Median family income ($)
Median family income (% change since 2000)
Median non-family income ($)
Median non-family income (% change since 2000)
Median per capita income ($)
Median per capita income (% change since 2000)
Median family income ($) - White
Median family income ($) - Black or African American
Median family income ($) - Asian
Median family income ($) - Hispanic or Latino
Median family income ($) - American Indian and Alaska Native
Median family income ($) - Multirace
Median family income ($) - Other Race
Median year house/condo built
Median year apartment built
Year house built - Built 2005 or later (%)
Year house built - Built 2000 to 2004 (%)
Year house built - Built 1990 to 1999 (%)
Year house built - Built 1980 to 1989 (%)
Year house built - Built 1970 to 1979 (%)
Year house built - Built 1960 to 1969 (%)
Year house built - Built 1950 to 1959 (%)
Year house built - Built 1940 to 1949 (%)
Year house built - Built 1939 or earlier (%)
Average household size
Household density (households per square mile)
Average household size - White
Average household size - Black or African American
Average household size - Asian
Average household size - Hispanic or Latino
Average household size - American Indian and Alaska Native
Average household size - Multirace
Average household size - Other Race
Occupied housing units (%)
Vacant housing units (%)
Owner occupied housing units (%)
Renter occupied housing units (%)
Vacancy status - For rent (%)
Vacancy status - For sale only (%)
Vacancy status - Rented or sold, not occupied (%)
Vacancy status - For seasonal, recreational, or occasional use (%)
Vacancy status - For migrant workers (%)
Vacancy status - Other vacant (%)
Residents with income below the poverty level (%)
Residents with income below 50% of the poverty level (%)
Children below poverty level (%)
Poor families by family type - Married-couple family (%)
Poor families by family type - Male, no wife present (%)
Poor families by family type - Female, no husband present (%)
Poverty status for native-born residents (%)
Poverty status for foreign-born residents (%)
Poverty among high school graduates not in families (%)
Poverty among people who did not graduate high school not in families (%)
Residents with income below the poverty level (%) - White
Residents with income below the poverty level (%) - Black or African American
Residents with income below the poverty level (%) - Asian
Residents with income below the poverty level (%) - Hispanic or Latino
Residents with income below the poverty level (%) - American Indian and Alaska Native
Residents with income below the poverty level (%) - Multirace
Residents with income below the poverty level (%) - Other Race
Air pollution - Air Quality Index (AQI)
Air pollution - CO
Air pollution - NO2
Air pollution - SO2
Air pollution - Ozone
Air pollution - PM10
Air pollution - PM25
Air pollution - Pb
Crime - Murders per 100,000 population
Crime - Rapes per 100,000 population
Crime - Robberies per 100,000 population
Crime - Assaults per 100,000 population
Crime - Burglaries per 100,000 population
Crime - Thefts per 100,000 population
Crime - Auto thefts per 100,000 population
Crime - Arson per 100,000 population
Crime - City-data.com crime index
Crime - Violent crime index
Crime - Property crime index
Crime - Murders per 100,000 population (5 year average)
Crime - Rapes per 100,000 population (5 year average)
Crime - Robberies per 100,000 population (5 year average)
Crime - Assaults per 100,000 population (5 year average)
Crime - Burglaries per 100,000 population (5 year average)
Crime - Thefts per 100,000 population (5 year average)
Crime - Auto thefts per 100,000 population (5 year average)
Crime - Arson per 100,000 population (5 year average)
Crime - City-data.com crime index (5 year average)
Crime - Violent crime index (5 year average)
Crime - Property crime index (5 year average)
1996 Presidential Elections Results (%) - Democratic Party (Clinton)
1996 Presidential Elections Results (%) - Republican Party (Dole)
1996 Presidential Elections Results (%) - Other
2000 Presidential Elections Results (%) - Democratic Party (Gore)
2000 Presidential Elections Results (%) - Republican Party (Bush)
2000 Presidential Elections Results (%) - Other
2004 Presidential Elections Results (%) - Democratic Party (Kerry)
2004 Presidential Elections Results (%) - Republican Party (Bush)
2004 Presidential Elections Results (%) - Other
2008 Presidential Elections Results (%) - Democratic Party (Obama)
2008 Presidential Elections Results (%) - Republican Party (McCain)
2008 Presidential Elections Results (%) - Other
2012 Presidential Elections Results (%) - Democratic Party (Obama)
2012 Presidential Elections Results (%) - Republican Party (Romney)
2012 Presidential Elections Results (%) - Other
2016 Presidential Elections Results (%) - Democratic Party (Clinton)
2016 Presidential Elections Results (%) - Republican Party (Trump)
2016 Presidential Elections Results (%) - Other
2020 Presidential Elections Results (%) - Democratic Party (Biden)
2020 Presidential Elections Results (%) - Republican Party (Trump)
2020 Presidential Elections Results (%) - Other
Ancestries Reported - Arab (%)
Ancestries Reported - Czech (%)
Ancestries Reported - Danish (%)
Ancestries Reported - Dutch (%)
Ancestries Reported - English (%)
Ancestries Reported - French (%)
Ancestries Reported - French Canadian (%)
Ancestries Reported - German (%)
Ancestries Reported - Greek (%)
Ancestries Reported - Hungarian (%)
Ancestries Reported - Irish (%)
Ancestries Reported - Italian (%)
Ancestries Reported - Lithuanian (%)
Ancestries Reported - Norwegian (%)
Ancestries Reported - Polish (%)
Ancestries Reported - Portuguese (%)
Ancestries Reported - Russian (%)
Ancestries Reported - Scotch-Irish (%)
Ancestries Reported - Scottish (%)
Ancestries Reported - Slovak (%)
Ancestries Reported - Subsaharan African (%)
Ancestries Reported - Swedish (%)
Ancestries Reported - Swiss (%)
Ancestries Reported - Ukrainian (%)
Ancestries Reported - United States (%)
Ancestries Reported - Welsh (%)
Ancestries Reported - West Indian (%)
Ancestries Reported - Other (%)
Educational Attainment - No schooling completed (%)
Educational Attainment - Less than high school (%)
Educational Attainment - High school or equivalent (%)
Educational Attainment - Less than 1 year of college (%)
Educational Attainment - 1 or more years of college (%)
Educational Attainment - Associate degree (%)
Educational Attainment - Bachelor's degree (%)
Educational Attainment - Master's degree (%)
Educational Attainment - Professional school degree (%)
Educational Attainment - Doctorate degree (%)
School Enrollment - Nursery, preschool (%)
School Enrollment - Kindergarten (%)
School Enrollment - Grade 1 to 4 (%)
School Enrollment - Grade 5 to 8 (%)
School Enrollment - Grade 9 to 12 (%)
School Enrollment - College undergrad (%)
School Enrollment - Graduate or professional (%)
School Enrollment - Not enrolled in school (%)
School enrollment - Public schools (%)
School enrollment - Private schools (%)
School enrollment - Not enrolled (%)
Median number of rooms in houses and condos
Median number of rooms in apartments
Housing units lacking complete plumbing facilities (%)
Housing units lacking complete kitchen facilities (%)
Density of houses
Urban houses (%)
Rural houses (%)
Households with people 60 years and over (%)
Households with people 65 years and over (%)
Households with people 75 years and over (%)
Households with one or more nonrelatives (%)
Households with no nonrelatives (%)
Population in households (%)
Family households (%)
Nonfamily households (%)
Population in families (%)
Family households with own children (%)
Median number of bedrooms in owner occupied houses
Mean number of bedrooms in owner occupied houses
Median number of bedrooms in renter occupied houses
Mean number of bedrooms in renter occupied houses
Median number of vehichles in owner occupied houses
Mean number of vehichles in owner occupied houses
Median number of vehichles in renter occupied houses
Mean number of vehichles in renter occupied houses
Mortgage status - with mortgage (%)
Mortgage status - with second mortgage (%)
Mortgage status - with home equity loan (%)
Mortgage status - with both second mortgage and home equity loan (%)
Mortgage status - without a mortgage (%)
Average family size
Average family size - White
Average family size - Black or African American
Average family size - Asian
Average family size - Hispanic or Latino
Average family size - American Indian and Alaska Native
Average family size - Multirace
Average family size - Other Race
Geographical mobility - Same house 1 year ago (%)
Geographical mobility - Moved within same county (%)
Geographical mobility - Moved from different county within same state (%)
Geographical mobility - Moved from different state (%)
Geographical mobility - Moved from abroad (%)
Place of birth - Born in state of residence (%)
Place of birth - Born in other state (%)
Place of birth - Native, outside of US (%)
Place of birth - Foreign born (%)
Housing units in structures - 1, detached (%)
Housing units in structures - 1, attached (%)
Housing units in structures - 2 (%)
Housing units in structures - 3 or 4 (%)
Housing units in structures - 5 to 9 (%)
Housing units in structures - 10 to 19 (%)
Housing units in structures - 20 to 49 (%)
Housing units in structures - 50 or more (%)
Housing units in structures - Mobile home (%)
Housing units in structures - Boat, RV, van, etc. (%)
House/condo owner moved in on average (years ago)
Renter moved in on average (years ago)
Year householder moved into unit - Moved in 1999 to March 2000 (%)
Year householder moved into unit - Moved in 1995 to 1998 (%)
Year householder moved into unit - Moved in 1990 to 1994 (%)
Year householder moved into unit - Moved in 1980 to 1989 (%)
Year householder moved into unit - Moved in 1970 to 1979 (%)
Year householder moved into unit - Moved in 1969 or earlier (%)
Means of transportation to work - Drove car alone (%)
Means of transportation to work - Carpooled (%)
Means of transportation to work - Public transportation (%)
Means of transportation to work - Bus or trolley bus (%)
Means of transportation to work - Streetcar or trolley car (%)
Means of transportation to work - Subway or elevated (%)
Means of transportation to work - Railroad (%)
Means of transportation to work - Ferryboat (%)
Means of transportation to work - Taxicab (%)
Means of transportation to work - Motorcycle (%)
Means of transportation to work - Bicycle (%)
Means of transportation to work - Walked (%)
Means of transportation to work - Other means (%)
Working at home (%)
Industry diversity
Most Common Industries - Agriculture, forestry, fishing and hunting, and mining (%)
Most Common Industries - Agriculture, forestry, fishing and hunting (%)
Most Common Industries - Mining, quarrying, and oil and gas extraction (%)
Most Common Industries - Construction (%)
Most Common Industries - Manufacturing (%)
Most Common Industries - Wholesale trade (%)
Most Common Industries - Retail trade (%)
Most Common Industries - Transportation and warehousing, and utilities (%)
Most Common Industries - Transportation and warehousing (%)
Most Common Industries - Utilities (%)
Most Common Industries - Information (%)
Most Common Industries - Finance and insurance, and real estate and rental and leasing (%)
Most Common Industries - Finance and insurance (%)
Most Common Industries - Real estate and rental and leasing (%)
Most Common Industries - Professional, scientific, and management, and administrative and waste management services (%)
Most Common Industries - Professional, scientific, and technical services (%)
Most Common Industries - Management of companies and enterprises (%)
Most Common Industries - Administrative and support and waste management services (%)
Most Common Industries - Educational services, and health care and social assistance (%)
Most Common Industries - Educational services (%)
Most Common Industries - Health care and social assistance (%)
Most Common Industries - Arts, entertainment, and recreation, and accommodation and food services (%)
Most Common Industries - Arts, entertainment, and recreation (%)
Most Common Industries - Accommodation and food services (%)
Most Common Industries - Other services, except public administration (%)
Most Common Industries - Public administration (%)
Occupation diversity
Most Common Occupations - Management, business, science, and arts occupations (%)
Most Common Occupations - Management, business, and financial occupations (%)
Most Common Occupations - Management occupations (%)
Most Common Occupations - Business and financial operations occupations (%)
Most Common Occupations - Computer, engineering, and science occupations (%)
Most Common Occupations - Computer and mathematical occupations (%)
Most Common Occupations - Architecture and engineering occupations (%)
Most Common Occupations - Life, physical, and social science occupations (%)
Most Common Occupations - Education, legal, community service, arts, and media occupations (%)
Most Common Occupations - Community and social service occupations (%)
Most Common Occupations - Legal occupations (%)
Most Common Occupations - Education, training, and library occupations (%)
Most Common Occupations - Arts, design, entertainment, sports, and media occupations (%)
Most Common Occupations - Healthcare practitioners and technical occupations (%)
Most Common Occupations - Health diagnosing and treating practitioners and other technical occupations (%)
Most Common Occupations - Health technologists and technicians (%)
Most Common Occupations - Service occupations (%)
Most Common Occupations - Healthcare support occupations (%)
Most Common Occupations - Protective service occupations (%)
Most Common Occupations - Fire fighting and prevention, and other protective service workers including supervisors (%)
Most Common Occupations - Law enforcement workers including supervisors (%)
Most Common Occupations - Food preparation and serving related occupations (%)
Most Common Occupations - Building and grounds cleaning and maintenance occupations (%)
Most Common Occupations - Personal care and service occupations (%)
Most Common Occupations - Sales and office occupations (%)
Most Common Occupations - Sales and related occupations (%)
Most Common Occupations - Office and administrative support occupations (%)
Most Common Occupations - Natural resources, construction, and maintenance occupations (%)
Most Common Occupations - Farming, fishing, and forestry occupations (%)
Most Common Occupations - Construction and extraction occupations (%)
Most Common Occupations - Installation, maintenance, and repair occupations (%)
Most Common Occupations - Production, transportation, and material moving occupations (%)
Most Common Occupations - Production occupations (%)
Most Common Occupations - Transportation occupations (%)
Most Common Occupations - Material moving occupations (%)
People in Group quarters - Institutionalized population (%)
People in Group quarters - Correctional institutions (%)
People in Group quarters - Federal prisons and detention centers (%)
People in Group quarters - Halfway houses (%)
People in Group quarters - Local jails and other confinement facilities (including police lockups) (%)
People in Group quarters - Military disciplinary barracks (%)
People in Group quarters - State prisons (%)
People in Group quarters - Other types of correctional institutions (%)
People in Group quarters - Nursing homes (%)
People in Group quarters - Hospitals/wards, hospices, and schools for the handicapped (%)
People in Group quarters - Hospitals/wards and hospices for chronically ill (%)
People in Group quarters - Hospices or homes for chronically ill (%)
People in Group quarters - Military hospitals or wards for chronically ill (%)
People in Group quarters - Other hospitals or wards for chronically ill (%)
People in Group quarters - Hospitals or wards for drug/alcohol abuse (%)
People in Group quarters - Mental (Psychiatric) hospitals or wards (%)
People in Group quarters - Schools, hospitals, or wards for the mentally retarded (%)
People in Group quarters - Schools, hospitals, or wards for the physically handicapped (%)
People in Group quarters - Institutions for the deaf (%)
People in Group quarters - Institutions for the blind (%)
People in Group quarters - Orthopedic wards and institutions for the physically handicapped (%)
People in Group quarters - Wards in general hospitals for patients who have no usual home elsewhere (%)
People in Group quarters - Wards in military hospitals for patients who have no usual home elsewhere (%)
People in Group quarters - Juvenile institutions (%)
People in Group quarters - Long-term care (%)
People in Group quarters - Homes for abused, dependent, and neglected children (%)
People in Group quarters - Residential treatment centers for emotionally disturbed children (%)
People in Group quarters - Training schools for juvenile delinquents (%)
People in Group quarters - Short-term care, detention or diagnostic centers for delinquent children (%)
People in Group quarters - Type of juvenile institution unknown (%)
People in Group quarters - Noninstitutionalized population (%)
People in Group quarters - College dormitories (includes college quarters off campus) (%)
People in Group quarters - Military quarters (%)
People in Group quarters - On base (%)
People in Group quarters - Barracks, unaccompanied personnel housing (UPH), (Enlisted/Officer), ;and similar group living quarters for military personnel (%)
People in Group quarters - Transient quarters for temporary residents (%)
People in Group quarters - Military ships (%)
People in Group quarters - Group homes (%)
People in Group quarters - Homes or halfway houses for drug/alcohol abuse (%)
People in Group quarters - Homes for the mentally ill (%)
People in Group quarters - Homes for the mentally retarded (%)
People in Group quarters - Homes for the physically handicapped (%)
People in Group quarters - Other group homes (%)
People in Group quarters - Religious group quarters (%)
People in Group quarters - Dormitories (%)
People in Group quarters - Agriculture workers' dormitories on farms (%)
People in Group quarters - Job Corps and vocational training facilities (%)
People in Group quarters - Other workers' dormitories (%)
People in Group quarters - Crews of maritime vessels (%)
People in Group quarters - Other nonhousehold living situations (%)
People in Group quarters - Other noninstitutional group quarters (%)
Residents speaking English at home (%)
Residents speaking English at home - Born in the United States (%)
Residents speaking English at home - Native, born elsewhere (%)
Residents speaking English at home - Foreign born (%)
Residents speaking Spanish at home (%)
Residents speaking Spanish at home - Born in the United States (%)
Residents speaking Spanish at home - Native, born elsewhere (%)
Residents speaking Spanish at home - Foreign born (%)
Residents speaking other language at home (%)
Residents speaking other language at home - Born in the United States (%)
Residents speaking other language at home - Native, born elsewhere (%)
Residents speaking other language at home - Foreign born (%)
Class of Workers - Employee of private company (%)
Class of Workers - Self-employed in own incorporated business (%)
Class of Workers - Private not-for-profit wage and salary workers (%)
Class of Workers - Local government workers (%)
Class of Workers - State government workers (%)
Class of Workers - Federal government workers (%)
Class of Workers - Self-employed workers in own not incorporated business and Unpaid family workers (%)
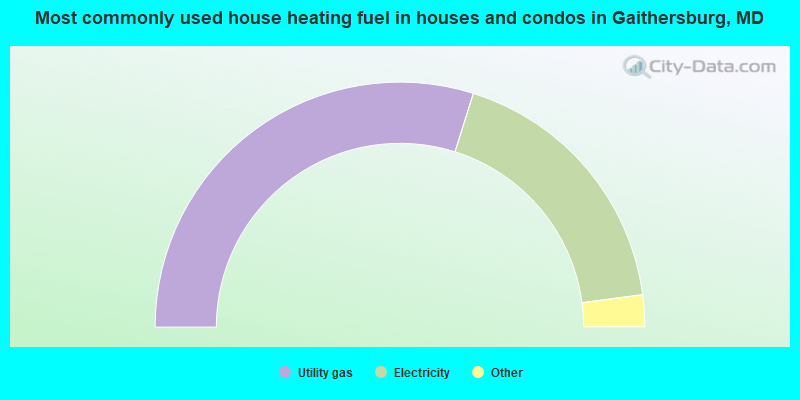
House heating fuel used in houses and condos - Utility gas (%)
House heating fuel used in houses and condos - Bottled, tank, or LP gas (%)
House heating fuel used in houses and condos - Electricity (%)
House heating fuel used in houses and condos - Fuel oil, kerosene, etc. (%)
House heating fuel used in houses and condos - Coal or coke (%)
House heating fuel used in houses and condos - Wood (%)
House heating fuel used in houses and condos - Solar energy (%)
House heating fuel used in houses and condos - Other fuel (%)
House heating fuel used in houses and condos - No fuel used (%)
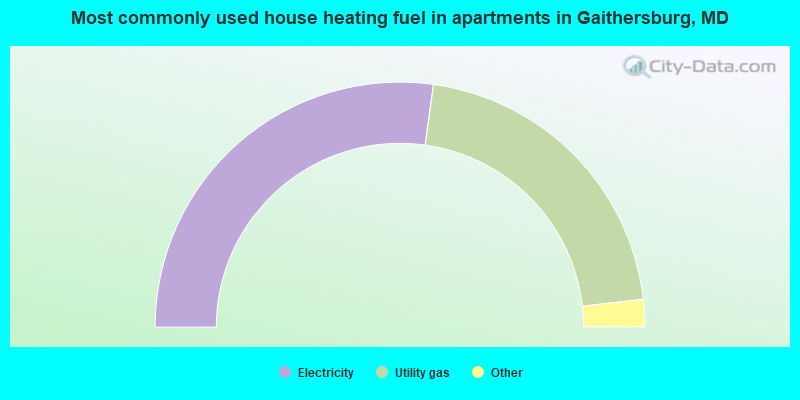
House heating fuel used in apartments - Utility gas (%)
House heating fuel used in apartments - Bottled, tank, or LP gas (%)
House heating fuel used in apartments - Electricity (%)
House heating fuel used in apartments - Fuel oil, kerosene, etc. (%)
House heating fuel used in apartments - Coal or coke (%)
House heating fuel used in apartments - Wood (%)
House heating fuel used in apartments - Solar energy (%)
House heating fuel used in apartments - Other fuel (%)
House heating fuel used in apartments - No fuel used (%)
Armed forces status - In Armed Forces (%)
Armed forces status - Civilian (%)
Armed forces status - Civilian - Veteran (%)
Armed forces status - Civilian - Nonveteran (%)
Fatal accidents locations in years 2005-2021
Fatal accidents locations in 2005
Fatal accidents locations in 2006
Fatal accidents locations in 2007
Fatal accidents locations in 2008
Fatal accidents locations in 2009
Fatal accidents locations in 2010
Fatal accidents locations in 2011
Fatal accidents locations in 2012
Fatal accidents locations in 2013
Fatal accidents locations in 2014
Fatal accidents locations in 2015
Fatal accidents locations in 2016
Fatal accidents locations in 2017
Fatal accidents locations in 2018
Fatal accidents locations in 2019
Fatal accidents locations in 2020
Fatal accidents locations in 2021
Alcohol use - People drinking some alcohol every month (%)
Alcohol use - People not drinking at all (%)
Alcohol use - Average days/month drinking alcohol
Alcohol use - Average drinks/week
Alcohol use - Average days/year people drink much
Audiometry - Average condition of hearing (%)
Audiometry - People that can hear a whisper from across a quiet room (%)
Audiometry - People that can hear normal voice from across a quiet room (%)
Audiometry - Ears ringing, roaring, buzzing (%)
Audiometry - Had a job exposure to loud noise (%)
Audiometry - Had off-work exposure to loud noise (%)
Blood Pressure & Cholesterol - Has high blood pressure (%)
Blood Pressure & Cholesterol - Checking blood pressure at home (%)
Blood Pressure & Cholesterol - Frequently checking blood cholesterol (%)
Blood Pressure & Cholesterol - Has high cholesterol level (%)
Consumer Behavior - Money monthly spent on food at supermarket/grocery store
Consumer Behavior - Money monthly spent on food at other stores
Consumer Behavior - Money monthly spent on eating out
Consumer Behavior - Money monthly spent on carryout/delivered foods
Consumer Behavior - Income spent on food at supermarket/grocery store (%)
Consumer Behavior - Income spent on food at other stores (%)
Consumer Behavior - Income spent on eating out (%)
Consumer Behavior - Income spent on carryout/delivered foods (%)
Current Health Status - General health condition (%)
Current Health Status - Blood donors (%)
Current Health Status - Has blood ever tested for HIV virus (%)
Current Health Status - Left-handed people (%)
Dermatology - People using sunscreen (%)
Diabetes - Diabetics (%)
Diabetes - Had a blood test for high blood sugar (%)
Diabetes - People taking insulin (%)
Diet Behavior & Nutrition - Diet health (%)
Diet Behavior & Nutrition - Milk product consumption (# of products/month)
Diet Behavior & Nutrition - Meals not home prepared (#/week)
Diet Behavior & Nutrition - Meals from fast food or pizza place (#/week)
Diet Behavior & Nutrition - Ready-to-eat foods (#/month)
Diet Behavior & Nutrition - Frozen meals/pizza (#/month)
Drug Use - People that ever used marijuana or hashish (%)
Drug Use - Ever used hard drugs (%)
Drug Use - Ever used any form of cocaine (%)
Drug Use - Ever used heroin (%)
Drug Use - Ever used methamphetamine (%)
Health Insurance - People covered by health insurance (%)
Kidney Conditions-Urology - Avg. # of times urinating at night
Medical Conditions - People with asthma (%)
Medical Conditions - People with anemia (%)
Medical Conditions - People with psoriasis (%)
Medical Conditions - People with overweight (%)
Medical Conditions - Elderly people having difficulties in thinking or remembering (%)
Medical Conditions - People who ever received blood transfusion (%)
Medical Conditions - People having trouble seeing even with glass/contacts (%)
Medical Conditions - People with arthritis (%)
Medical Conditions - People with gout (%)
Medical Conditions - People with congestive heart failure (%)
Medical Conditions - People with coronary heart disease (%)
Medical Conditions - People with angina pectoris (%)
Medical Conditions - People who ever had heart attack (%)
Medical Conditions - People who ever had stroke (%)
Medical Conditions - People with emphysema (%)
Medical Conditions - People with thyroid problem (%)
Medical Conditions - People with chronic bronchitis (%)
Medical Conditions - People with any liver condition (%)
Medical Conditions - People who ever had cancer or malignancy (%)
Mental Health - People who have little interest in doing things (%)
Mental Health - People feeling down, depressed, or hopeless (%)
Mental Health - People who have trouble sleeping or sleeping too much (%)
Mental Health - People feeling tired or having little energy (%)
Mental Health - People with poor appetite or overeating (%)
Mental Health - People feeling bad about themself (%)
Mental Health - People who have trouble concentrating on things (%)
Mental Health - People moving or speaking slowly or too fast (%)
Mental Health - People having thoughts they would be better off dead (%)
Oral Health - Average years since last visit a dentist
Oral Health - People embarrassed because of mouth (%)
Oral Health - People with gum disease (%)
Oral Health - General health of teeth and gums (%)
Oral Health - Average days a week using dental floss/device
Oral Health - Average days a week using mouthwash for dental problem
Oral Health - Average number of teeth
Pesticide Use - Households using pesticides to control insects (%)
Pesticide Use - Households using pesticides to kill weeds (%)
Physical Activity - People doing vigorous-intensity work activities (%)
Physical Activity - People doing moderate-intensity work activities (%)
Physical Activity - People walking or bicycling (%)
Physical Activity - People doing vigorous-intensity recreational activities (%)
Physical Activity - People doing moderate-intensity recreational activities (%)
Physical Activity - Average hours a day doing sedentary activities
Physical Activity - Average hours a day watching TV or videos
Physical Activity - Average hours a day using computer
Physical Functioning - People having limitations keeping them from working (%)
Physical Functioning - People limited in amount of work they can do (%)
Physical Functioning - People that need special equipment to walk (%)
Physical Functioning - People experiencing confusion/memory problems (%)
Physical Functioning - People requiring special healthcare equipment (%)
Prescription Medications - Average number of prescription medicines taking
Preventive Aspirin Use - Adults 40+ taking low-dose aspirin (%)
Reproductive Health - Vaginal deliveries (%)
Reproductive Health - Cesarean deliveries (%)
Reproductive Health - Deliveries resulted in a live birth (%)
Reproductive Health - Pregnancies resulted in a delivery (%)
Reproductive Health - Women breastfeeding newborns (%)
Reproductive Health - Women that had a hysterectomy (%)
Reproductive Health - Women that had both ovaries removed (%)
Reproductive Health - Women that have ever taken birth control pills (%)
Reproductive Health - Women taking birth control pills (%)
Reproductive Health - Women that have ever used Depo-Provera or injectables (%)
Reproductive Health - Women that have ever used female hormones (%)
Sexual Behavior - People 18+ that ever had sex (vaginal, anal, or oral) (%)
Sexual Behavior - Males 18+ that ever had vaginal sex with a woman (%)
Sexual Behavior - Males 18+ that ever performed oral sex on a woman (%)
Sexual Behavior - Males 18+ that ever had anal sex with a woman (%)
Sexual Behavior - Males 18+ that ever had any sex with a man (%)
Sexual Behavior - Females 18+ that ever had vaginal sex with a man (%)
Sexual Behavior - Females 18+ that ever performed oral sex on a man (%)
Sexual Behavior - Females 18+ that ever had anal sex with a man (%)
Sexual Behavior - Females 18+ that ever had any kind of sex with a woman (%)
Sexual Behavior - Average age people first had sex
Sexual Behavior - Average number of female sex partners in lifetime (males 18+)
Sexual Behavior - Average number of female vaginal sex partners in lifetime (males 18+)
Sexual Behavior - Average age people first performed oral sex on a woman (18+)
Sexual Behavior - Average number of woman performed oral sex on in lifetime (18+)
Sexual Behavior - Average number of male sex partners in lifetime (males 18+)
Sexual Behavior - Average number of male anal sex partners in lifetime (males 18+)
Sexual Behavior - Average age people first performed oral sex on a man (18+)
Sexual Behavior - Average number of male oral sex partners in lifetime (18+)
Sexual Behavior - People using protection when performing oral sex (%)
Sexual Behavior - Average number of times people have vaginal or anal sex a year
Sexual Behavior - People having sex without condom (%)
Sexual Behavior - Average number of male sex partners in lifetime (females 18+)
Sexual Behavior - Average number of male vaginal sex partners in lifetime (females 18+)
Sexual Behavior - Average number of female sex partners in lifetime (females 18+)
Sexual Behavior - Circumcised males 18+ (%)
Sleep Disorders - Average hours sleeping at night
Sleep Disorders - People that has trouble sleeping (%)
Smoking-Cigarette Use - People smoking cigarettes (%)
Taste & Smell - People 40+ having problems with smell (%)
Taste & Smell - People 40+ having problems with taste (%)
Taste & Smell - People 40+ that ever had wisdom teeth removed (%)
Taste & Smell - People 40+ that ever had tonsils teeth removed (%)
Taste & Smell - People 40+ that ever had a loss of consciousness because of a head injury (%)
Taste & Smell - People 40+ that ever had a broken nose or other serious injury to face or skull (%)
Taste & Smell - People 40+ that ever had two or more sinus infections (%)
Weight - Average height (inches)
Weight - Average weight (pounds)
Weight - Average BMI
Weight - People that are obese (%)
Weight - People that ever were obese (%)
Weight - People trying to lose weight (%)
Latest news from Gaithersburg, MD collected exclusively by city-data.com from local newspapers, TV, and radio stations
Gaithersburg, MD City Guides: Ancestries: American (2.9%), English (2.3%), German (2.3%), Brazilian (2.1%), African (1.7%), Irish (1.7%).
Current Local Time:
Land area: 10.1 square miles.
Population density: 6,836 people per square mile (high).
29,445 residents are foreign born (17.3% Latin America , 16.4% Asia ).
This city:
42.8%Maryland:
15.7%
Median real estate property taxes paid for housing units with mortgages in 2022: $4,361 (0.9%)Median real estate property taxes paid for housing units with no mortgage in 2022: $5,027 (0.9%)
Nearest city with pop. 200,000+: Washington, DC
Nearest city with pop. 1,000,000+: Philadelphia, PA
Nearest cities:
Latitude: 39.13 N, Longitude: 77.23 W
Daytime population change due to commuting: +11,497 (+16.7%)Workers who live and work in this city: 16,238 (44.2%)
Property values in Gaithersburg, MD
Gaithersburg tourist attractions:
Single-family new house construction building permits:
2022: 36 buildings , average cost: $100,8002021: 37 buildings , average cost: $101,7002020: 43 buildings , average cost: $99,1002019: 2 buildings , average cost: $194,2002018: 10 buildings , average cost: $238,4002017: 32 buildings , average cost: $163,4002016: 69 buildings , average cost: $162,3002015: 161 buildings , average cost: $152,1002014: 149 buildings , average cost: $128,4002013: 178 buildings , average cost: $164,1002012: 85 buildings , average cost: $193,7002011: 56 buildings , average cost: $230,6002010: 90 buildings , average cost: $172,6002009: 72 buildings , average cost: $164,9002008: 57 buildings , average cost: $188,7002007: 73 buildings , average cost: $171,0002006: 74 buildings , average cost: $261,4002005: 124 buildings , average cost: $267,2002003: 172 buildings , average cost: $118,2002002: 414 buildings , average cost: $118,1002001: 375 buildings , average cost: $119,0002000: 336 buildings , average cost: $98,0001999: 463 buildings , average cost: $104,1001998: 181 buildings , average cost: $111,4001997: 148 buildings , average cost: $116,000Unemployment in December 2023:
Population change in the 1990s: +12,927 (+32.6%).
Tornado activity:
Gaithersburg-area historical tornado activity is slightly above Maryland state average. It is 12% greater than the overall U.S. average.
On 9/5/1979, a category F3 (max. wind speeds 158-206 mph) tornado 9.4 miles away from the Gaithersburg city center killed one person and injured 6 people and caused between $500,000 and $5,000,000 in damages.
On 4/1/1973, a category F3 tornado 18.4 miles away from the city center injured 37 people and caused between $5,000,000 and $50,000,000 in damages.
Earthquake activity:
Gaithersburg-area historical earthquake activity is significantly above Maryland state average. It is 56% smaller than the overall U.S. average. On 8/23/2011 at 17:51:04, a magnitude 5.8 (5.8 MW, Depth: 3.7 mi, Class: Moderate, Intensity: VI - VII) earthquake occurred 92.9 miles away from the city center On 1/16/1994 at 01:49:16, a magnitude 4.6 (4.6 MB, 4.6 LG, Depth: 3.1 mi, Class: Light, Intensity: IV - V) earthquake occurred 104.3 miles away from the city center On 8/25/2011 at 05:07:52, a magnitude 4.5 (4.5 ML, Depth: 4.2 mi) earthquake occurred 91.2 miles away from Gaithersburg center On 9/25/1998 at 19:52:52, a magnitude 5.2 (4.8 MB, 4.3 MS, 5.2 LG, 4.5 MW, Depth: 3.1 mi) earthquake occurred 233.6 miles away from Gaithersburg center On 12/9/2003 at 20:59:18, a magnitude 4.5 (4.5 ML, Depth: 6.2 mi) earthquake occurred 105.2 miles away from Gaithersburg center On 12/9/2003 at 20:59:14, a magnitude 4.5 (4.5 MB, 4.5 LG) earthquake occurred 113.0 miles away from Gaithersburg center Magnitude types: regional Lg-wave magnitude (LG), body-wave magnitude (MB), local magnitude (ML), surface-wave magnitude (MS), moment magnitude (MW) Natural disasters: The number of natural disasters in Montgomery County (19) is greater than the US average (15).Major Disasters (Presidential) Declared: 14Emergencies Declared: 5Hurricanes: 5, Winter Storms: 5, Snowstorms: 4, Storms: 4, Floods: 3, Winds: 2, Blizzard: 1, Heavy Rain: 1, Snowfall: 1, Tornado: 1, Tropical Storm: 1, Other: 1 (Note: some incidents may be assigned to more than one category). Main business address for: GENE LOGIC INC IN VITRO & IN VIVO DIAGNOSTIC SUBSTANCES ), DIGENE CORP IN VITRO & IN VIVO DIAGNOSTIC SUBSTANCES ), OPTELECOM INC RADIO & TV BROADCASTING & COMMUNICATIONS EQUIPMENT ), MEDIMMUNE INC /DE BIOLOGICAL PRODUCTS (NO DIAGNOSTIC SUBSTANCES) ), GENVEC INC PHARMACEUTICAL PREPARATIONS ), GXS CORP SERVICES-BUSINESS SERVICES, NEC ).
Hospitals and medical centers in Gaithersburg: CELTIC HEALTHCARE OF MARYLAND (10810 DARNESTOWN ROAD, SUITE 203)
MARYLAND HOME HEALTH LLC (2 PROFESSIONAL DRIVE, SUITE 241)
MBL ASSOCIATES (845M QUINCE ORCHARD BOULEVARD)
MONTGOMERY VILLAGE HEALTH CARE CENTER (19301 WATKINS MILL ROAD)
WILSON HEALTH CARE CENTER (301 RUSSELL AVENUE)
Amtrak stations near Gaithersburg: 6 miles: ROCKVILLE (HUNGERFORD DR. & PARK ST.) Services: partially wheelchair accessible, public payphones, paid short-term parking, paid long-term parking, call for taxi service, public transit connection.
18 miles: DULLES INTERNATIONAL AP'T (HERNDON, DULLES INTERNATIONAL AIRPORT) - Bus Station Services: enclosed waiting area, public restrooms, public payphones, full-service food facilities, paid short-term parking, paid long-term parking, car rental agency, taxi stand, public transit connection.
Colleges/Universities in Gaithersburg: L'Academie de Cuisine Full-time enrollment: 96; Location: 16006 Industrial Dr; Private, for-profit; Website: www.lacademie.com)
Aesthetics Institute of Cosmetology Full-time enrollment: 81; Location: 701 Russell Ave, Space H103/H110; Private, for-profit; Website: www.aiclakeforest.com/)
Colleges/universities with over 2000 students nearest to Gaithersburg:
Montgomery College (about 5 miles; Rockville, MD ; Full-time enrollment: 17,999)
American University (about 16 miles; Washington, DC ; FT enrollment: 9,850)
University of the District of Columbia (about 16 miles; Washington, DC ; FT enrollment: 3,675)
Marymount University (about 17 miles; Arlington, VA ; FT enrollment: 3,361)
Georgetown University (about 18 miles; Washington, DC ; FT enrollment: 12,535)
University of Maryland-University College (about 18 miles; Adelphi, MD ; FT enrollment: 25,040)
Catholic University of America (about 19 miles; Washington, DC ; FT enrollment: 5,365)
Public high schools in Gaithersburg:
Private high schools in Gaithersburg: COVENANT LIFE SCHOOL Students: 292, Location: 7503 MUNCASTER MILL RD, Grades: KG-12)
AVALON SCHOOL Students: 171, Location: 200 W DIAMOND AVE, Grades: 2-12, Boys only )MARCIA D SMITH SCHOOL Students: 11, Location: 9075 COMPRINT CT, Grades: 8-12)
YANG ACADEMY Students: 3, Location: 111 CENTRAL AVE, Grades: 5-12)
Biggest public elementary/middle schools in Gaithersburg: THURGOOD MARSHALL ELEMENTARY Location: 12260 MCDONALD CHAPEL DR, Grades: PK-6)JONES LANE ELEMENTARY Location: 15110 JONES LN, Grades: PK-6)FOREST OAK MIDDLE Location: 651 SAYBROOKE OAKS BLVD, Grades: 6-8)BROWN STATION ELEMENTARY Location: 851 QUINCE ORCHARD BLVD, Grades: PK-5)CANDLEWOOD ELEMENTARY Location: 18100 WASHINGTON GROVE LANE, Grades: KG-5)DARNESTOWN ELEMENTARY Location: 15030 TURKEY FOOT RD, Grades: PK-5)DIAMOND ELEMENTARY Location: 4 MARQUIS DR, Grades: PK-6)DUFIEF ELEMENTARY Location: 15001 DUFIEF DR, Grades: PK-5)FIELDS ROAD ELEMENTARY Location: 1 SCHOOL DR, Grades: PK-5)GAITHERSBURG ELEMENTARY Location: 35 N SUMMIT AVE, Grades: PK-5)Private elementary/middle schools in Gaithersburg: CHURCH OF THE REDEEMER CHRISTIAN SCHOOL Students: 284, Location: 19425 WOODFIELD RD, Grades: PK-8)
ST MARTIN OF TOURS SCHOOL Students: 236, Location: 115 S FREDERICK AVE, Grades: PK-8)
MOTHER OF GOD SCHOOL Students: 207, Location: 20501 GOSHEN RD, Grades: PK-8)
See full list of schools located in Gaithersburg
Notable locations in Gaithersburg: (A) , Edison Technological Park (B) , Crown Pointe Corporate Center (C) , Quince Orchard Corporate Park (D) , Avenel Business Industrial Park (E) , Technical Park 270 (F) , Bennington Corporate Center (G) , Metropolitan Grove Industrial Park (H) , Gaithersburg Public Works (I) , Washington Center (J) , Quince Tree Executive Center (K) , Clopper Siding (L) , National Institute of Standards and Technology Fire Department (M) , Asbury Home (N) , Odenton Volunteer Fire Company 28 (O) , Gaithersburg Railroad Station (P) , Metropolitan Grove Commuter Railroad Station (Q) , Gaithersburg Police Station (R) , State Barracks North Police Station (S) , State Highway Administration (T) . Display/hide their locations on the map
Shopping Centers: (1) , Potomac Valley Shopping Center (2) , Muddy Branch Square Shopping Center (3) , Lakeforest Mall Shopping Center (4) , Quince Orchard Plaza Shopping Center (5) , Gaithersburg Square Shopping Center (6) , Diamond Square Shopping Center (7) . Display/hide their locations on the map
Main business address in Gaithersburg include: (A) , DIGENE CORP (B) , OPTELECOM INC (C) , MEDIMMUNE INC /DE (D) , GENVEC INC (E) , GXS CORP (F) . Display/hide their locations on the map
Churches in Gaithersburg include: (A) , Church of the Ascension (B) , First Assembly of God Church (C) , Epworth United Methodist Church (D) , First Baptist Church (E) , Gaithersburg Mennonite Church (F) , Gaithersburg Presbyterian Church (G) , Good Shepherd Lutheran Church (H) , Interdenomination Church of God (I) . Display/hide their locations on the map
Lakes and reservoirs: (A) , Lake Nirvana (B) , Three Sisters Lakes (C) , Lake Lynette (D) , Elysium Lake (E) , Lake Nirvana (F) , Lake Placid (G) , Lake Halcyon (H) . Display/hide their locations on the map
Parks in Gaithersburg include: (1) , Browns Station Park (2) , Bohrer Park (3) , Christman Park (4) . Display/hide their locations on the map
Tourist attractions:
Hotels:
Birthplace of: Shane McMahon - Professional wrestler, Hank Fraley - 2005 NFL player (Philadelphia Eagles, born : Sep 21, 1977), Jennifer Celotta - Television director, Judah Friedlander - Film actor, Kevin Thompson (American football) - Football quarterback, Kimberly J. Brown - Child actor, Charles Lee - College basketball player (Bucknell Bison), David Jackson - College basketball player (Penn State Nittany Lions), Devika Parikh - Actor, Donnell King - College basketball player (Sacred Heart Pioneers).
Montgomery County has a predicted average indoor radon screening level greater than 4 pCi/L (pico curies per liter) - Highest Potential Drinking water stations with addresses in Gaithersburg and their reported violations in the past:
RUPPERT LANDSCAPE (Population served: 119, Groundwater):
Past monitoring violations:
Initial Tap Sampling for Pb and Cu - In JUL-01-2010, Contaminant: Lead and Copper Rule. Follow-up actions: St Public Notif requested (DEC-17-2010), St Violation/Reminder Notice (DEC-17-2010), St Compliance achieved (FEB-23-2011)
Initial Tap Sampling for Pb and Cu - In JUL-01-2009, Contaminant: Lead and Copper Rule. Follow-up actions: St Violation/Reminder Notice (DEC-11-2009), St Public Notif requested (MAR-03-2010), St Violation/Reminder Notice (MAR-03-2010), St Public Notif received (MAR-08-2010), St Compliance achieved (MAR-08-2010)
One routine major monitoring violation
2 regular monitoring violations
Address: 23601 LAYTONSVILLE RD Population served: 61, Groundwater):
Past health violations:
MCL, Single Sample - In MAR-2012, Contaminant: Nitrate. Follow-up actions: St Public Notif requested (MAR-19-2012), St Violation/Reminder Notice (MAR-19-2012), St Compliance achieved (MAR-20-2012)
MCL, Monthly (TCR) - In OCT-2009, Contaminant: Coliform. Follow-up actions: St Violation/Reminder Notice (OCT-26-2009), St Public Notif received (OCT-29-2009), St Compliance achieved (DEC-14-2009)
Past monitoring violations:
One routine major monitoring violation
One regular monitoring violation
Population served: 60, Groundwater):
Past monitoring violations:
Follow-up Or Routine LCR Tap M/R - In OCT-01-2009, Contaminant: Lead and Copper Rule. Follow-up actions: St Compliance achieved (OCT-20-2009), St Public Notif requested (OCT-27-2009), St Violation/Reminder Notice (OCT-27-2009)
Follow-up Or Routine LCR Tap M/R - In JUL-01-2008, Contaminant: Lead and Copper Rule. Follow-up actions: St Violation/Reminder Notice (DEC-05-2008), St Compliance achieved (DEC-31-2008)
One routine major monitoring violation
Address: 15942 SHADY GROVE ROAD Population served: 50, Groundwater):
Past monitoring violations:
3 regular monitoring violations
Serves PA, Population served: 25, Groundwater):
Past health violations:
MCL, Monthly (TCR) - Between APR-2006 and JUN-2006, Contaminant: Coliform. Follow-up actions: St Violation/Reminder Notice (OCT-06-2006), St Compliance achieved (OCT-17-2006)
Past monitoring violations:
Monitoring, Source Water (GWR) - Between MAY-25-2014 and JUN-25-2014, Contaminant: E. COLI. Follow-up actions: St Violation/Reminder Notice (JUL-10-2014), St Compliance achieved (JUL-10-2014)
Monitoring, Repeat Major (TCR) - Between APR-2014 and JUN-2014, Contaminant: Coliform (TCR). Follow-up actions: St Violation/Reminder Notice (JUL-10-2014), St Compliance achieved (JUL-10-2014)
2 routine major monitoring violations
Average household size: This city:
2.7 peopleMaryland:
2.6 people
Percentage of family households: This city:
66.1%Whole state:
67.1%
Percentage of households with unmarried partners: This city:
5.7%Whole state:
6.4%
Likely homosexual households (counted as self-reported same-sex unmarried-partner households)
Lesbian couples: 0.3% of all households Gay men: 0.2% of all households
People in group quarters in Gaithersburg in 2010:
366 people in nursing facilities/skilled-nursing facilities
101 people in emergency and transitional shelters (with sleeping facilities) for people experiencing homelessness
59 people in other noninstitutional facilities
15 people in group homes intended for adults
6 people in group homes for juveniles (non-correctional)
People in group quarters in Gaithersburg in 2000:
339 people in other noninstitutional group quarters
268 people in nursing homes
14 people in homes or halfway houses for drug/alcohol abuse
Banks with most branches in Gaithersburg (2011 data):
Capital One, National Association: 7 branches. Info updated 2011/07/01: Bank assets: $133,477.8 mil, Deposits: $97,063.7 mil, headquarters in Mclean, VA, positive income , 984 total offices , Holding Company: Capital One Financial Corporation
SunTrust Bank: 7 branches. Info updated 2010/05/27: Bank assets: $171,291.7 mil, Deposits: $129,833.2 mil, headquarters in Atlanta, GA, positive income , Commercial Lending Specialization, 1716 total offices , Holding Company: Suntrust Banks, Inc.
Manufacturers and Traders Trust Company: Flower Hill Way Branch, Montgomery Airpark Branch, Diamond Farms Branch, Gaithersburg Branch, Quince Orchard Branch. Info updated 2011/08/08: Bank assets: $76,887.1 mil, Deposits: $60,064.2 mil, headquarters in Buffalo, NY, positive income , Commercial Lending Specialization, 808 total offices , Holding Company: M&T Bank Corporation
Bank of America, National Association: Olde Towne Gaithersburg, Montgomery Village Branch, Quince Orchard Branch, Gaithersburg Square Branch, Shady Grove Branch. Info updated 2009/11/18: Bank assets: $1,451,969.3 mil, Deposits: $1,077,176.8 mil, headquarters in Charlotte, NC, positive income , 5782 total offices , Holding Company: Bank Of America Corporation
Sandy Spring Bank: Montgomery Village Community Branch, Asbury Branch, Airpark Community Branch, Gaithersburg Square Branch. Info updated 2007/07/17: Bank assets: $3,709.4 mil, Deposits: $2,664.0 mil, headquarters in Olney, MD, positive income , Commercial Lending Specialization, 43 total offices , Holding Company: Sandy Spring Bancorp, Inc.
PNC Bank, National Association: Flower Hill @ Giant Branch, Goshen Road @ Giant Branch, Muddy Branch @ Giant Branch, Gaithersburg Main Office. Info updated 2012/03/20: Bank assets: $263,309.6 mil, Deposits: $197,343.0 mil, headquarters in Wilmington, DE, positive income , Commercial Lending Specialization, 3085 total offices , Holding Company: Pnc Financial Services Group, Inc., The
TD Bank, National Association: Gaithersburg - Shady Grove Road Stor at 15830 Shady Grove Rd, branch established on 2011/07/16; Gaithersburg, Md Branch at 810 West Diamond Avenue, branch established on 2006/09/30. Info updated 2010/10/04: Bank assets: $188,912.6 mil, Deposits: $153,149.8 mil, headquarters in Wilmington, DE, positive income , 1314 total offices , Holding Company: Toronto-Dominion Bank, The
Wells Fargo Bank, National Association: Gaithersburg Branch at 607 North Frederick Avenue, branch established on 1975/09/25; Quince Orchard Branch at 12161 Darnestown Road, branch established on 1995/02/21. Info updated 2011/04/05: Bank assets: $1,161,490.0 mil, Deposits: $905,653.0 mil, headquarters in Sioux Falls, SD, positive income , 6395 total offices , Holding Company: Wells Fargo & Company
Branch Banking and Trust Company: Kentlands Branch at 265 Kentlands Blvd, branch established on 1993/11/20; Gaithersburg Branch at 467 North Frederick Avenue, branch established on 1887/01/01. Info updated 2010/03/29: Bank assets: $168,867.6 mil, Deposits: $127,549.5 mil, headquarters in Winston Salem, NC, positive income , Commercial Lending Specialization, 1793 total offices , Holding Company: Bb&T Corporation
5 other banks with 5 local branches
For population 15 years and over in Gaithersburg:
Never married: 37.0%Now married: 48.4%Separated: 1.2%Widowed: 5.2%Divorced: 8.1% For population 25 years and over in Gaithersburg:
High school or higher: 88.9%Bachelor's degree or higher: 48.8%Graduate or professional degree: 22.8%Unemployed: 4.4%Mean travel time to work (commute): 20.2 minutes
Education Gini index (Inequality in education) Here:
15.4Maryland average:
12.7
Religion statistics for Gaithersburg, MD (based on Montgomery County data)
Religion Adherents Congregations Catholic 122,569 39 Evangelical Protestant 104,377 319 Mainline Protestant 73,637 186 Other 70,946 153 Orthodox 9,889 14 Black Protestant 3,189 22 None 587,170 -
Source: Clifford Grammich, Kirk Hadaway, Richard Houseal, Dale E.Jones, Alexei Krindatch, Richie Stanley and Richard H.Taylor. 2012. 2010 U.S.Religion Census: Religious Congregations & Membership Study. Association of Statisticians of American Religious Bodies. Jones, Dale E., et al. 2002. Congregations and Membership in the United States 2000. Nashville, TN: Glenmary Research Center. Graphs represent county-level data
Food Environment Statistics: Number of grocery stores : 203Here :
2.16 / 10,000 pop.Maryland :
1.96 / 10,000 pop.
Number of supercenters and club stores : 2Montgomery County :
0.02 / 10,000 pop.Maryland :
0.07 / 10,000 pop.
Number of convenience stores (no gas) : 94Here :
1.00 / 10,000 pop.State :
1.22 / 10,000 pop.
Number of convenience stores (with gas) : 134This county :
1.42 / 10,000 pop.State :
2.05 / 10,000 pop.
Number of full-service restaurants : 556Montgomery County :
5.91 / 10,000 pop.State :
5.40 / 10,000 pop.
Adult diabetes rate : Montgomery County :
6.7%Maryland :
9.1%
Adult obesity rate : Montgomery County :
18.8%State :
26.7%
Low-income preschool obesity rate : Montgomery County :
19.9%State :
15.5%
Health and Nutrition: Healthy diet rate : This city:
50.5%Maryland:
50.1%
Average overall health of teeth and gums : Gaithersburg:
49.7%Maryland:
47.6%
People feeling badly about themselves : This city:
18.6%State:
20.0%
People not drinking alcohol at all : Gaithersburg:
11.1%State:
11.3%
Average hours sleeping at night : Overweight people : This city:
30.4%State:
34.1%
General health condition : Gaithersburg:
58.3%State:
56.5%
Average condition of hearing : More about Health and Nutrition of Gaithersburg, MD Residents
Local government employment and payroll (March 2022)
Function
Full-time employees
Monthly full-time payroll
Average yearly full-time wage
Part-time employees
Monthly part-time payroll
Police Protection - Officers
60 $829,650 $165,930 0 $0 Streets and Highways
55 $582,674 $127,129 1 $3,266 Parks and Recreation
39 $449,372 $138,268 168 $245,842 Other Government Administration
37 $546,926 $177,381 11 $28,461 Welfare
25 $275,635 $132,305 15 $30,085 Financial Administration
22 $295,613 $161,243 0 $0 Other and Unallocable
21 $294,519 $168,297 4 $17,050 Solid Waste Management
11 $107,588 $117,369 0 $0 Police - Other
10 $130,979 $157,175 9 $31,179 Natural Resources
6 $82,947 $165,894 0 $0 Health
5 $52,845 $126,828 0 $0 Judicial and Legal
5 $48,298 $115,915 0 $0 Housing and Community Development (Local)
2 $24,075 $144,450 0 $0
Totals for Government
298 $3,721,123 $149,844 208 $355,882
Gaithersburg government finances - Expenditure in 2021 (per resident):
Current Operations - General - Other: $11,664,000 ($169.16)
Police Protection: $10,672,000 ($154.77)Parks and Recreation: $7,480,000 ($108.48)Regular Highways: $7,204,000 ($104.48)Central Staff Services: $4,362,000 ($63.26)Financial Administration: $4,059,000 ($58.87)Solid Waste Management: $3,916,000 ($56.79)Housing and Community Development: $2,792,000 ($40.49)Transit Utilities: $2,364,000 ($34.28)Protective Inspection and Regulation - Other: $1,725,000 ($25.02)General Public Buildings: $1,072,000 ($15.55)Judicial and Legal Services: $776,000 ($11.25)Health - Other: $351,000 ($5.09)General - Interest on Debt: $3,150,000 ($45.68)
Other Capital Outlay - General - Other: $150,000 ($2.18)
Solid Waste Management: $149,000 ($2.16)General Public Building: $61,000 ($0.88)Parks and Recreation: $18,000 ($0.26)Total Salaries and Wages: $37,239,000 ($540.07)
Gaithersburg government finances - Revenue in 2021 (per resident):
Charges - Other: $5,788,000 ($83.94)
Solid Waste Management: $1,717,000 ($24.90)Parks and Recreation: $1,357,000 ($19.68)Federal Intergovernmental - Other: $5,695,000 ($82.59)
Housing and Community Development: $484,000 ($7.02)Local Intergovernmental - Other: $1,721,000 ($24.96)
Housing and Community Development: $167,000 ($2.42)General Local Government Support: $3,000 ($0.04)Miscellaneous - General Revenue - Other: $3,361,000 ($48.74)
Fines and Forfeits: $2,121,000 ($30.76)Sale of Property: $252,000 ($3.65)Donations From Private Sources: $137,000 ($1.99)Rents: $119,000 ($1.73)State Intergovernmental - Other: $2,802,000 ($40.64)
Highways: $1,875,000 ($27.19)Tax - Property: $31,244,000 ($453.13)
Individual Income: $14,518,000 ($210.55)Other License: $3,336,000 ($48.38)Public Utility License: $953,000 ($13.82)Other Selective Sales: $358,000 ($5.19)Amusements Sales: $289,000 ($4.19)Occupation and Business License - Other: $153,000 ($2.22)Amusements License: $3,000 ($0.04)
Gaithersburg government finances - Debt in 2021 (per resident):
Long Term Debt - Beginning Outstanding - Public Debt for Private Purpose: $78,760,000 ($1142.24)
Outstanding Nonguaranteed - Industrial Revenue: $70,780,000 ($1026.51)Retired Nonguaranteed - Public Debt for Private Purpose: $7,980,000 ($115.73)
Gaithersburg government finances - Cash and Securities in 2021 (per resident):
Bond Funds - Cash and Securities: $60,135,000 ($872.13)
Other Funds - Cash and Securities: $92,640,000 ($1343.54)
Sinking Funds - Cash and Securities: $70,780,000 ($1026.51)
6.39% of this county's 2021 resident taxpayers lived in other counties in 2020 ($98,213 average adjusted gross income )
Here:
6.39%Maryland average:
7.42%
0.04% of residents moved from foreign countries ($657 average AGI )Montgomery County:
0.04%Maryland average:
0.05%
Top counties from which taxpayers relocated into this county between 2020 and 2021:
7.69% of this county's 2020 resident taxpayers moved to other counties in 2021 ($102,008 average adjusted gross income )
Here:
7.69%Maryland average:
7.91%
0.05% of residents moved to foreign countries ($861 average AGI )Montgomery County:
0.05%Maryland average:
0.04%
Top counties to which taxpayers relocated from this county between 2020 and 2021:
Businesses in Gaithersburg, MD
Name Count Name Count
7-Eleven 7 Kohl's 1 AT&T 2 Kroger 1 Advance Auto Parts 3 LA Fitness 1 Aeropostale 1 Lane Bryant 1 American Eagle Outfitters 1 Lane Furniture 1 Ann Taylor 1 LensCrafters 1 Bally Total Fitness 1 Little Caesars Pizza 1 Barnes & Noble 1 Lowe's 1 Baskin-Robbins 1 Macy's 1 Bath & Body Works 2 Marriott 5 Bed Bath & Beyond 1 Marshalls 1 Blockbuster 1 MasterBrand Cabinets 15 Brookstone 1 Mazda 1 Budget Car Rental 1 McDonald's 8 Burger King 2 Men's Wearhouse 2 Burlington Coat Factory 1 Motel 6 1 CVS 4 Motherhood Maternity 1 Charlotte Russe 1 New Balance 2 Chevrolet 1 New York & Co 1 Chick-Fil-A 1 Nike 10 Chico's 1 Nordstrom 1 Chipotle 2 Office Depot 1 Chuck E. Cheese's 1 Old Country Buffet 1 Cinnabon 1 Pac Sun 1 Cold Stone Creamery 1 Panda Express 1 Comfort Inn 1 Panera Bread 2 Costco 1 Payless 3 Cricket Wireless 3 PetSmart 1 Curves 1 Pier 1 Imports 1 DHL 3 Pizza Hut 4 Dairy Queen 1 Popeyes 1 Decora Cabinetry 6 Quiznos 2 Domino's Pizza 2 RadioShack 3 DressBarn 1 Red Lobster 1 Dressbarn 1 Red Robin 1 Dunkin Donuts 1 Rite Aid 1 Express 1 Ruby Tuesday 1 Extended Stay America 1 Safeway 2 Extended Stay Deluxe 1 Sam's Club 1 Fashion Bug 1 Sears 5 FedEx 26 Sephora 1 Finish Line 1 Spencer Gifts 1 Foot Locker 1 Sprint Nextel 4 Ford 1 Staples 1 Forever 21 1 Starbucks 9 GNC 3 Subaru 1 GameStop 2 Subway 2 Giant 5 T-Mobile 4 Gymboree 1 Taco Bell 1 H&M 1 Target 1 H&R Block 4 The Limited 1 Hilton 2 Toyota 1 Holiday Inn 1 Toys"R"Us 1 Hollister Co. 1 Trader Joe's 1 Home Depot 1 U-Haul 4 Hot Topic 1 UPS 27 Hyundai 1 Vans 3 IHOP 1 Verizon Wireless 1 JCPenney 1 Victoria's Secret 1 JoS. A. Bank 1 Volkswagen 1 Jones New York 3 Vons 2 Journeys 1 Wendy's 3 Justice 2 Wet Seal 1 KFC 1 Whole Foods Market 1 Kmart 1
Strongest AM radio stations in Gaithersburg:
WMET (1150 AM; 50 kW; GAITHERSBURG, MD; Owner: BELTWAY ACQUISITION CORPORATION)
WTOP (1500 AM; 50 kW; WASHINGTON, DC; Owner: BONNEVILLE HOLDING COMPANY)
WTEM (980 AM; 50 kW; WASHINGTON, DC; Owner: AMFM RADIO LICENSES, L.L.C.)
WTNT (570 AM; 5 kW; BETHESDA, MD; Owner: AMFM RADIO LICENSES, L.L.C.)
WCBM (680 AM; 50 kW; BALTIMORE, MD; Owner: WCBM MARYLAND, INC.)
WMAL (630 AM; 5 kW; WASHINGTON, DC; Owner: WMAL, INC.)
WUST (1120 AM; daytime; 20 kW; WASHINGTON, DC)
WCTN (950 AM; 2 kW; POTOMAC-CABIN JOHN, MD; Owner: SEVEN LOCKS BROADCASTING COMPANY, INC.)
WBAL (1090 AM; 50 kW; BALTIMORE, MD; Owner: HEARST RADIO, INC.)
WGOP (700 AM; daytime; 25 kW; WALKERSVILLE, MD; Owner: BIRACH BROADCASTING CORPORATION)
WPGC (1580 AM; 50 kW; MORNINGSIDE, MD; Owner: INFINITY WPGC(AM), INC.)
WLXE (1600 AM; 1 kW; ROCKVILLE, MD; Owner: MULTICULTURAL RADIO BROADCASTING, INC.)
WKCW (1420 AM; 50 kW; WARRENTON, VA; Owner: WAY BROADCASTING, INC.)
Strongest FM radio stations in Gaithersburg:
WWDC-FM (101.1 FM; WASHINGTON, DC; Owner: AMFM RADIO LICENSES, L.L.C.)
WARW (94.7 FM; BETHESDA, MD; Owner: INFINITY BROADCASTING OPERATIONS, INC.)
WIHT (99.5 FM; WASHINGTON, DC; Owner: AMFM RADIO LICENSES, L.L.C.)
WASH (97.1 FM; WASHINGTON, DC; Owner: AMFM RADIO LICENSES, L.L.C.)
WRQX (107.3 FM; WASHINGTON, DC; Owner: WMAL, INC.)
WHUR-FM (96.3 FM; WASHINGTON, DC; Owner: THE HOWARD UNIVERSITY)
WKYS (93.9 FM; WASHINGTON, DC; Owner: RADIO ONE LICENSES, LLC)
WJFK-FM (106.7 FM; MANASSAS, VA; Owner: INFINITY BROADCASTING CORP. OF WASHINGTON, DC)
WCSP-FM (90.1 FM; WASHINGTON, DC; Owner: NATIONAL CABLE SATELLITE CORPORATION)
WJZW (105.9 FM; WOODBRIDGE, VA; Owner: WMAL, INC.)
WGTS (91.9 FM; TAKOMA PARK, MD; Owner: COLUMBIA UNION COLLEGE BROADCASTING, INC.)
WGMS-FM (103.5 FM; WASHINGTON, DC; Owner: BONNEVILLE HOLDING COMPANY)
WETA (90.9 FM; WASHINGTON, DC; Owner: GREATER WASHINGTON EDUCATIONAL TELECOMMUNICATIONS ASSN.)
WMZQ-FM (98.7 FM; WASHINGTON, DC; Owner: AMFM RADIO LICENSES, L.L.C.)
WBIG-FM (100.3 FM; WASHINGTON, DC; Owner: AMFM RADIO LICENSES, L.L.C.)
WAMU (88.5 FM; WASHINGTON, DC; Owner: THE EXEC. COMM. OF THE BD. OF TRUSTEES OF AMERICAN UNIV.)
WFRE (99.9 FM; FREDERICK, MD; Owner: CAPSTAR TX LIMITED PARTNERSHIP)
W219BX (91.7 FM; FREDERICK, MD; Owner: CEDAR RIDGE CHILDREN'S HOME & SCHOOL, INC)
WMMJ (102.3 FM; BETHESDA, MD; Owner: RADIO ONE LICENSES, LLC)
WAVA (105.1 FM; ARLINGTON, VA; Owner: SALEM MEDIA OF VIRGINIA, INC.)
TV broadcast stations around Gaithersburg:
WTTG (Channel 5; WASHINGTON, DC; Owner: FOX TELEVISION STATIONS, INC.)
WETA-TV (Channel 26; WASHINGTON, DC; Owner: THE GREATER WASHINGTON ED TELECOMM. ASSOC)
WJLA-TV (Channel 7; WASHINGTON, DC; Owner: ACC LICENSEE, INC.)
WUSA (Channel 9; WASHINGTON, DC; Owner: THE DETROIT NEWS, INC.)
WDCA (Channel 20; WASHINGTON, DC; Owner: FOX TELEVISION STATIONS, INC.)
WHUT-TV (Channel 32; WASHINGTON, DC; Owner: HOWARD UNIVERSITY)
WBDC-TV (Channel 50; WASHINGTON, DC; Owner: WBDC BROADCASTING, INC.)
WRC-TV (Channel 4; WASHINGTON, DC; Owner: NBC SUBSIDIARY (WRC-TV), INC.)
WFPT (Channel 62; FREDERICK, MD; Owner: MARYLAND PUBLIC BROADCASTING COMMISSION)
WNVC (Channel 56; FAIRFAX, VA; Owner: COMMONWEALTH PUBLIC BROADCASTING CORPORATION)
WBAL-TV (Channel 11; BALTIMORE, MD; Owner: WBAL HEARST-ARGYLE TV, INC. (CA CORP.))
WMAR-TV (Channel 2; BALTIMORE, MD; Owner: SCRIPPS HOWARD BROADCASTING COMPANY)
WBFF (Channel 45; BALTIMORE, MD; Owner: CHESAPEAKE TELEVISION LICENSEE, LLC)
WNUV (Channel 54; BALTIMORE, MD; Owner: BALTIMORE (WNUV-TV) LICENSEE, INC.)
WUTB (Channel 24; BALTIMORE, MD; Owner: FOX TELEVISION STATIONS, INC.)
W28BY (Channel 63; BALTIMORE, MD; Owner: INFORMATION SUPER STATION, L.L.C.)
WMPB (Channel 67; BALTIMORE, MD; Owner: MARYLAND PUBLIC BROADCASTING COMMISSION)
WZDC-LP (Channel 64; WASHINGTON, DC; Owner: ONDA CAPITAL, INC.)
WJZ-TV (Channel 13; BALTIMORE, MD; Owner: VIACOM INC.)
WMPT (Channel 22; ANNAPOLIS, MD; Owner: MARYLAND PUBLIC BROADCASTING COMMISSION)
WMDO-CA (Channel 30; WASHINGTON, DC; Owner: ENTRAVISION HOLDINGS, LLC)
W52AS (Channel 52; FREDERICK, MD; Owner: THREE ANGELS BROADCASTING NETWORK)
WPXW (Channel 66; MANASSAS, VA; Owner: PAXSON WASHINGTON LICENSE, INC.)
WKRP-LP (Channel 42; WASHINGTON, DC; Owner: CAPITAL MEDIA, LLC)
W42BE (Channel 42; FAIRFAX, VA; Owner: FAIRFAX LOW POWER CO.)
National Bridge Inventory (NBI) Statistics 76 Number of bridges781ft / 238m Total length $7,693,000 Total costs3,022,185 Total average daily traffic195,913 Total average daily truck traffic
New bridges - historical statistics
10 1950-1959 3 1960-1969 1 1970-1979 24 1980-1989 30 1990-1999 3 2000-2009 1 2010-2019 4 2020-2022
See full National Bridge Inventory statistics for Gaithersburg, MD
Home Mortgage Disclosure Act Aggregated Statistics For Year 2009(Based on 2 full and 10 partial tracts) A) FHA, FSA/RHS & VA B) Conventional C) Refinancings D) Home Improvement Loans E) Loans on Dwellings For 5+ Families F) Non-occupant Loans on G) Loans On Manufactured Number Average Value Number Average Value Number Average Value Number Average Value Number Average Value Number Average Value Number Average Value
LOANS ORIGINATED 286 $279,453 336 $289,421 1,267 $287,033 16 $146,329 4 $36,424,040 72 $212,989 0 $0 APPLICATIONS APPROVED, NOT ACCEPTED 21 $276,523 22 $238,475 105 $277,989 6 $74,552 0 $0 8 $152,701 1 $380,210 APPLICATIONS DENIED 36 $221,269 35 $229,671 361 $305,971 23 $73,939 0 $0 35 $219,111 0 $0 APPLICATIONS WITHDRAWN 42 $237,102 47 $275,706 298 $291,523 6 $115,415 0 $0 18 $195,862 0 $0 FILES CLOSED FOR INCOMPLETENESS 6 $206,278 8 $251,125 101 $275,044 5 $75,662 0 $0 8 $204,472 0 $0
Aggregated Statistics For Year 2008(Based on 2 full and 10 partial tracts) A) FHA, FSA/RHS & VA B) Conventional C) Refinancings D) Home Improvement Loans E) Loans on Dwellings For 5+ Families F) Non-occupant Loans on G) Loans On Manufactured Number Average Value Number Average Value Number Average Value Number Average Value Number Average Value Number Average Value Number Average Value
LOANS ORIGINATED 192 $287,005 404 $297,137 607 $266,010 44 $94,307 3 $27,298,973 52 $240,137 0 $0 APPLICATIONS APPROVED, NOT ACCEPTED 10 $279,110 58 $287,882 93 $256,489 9 $69,787 0 $0 17 $239,472 0 $0 APPLICATIONS DENIED 35 $244,902 65 $270,760 373 $291,276 45 $127,155 0 $0 27 $227,899 0 $0 APPLICATIONS WITHDRAWN 23 $286,916 63 $281,479 186 $273,345 11 $164,219 0 $0 18 $209,627 1 $162,630 FILES CLOSED FOR INCOMPLETENESS 3 $245,717 14 $310,579 47 $291,359 6 $129,183 0 $0 8 $292,628 0 $0
Aggregated Statistics For Year 2007(Based on 2 full and 10 partial tracts) A) FHA, FSA/RHS & VA B) Conventional C) Refinancings D) Home Improvement Loans E) Loans on Dwellings For 5+ Families F) Non-occupant Loans on G) Loans On Manufactured Number Average Value Number Average Value Number Average Value Number Average Value Number Average Value Number Average Value Number Average Value
LOANS ORIGINATED 18 $286,998 1,068 $256,014 945 $246,489 113 $121,907 1 $23,064,600 167 $212,293 0 $0 APPLICATIONS APPROVED, NOT ACCEPTED 1 $233,030 95 $236,338 206 $239,975 32 $92,026 1 $5,302,390 26 $196,268 1 $31,680 APPLICATIONS DENIED 7 $210,194 129 $254,819 579 $255,620 92 $133,288 0 $0 45 $214,735 1 $50,110 APPLICATIONS WITHDRAWN 5 $245,820 152 $247,354 270 $258,471 16 $156,724 0 $0 20 $237,469 0 $0 FILES CLOSED FOR INCOMPLETENESS 0 $0 22 $327,216 95 $253,240 7 $91,316 0 $0 7 $211,670 0 $0
Aggregated Statistics For Year 2006(Based on 2 full and 10 partial tracts) A) FHA, FSA/RHS & VA B) Conventional C) Refinancings D) Home Improvement Loans E) Loans on Dwellings For 5+ Families F) Non-occupant Loans on G) Loans On Manufactured Number Average Value Number Average Value Number Average Value Number Average Value Number Average Value Number Average Value Number Average Value
LOANS ORIGINATED 15 $261,505 1,632 $231,114 1,427 $235,383 164 $125,035 4 $1,436,120 206 $213,940 0 $0 APPLICATIONS APPROVED, NOT ACCEPTED 0 $0 138 $217,133 240 $233,069 40 $65,191 0 $0 31 $220,438 1 $5,990 APPLICATIONS DENIED 2 $283,065 292 $198,961 561 $246,459 85 $115,040 1 $183,700 58 $226,236 0 $0 APPLICATIONS WITHDRAWN 2 $293,905 181 $229,539 399 $249,583 26 $126,769 0 $0 29 $250,098 1 $239,390 FILES CLOSED FOR INCOMPLETENESS 0 $0 41 $249,023 147 $258,004 12 $113,216 0 $0 11 $229,162 0 $0
Aggregated Statistics For Year 2005(Based on 2 full and 10 partial tracts) A) FHA, FSA/RHS & VA B) Conventional C) Refinancings D) Home Improvement Loans E) Loans on Dwellings For 5+ Families F) Non-occupant Loans on G) Loans On Manufactured Number Average Value Number Average Value Number Average Value Number Average Value Number Average Value Number Average Value Number Average Value
LOANS ORIGINATED 19 $190,598 1,872 $234,842 1,908 $238,482 133 $128,072 2 $1,886,355 295 $190,795 2 $169,005 APPLICATIONS APPROVED, NOT ACCEPTED 3 $300,913 146 $226,542 239 $206,432 27 $95,020 0 $0 40 $203,490 0 $0 APPLICATIONS DENIED 2 $245,215 286 $192,769 602 $224,415 93 $93,323 0 $0 83 $189,850 1 $34,230 APPLICATIONS WITHDRAWN 1 $233,480 220 $214,409 609 $225,885 39 $156,213 1 $330,930 53 $167,318 1 $362,610 FILES CLOSED FOR INCOMPLETENESS 2 $244,175 44 $245,136 131 $238,214 11 $64,260 0 $0 11 $157,108 0 $0
Aggregated Statistics For Year 2004(Based on 2 full and 10 partial tracts) A) FHA, FSA/RHS & VA B) Conventional C) Refinancings D) Home Improvement Loans E) Loans on Dwellings For 5+ Families F) Non-occupant Loans on G) Loans On Manufactured Number Average Value Number Average Value Number Average Value Number Average Value Number Average Value Number Average Value Number Average Value
LOANS ORIGINATED 69 $187,511 1,668 $217,085 2,023 $209,286 101 $114,001 1 $892,180 231 $165,217 5 $45,160 APPLICATIONS APPROVED, NOT ACCEPTED 0 $0 133 $213,860 261 $187,843 33 $74,023 0 $0 26 $153,708 1 $30,010 APPLICATIONS DENIED 9 $202,742 199 $179,872 578 $182,857 100 $86,664 1 $1,617,540 46 $142,102 1 $37,080 APPLICATIONS WITHDRAWN 15 $188,487 160 $211,980 548 $195,831 37 $77,453 0 $0 31 $149,751 2 $58,525 FILES CLOSED FOR INCOMPLETENESS 2 $180,750 33 $253,818 129 $208,605 8 $62,810 0 $0 9 $133,011 0 $0
Aggregated Statistics For Year 2003(Based on 2 full and 10 partial tracts) A) FHA, FSA/RHS & VA B) Conventional C) Refinancings D) Home Improvement Loans E) Loans on Dwellings For 5+ Families F) Non-occupant Loans on Number Average Value Number Average Value Number Average Value Number Average Value Number Average Value Number Average Value
LOANS ORIGINATED 139 $156,341 1,596 $207,945 4,322 $189,970 68 $42,563 1 $2,667,420 285 $139,075 APPLICATIONS APPROVED, NOT ACCEPTED 4 $157,700 121 $184,286 521 $179,185 37 $41,782 0 $0 31 $139,087 APPLICATIONS DENIED 10 $129,046 133 $186,566 686 $168,572 71 $34,657 0 $0 30 $142,622 APPLICATIONS WITHDRAWN 10 $141,712 146 $237,033 649 $172,807 11 $34,274 2 $20,480 37 $143,807 FILES CLOSED FOR INCOMPLETENESS 5 $117,564 33 $218,361 134 $177,743 3 $60,470 0 $0 7 $152,341
Aggregated Statistics For Year 2002(Based on 1 full and 5 partial tracts) A) FHA, FSA/RHS & VA B) Conventional C) Refinancings D) Home Improvement Loans E) Loans on Dwellings For 5+ Families F) Non-occupant Loans on Number Average Value Number Average Value Number Average Value Number Average Value Number Average Value Number Average Value
LOANS ORIGINATED 107 $141,345 1,180 $205,260 1,999 $198,836 46 $52,459 2 $652,060 121 $151,697 APPLICATIONS APPROVED, NOT ACCEPTED 4 $203,860 78 $186,229 188 $174,349 15 $33,681 0 $0 7 $105,014 APPLICATIONS DENIED 5 $107,162 71 $174,460 272 $155,159 28 $18,762 0 $0 15 $104,164 APPLICATIONS WITHDRAWN 12 $132,389 111 $218,374 284 $155,290 7 $70,639 0 $0 15 $120,631 FILES CLOSED FOR INCOMPLETENESS 3 $105,823 21 $174,864 56 $153,961 1 $40,110 0 $0 11 $100,122
Aggregated Statistics For Year 2001(Based on 1 full and 5 partial tracts) A) FHA, FSA/RHS & VA B) Conventional C) Refinancings D) Home Improvement Loans E) Loans on Dwellings For 5+ Families F) Non-occupant Loans on Number Average Value Number Average Value Number Average Value Number Average Value Number Average Value Number Average Value
LOANS ORIGINATED 158 $127,556 884 $167,879 1,306 $178,935 46 $42,709 1 $4,884,020 80 $132,794 APPLICATIONS APPROVED, NOT ACCEPTED 9 $115,992 65 $178,649 110 $128,428 14 $31,871 0 $0 11 $120,588 APPLICATIONS DENIED 8 $149,942 58 $150,194 237 $123,953 45 $22,032 0 $0 12 $119,505 APPLICATIONS WITHDRAWN 6 $136,740 79 $172,993 206 $139,444 14 $24,794 0 $0 8 $151,041 FILES CLOSED FOR INCOMPLETENESS 2 $87,130 13 $141,365 46 $152,416 1 $18,020 0 $0 4 $89,370
Aggregated Statistics For Year 2000(Based on 1 full and 5 partial tracts) A) FHA, FSA/RHS & VA B) Conventional C) Refinancings D) Home Improvement Loans E) Loans on Dwellings For 5+ Families F) Non-occupant Loans on Number Average Value Number Average Value Number Average Value Number Average Value Number Average Value Number Average Value
LOANS ORIGINATED 205 $127,750 749 $154,611 186 $131,702 43 $31,989 1 $506,950 38 $91,411 APPLICATIONS APPROVED, NOT ACCEPTED 6 $112,430 77 $122,482 41 $121,778 12 $31,886 0 $0 8 $89,008 APPLICATIONS DENIED 13 $103,642 66 $110,665 163 $85,228 51 $30,140 0 $0 11 $61,758 APPLICATIONS WITHDRAWN 15 $110,159 69 $151,268 75 $101,435 18 $33,699 0 $0 7 $100,811 FILES CLOSED FOR INCOMPLETENESS 7 $93,389 11 $176,361 24 $98,665 2 $32,700 0 $0 0 $0
Aggregated Statistics For Year 1999(Based on 1 full and 7 partial tracts) A) FHA, FSA/RHS & VA B) Conventional C) Refinancings D) Home Improvement Loans F) Non-occupant Loans on Number Average Value Number Average Value Number Average Value Number Average Value Number Average Value
LOANS ORIGINATED 309 $115,662 726 $145,972 669 $125,225 88 $13,724 59 $80,119 APPLICATIONS APPROVED, NOT ACCEPTED 3 $112,523 48 $125,658 104 $115,304 33 $25,800 9 $111,631 APPLICATIONS DENIED 24 $111,736 84 $141,545 242 $101,362 69 $18,607 19 $68,277 APPLICATIONS WITHDRAWN 24 $123,888 90 $136,412 206 $106,589 16 $62,689 15 $73,345 FILES CLOSED FOR INCOMPLETENESS 6 $81,795 13 $179,892 38 $100,723 3 $40,150 1 $119,460
Detailed mortgage data for all 12 tracts in Gaithersburg, MD
Private Mortgage Insurance Companies Aggregated Statistics For Year 2009(Based on 2 full and 9 partial tracts) A) Conventional B) Refinancings C) Non-occupant Loans on Number Average Value Number Average Value Number Average Value
LOANS ORIGINATED 36 $310,368 17 $322,193 0 $0 APPLICATIONS APPROVED, NOT ACCEPTED 16 $276,877 9 $355,144 1 $107,830 APPLICATIONS DENIED 5 $307,016 7 $275,519 0 $0 APPLICATIONS WITHDRAWN 6 $363,850 11 $325,188 0 $0 FILES CLOSED FOR INCOMPLETENESS 1 $268,450 0 $0 0 $0
Aggregated Statistics For Year 2008(Based on 2 full and 10 partial tracts) A) Conventional B) Refinancings C) Non-occupant Loans on Number Average Value Number Average Value Number Average Value
LOANS ORIGINATED 112 $312,863 39 $299,432 3 $225,623 APPLICATIONS APPROVED, NOT ACCEPTED 49 $298,806 30 $311,738 2 $287,630 APPLICATIONS DENIED 11 $256,875 8 $305,208 2 $219,715 APPLICATIONS WITHDRAWN 7 $296,177 3 $351,663 0 $0 FILES CLOSED FOR INCOMPLETENESS 5 $279,272 3 $304,770 1 $371,990
Aggregated Statistics For Year 2007(Based on 2 full and 10 partial tracts) A) Conventional B) Refinancings C) Non-occupant Loans on Number Average Value Number Average Value Number Average Value
LOANS ORIGINATED 183 $293,884 67 $301,269 7 $217,379 APPLICATIONS APPROVED, NOT ACCEPTED 17 $304,589 15 $310,777 3 $276,267 APPLICATIONS DENIED 6 $281,890 2 $365,880 0 $0 APPLICATIONS WITHDRAWN 13 $269,503 6 $221,588 3 $202,107 FILES CLOSED FOR INCOMPLETENESS 0 $0 0 $0 0 $0
Aggregated Statistics For Year 2006(Based on 2 full and 9 partial tracts) A) Conventional B) Refinancings C) Non-occupant Loans on Number Average Value Number Average Value Number Average Value
LOANS ORIGINATED 60 $269,223 35 $296,563 1 $145,240 APPLICATIONS APPROVED, NOT ACCEPTED 9 $329,297 10 $279,037 0 $0 APPLICATIONS DENIED 0 $0 3 $295,277 0 $0 APPLICATIONS WITHDRAWN 5 $260,652 7 $288,240 1 $209,790 FILES CLOSED FOR INCOMPLETENESS 0 $0 0 $0 0 $0
Aggregated Statistics For Year 2005(Based on 2 full and 10 partial tracts) A) Conventional B) Refinancings C) Non-occupant Loans on Number Average Value Number Average Value Number Average Value
LOANS ORIGINATED 74 $256,278 38 $233,604 8 $223,236 APPLICATIONS APPROVED, NOT ACCEPTED 15 $251,588 13 $212,573 1 $263,560 APPLICATIONS DENIED 2 $326,865 1 $440,630 2 $214,590 APPLICATIONS WITHDRAWN 3 $343,293 5 $229,234 2 $261,160 FILES CLOSED FOR INCOMPLETENESS 1 $100,630 0 $0 0 $0
Aggregated Statistics For Year 2004(Based on 2 full and 10 partial tracts) A) Conventional B) Refinancings C) Non-occupant Loans on Number Average Value Number Average Value Number Average Value
LOANS ORIGINATED 153 $203,796 58 $205,906 16 $175,918 APPLICATIONS APPROVED, NOT ACCEPTED 19 $209,538 21 $214,164 4 $213,888 APPLICATIONS DENIED 4 $216,755 1 $321,120 3 $201,943 APPLICATIONS WITHDRAWN 8 $141,659 11 $196,635 3 $93,583 FILES CLOSED FOR INCOMPLETENESS 2 $304,385 1 $113,970 0 $0
Aggregated Statistics For Year 2003(Based on 2 full and 10 partial tracts) A) Conventional B) Refinancings C) Non-occupant Loans on Number Average Value Number Average Value Number Average Value
LOANS ORIGINATED 236 $197,517 131 $182,496 26 $136,945 APPLICATIONS APPROVED, NOT ACCEPTED 18 $202,298 29 $191,605 2 $110,290 APPLICATIONS DENIED 1 $112,660 4 $274,980 1 $89,850 APPLICATIONS WITHDRAWN 12 $204,669 11 $185,065 1 $176,660 FILES CLOSED FOR INCOMPLETENESS 0 $0 0 $0 0 $0
Aggregated Statistics For Year 2002(Based on 1 full and 5 partial tracts) A) Conventional B) Refinancings C) Non-occupant Loans on Number Average Value Number Average Value Number Average Value
LOANS ORIGINATED 145 $199,959 66 $203,485 13 $145,985 APPLICATIONS APPROVED, NOT ACCEPTED 15 $170,307 20 $183,958 3 $128,390 APPLICATIONS DENIED 4 $194,765 2 $109,500 1 $61,900 APPLICATIONS WITHDRAWN 3 $275,047 4 $133,125 1 $258,400 FILES CLOSED FOR INCOMPLETENESS 0 $0 1 $162,790 0 $0
Aggregated Statistics For Year 2001(Based on 1 full and 5 partial tracts) A) Conventional B) Refinancings C) Non-occupant Loans on Number Average Value Number Average Value Number Average Value
LOANS ORIGINATED 131 $171,134 67 $182,971 8 $78,459 APPLICATIONS APPROVED, NOT ACCEPTED 22 $196,886 19 $181,644 3 $120,160 APPLICATIONS DENIED 1 $338,670 2 $162,245 1 $71,800 APPLICATIONS WITHDRAWN 4 $147,122 7 $173,510 1 $67,090 FILES CLOSED FOR INCOMPLETENESS 3 $170,823 0 $0 0 $0
Aggregated Statistics For Year 2000(Based on 1 full and 5 partial tracts) A) Conventional B) Refinancings C) Non-occupant Loans on Number Average Value Number Average Value Number Average Value
LOANS ORIGINATED 122 $157,247 18 $169,914 8 $78,998 APPLICATIONS APPROVED, NOT ACCEPTED 14 $192,629 3 $166,440 0 $0 APPLICATIONS DENIED 2 $128,290 3 $208,107 1 $95,340 APPLICATIONS WITHDRAWN 4 $179,040 1 $158,900 1 $43,320 FILES CLOSED FOR INCOMPLETENESS 0 $0 1 $135,780 0 $0
Aggregated Statistics For Year 1999(Based on 1 full and 7 partial tracts) A) Conventional B) Refinancings C) Non-occupant Loans on Number Average Value Number Average Value Number Average Value
LOANS ORIGINATED 154 $152,287 108 $159,947 7 $135,896 APPLICATIONS APPROVED, NOT ACCEPTED 22 $140,415 23 $145,416 4 $125,832 APPLICATIONS DENIED 6 $168,678 5 $208,780 2 $108,625 APPLICATIONS WITHDRAWN 3 $202,510 7 $128,783 1 $57,400 FILES CLOSED FOR INCOMPLETENESS 3 $167,763 0 $0 1 $64,200
Fire-safe hotels and motels in Gaithersburg, Maryland:
Comfort Inn Shady Grove, 16216 Frederick Rd, Gaithersburg, Maryland 20877 Phone: (301) 330-0023, Fax: (301) 258-1950
Econo Lodge Gaithersburg, 18715 N Frederick Ave, Gaithersburg, Maryland 20879 Phone: (301) 963-3840, Fax: (301) 948-7443
Motel 6, 497 Quince Orch Rd, Gaithersburg, Maryland 20878 Phone: (301) 977-3311, Fax: (301) 990-1053
Holiday Inn Gaithersburg, 2 Montgomery Village Ave, Gaithersburg, Maryland 20879 Phone: (301) 948-8900, Fax: (301) 258-1940
Extended Stay America - Washington, DC. - Gaithersburg - North, 205 Professional Dr, Gaithersburg, Maryland 20879 Phone: (301) 869-9814, Fax: (301) 869-9618
Extended Stay America - Washington, DC. - Gaithersburg - South, 201 Professional Dr, Gaithersburg, Maryland 20879 Phone: (301) 963-3539, Fax: (301) 963-3539
TownePlace Suites Gaithersburg, 212 Perry Pkwy, Gaithersburg, Maryland 20877 Phone: (301) 590-2300, Fax: (301) 590-0909
Hyatt Summerfield Gaithersburg, 200 Skidmore Blvd, Gaithersburg, Maryland 20877 Phone: (301) 527-6000, Fax: (301) 527-1800
5 other hotels and motels
All 13 fire-safe hotels and motels in Gaithersburg, Maryland
Most common first names in Gaithersburg, MD among deceased individuals Name Count Lived (average)
Mary 252 81.0 years John 225 75.6 years William 194 76.4 years James 164 70.5 years Robert 139 71.1 years Margaret 131 83.2 years Helen 130 82.6 years Dorothy 111 81.9 years Charles 108 74.1 years Elizabeth 106 82.8 years
Most common last names in Gaithersburg, MD among deceased individuals Last name Count Lived (average)
Smith 87 73.7 years Johnson 60 78.4 years Brown 43 78.2 years Thompson 36 78.9 years Lee 35 81.7 years King 35 76.6 years Miller 34 83.1 years Williams 33 76.7 years Anderson 30 78.1 years Wilson 30 79.8 years
Gaithersburg compared to Maryland state average:
Unemployed percentage significantly below state average. Hispanic race population percentage significantly above state average. Foreign-born population percentage significantly above state average. House age below state average. Percentage of population with a bachelor's degree or higher above state average. Gaithersburg on our top lists :
#7 on the list of "Top 101 larger cities with the highest increase in house/condo value from 2000 (population 50,000+)"
#16 on the list of "Top 100 most racially diverse cities (pop. 50,000+)"
#17 on the list of "Top 101 cities with largest percentage of females in occupations: life, physical, and social science occupations (population 50,000+)"
#18 on the list of "Top 101 cities with largest percentage of males in industries: management of companies and enterprises (population 50,000+)"
#19 on the list of "Top 101 cities with the most people below the poverty level, excluding cities with 15% or more of residents in college and with the median age below 28 (population 50,000+)"
#21 on the list of "Top 101 cities with largest percentage of females in industries: wholesale trade (population 50,000+)"
#23 on the list of "Top 101 cities with largest percentage of females in industries: other services, except public administration (population 50,000+)"
#24 on the list of "Top 101 cities with largest percentage of females in industries: professional, scientific, and technical services (population 50,000+)"
#26 on the list of "Top 101 cities with largest percentage of females in occupations: computer and mathematical occupations (population 50,000+)"
#29 on the list of "Top 101 cities with largest percentage of females in occupations: health diagnosing and treating practitioners and other technical occupations (population 50,000+)"
#30 on the list of "Top 101 cities with the most people below 50% of the poverty level, excluding cities with 15% or more of residents in college and with the median age below 28 (population 50,000+)"
#33 on the list of "Top 101 cities with largest percentage of males in occupations: life, physical, and social science occupations (population 50,000+)"
#33 on the list of "Top 101 cities with largest percentage of males in industries: professional, scientific, and technical services (population 50,000+)"
#34 on the list of "Top 101 cities with largest percentage of males in occupations: community and social service occupations (population 50,000+)"
#41 on the list of "Top 101 cities with the most people having Master's or Doctorate degrees (population 50,000+)"
#44 on the list of "Top 101 cities with the most people having Doctorate degrees (population 50,000+)"
#45 on the list of "Top 101 cities with largest percentage of males in occupations: computer and mathematical occupations (population 50,000+)"
#45 on the list of "Top 101 cities with the smallest percentage of one, detached housing units in structures (20,000+ housing units)"
#60 on the list of "Top 100 cities with highest percentage of foreign-born residents (pop. 50,000+)"
#63 on the list of "Top 101 cities with the most residents born in El Salvador (population 500+)"
#50 (20850) on the list of "Top 101 zip codes with the most medium-big companies in 2005 (at least 100 employees)"
#71 (20850) on the list of "Top 101 zip codes with the most offices of lawyers in 2005"
#4 on the list of "Top 101 counties with the largest number of people without health insurance coverage in 2000 (pop. 50,000+)"
#6 on the list of "Top 101 counties with the best general health status score of residents (1-5), 3 years of data"
#10 on the list of "Top 101 counties with the highest surface withdrawal of fresh water for public supply"
#13 on the list of "Top 101 counties with the highest total withdrawal of fresh water for public supply"
#14 on the list of "Top 101 counties with the highest percentage of residents that visited a dentist within the past year"
Top Patent Applicants
Shom Ponoth (43)
John L. Magnani (37)
Reinhard Ebner (30)
Chenxi Zhu (29)
David B. Krizman (28)
Michael V. Recker (28)
William Dall'Acqua (27)
Todd Hembrough (26)
Shalini Sharma (26)
Sek Chung Fung (24)
Total of 2375 patent applications in 2008-2024.
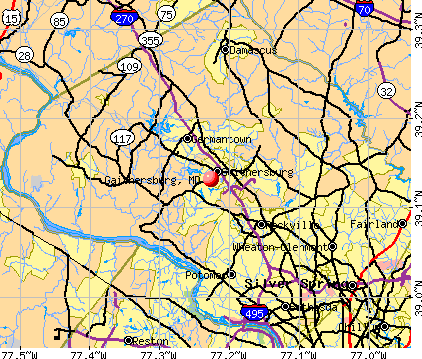


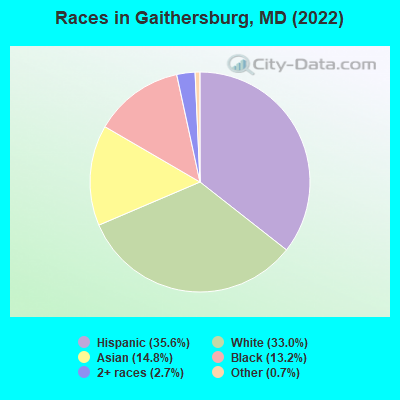
 Recent articles from our blog. Our writers, many of them Ph.D. graduates or candidates, create easy-to-read articles on a wide variety of topics.


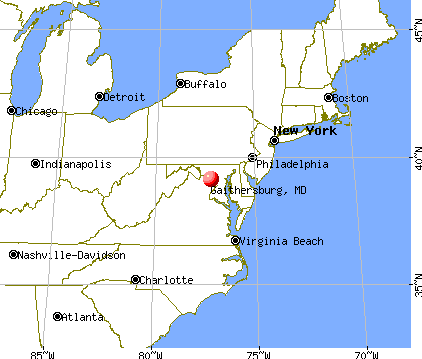
 (19.0 miles
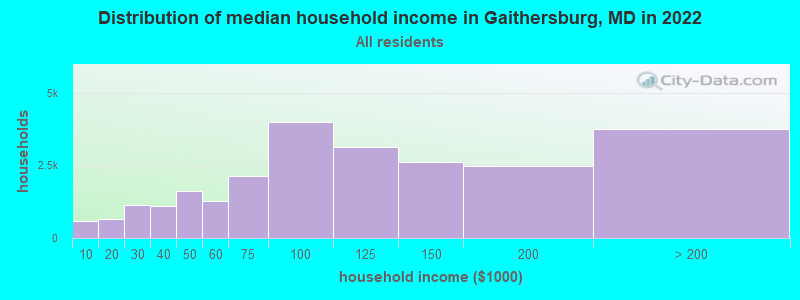
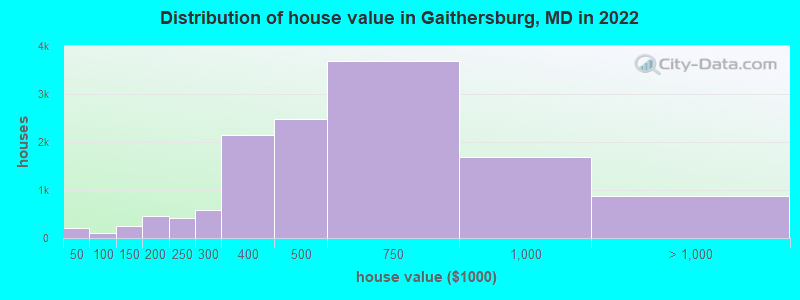
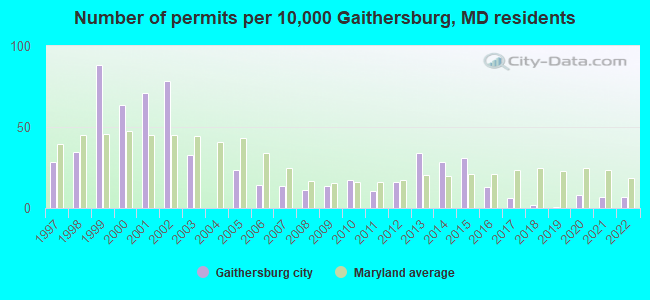
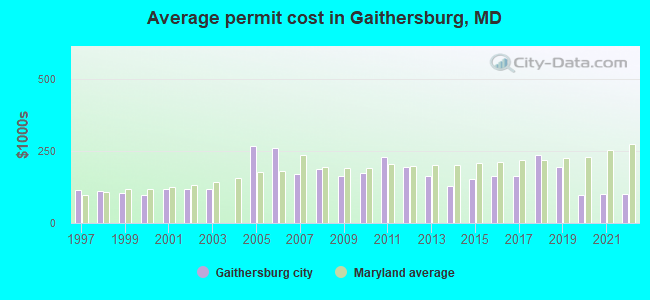
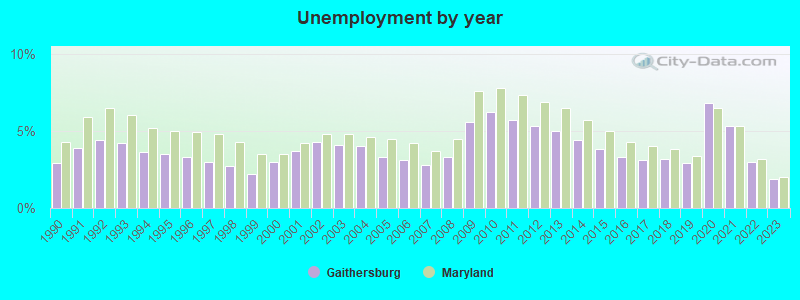
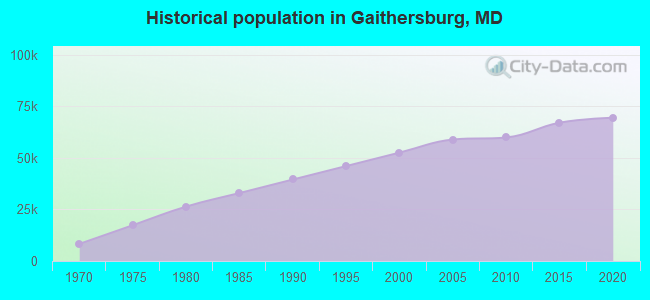
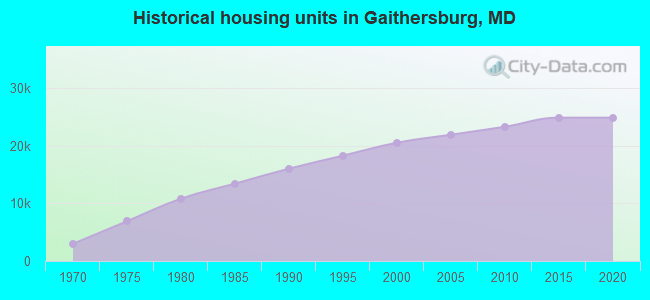
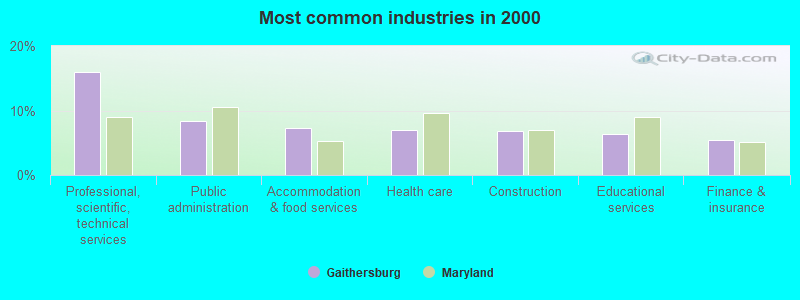
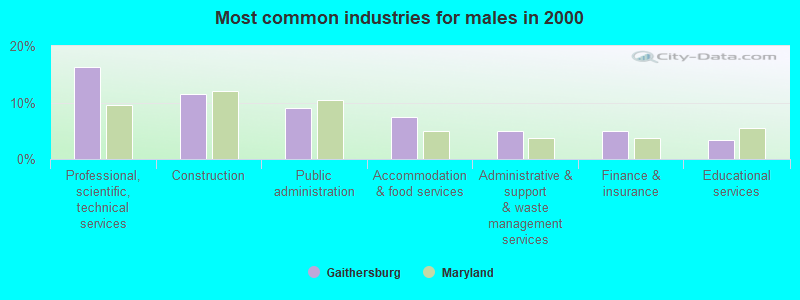
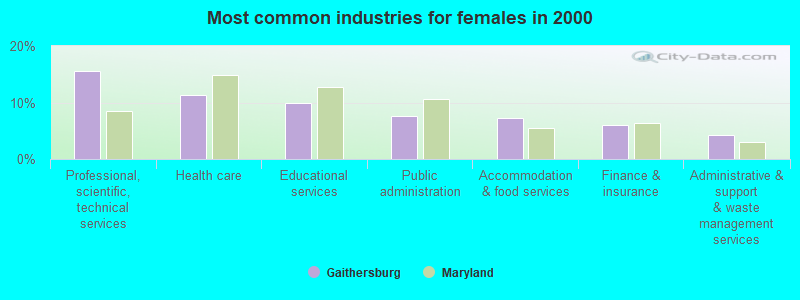
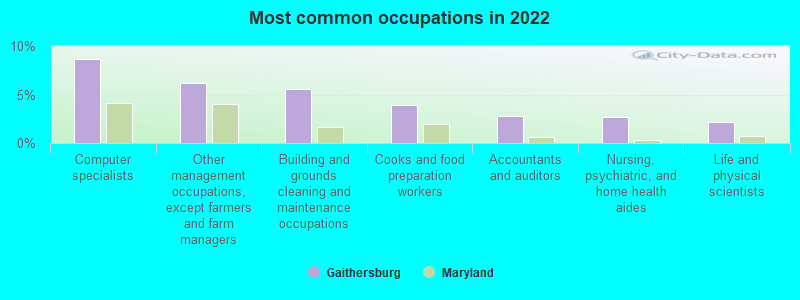
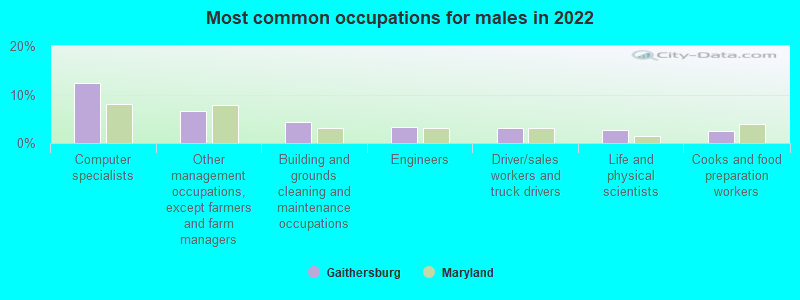
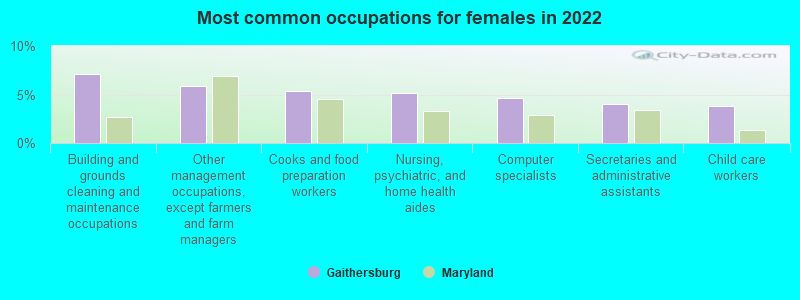
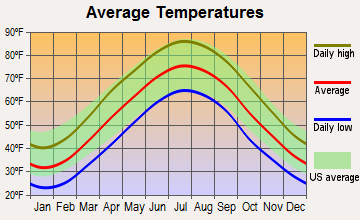
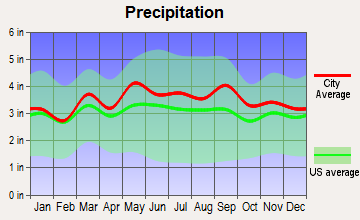
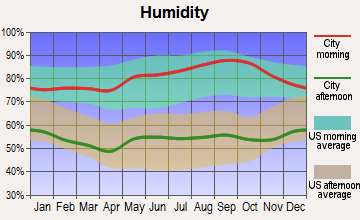
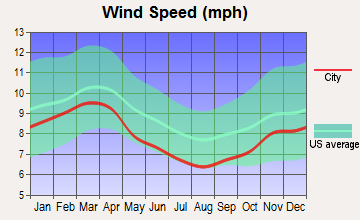
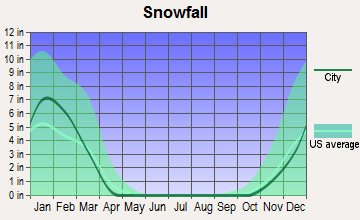
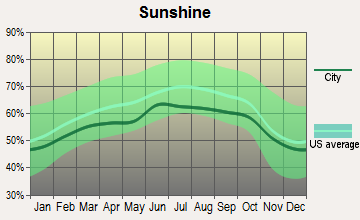
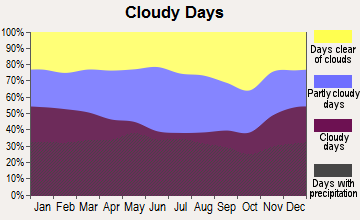
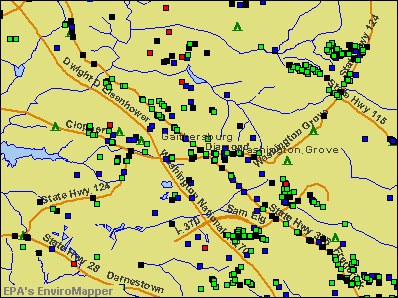

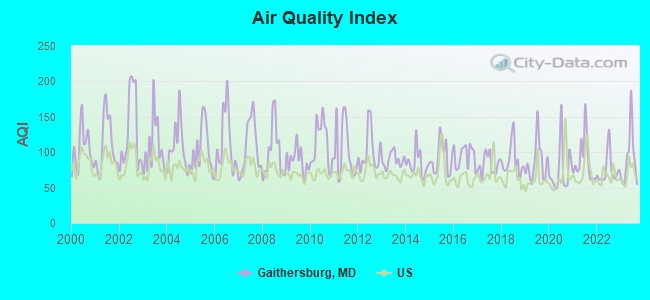
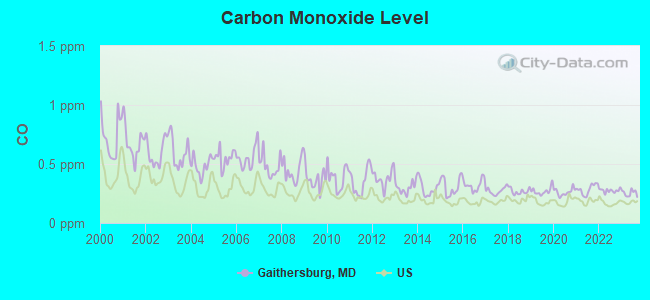
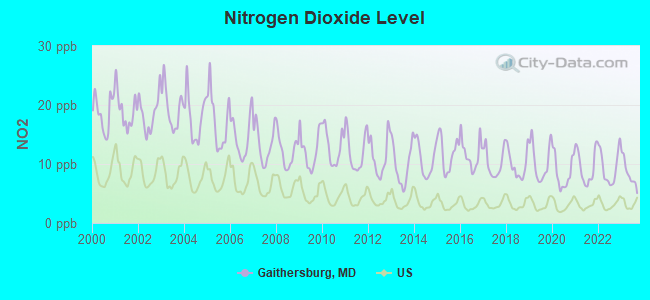
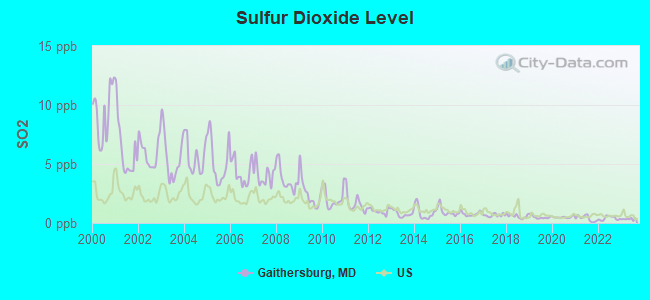
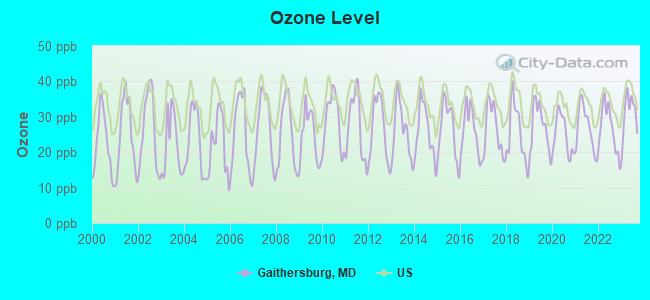
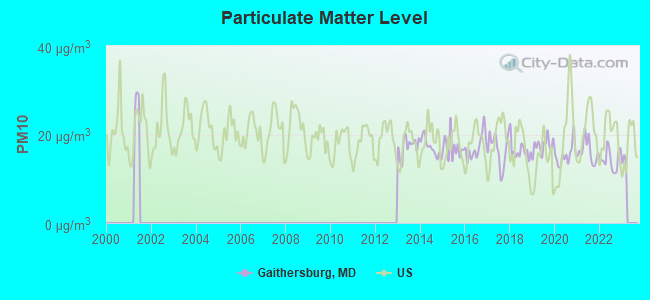
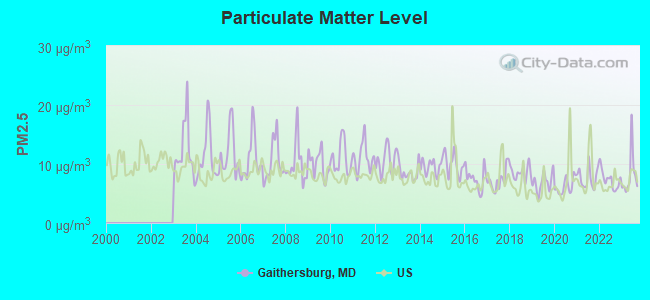
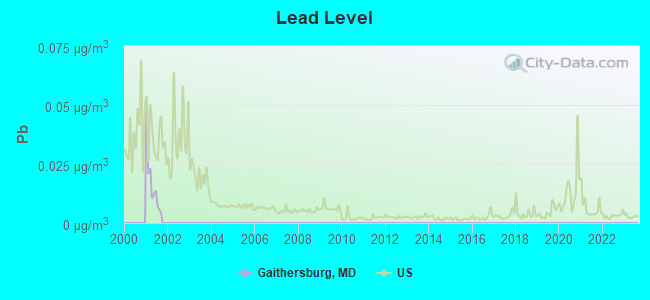
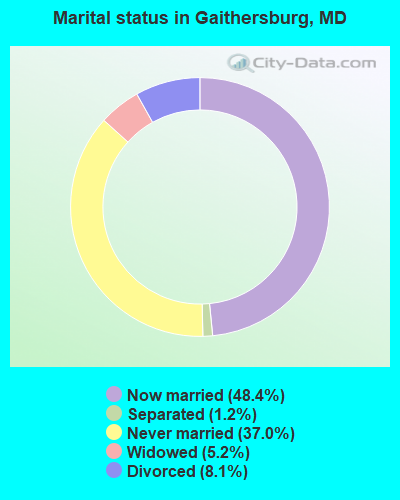
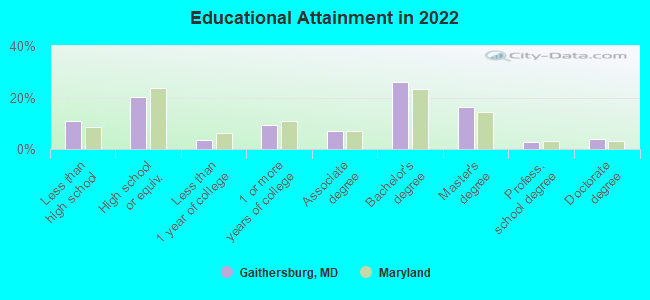
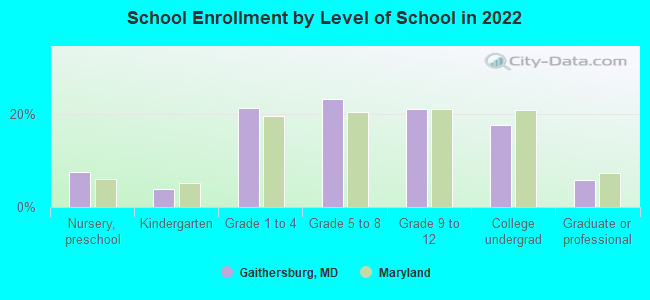
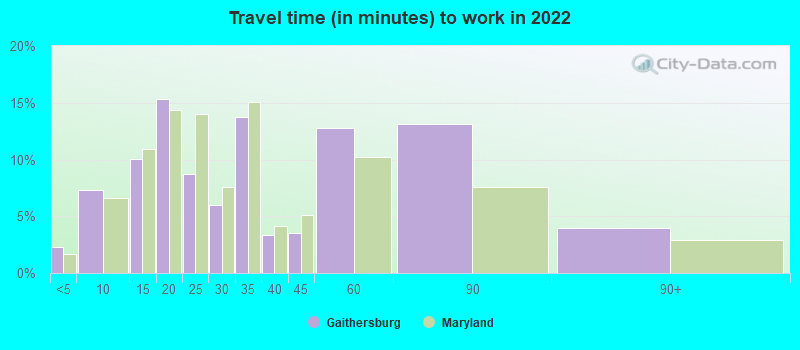
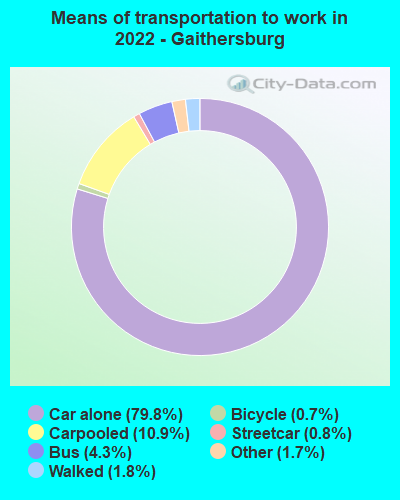
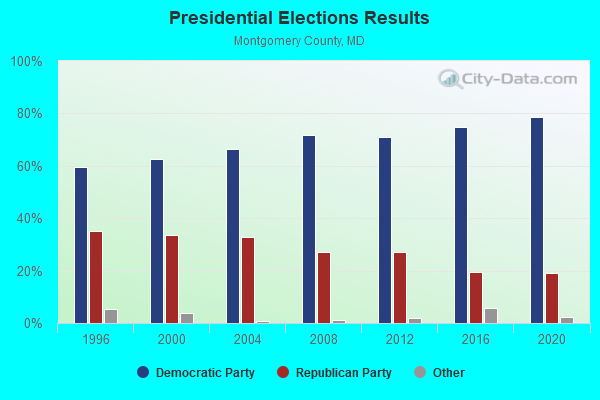
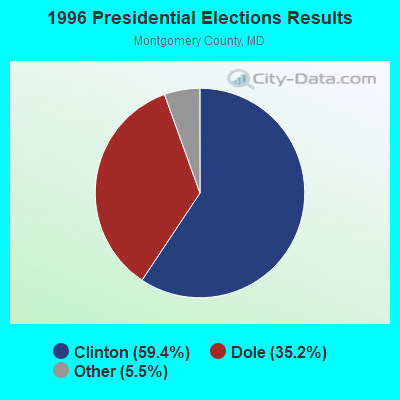
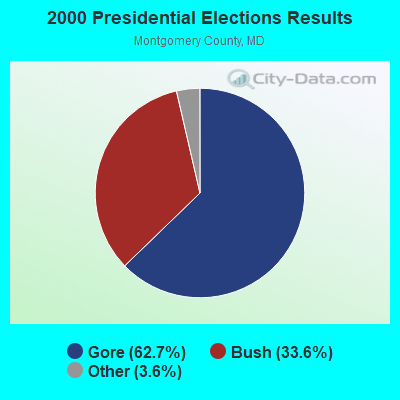
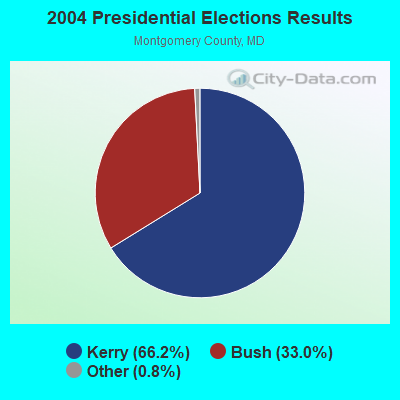
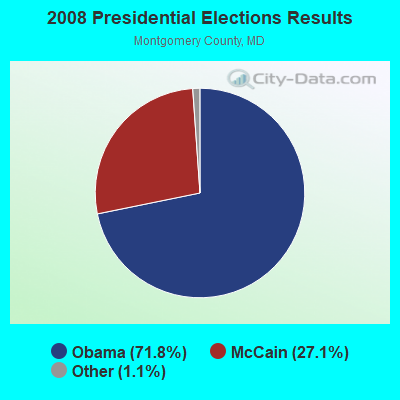
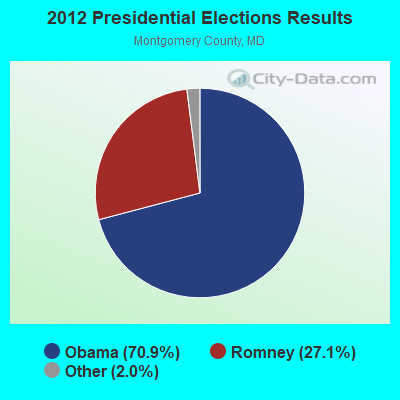
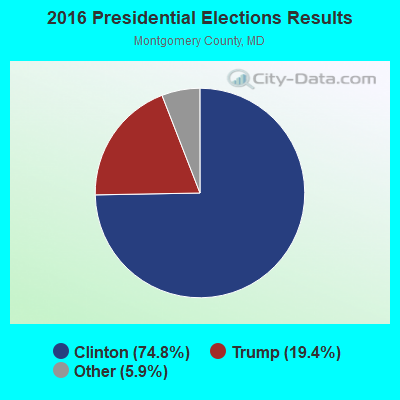
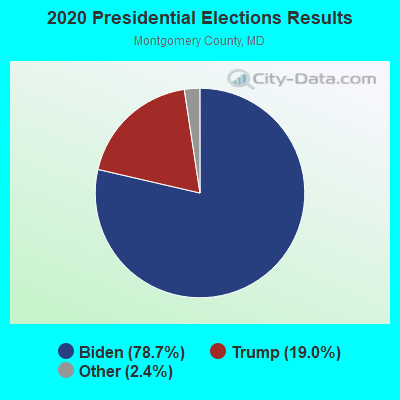
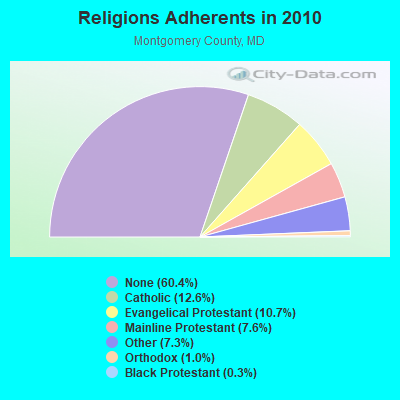
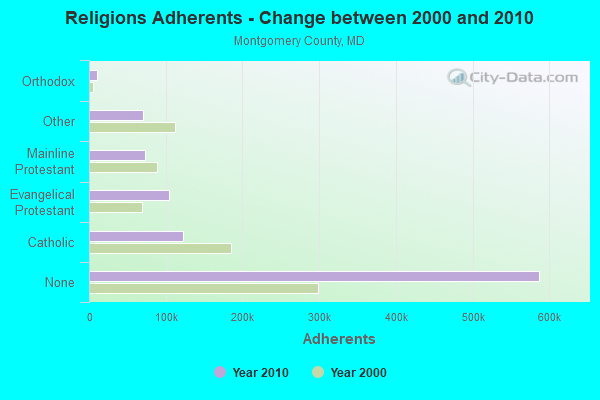
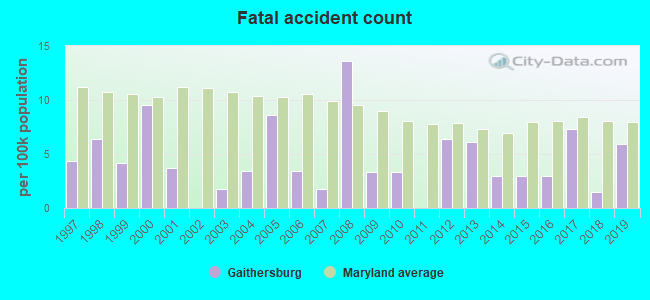
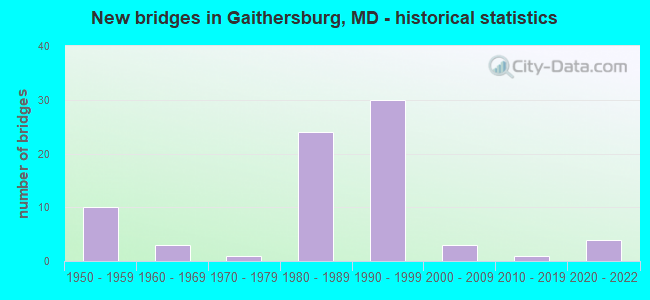
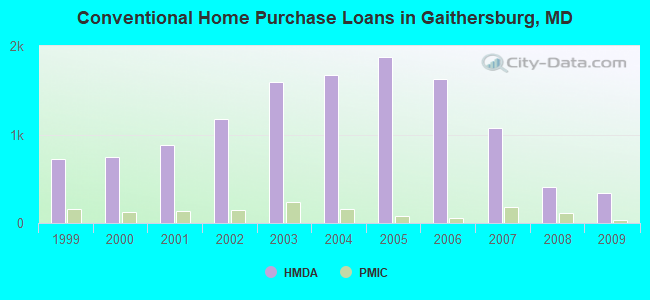
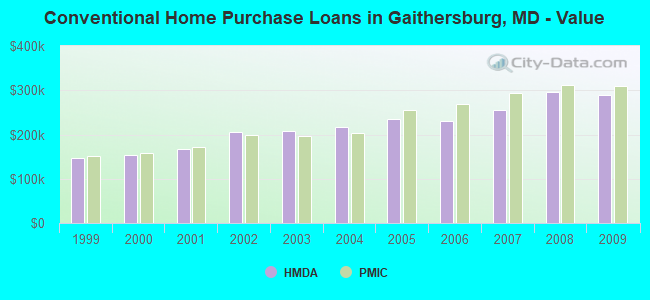
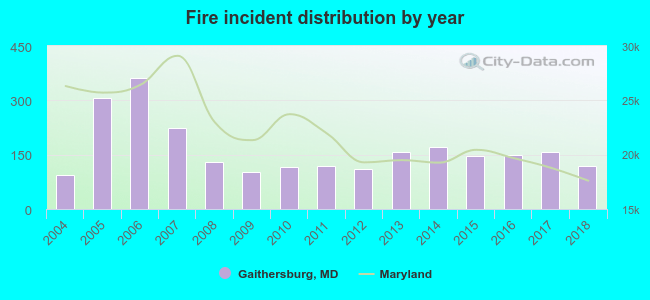 According to the data from the years 2004 - 2018 the average number of fire incidents per year is 164. The highest number of fires - 362 took place in 2006, and the least - 93 in 2004. The data has an increasing trend.
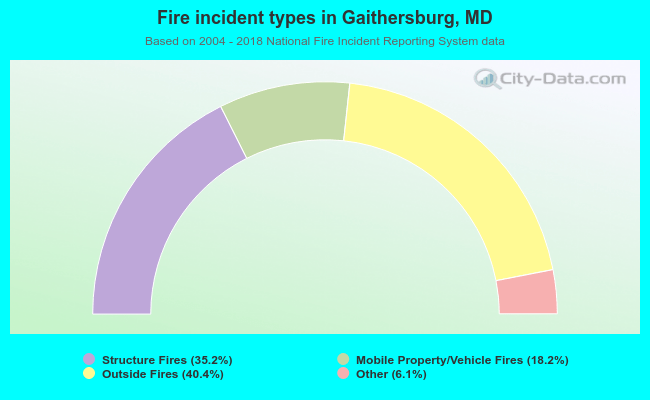 When looking into fire subcategories, the most incidents belonged to: Outside Fires (40.4%), and Structure Fires (35.2%).