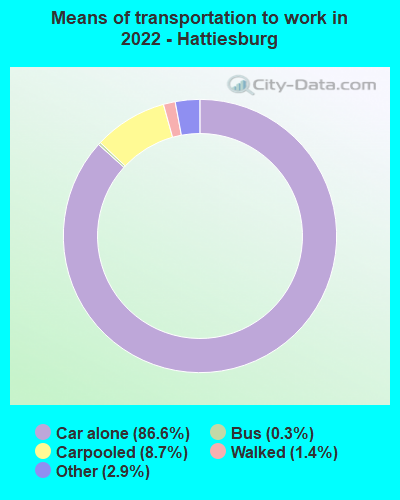
Hattiesburg, Mississippi
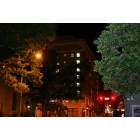
Hattiesburg: Regions office building in Downtown
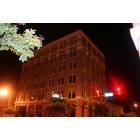
Hattiesburg: Building in Downtown
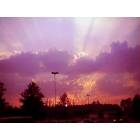
Hattiesburg: Hattiesburg Sunset
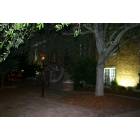
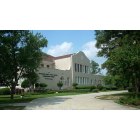
Hattiesburg: Hattiesburg Cultural Center in Downtown
Hattiesburg: Old Camp School/ Mamie St.

Hattiesburg: Downtown Mural(a)
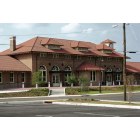
Hattiesburg: Hattiesburg Railroad Depot (view from east)
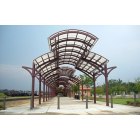
Hattiesburg: Railroad Depot South Concourse

Hattiesburg: Old Snow Cone House
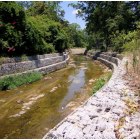
Hattiesburg: Gordon's Creek @ S.21st and Adeline

Hattiesburg: Downtown Mural(b)
- see
33
more - add
your


Submit your own pictures of this city and show them to the world
- OSM Map
- General Map
- Google Map
- MSN Map
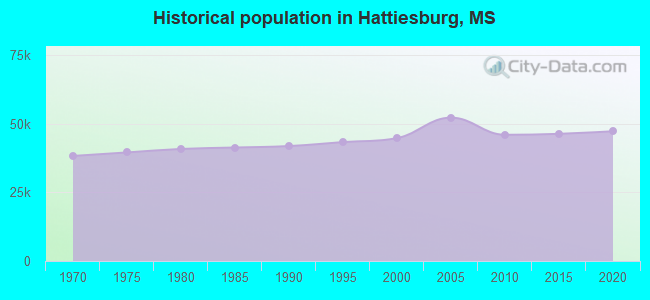
Population change since 2000: +8.2%
 |
| Males: 21,741 | |
| Females: 26,714 |
| Median resident age: | 29.0 years |
| Mississippi median age: | 38.9 years |
Zip codes: 39406.
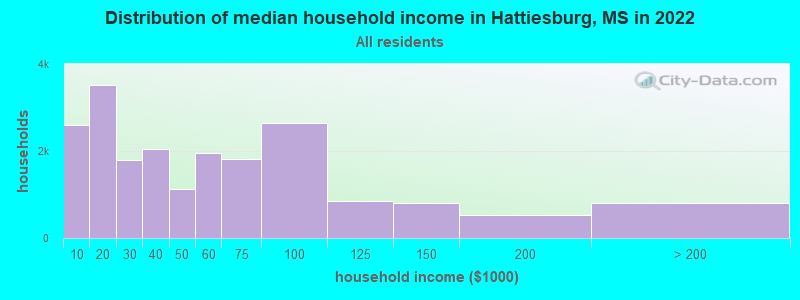
| Hattiesburg: | $44,453 |
| MS: | $52,719 |
Estimated per capita income in 2022: $25,598 (it was $15,102 in 2000)
Hattiesburg city income, earnings, and wages data
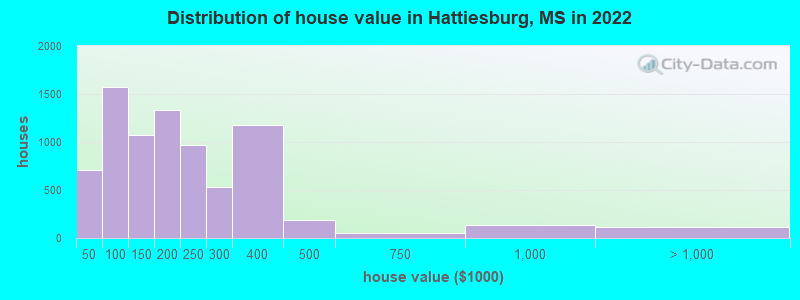
Estimated median house or condo value in 2022: $191,089 (it was $65,400 in 2000)
| Hattiesburg: | $191,089 |
| MS: | $162,500 |
Median gross rent in 2022: $857.
(22.0% for White Non-Hispanic residents, 40.0% for Black residents, 24.5% for Hispanic or Latino residents, 40.2% for American Indian residents, 86.5% for Native Hawaiian and other Pacific Islander residents, 32.2% for other race residents, 20.2% for two or more races residents)
Detailed information about poverty and poor residents in Hattiesburg, MS


Compare current foreclosures in Hattiesburg, MS:
| Photo | Address | Area | Beds / Baths | Price | Details |
|---|---|---|---|---|---|

|
#1
Camp St
Hattiesburg, MS 39401
|
2,000 sq. feet
|
2 baths 4 beds |
$209,000
|
show details |

|
#2
Buschman St
Hattiesburg, MS 39401
|
1,764 sq. feet
|
2 baths 3 beds |
$44,900
|
show details |

|
#3
S 11th Ave
Hattiesburg, MS 39401
|
1,648 sq. feet
|
2 baths 2 beds |
$76,900
|
show details |

|
#4
Morrell Cir
Hattiesburg, MS 39402
|
8,094 sq. feet
|
6 baths 7 beds |
show details | |

|
#5
S 15th Ave
Hattiesburg, MS 39401
|
1,564 sq. feet
|
3 baths 4 beds |
show details | |

|
#6
Southampton Rd
Hattiesburg, MS 39401
|
1,676 sq. feet
|
3 baths 3 beds |
show details | |

|
#7
Comanche Dr
Hattiesburg, MS 39402
|
4,454 sq. feet
|
3 baths 4 beds |
show details | |

|
#8
Poplar Dr
Hattiesburg, MS 39402
|
1,440 sq. feet
|
3 baths 4 beds |
show details | |

|
#9
Hacienda Ave
Hattiesburg, MS 39402
|
1,408 sq. feet
|
2 baths - beds |
show details | |

|
#10
Lexington Dr
Hattiesburg, MS 39402
|
1,678 sq. feet
|
2 baths - beds |
show details |
| Photo | Address | Area | Beds / Baths | Price | Details |
|---|---|---|---|---|---|

|
#11
Jackson Rd
Hattiesburg, MS 39402
|
1,525 sq. feet
|
1 baths - beds |
show details | |

|
#12
Ida Ave
Hattiesburg, MS 39401
|
1,193 sq. feet
|
1 baths - beds |
show details | |

|
#13
Lakewood Loop
Hattiesburg, MS 39402
|
1,102 sq. feet
|
1 baths - beds |
show details | |

|
#14
E 7th St
Hattiesburg, MS 39401
|
1,490 sq. feet
|
1 baths - beds |
show details | |

|
#15
S 34th Ave
Hattiesburg, MS 39402
|
1,488 sq. feet
|
1 baths - beds |
show details | |

|
#16
Cherokee Rd
Hattiesburg, MS 39402
|
1,338 sq. feet
|
1 baths - beds |
show details | |

|
#17
Old Highway 49 E
Hattiesburg, MS 39401
|
952 sq. feet
|
1 baths - beds |
show details | |

|
#18
Gillis Rd
Hattiesburg, MS 39401
|
1,947 sq. feet
|
1 baths - beds |
show details | |

|
#19
E 7th St
Hattiesburg, MS 39401
|
1,400 sq. feet
|
1 baths - beds |
show details | |

|
#20
Mary Magdalene Rd
Hattiesburg, MS 39401
|
3,333 sq. feet
|
1 baths - beds |
show details |
| Photo | Address | Area | Beds / Baths | Price | Details |
|---|---|---|---|---|---|

|
#21
Anita Dr
Hattiesburg, MS 39401
|
1,274 sq. feet
|
1 baths - beds |
show details | |

|
#22
Miller St
Hattiesburg, MS 39401
|
1,458 sq. feet
|
1 baths - beds |
show details | |

|
#23
Lincoln Rd Apt 6
Hattiesburg, MS 39402
|
900 sq. feet
|
1 baths - beds |
show details | |

|
#24
Venetian Way
Hattiesburg, MS 39401
|
1,029 sq. feet
|
1 baths - beds |
show details | |

|
#25
Pine Dr
Hattiesburg, MS 39401
|
1,370 sq. feet
|
1 baths - beds |
show details | |

|
#26
Quinn St
Hattiesburg, MS 39401
|
1,511 sq. feet
|
1 baths - beds |
show details | |

|
#27
Lake Estates Dr
Hattiesburg, MS 39402
|
2,549 sq. feet
|
2 baths - beds |
show details | |

|
#28
Anita Dr
Hattiesburg, MS 39401
|
1,422 sq. feet
|
1 baths - beds |
show details | |

|
#29
W 5th St
Hattiesburg, MS 39401
|
1,050 sq. feet
|
1 baths - beds |
show details | |

|
#30
Sandlewood Dr
Hattiesburg, MS 39402
|
2,454 sq. feet
|
2 baths - beds |
show details |
| Photo | Address | Area | Beds / Baths | Price | Details |
|---|---|---|---|---|---|

|
#31
Ashford Cir
Hattiesburg, MS 39401
|
1,280 sq. feet
|
1 baths - beds |
show details | |

|
#32
Ralston Rd
Hattiesburg, MS 39401
|
1,630 sq. feet
|
2 baths - beds |
show details | |

|
#33
S 34th Ave
Hattiesburg, MS 39402
|
1,770 sq. feet
|
1 baths - beds |
show details | |

|
#34
Longstreet Dr
Hattiesburg, MS 39401
|
1,460 sq. feet
|
1 baths - beds |
show details | |

|
#35
Hall Ave
Hattiesburg, MS 39401
|
1,680 sq. feet
|
1 baths - beds |
show details | |

|
#36
S 34th Ave
Hattiesburg, MS 39402
|
2,197 sq. feet
|
1 baths - beds |
show details | |

|
#37
Glenwood Dr
Hattiesburg, MS 39401
|
1,512 sq. feet
|
1 baths - beds |
show details | |

|
#38
River Rd
Hattiesburg, MS 39401
|
1,960 sq. feet
|
1 baths - beds |
show details | |

|
#39
Tillery Dr
Hattiesburg, MS 39401
|
1,456 sq. feet
|
1 baths - beds |
show details | |

|
#40
Mcinnis Spring Rd
Hattiesburg, MS 39401
|
1,025 sq. feet
|
1 baths - beds |
show details |
| Photo | Address | Area | Beds / Baths | Price | Details |
|---|---|---|---|---|---|

|
#41
Northgate Rd # 4
Hattiesburg, MS 39401
|
1,620 sq. feet
|
1 baths - beds |
show details | |

|
#42
Red Oak Ln
Hattiesburg, MS 39402
|
- sq. feet
|
- baths - beds |
show details | |

|
#43
Refuge Ln
Hattiesburg, MS 39402
|
- sq. feet
|
- baths - beds |
show details | |

|
#44
Lake Forgetful # 606
Hattiesburg, MS 39402
|
- sq. feet
|
- baths - beds |
show details | |

|
#45
Poplar Dr
Hattiesburg, MS 39402
|
2,451 sq. feet
|
- baths - beds |
show details | |

|
#46
Corner Oaks Dr
Hattiesburg, MS 39402
|
1,391 sq. feet
|
- baths - beds |
show details | |

|
#47
Lakeland Dr
Hattiesburg, MS 39402
|
- sq. feet
|
- baths - beds |
show details | |

|
#48
I H Rouse Rd
Hattiesburg, MS 39401
|
1,152 sq. feet
|
- baths - beds |
show details | |

|
#49
Windwood Trce
Hattiesburg, MS 39402
|
2,870 sq. feet
|
- baths - beds |
show details | |

|
Check over 1 million property listings on Foreclosure.com!
|
browse all offers | |||


- 24,36050.6%Black alone
- 19,15739.8%White alone
- 2,4215.0%Two or more races
- 1,7983.7%Hispanic
- 3540.7%Asian alone
- 1360.3%American Indian alone
- 720.1%Native Hawaiian and Other
Pacific Islander alone - 90.02%Other race alone
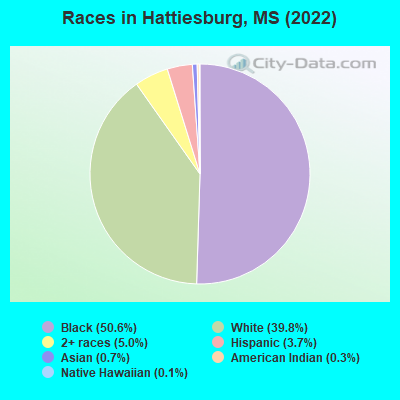
Races in Hattiesburg detailed stats: ancestries, foreign born residents, place of birth
According to our research of Mississippi and other state lists, there were 185 registered sex offenders living in Hattiesburg, Mississippi as of April 27, 2024.
The ratio of all residents to sex offenders in Hattiesburg is 253 to 1.
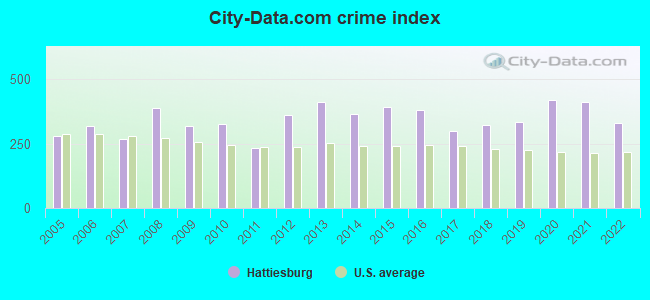
The City-Data.com crime index weighs serious crimes and violent crimes more heavily. Higher means more crime, U.S. average is 246.1. It adjusts for the number of visitors and daily workers commuting into cities.
- means the value is smaller than the state average.- means the value is about the same as the state average.
- means the value is bigger than the state average.
- means the value is much bigger than the state average.
Crime rate in Hattiesburg detailed stats: murders, rapes, robberies, assaults, burglaries, thefts, arson
Full-time law enforcement employees in 2021, including police officers: 164 (104 officers - 87 male; 17 female).
| Officers per 1,000 residents here: | 2.27 |
| Mississippi average: | 2.18 |
 Recent articles from our blog. Our writers, many of them Ph.D. graduates or candidates, create easy-to-read articles on a wide variety of topics.


 | Hattiesburg Extreme Weather (8 replies) |
| Hattiesburg or Brandon (17 replies) |
| Hattiesburg or Semmes Al (6 replies) |
| Hattiesburg- the forgotten college town? (48 replies) |
| Upscale but not snobby, impressive downtown, very safe, no college (30 replies) |
| Hattiesburg on the Move? (1 reply) |
Latest news from Hattiesburg, MS collected exclusively by city-data.com from local newspapers, TV, and radio stations
Ancestries: American (9.4%), English (5.4%), Irish (4.7%), German (2.3%), Italian (1.7%), Scottish (1.3%).
Current Local Time: CST time zone
Incorporated in 1884
Elevation: 161 feet
Land area: 49.3 square miles.
Population density: 984 people per square mile (low).
1,403 residents are foreign born (1.3% Latin America, 0.4% Asia, 0.4% Europe, 0.4% Oceania).
| This city: | 2.9% |
| Mississippi: | 2.3% |
Median real estate property taxes paid for housing units with mortgages in 2022: $1,694 (0.9%)
Median real estate property taxes paid for housing units with no mortgage in 2022: $1,272 (0.6%)
Nearest city with pop. 50,000+: Gulfport, MS  (64.7 miles , pop. 71,127).
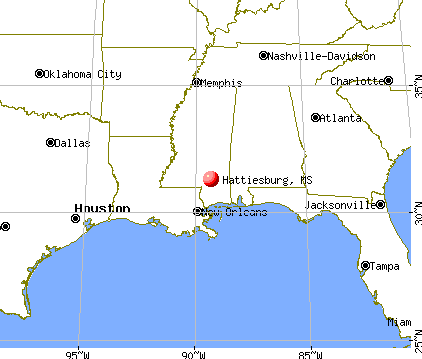
Nearest city with pop. 200,000+: New Orleans, LA (103.1 miles , pop. 484,674).
Nearest city with pop. 1,000,000+: Houston, TX (377.4 miles , pop. 1,953,631).
Nearest cities:
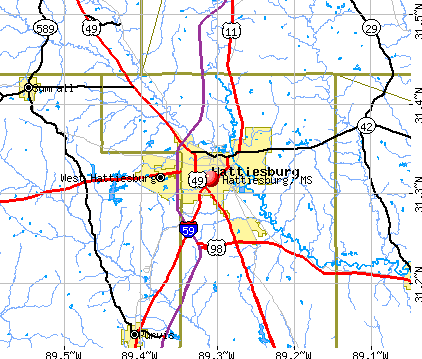
), ), ), ), ), ), )Latitude: 31.32 N, Longitude: 89.31 W
Daytime population change due to commuting: +26,466 (+54.5%)
Workers who live and work in this city: 15,998 (75.0%)
Area code: 601
Hattiesburg, Mississippi accommodation & food services, waste management - Economy and Business Data
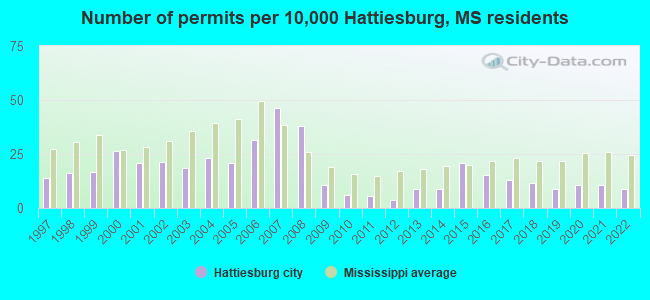
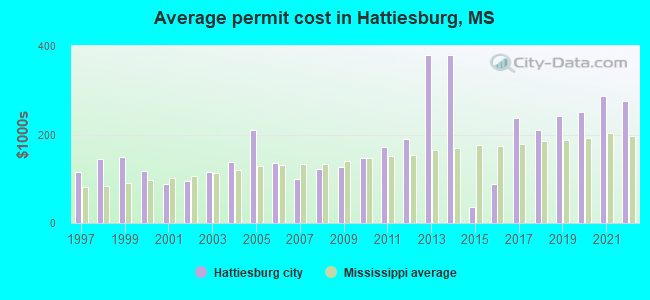
Single-family new house construction building permits:
- 2022: 40 buildings, average cost: $275,500
- 2021: 47 buildings, average cost: $287,500
- 2020: 47 buildings, average cost: $250,400
- 2019: 39 buildings, average cost: $241,700
- 2018: 52 buildings, average cost: $210,300
- 2017: 59 buildings, average cost: $238,000
- 2016: 69 buildings, average cost: $89,300
- 2015: 93 buildings, average cost: $36,400
- 2014: 39 buildings, average cost: $378,800
- 2013: 39 buildings, average cost: $378,800
- 2012: 17 buildings, average cost: $188,700
- 2011: 25 buildings, average cost: $170,500
- 2010: 28 buildings, average cost: $146,900
- 2009: 48 buildings, average cost: $126,700
- 2008: 169 buildings, average cost: $123,100
- 2007: 207 buildings, average cost: $100,100
- 2006: 141 buildings, average cost: $135,300
- 2005: 94 buildings, average cost: $210,800
- 2004: 103 buildings, average cost: $136,900
- 2003: 83 buildings, average cost: $115,600
- 2002: 96 buildings, average cost: $94,000
- 2001: 93 buildings, average cost: $87,600
- 2000: 119 buildings, average cost: $118,400
- 1999: 75 buildings, average cost: $148,500
- 1998: 73 buildings, average cost: $144,700
- 1997: 63 buildings, average cost: $116,100
| Here: | 2.3% |
| Mississippi: | 2.6% |
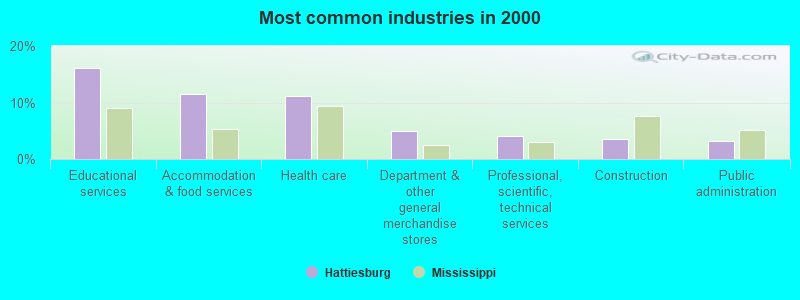
- Educational services (16.0%)
- Accommodation & food services (11.5%)
- Health care (11.2%)
- Department & other general merchandise stores (5.0%)
- Professional, scientific, technical services (4.0%)
- Construction (3.6%)
- Public administration (3.3%)
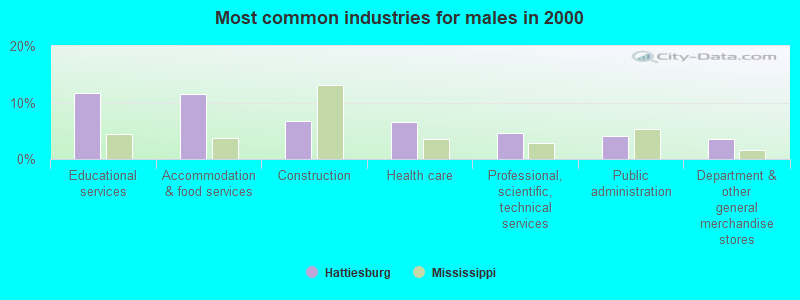
- Educational services (11.8%)
- Accommodation & food services (11.5%)
- Construction (6.8%)
- Health care (6.5%)
- Professional, scientific, technical services (4.6%)
- Public administration (4.1%)
- Department & other general merchandise stores (3.6%)
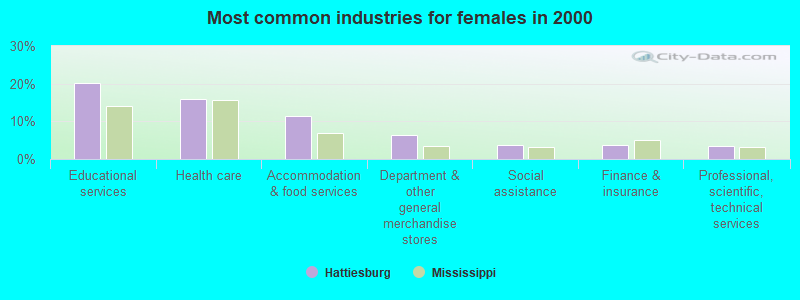
- Educational services (20.2%)
- Health care (15.9%)
- Accommodation & food services (11.5%)
- Department & other general merchandise stores (6.4%)
- Social assistance (3.7%)
- Finance & insurance (3.6%)
- Professional, scientific, technical services (3.4%)
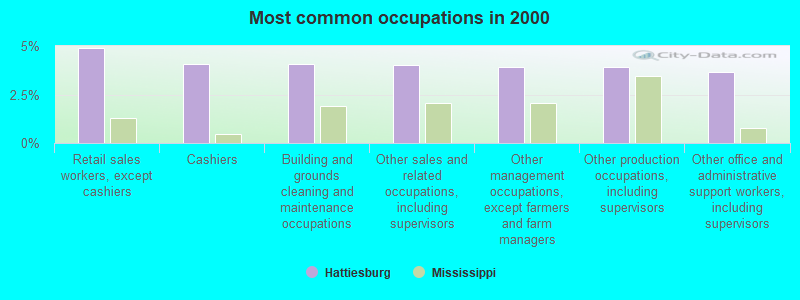
- Retail sales workers, except cashiers (4.9%)
- Cashiers (4.1%)
- Building and grounds cleaning and maintenance occupations (4.1%)
- Other sales and related occupations, including supervisors (4.0%)
- Other management occupations, except farmers and farm managers (3.9%)
- Other production occupations, including supervisors (3.9%)
- Other office and administrative support workers, including supervisors (3.6%)
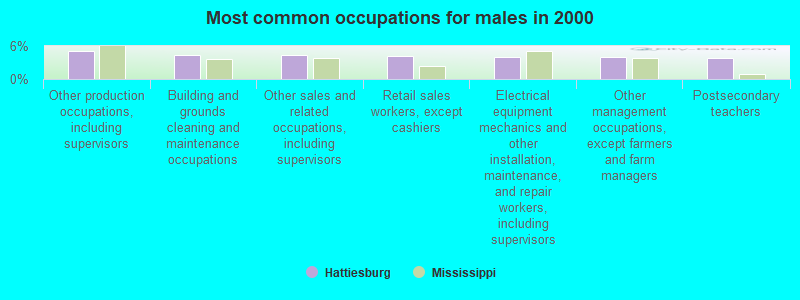
- Other production occupations, including supervisors (5.0%)
- Building and grounds cleaning and maintenance occupations (4.4%)
- Other sales and related occupations, including supervisors (4.3%)
- Retail sales workers, except cashiers (4.3%)
- Electrical equipment mechanics and other installation, maintenance, and repair workers, including supervisors (4.0%)
- Other management occupations, except farmers and farm managers (4.0%)
- Postsecondary teachers (3.9%)

- Cashiers (6.7%)
- Retail sales workers, except cashiers (5.6%)
- Other office and administrative support workers, including supervisors (5.1%)
- Secretaries and administrative assistants (4.4%)
- Other management occupations, except farmers and farm managers (3.9%)
- Preschool, kindergarten, elementary, and middle school teachers (3.8%)
- Other sales and related occupations, including supervisors (3.8%)
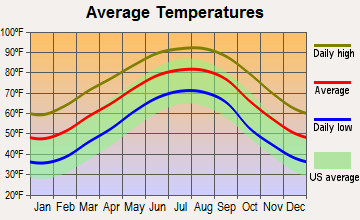
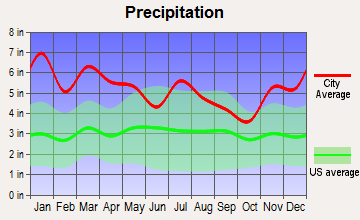
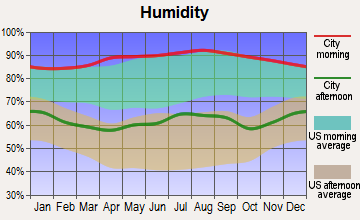
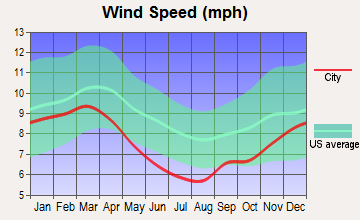
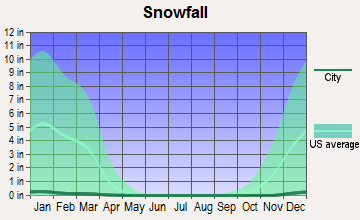
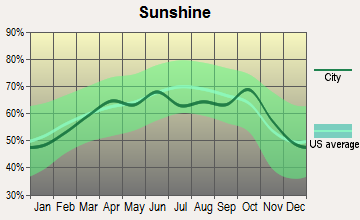
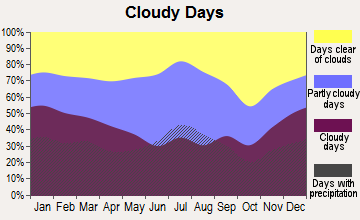
Average climate in Hattiesburg, Mississippi
Based on data reported by over 4,000 weather stations
|
|

(lower is better)
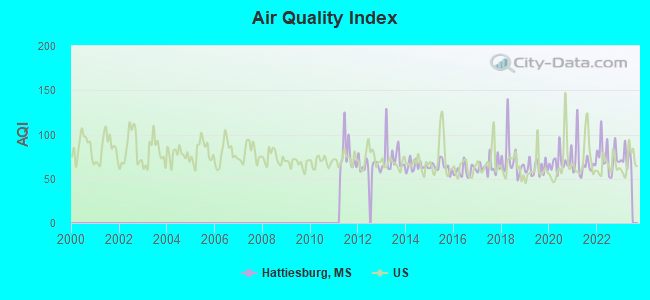
Air Quality Index (AQI) level in 2022 was 75.7. This is about average.
| City: | 75.7 |
| U.S.: | 72.6 |
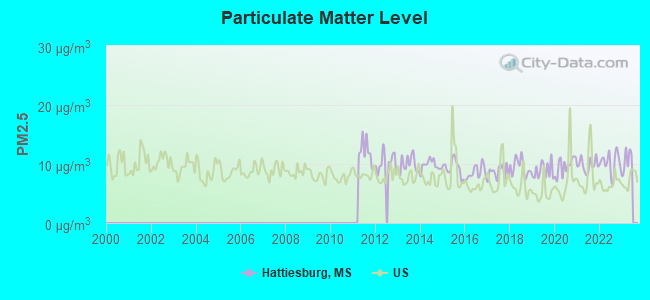
Particulate Matter (PM2.5) [µg/m3] level in 2022 was 10.2. This is worse than average. Closest monitor was 1.1 miles away from the city center.
| City: | 10.2 |
| U.S.: | 8.1 |
Tornado activity:
Hattiesburg-area historical tornado activity is near Mississippi state average. It is 114% greater than the overall U.S. average.
On 2/28/1987, a category F4 (max. wind speeds 207-260 mph) tornado 13.2 miles away from the Hattiesburg city center killed 6 people and injured 350 people and caused between $5,000,000 and $50,000,000 in damages.
On 5/7/1982, a category F3 (max. wind speeds 158-206 mph) tornado 4.3 miles away from the city center injured one person and caused between $50,000 and $500,000 in damages.
Earthquake activity:
Hattiesburg-area historical earthquake activity is significantly above Mississippi state average. It is 112% greater than the overall U.S. average.On 10/24/1997 at 08:35:17, a magnitude 4.9 (4.8 MB, 4.2 MS, 4.9 LG, Depth: 6.2 mi, Class: Light, Intensity: IV - V) earthquake occurred 121.2 miles away from the city center
On 1/18/1999 at 07:00:53, a magnitude 4.8 (4.8 MB, 4.0 LG, Depth: 0.6 mi) earthquake occurred 187.8 miles away from the city center
On 11/7/2004 at 11:20:21, a magnitude 4.3 (4.3 MW, Depth: 3.1 mi) earthquake occurred 122.5 miles away from the city center
On 6/24/1975 at 11:11:36, a magnitude 4.5 (4.5 MB) earthquake occurred 187.0 miles away from Hattiesburg center
On 3/25/1976 at 00:41:20, a magnitude 5.0 (4.9 MB, 5.0 LG, Class: Moderate, Intensity: VI - VII) earthquake occurred 304.6 miles away from the city center
On 7/16/1993 at 10:54:32, a magnitude 3.7 (3.7 LG, Depth: 3.1 mi, Class: Light, Intensity: II - III) earthquake occurred 64.4 miles away from the city center
Magnitude types: regional Lg-wave magnitude (LG), body-wave magnitude (MB), surface-wave magnitude (MS), moment magnitude (MW)
Natural disasters:
The number of natural disasters in Forrest County (21) is greater than the US average (15).Major Disasters (Presidential) Declared: 14
Emergencies Declared: 4
Causes of natural disasters: Hurricanes: 9, Floods: 8, Storms: 8, Tornadoes: 7, Drought: 1, Freeze: 1, Heavy Rain: 1, Mudslide: 1, Tropical Storm: 1, Wind: 1, Other: 1 (Note: some incidents may be assigned to more than one category).
Hospitals in Hattiesburg:
- ASERACARE HOSPICE-HATTIESBURG, LLC (6158 US HIGHWAY 49 #18)
- CAMELLIA HOSPICE (133 MAYFAIR ROAD)
- DEACONESS HOSPICE (108 LUNDY LANE, P O BOX 15788)
- FORREST GENERAL HOSPITAL (Government - Local, provides emergency services, 6051 US HIGHWAY 49)
- HOSPICE AGENCY OF HHA MULTI CO (PO BOX 3409)
- PROVIDENCE HOSPICE, SOUTH, LLC (310 CAHAL STREET)
- SOUTH MISSISSIPPI HH HOSPICE (PO BOX 888)
- SOUTHERNCARE HATTIESBURG (4700 HARDY STREET SUITE Y)
- WESLEY MEDICAL CENTER (Proprietary, 5001 W HARDY ST)
Nursing Homes in Hattiesburg:
- BEDFORD ALZHEIMER'S CARE CENTER, LLC (300 B CAHAL STREET)
- BEDFORD CARE CENTER OF HATTIES (#10 MEDICAL BOULEVARD)
- BEDFORD CARE CTR-MONROE HALL (300 CAHAL STREET)
- CONTINUING CARE CENTER (P O BOX 16389)
- HATTIESBURG HEALTH AND REHAB CENTER (514 BAY STREET)
- WINDHAM HOUSE OF HATTIESBURG (37 HILLCREST DRIVE)
Dialysis Facilities in Hattiesburg:
Home Health Centers in Hattiesburg:
Airports and heliports located in Hattiesburg:
- Hattiesburg Bobby L Chain Municipal Airport (HBG) (Runways: 1, Commercial Ops: 1,510, Air Taxi Ops: 340, Itinerant Ops: 14,888, Local Ops: 24,813, Military Ops: 3,400)
- Forrest General Hospital Heliport (MS81)
- Wesley Medical Center North Heliport (50MS)
Colleges/Universities in Hattiesburg:
- University of Southern Mississippi (Full-time enrollment: 14,294; Location: 118 College Drive # 0001; Public; Website: www.usm.edu; Offers Doctor's degree)
- William Carey University (Full-time enrollment: 3,510; Location: 498 Tuscan Ave; Private, not-for-profit; Website: www.wmcarey.edu; Offers Doctor's degree)
- Antonelli College-Hattiesburg (Full-time enrollment: 589; Location: 1500 N 31st Ave; Private, for-profit; Website: www.antonellicollege.edu)
- Healing Touch Career College (Full-time enrollment: 146; Location: 4700 Hardy St. Ste H-1; Private, for-profit; Website: healingtouchms.com)
- The Academy of Hair Design Six (Full-time enrollment: 114; Location: 6552 US Hwy 49; Private, for-profit; Website: www.academyofhair.com)
Other colleges/universities with over 2000 students near Hattiesburg:
- Jones County Junior College (about 21 miles; Ellisville, MS; Full-time enrollment: 3,942)
- Pearl River Community College (about 36 miles; Poplarville, MS; FT enrollment: 3,074)
- Mississippi Gulf Coast Community College (about 39 miles; Perkinston, MS; FT enrollment: 8,320)
- Copiah-Lincoln Community College (about 70 miles; Wesson, MS; FT enrollment: 2,532)
- East Central Community College (about 79 miles; Decatur, MS; FT enrollment: 2,380)
- University of South Alabama (about 80 miles; Mobile, AL; FT enrollment: 13,228)
- Meridian Community College (about 81 miles; Meridian, MS; FT enrollment: 2,750)
Public high schools in Hattiesburg:
- NORTH FORREST HIGH SCHOOL (Location: 693 EATONVILLE ROAD, Grades: 7-12)
- HATTIESBURG HIGH SCHOOL (Location: 301 HUTCHINSON AVE, Grades: 9-12)
- MARY BETHUNE ALTERNATIVE (Location: 610 DUMAS AVE, Grades: 4-12)
- OAK GROVE HIGH SCHOOL (Location: 5198 OLD HIGHWAY11, Grades: 9-12)
Private high schools in Hattiesburg:
Biggest public elementary/middle schools in Hattiesburg:
- DIXIE ATTENDANCE CENTER (Location: 790 ELKS LAKE ROAD, Grades: KG-8)
- NORTH FORREST ATTENDANCE CENTER (Location: 702 EATONVILLE ROAD, Grades: KG-6)
- RAWLS SPRINGS ATTENDANCE CENTER (Location: 10 ARCHIE SMITH ROAD, Grades: KG-6)
- EARL TRAVILLION ATTENDANCE CENTER (Location: 316 TRAVILLION DRIVE, Grades: KG-7)
- BURNEY ELEMENTARY SCHOOL (Location: 901 IDA AVENUE, Grades: PK-6)
- GRACE CHRISTIAN ELEMENTARY SCHOOL (Location: 2207 W 7TH STREET, Grades: PK-6)
- THAMES ELEMENTARY SCHOOL (Location: 2900 JAMESTOWN ROAD, Grades: PK-6)
- WOODLEY ELEMENTARY SCHOOL (Location: 2006 O FERRELL ST, Grades: PK-6)
- N R BURGER MIDDLE SCHOOL (Location: 174 WSF TATUM DRIVE, Grades: 7-8)
- HAWKINS ELEMENTARY SCHOOL (Location: 526 FORREST STREET, Grades: PK-6)
Private elementary/middle school in Hattiesburg:
User-submitted facts and corrections:
- Rolling Stone magazine listed Hattiesburg, Miss. as the Birthplace of Rock & Roll.
- Please post: Alpha Christian School 1101 Main Street (601) 583-4943 Tonyia Fairley,Head Mistress K-8 Private School with accrediation
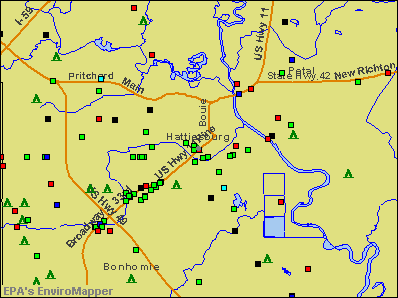
Points of interest:
Notable locations in Hattiesburg: University of Southern Mississippi Sports Arena (A), George Robert Hall Air Park Industrial Park (B), Grenada City Landfill (C), University of Southern Mississippi Bernard Reed Green Coliseum (D), Hattiesburg North Lagoon (E), Timberton Golf Club (F), Hattiesburg South Lagoon (G), Hattlesburg Country Club (H), Hattiesburg Country Club (I), Tennessee Gas Pipeline Station 546 (J), University of Southern Mississippi All American Rose Garden (K), University of Southern Mississippi Payne Center (L), University of Southern Mississippi Van Hook Golf Course (M), Hattiesburg - Forrest County Industrial Park (N), Hattiesburg Amtrak Station (O), Hattiesburg Zoo (P), University of Southern Mississippi McCain Library and Archives (Q), University of Southern Mississippi Joseph Cook Library (R), I. E. Rouse Library (S), Hattiesburg City Hall (T). Display/hide their locations on the map
Shopping Centers: Broadacres Shopping Center (1), Cloverleaf Mall Shopping Center (2), Hardy Street Mart Shopping Center (3), Lincoln Road Shopping Center (4), University Mall Shopping Center (5). Display/hide their locations on the map
Churches in Hattiesburg include: New Testament Baptist Church (A), River Avenue Baptist Church (B), Bethel Church (C), Church of God (D), Church of Christ (E), Bay Street Presbyterian Church (F), Westside Baptist Church (G), Westminster Presbyterian Church (H), Wesley Southern Methodist Church (I). Display/hide their locations on the map
Cemeteries: Hudson Cemetery (1), Oaklawn Cemetery (2), Enon Cemetery (3), Jones Cemetery (4), Pine Ridge Cemetery (5), Gillis Cemetery (6), Bennett Cemetery (7). Display/hide their locations on the map
Lake: Owens Bluff Lake (A). Display/hide its location on the map
Creeks: Burketts Creek (A), Mineral Creek (B), Greens Creek (C). Display/hide their locations on the map
Parks in Hattiesburg include: Eureka Playground (1), Jaycee Park (2), Kamper Park (3), M M Roberts Stadium (4), Pineview Park (5). Display/hide their locations on the map
Tourist attractions: Hattiesburg Area Historical Society Museum (723 North Main Street) (1), Crystal Reef Aquariums (Cultural Attractions- Events- & Facilities; 560 Weathersby Road Suite 210) (2), Pinebelt Association for Community Enhancement - Della Pierce Gillis (Cultural Attractions- Events- & Facilities; 142 Old Highway 49 West) (3), Pep's Point Water Park (Amusement & Theme Parks; 382 Peps Point Road) (4), Duff Amusement CO Inc (Amusement & Theme Parks; 5194 U S Highway 49) (5), Cyber Station (Amusement & Theme Parks; 1000 Turtle Creek Drive) (6), Laser Mania (Amusement & Theme Parks; 905 Hardy Street) (7), American Society of Travel Agents (Tours & Charters; 115 Broadway Drive) (8), Carter Gerald Travel Bureau (Tours & Charters; 115 Broadway Drive Suite A) (9). Display/hide their approximate locations on the map
Hotels: Howard Johnson Express Inn (6553 Highway 49 North) (1), Scottish Inn (6560 U S Highway 49) (2), Days Inn (111 Thornhill Drive) (3), Quality Inn Hattiesburg (6511 Highway 49 North) (4), Hampton Inn Hattiesburg- MS (4301 Hardy Street) (5), Budget Inn (6574 U S Highway 49) (6), Hattiesburg - University Of Southern Ms (6508 U S Highway 49) (7), Comfort Suites (122 Plaza Drive) (8), Holiday Inn University Area (6563 US Highway 49 North) (9). Display/hide their approximate locations on the map
Courts: U S Marshal Court Security (701 North Main Street Suite 331) (1), Forrest County - Chancery Court (641 North Main Street) (2), Forrest County - Chancery Court- Ct Admin (641 North Main Street) (3), Forrest County - Chancery Court- Ct Reporter (641 North Main Street) (4), Forrest County - Circuit Clerk- Court Administrator (630 North Main Street) (5), Forrest County - Co Court Administrator- Coroner- County Court- Court Administr (200 West Pine Street) (6), Forrest County - Justice Court Clerk Judges- Justice Court- Constables (316 Forrest Street) (7), U S Government - U S Court Of Appeals-Fifth Circuit (701 North Main Street) (8), Courts-Federal - District Court (701 North Main Street) (9). Display/hide their approximate locations on the map
Birthplace of: Van Dyke Parks - Child actor, Tim Floyd - Basketball player-coach, Jesse L. Brown - Recipient of the Purple Heart medal, Fred Armisen - Actor, Henry A. Commiskey, Sr. - Marine Corps Medal of Honor recipient, Danny Manning - Basketball player, Adrian Mayes - 2005 NFL player (Arizona Cardinals, born: Nov 17, 1980), Walter Young - 2005 Major League Baseball player (Baltimore Orioles, born: Feb 18, 1980), Blind John Davis - Blues musician, Tyler Dickerson - Country music artist.
Drinking water stations with addresses in Hattiesburg and their reported violations in the past:
CITY OF HATTIESBURG (Population served: 56,000, Groundwater):Past health violations:LAMAR PARK WATER & SEWAGE ASSN (Population served: 7,533, Groundwater):Past monitoring violations:
- MCL, Monthly (TCR) - In APR-2005, Contaminant: Coliform. Follow-up actions: St Public Notif received (MAY-30-2005)
- Monitoring and Reporting (DBP) - Between JAN-2006 and MAR-2006, Contaminant: Chlorine. Follow-up actions: St Compliance achieved (JUN-30-2006), St Formal NOV issued (JAN-30-2009), St Public Notif received (JUN-25-2009)
- One minor monitoring violation
- 220 regular monitoring violations
Past monitoring violations:ARNOLD LINE WATER ASSOCIATION (Population served: 6,660, Groundwater):
- 306 regular monitoring violations
Past health violations:DIXIE COMMUNITY UTILITY ASSN. (Population served: 5,652, Groundwater):Past monitoring violations:
- MCL, Monthly (TCR) - In MAR-2011, Contaminant: Coliform. Follow-up actions: St Compliance achieved (SEP-30-2009), St Public Notif requested (APR-05-2011), St Formal NOV issued (APR-05-2011), St Public Notif received (APR-28-2011)
- Monitoring and Reporting (DBP) - Between OCT-2008 and DEC-2008, Contaminant: Chlorine. Follow-up actions: St Formal NOV issued (FEB-04-2009), St Compliance achieved (MAR-31-2009), St Public Notif received (JUN-12-2009)
- One minor monitoring violation
- 231 regular monitoring violations
Past monitoring violations:GLENDALE UTILITY DISTRICT (Population served: 4,380, Groundwater):
- 248 regular monitoring violations
Past health violations:CANEBRAKE UTILITY ASSOC INC (Population served: 2,439, Groundwater):Past monitoring violations:
- MCL, Single Sample - Between JAN-2011 and DEC-2013, Contaminant: Fluoride. Follow-up actions: St Formal NOV issued (MAR-23-2012), St Public Notif requested (MAR-23-2012), St Public Notif received (MAR-30-2012), St Compliance achieved (APR-05-2012)
- Monitoring and Reporting (DBP) - Between JUL-2011 and SEP-2011, Contaminant: Chlorine. Follow-up actions: St Public Notif requested (SEP-09-2011), St Formal NOV issued (SEP-09-2011), St Public Notif received (OCT-03-2011), St Compliance achieved (DEC-31-2011)
- 217 regular monitoring violations
Past monitoring violations:PAUL B JOHNSON STATE PARK (Population served: 400, Purch groundwater):
- Monitoring, Source Water (GWR) - In JUL-2011, Contaminant: E. COLI. Follow-up actions: St Compliance achieved (JUL-18-2011), St Public Notif requested (AUG-30-2011), St Formal NOV issued (AUG-30-2011), St Public Notif received (SEP-20-2011)
- 176 regular monitoring violations
Past health violations:Past monitoring violations:
- MCL, Monthly (TCR) - In MAY-2008, Contaminant: Coliform. Follow-up actions: St Boil Water Order (MAY-27-2008), St Other (MAY-30-2008), St Public Notif requested (JUN-09-2008), St Formal NOV issued (JUN-09-2008), St Public Notif received (JUL-25-2008)
- MCL, Monthly (TCR) - In JUN-2007, Contaminant: Coliform. Follow-up actions: St Violation/Reminder Notice (JUL-23-2007), St Public Notif requested (JUL-23-2007), St Public Notif received (SEP-27-2007)
- MCL, Monthly (TCR) - In SEP-2005, Contaminant: Coliform. Follow-up actions: St Public Notif received (OCT-10-2005)
- Monitoring, Repeat Major (TCR) - In JUL-2007, Contaminant: Coliform (TCR). Follow-up actions: St Public Notif requested (AUG-06-2007), St Violation/Reminder Notice (AUG-06-2007), St Public Notif received (SEP-28-2007)
- Monitoring, Repeat Major (TCR) - In JUN-2007, Contaminant: Coliform (TCR). Follow-up actions: St Public Notif requested (JUL-23-2007), St Violation/Reminder Notice (JUL-23-2007), St Public Notif received (SEP-28-2007)
- One routine major monitoring violation
- One minor monitoring violation
| This city: | 2.3 people |
| Mississippi: | 2.6 people |
| This city: | 51.2% |
| Whole state: | 69.0% |
| This city: | 7.7% |
| Whole state: | 5.7% |
Likely homosexual households (counted as self-reported same-sex unmarried-partner households)
- Lesbian couples: 0.4% of all households
- Gay men: 0.3% of all households
People in group quarters in Hattiesburg in 2010:
- 2,442 people in college/university student housing
- 468 people in nursing facilities/skilled-nursing facilities
- 252 people in local jails and other municipal confinement facilities
- 97 people in residential treatment centers for adults
- 86 people in correctional residential facilities
- 63 people in other noninstitutional facilities
- 48 people in workers' group living quarters and job corps centers
- 35 people in group homes intended for adults
- 26 people in correctional facilities intended for juveniles
- 12 people in emergency and transitional shelters (with sleeping facilities) for people experiencing homelessness
People in group quarters in Hattiesburg in 2000:
- 3,440 people in college dormitories (includes college quarters off campus)
- 601 people in nursing homes
- 364 people in mental (psychiatric) hospitals or wards
- 280 people in local jails and other confinement facilities (including police lockups)
- 160 people in state prisons
- 110 people in other group homes
- 97 people in other noninstitutional group quarters
- 69 people in homes or halfway houses for drug/alcohol abuse
- 6 people in agriculture workers' dormitories on farms
- 5 people in homes for the mentally ill
- 4 people in schools, hospitals, or wards for the intellectually disabled
Banks with most branches in Hattiesburg (2011 data):
- Trustmark National Bank: 8 branches. Info updated 2012/03/26: Bank assets: $9,612.1 mil, Deposits: $7,410.1 mil, headquarters in Jackson, MS, positive income, Commercial Lending Specialization, 186 total offices, Holding Company: Trustmark Corporation
- BancorpSouth Bank: 8 branches. Info updated 2007/07/18: Bank assets: $12,990.3 mil, Deposits: $10,863.8 mil, headquarters in Tupelo, MS, positive income, Commercial Lending Specialization, 271 total offices, Holding Company: Bancorpsouth, Inc.
- Regions Bank: Hattiesburg Front Street Branch, Hattiesburg Main Branch, Hattiesburg Branch, Broadway Branch, Turtle Creek Mall Branch, Cloverleaf Branch. Info updated 2011/02/24: Bank assets: $123,368.2 mil, Deposits: $98,301.3 mil, headquarters in Birmingham, AL, positive income, Commercial Lending Specialization, 1778 total offices, Holding Company: Regions Financial Corporation
- The Citizens National Bank of Meridian: West Hattiesburg Banking Center, West Hattiesburg Banking Center, Hattiesburg Branch, South Hattiesburg Banking Centre Bra. Info updated 2006/11/03: Bank assets: $1,115.7 mil, Deposits: $932.3 mil, headquarters in Meridian, MS, positive income, Commercial Lending Specialization, 29 total offices, Holding Company: Citizens National Banc Corp.
- Great Southern National Bank: West Branch, Hattiesburg Main Branch, Northside Branch, University West Branch. Info updated 2006/11/03: Bank assets: $263.8 mil, Deposits: $234.8 mil, headquarters in Meridian, MS, positive income, 15 total offices, Holding Company: Quitman Management Company, Inc.
- Community Bank: Highway 49, Hattiesburg Branch, Hattiesburg Messenger Branch, Hardy Street Branch. Info updated 2008/07/15: Bank assets: $630.6 mil, Deposits: $562.6 mil, headquarters in Ellisville, MS, positive income, Commercial Lending Specialization, 11 total offices, Holding Company: Community Bancshares Of Mississippi, Inc. Employee Stock Ownership Plan
- The First, A National Banking Association: 40th Avenue Branch, Lincoln Road Branch, The First, A National Banking Association. Info updated 2011/10/07: Bank assets: $679.9 mil, Deposits: $567.3 mil, local headquarters, positive income, Commercial Lending Specialization, 20 total offices, Holding Company: First Bancshares, Inc., The
- Hancock Bank: Hattiesburg Hwy 98 Branch, Hattiesburg Lincoln Road Branch, Hattiesburg Usm University Branch. Info updated 2011/06/14: Bank assets: $4,988.4 mil, Deposits: $4,121.5 mil, headquarters in Gulfport, MS, positive income, Commercial Lending Specialization, 81 total offices, Holding Company: Hancock Holding Company
- Wells Fargo Bank, National Association: Turtle Creek Branch at 6093 Us Hwy 98, branch established on 2001/06/26; Hardy Street Branch at 3707 Hardy Street, branch established on 2000/09/18. Info updated 2011/04/05: Bank assets: $1,161,490.0 mil, Deposits: $905,653.0 mil, headquarters in Sioux Falls, SD, positive income, 6395 total offices, Holding Company: Wells Fargo & Company
- 6 other banks with 7 local branches
For population 15 years and over in Hattiesburg:
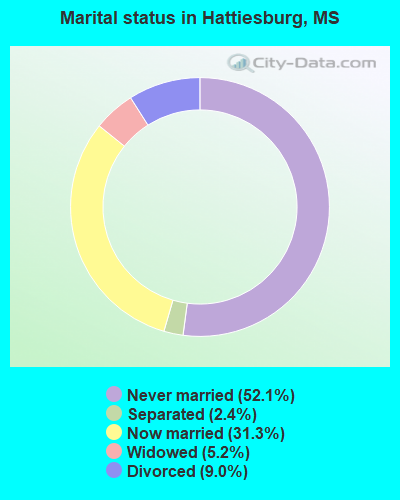
- Never married: 52.1%
- Now married: 31.3%
- Separated: 2.4%
- Widowed: 5.2%
- Divorced: 9.0%
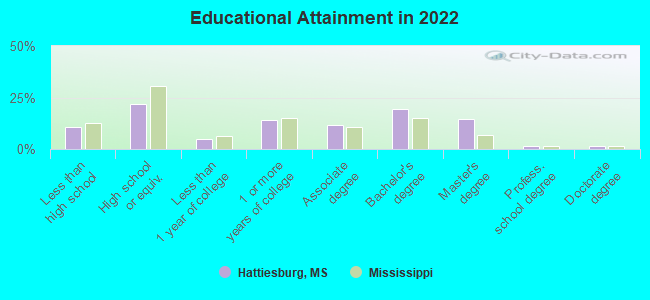
For population 25 years and over in Hattiesburg:
- High school or higher: 88.8%
- Bachelor's degree or higher: 35.0%
- Graduate or professional degree: 17.9%
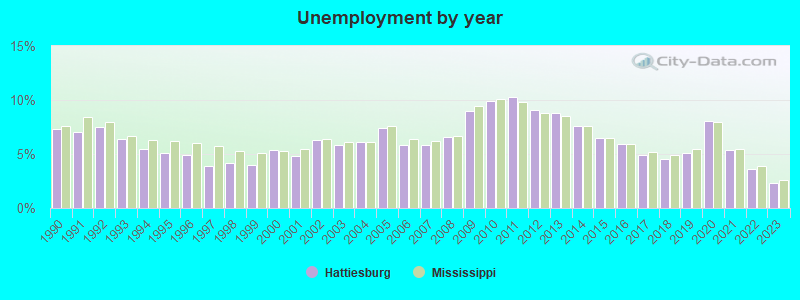
- Unemployed: 9.6%
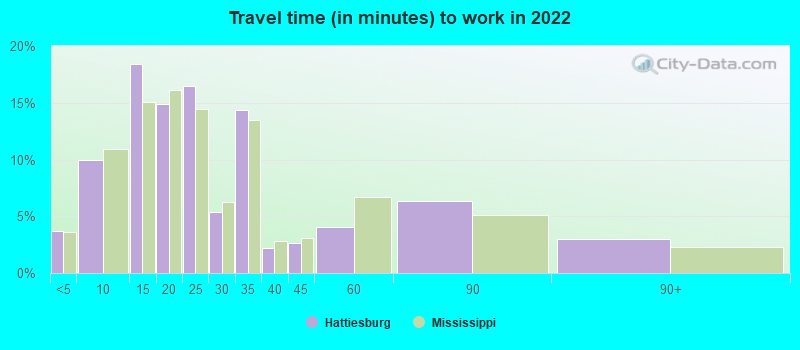
- Mean travel time to work (commute): 15.2 minutes
| Here: | 11.8 |
| Mississippi average: | 11.8 |
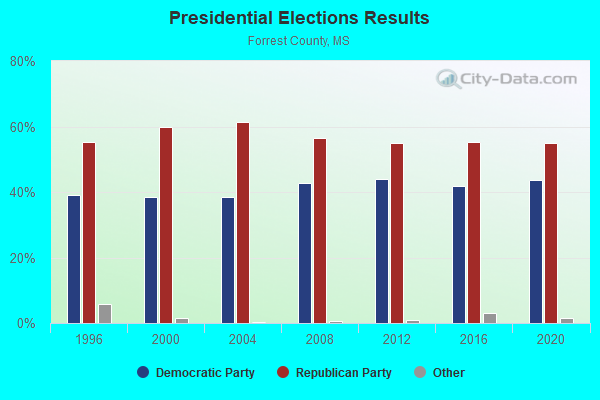
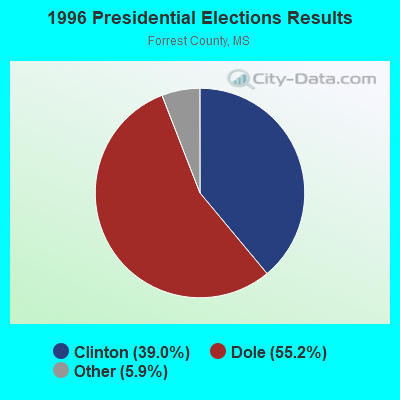
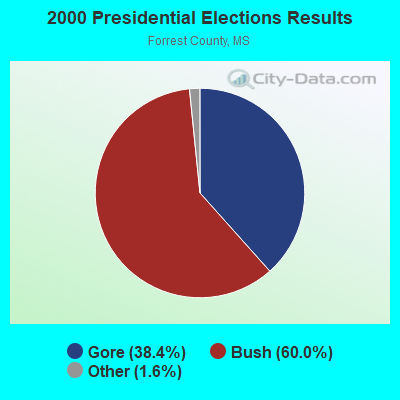
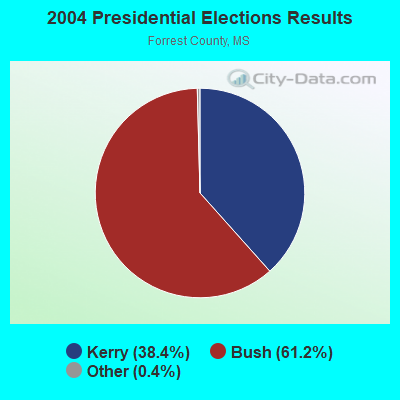
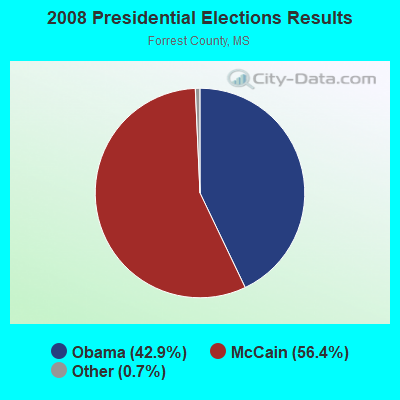
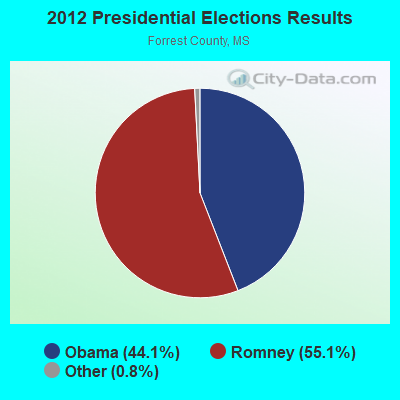
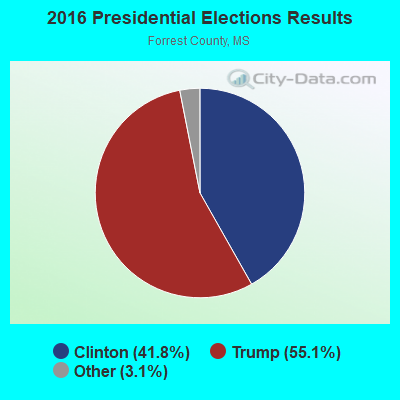
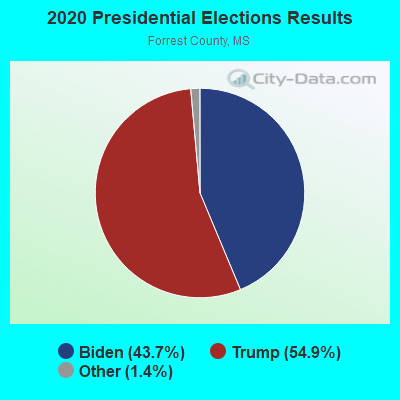
Graphs represent county-level data. Detailed 2008 Election Results
Religion statistics for Hattiesburg, MS (based on Forrest County data)
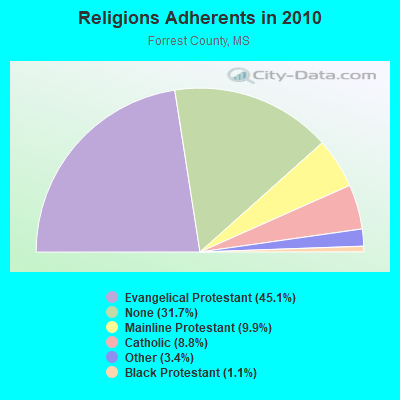
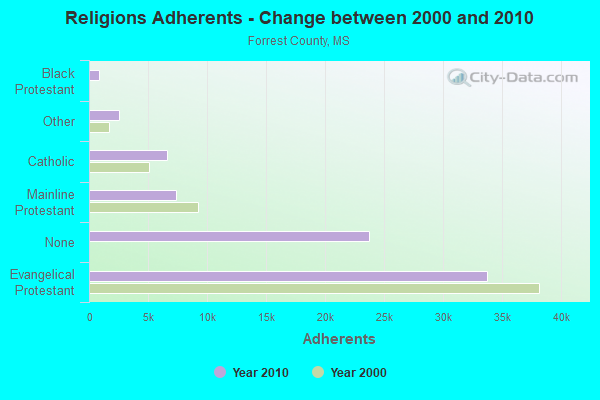
| Religion | Adherents | Congregations |
|---|---|---|
| Evangelical Protestant | 33,774 | 86 |
| Mainline Protestant | 7,405 | 22 |
| Catholic | 6,613 | 3 |
| Other | 2,532 | 13 |
| Black Protestant | 860 | 13 |
| None | 23,750 | - |
Food Environment Statistics:
| Here: | 2.16 / 10,000 pop. |
| Mississippi: | 2.08 / 10,000 pop. |
| This county: | 0.25 / 10,000 pop. |
| Mississippi: | 0.24 / 10,000 pop. |
| Forrest County: | 0.64 / 10,000 pop. |
| State: | 0.80 / 10,000 pop. |
| Forrest County: | 7.12 / 10,000 pop. |
| State: | 6.36 / 10,000 pop. |
| This county: | 5.47 / 10,000 pop. |
| Mississippi: | 5.03 / 10,000 pop. |
| This county: | 11.8% |
| Mississippi: | 12.3% |
| This county: | 33.9% |
| Mississippi: | 33.1% |
| This county: | 17.5% |
| Mississippi: | 14.4% |
Health and Nutrition:
| Hattiesburg: | 49.3% |
| State: | 48.6% |
| Here: | 48.3% |
| Mississippi: | 45.3% |
| Here: | 28.6 |
| State: | 29.2 |
| Hattiesburg: | 18.8% |
| State: | 20.5% |
| This city: | 11.9% |
| Mississippi: | 11.6% |
| Hattiesburg: | 6.8 |
| Mississippi: | 6.7 |
| Hattiesburg: | 31.1% |
| State: | 34.8% |
| Hattiesburg: | 57.2% |
| Mississippi: | 54.9% |
| Here: | 82.4% |
| Mississippi: | 79.9% |
More about Health and Nutrition of Hattiesburg, MS Residents
| Local government employment and payroll (March 2022) | |||||
| Function | Full-time employees | Monthly full-time payroll | Average yearly full-time wage | Part-time employees | Monthly part-time payroll |
|---|---|---|---|---|---|
| Firefighters | 126 | $493,135 | $46,965 | 0 | $0 |
| Police Protection - Officers | 109 | $532,660 | $58,641 | 0 | $0 |
| Parks and Recreation | 64 | $180,480 | $33,840 | 1 | $835 |
| Police - Other | 45 | $136,174 | $36,313 | 16 | $6,069 |
| Streets and Highways | 39 | $131,170 | $40,360 | 1 | $3,321 |
| Other Government Administration | 35 | $132,753 | $45,515 | 0 | $0 |
| Water Supply | 34 | $103,042 | $36,368 | 0 | $0 |
| Solid Waste Management | 31 | $89,628 | $34,695 | 0 | $0 |
| Health | 31 | $75,788 | $29,337 | 0 | $0 |
| Financial Administration | 27 | $96,846 | $43,043 | 2 | $3,616 |
| Transit | 20 | $71,340 | $42,804 | 0 | $0 |
| Sewerage | 11 | $33,941 | $37,027 | 0 | $0 |
| Other and Unallocable | 8 | $27,375 | $41,063 | 5 | $4,606 |
| Housing and Community Development (Local) | 6 | $20,531 | $41,062 | 1 | $900 |
| Welfare | 3 | $8,377 | $33,508 | 0 | $0 |
| Fire - Other | 3 | $8,521 | $34,084 | 0 | $0 |
| Judicial and Legal | 1 | $6,149 | $73,788 | 0 | $0 |
| Totals for Government | 593 | $2,147,908 | $43,465 | 26 | $19,347 |
Hattiesburg government finances - Expenditure in 2021 (per resident):
- Construction - Police Protection: $11,943,000 ($246.48)
Sewerage: $6,008,000 ($123.99)
Water Utilities: $4,351,000 ($89.79)
General - Other: $3,837,000 ($79.19)
Parks and Recreation: $2,490,000 ($51.39)
Air Transportation: $2,435,000 ($50.25)
Regular Highways: $2,219,000 ($45.80)
Local Fire Protection: $1,458,000 ($30.09)
Transit Utilities: $370,000 ($7.64)
- Current Operations - Police Protection: $12,304,000 ($253.93)
Local Fire Protection: $8,640,000 ($178.31)
Regular Highways: $8,459,000 ($174.57)
Parks and Recreation: $8,319,000 ($171.69)
Sewerage: $6,184,000 ($127.62)
Water Utilities: $5,926,000 ($122.30)
General - Other: $5,879,000 ($121.33)
Solid Waste Management: $2,999,000 ($61.89)
General Public Buildings: $2,475,000 ($51.08)
Central Staff Services: $2,118,000 ($43.71)
Transit Utilities: $1,813,000 ($37.42)
Health - Other: $1,813,000 ($37.42)
Judicial and Legal Services: $1,501,000 ($30.98)
Financial Administration: $1,407,000 ($29.04)
Miscellaneous Commercial Activities - Other: $861,000 ($17.77)
Protective Inspection and Regulation - Other: $659,000 ($13.60)
Housing and Community Development: $432,000 ($8.92)
Air Transportation: $163,000 ($3.36)
Parking Facilities: $125,000 ($2.58)
Natural Resources - Other: $115,000 ($2.37)
- General - Interest on Debt: $3,284,000 ($67.77)
- Intergovernmental to Local - Other - Correctional Institutions: $1,354,000 ($27.94)
- Other Capital Outlay - Water Utilities: $382,000 ($7.88)
Regular Highways: $275,000 ($5.68)
Financial Administration: $255,000 ($5.26)
Sewerage: $209,000 ($4.31)
Natural Resources - Other: $167,000 ($3.45)
General - Other: $117,000 ($2.41)
Miscellaneous Commercial Activities - Other: $39,000 ($0.80)
Solid Waste Management: $32,000 ($0.66)
Parks and Recreation: $20,000 ($0.41)
Police Protection: $17,000 ($0.35)
Central Staff Services: $6,000 ($0.12)
Local Fire Protection: $5,000 ($0.10)
General Public Building: $2,000 ($0.04)
- Water Utilities - Interest on Debt: $2,177,000 ($44.93)
Hattiesburg government finances - Revenue in 2021 (per resident):
- Charges - Sewerage: $11,462,000 ($236.55)
Parks and Recreation: $2,861,000 ($59.04)
Solid Waste Management: $2,287,000 ($47.20)
Other: $432,000 ($8.92)
Air Transportation: $36,000 ($0.74)
Parking Facilities: $3,000 ($0.06)
- Federal Intergovernmental - Air Transportation: $1,941,000 ($40.06)
Transit Utilities: $1,221,000 ($25.20)
Other: $465,000 ($9.60)
Housing and Community Development: $226,000 ($4.66)
- Local Intergovernmental - Highways: $1,492,000 ($30.79)
Other: $41,000 ($0.85)
- Miscellaneous - Interest Earnings: $1,360,000 ($28.07)
General Revenue - Other: $289,000 ($5.96)
Sale of Property: $2,000 ($0.04)
- Revenue - Water Utilities: $11,660,000 ($240.64)
Transit Utilities: $147,000 ($3.03)
- State Intergovernmental - General Local Government Support: $22,518,000 ($464.72)
Other: $1,514,000 ($31.25)
Highways: $1,414,000 ($29.18)
- Tax - Property: $23,895,000 ($493.14)
Other Selective Sales: $8,429,000 ($173.96)
Public Utilities Sales: $3,978,000 ($82.10)
Occupation and Business License - Other: $171,000 ($3.53)
Hattiesburg government finances - Debt in 2021 (per resident):
- Long Term Debt - Outstanding Unspecified Public Purpose: $126,534,000 ($2611.37)
Beginning Outstanding - Unspecified Public Purpose: $112,533,000 ($2322.42)
Issue, Unspecified Public Purpose: $23,233,000 ($479.48)
Beginning Outstanding - Public Debt for Private Purpose: $21,905,000 ($452.07)
Outstanding Nonguaranteed - Industrial Revenue: $20,905,000 ($431.43)
Retired Unspecified Public Purpose: $9,232,000 ($190.53)
Retired Nonguaranteed - Public Debt for Private Purpose: $1,000,000 ($20.64)
Hattiesburg government finances - Cash and Securities in 2021 (per resident):
- Bond Funds - Cash and Securities: $40,882,000 ($843.71)
- Other Funds - Cash and Securities: $24,298,000 ($501.45)
- Sinking Funds - Cash and Securities: $36,893,000 ($761.39)
| Businesses in Hattiesburg, MS | ||||
| Name | Count | Name | Count | |
|---|---|---|---|---|
| AT&T | 3 | Lane Bryant | 1 | |
| Academy Sports + Outdoors | 1 | Lane Furniture | 1 | |
| Advance Auto Parts | 2 | Little Caesars Pizza | 1 | |
| Aeropostale | 1 | Lowe's | 1 | |
| American Eagle Outfitters | 1 | Marriott | 3 | |
| Applebee's | 1 | MasterBrand Cabinets | 1 | |
| Arby's | 2 | Maurices | 1 | |
| Ashley Furniture | 1 | McDonald's | 6 | |
| AutoZone | 2 | Men's Wearhouse | 2 | |
| Baskin-Robbins | 1 | Microtel | 1 | |
| Bath & Body Works | 1 | Motel 6 | 1 | |
| Bed Bath & Beyond | 1 | Motherhood Maternity | 1 | |
| Blockbuster | 1 | New Balance | 2 | |
| Buffalo Wild Wings | 1 | New York & Co | 1 | |
| Burger King | 3 | Nike | 10 | |
| CVS | 1 | Nissan | 1 | |
| Catherines | 1 | Office Depot | 1 | |
| Charlotte Russe | 1 | Old Navy | 1 | |
| Chevrolet | 1 | Olive Garden | 1 | |
| Chick-Fil-A | 3 | Outback | 1 | |
| Chuck E. Cheese's | 1 | Outback Steakhouse | 1 | |
| Church's Chicken | 1 | Pac Sun | 1 | |
| Circle K | 1 | Papa John's Pizza | 2 | |
| Cold Stone Creamery | 1 | Payless | 2 | |
| Comfort Inn | 1 | Penske | 2 | |
| Comfort Suites | 1 | PetSmart | 1 | |
| Cracker Barrel | 1 | Pier 1 Imports | 1 | |
| Curves | 1 | Pizza Hut | 4 | |
| Dairy Queen | 1 | Popeyes | 2 | |
| Days Inn | 1 | Qdoba Mexican Grill | 1 | |
| Decora Cabinetry | 1 | Quality | 1 | |
| Domino's Pizza | 2 | RadioShack | 2 | |
| DressBarn | 1 | Ramada | 2 | |
| Dressbarn | 1 | Red Lobster | 1 | |
| Econo Lodge | 1 | Rite Aid | 2 | |
| FedEx | 23 | Rue21 | 1 | |
| Finish Line | 1 | Ryan's Grill | 1 | |
| Firestone Complete Auto Care | 1 | Ryder Rental & Truck Leasing | 1 | |
| Foot Locker | 1 | SAS Shoes | 1 | |
| Ford | 1 | SONIC Drive-In | 4 | |
| Forever 21 | 1 | Sam's Club | 1 | |
| GNC | 1 | Sears | 2 | |
| GameStop | 2 | Shoe Carnival | 1 | |
| Gap | 1 | Sleep Inn | 1 | |
| Goodwill | 4 | Spencer Gifts | 1 | |
| Gymboree | 1 | Sprint Nextel | 1 | |
| H&R Block | 3 | Starbucks | 3 | |
| Hardee's | 1 | Subway | 13 | |
| Haworth | 1 | Super 8 | 2 | |
| Hilton | 1 | T-Mobile | 4 | |
| Hobby Lobby | 1 | T.G.I. Driday's | 1 | |
| Holiday Inn | 2 | T.J.Maxx | 1 | |
| Hollister Co. | 1 | Taco Bell | 2 | |
| Home Depot | 1 | Talbots | 1 | |
| Honda | 1 | Target | 1 | |
| Hot Topic | 1 | The Athlete's Foot | 1 | |
| Hyundai | 1 | Toyota | 1 | |
| IHOP | 1 | Toys"R"Us | 1 | |
| JCPenney | 1 | U-Haul | 6 | |
| Jimmy John's | 1 | UPS | 14 | |
| JoS. A. Bank | 1 | Vans | 2 | |
| Jones New York | 1 | Verizon Wireless | 3 | |
| Journeys | 1 | Victoria's Secret | 1 | |
| Justice | 1 | Waffle House | 3 | |
| KFC | 3 | Walgreens | 2 | |
| Kohl's | 1 | Walmart | 2 | |
| La Quinta | 1 | YMCA | 2 | |
| La-Z-Boy | 1 | |||
Strongest AM radio stations in Hattiesburg:
- WFOR (1400 AM; 1 kW; HATTIESBURG, MS; Owner: CLEAR CHANNEL BROADCASTING LICENSES, INC.)
- WBKH (950 AM; 5 kW; HATTIESBURG, MS; Owner: SOUTHERN AIR COMMUNICATIONS, INC.)
- WORV (1580 AM; 1 kW; HATTIESBURG, MS; Owner: CIRCUIT BROADCASTING CO.)
- WEEZ (890 AM; daytime; 10 kW; LAUREL, MS; Owner: CLEAR CHANNEL BROADCASTING LICENSES, INC.)
- WSJC (810 AM; 50 kW; MAGEE, MS; Owner: FAMILY TALK RADIO)
- WOMN (1110 AM; daytime; 30 kW; FRANKLINTON, LA; Owner: PITTMAN BROADCASTING SERVICES, LLC.)
- WJNT (1180 AM; 50 kW; PEARL, MS; Owner: BUCHANAN BROADCASTING CO., INC.)
- WRPM (1530 AM; daytime; 10 kW; POPLARVILLE, MS; Owner: DOWDY & DOWDY PARTNERS)
- WWL (870 AM; 50 kW; NEW ORLEANS, LA; Owner: ENTERCOM NEW ORLEANS LICENSE, LLC)
- WLNO (1060 AM; 50 kW; NEW ORLEANS, LA; Owner: COMMUNICOM CO. OF LOUISIANA, L.P.)
- WASG (550 AM; 25 kW; ATMORE, AL; Owner: 550 AM, INC)
- WIGG (1420 AM; 5 kW; WIGGINS, MS; Owner: TRALYN BROADCASTING, INC.)
- WQST (850 AM; daytime; 10 kW; FOREST, MS; Owner: ACE BROADCASTING, INC.)
Strongest FM radio stations in Hattiesburg:
- WJMG (92.1 FM; HATTIESBURG, MS; Owner: CIRCUIT B/CTING CO. OF HATTIESBURG)
- WAII (89.3 FM; HATTIESBURG, MS; Owner: AMERICAN FAMILY ASSOCIATION)
- WUSM-FM (88.5 FM; HATTIESBURG, MS; Owner: UNIVERSITY OF SOUTHERN MISSISSIPPI)
- WXRR (104.5 FM; HATTIESBURG, MS; Owner: BLAKENEY COMMUNICATIONS, INC.)
- WNSL (100.3 FM; LAUREL, MS; Owner: CLEAR CHANNEL BROADCASTING LICENSES, INC.)
- WZLD (106.3 FM; PETAL, MS; Owner: CLEAR CHANNEL BROADCASTING LICENSES, INC.)
- WUSW (103.7 FM; HATTIESBURG, MS; Owner: CLEAR CHANNEL BROADCASTING LICENSES, INC.)
- WQID-LP (105.3 FM; HATTIESBURG, MS; Owner: HATTIESBURG URBAN HERITAGE ASSOCIATION)
- W216BA (91.1 FM; HATTIESBURG, MS; Owner: PENSACOLA CHRISTIAN COLLEGE, INC)
- WKNZ (107.1 FM; COLLINS, MS; Owner: RADIO BROADCASTERS, L.L.C.)
- WBBN (95.9 FM; TAYLORSVILLE, MS; Owner: BLAKENEY COMMUNICATIONS, INC)
- WMXI (98.1 FM; LAUREL, MS; Owner: RAINEY BROADCASTING, INC.)
- WZKX (107.9 FM; BAY ST. LOUIS, MS; Owner: DOWDY & DOWDY PARTNERSHIP)
- WFMM (97.3 FM; SUMRALL, MS; Owner: TELESOUTH COMMUNICATIONS, INC)
- WMAH-FM (90.3 FM; BILOXI, MS; Owner: MISSISSIPPI AUTHORITY FOR EDUCATIONAL TV)
- WZNF (95.3 FM; LUMBERTON, MS; Owner: JMD, INC.)
- WAOY (91.7 FM; GULFPORT, MS; Owner: AMERICAN FAMILY ASSOCIATION, INC.)
- WXHB (96.5 FM; RICHTON, MS; Owner: RADIO BROADCASTERS, L.L.C.)
- W249AO (97.7 FM; HATTIESBURG, MS; Owner: JOHN S LA TOUR D/B/A J & J BROADCASTING)
TV broadcast stations around Hattiesburg:
- WHLT (Channel 22; HATTIESBURG, MS; Owner: MEDIA GENERAL COMMUNICATIONS, INC.)
- W47BP (Channel 47; HATTIESBURG, MS; Owner: MISSISSIPPI AUTHORITY FOR ED. TV.)
- W32CN (Channel 32; MERIDIAN, MS; Owner: MS COMMUNICATIONS, LLC)
- WDAM-TV (Channel 7; LAUREL, MS; Owner: WDAM LICENSE SUBSIDIARY, INC.)
- WMAH-TV (Channel 19; BILOXI, MS; Owner: MISSISSIPPI AUTHORITY FOR EDUCATIONAL TELEVISION)
- WLOX (Channel 13; BILOXI, MS; Owner: LIBCO, INC.)
- W69DJ (Channel 69; MERIDIAN, MS; Owner: MS COMMUNICATIONS, LLC)
Medal of Honor Recipients
Medal of Honor Recipient born in Hattiesburg: Henry A., Sr. Commiskey.
- National Bridge Inventory (NBI) Statistics
- 206Number of bridges
- 2,257ft / 688mTotal length
- $19,464,904,000Total costs
- 1,745,528Total average daily traffic
- 186,024Total average daily truck traffic
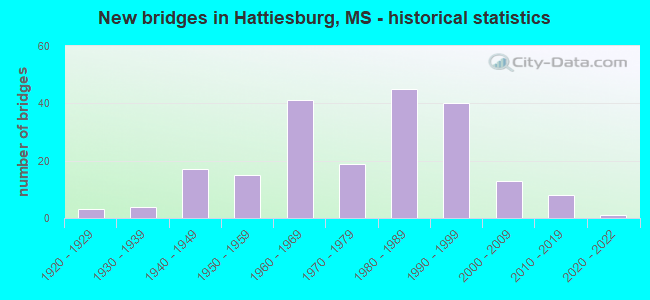
- New bridges - historical statistics
- 31920-1929
- 41930-1939
- 171940-1949
- 151950-1959
- 411960-1969
- 191970-1979
- 451980-1989
- 401990-1999
- 132000-2009
- 82010-2019
- 12020-2022
FCC Registered Antenna Towers: 688 (See the full list of FCC Registered Antenna Towers)
FCC Registered Commercial Land Mobile Towers: 5 (See the full list of FCC Registered Commercial Land Mobile Towers in Hattiesburg, MS)
FCC Registered Private Land Mobile Towers: 8 (See the full list of FCC Registered Private Land Mobile Towers)
FCC Registered Broadcast Land Mobile Towers: 72 (See the full list of FCC Registered Broadcast Land Mobile Towers)
FCC Registered Microwave Towers: 101 (See the full list of FCC Registered Microwave Towers in this town)
FCC Registered Paging Towers: 7 (See the full list of FCC Registered Paging Towers)
FCC Registered Maritime Coast & Aviation Ground Towers: 4 (See the full list of FCC Registered Maritime Coast & Aviation Ground Towers)
FCC Registered Amateur Radio Licenses: 365 (See the full list of FCC Registered Amateur Radio Licenses in Hattiesburg)
FAA Registered Aircraft Manufacturers and Dealers: 1 (See the full list of FAA Registered Manufacturers and Dealers in Hattiesburg)
FAA Registered Aircraft: 88 (See the full list of FAA Registered Aircraft)
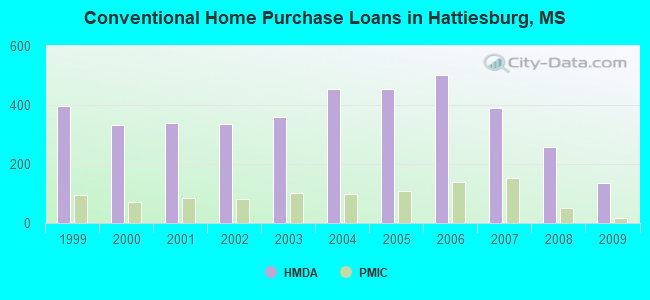
| Home Mortgage Disclosure Act Aggregated Statistics For Year 2009 (Based on 11 full and 2 partial tracts) | ||||||||||||||
| A) FHA, FSA/RHS & VA Home Purchase Loans | B) Conventional Home Purchase Loans | C) Refinancings | D) Home Improvement Loans | E) Loans on Dwellings For 5+ Families | F) Non-occupant Loans on < 5 Family Dwellings (A B C & D) | G) Loans On Manufactured Home Dwelling (A B C & D) | ||||||||
|---|---|---|---|---|---|---|---|---|---|---|---|---|---|---|
| Number | Average Value | Number | Average Value | Number | Average Value | Number | Average Value | Number | Average Value | Number | Average Value | Number | Average Value | |
| LOANS ORIGINATED | 103 | $116,336 | 134 | $116,001 | 443 | $129,036 | 59 | $55,621 | 12 | $1,238,282 | 241 | $86,025 | 7 | $35,770 |
| APPLICATIONS APPROVED, NOT ACCEPTED | 1 | $109,330 | 1 | $146,020 | 24 | $104,507 | 6 | $96,795 | 0 | $0 | 1 | $53,810 | 0 | $0 |
| APPLICATIONS DENIED | 23 | $91,803 | 26 | $92,339 | 130 | $114,084 | 58 | $13,978 | 2 | $3,607,490 | 21 | $79,651 | 10 | $13,336 |
| APPLICATIONS WITHDRAWN | 12 | $139,193 | 22 | $129,542 | 86 | $146,165 | 3 | $48,313 | 0 | $0 | 18 | $87,986 | 0 | $0 |
| FILES CLOSED FOR INCOMPLETENESS | 2 | $102,500 | 6 | $88,498 | 21 | $169,843 | 6 | $49,762 | 0 | $0 | 2 | $62,425 | 1 | $29,890 |
Detailed mortgage data for all 13 tracts in Hattiesburg, MS
| Private Mortgage Insurance Companies Aggregated Statistics For Year 2009 (Based on 6 full and 2 partial tracts) | ||||||
| A) Conventional Home Purchase Loans | B) Refinancings | C) Non-occupant Loans on < 5 Family Dwellings (A & B) | ||||
|---|---|---|---|---|---|---|
| Number | Average Value | Number | Average Value | Number | Average Value | |
| LOANS ORIGINATED | 18 | $141,752 | 10 | $167,217 | 2 | $97,500 |
| APPLICATIONS APPROVED, NOT ACCEPTED | 4 | $98,222 | 6 | $130,237 | 3 | $122,667 |
| APPLICATIONS DENIED | 1 | $68,000 | 2 | $160,500 | 1 | $68,000 |
| APPLICATIONS WITHDRAWN | 1 | $185,000 | 1 | $207,000 | 0 | $0 |
| FILES CLOSED FOR INCOMPLETENESS | 2 | $144,500 | 2 | $172,485 | 0 | $0 |

2002 - 2018 National Fire Incident Reporting System (NFIRS) incidents
- Fire incident types reported to NFIRS in Hattiesburg, MS
- 3,96544.2%Outside Fires
- 3,16835.3%Structure Fires
- 1,42215.9%Mobile Property/Vehicle Fires
- 4164.6%Other
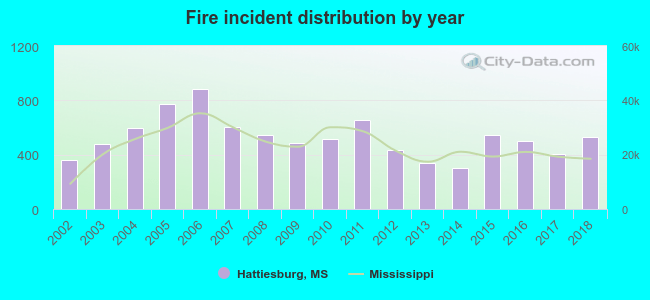 Based on the data from the years 2002 - 2018 the average number of fires per year is 528. The highest number of fire incidents - 885 took place in 2006, and the least - 305 in 2014. The data has a rising trend.
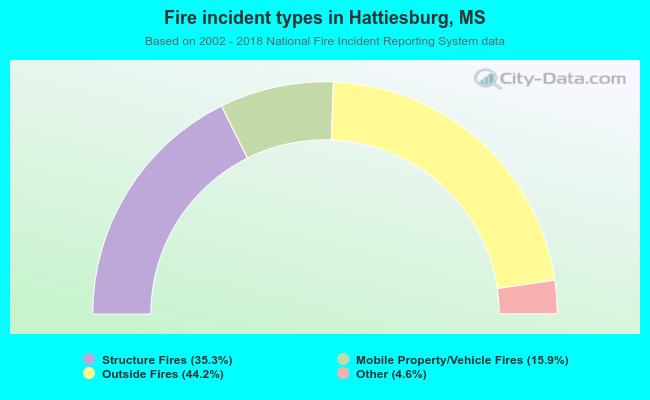 When looking into fire subcategories, the most incidents belonged to: Outside Fires (44.2%), and Structure Fires (35.3%).
Fire-safe hotels and motels in Hattiesburg, Mississippi:
- Comfort Inn University, 6541 Hwy 49 N, Hattiesburg, Mississippi 39401 , Phone: (601) 264-1881, Fax: (601) 268-3226
- Red Lion Inn & Suites Hattiesburg, 4301 Hardy St, Hattiesburg, Mississippi 39402 , Phone: (601) 264-8080
- Fairfield Inn & Suites Hattiesburg, 173 Thornhill Dr, Hattiesburg, Mississippi 39402 , Phone: (601) 296-7777, Fax: (601) 296-7777
- Laquinta, 6563 Hwy 49 N, Hattiesburg, Mississippi 39401 , Phone: (601) 268-2850, Fax: (601) 268-2823
- Sun Suites Of Hattiesburg, 121 W Park Dr, Hattiesburg, Mississippi 39402 , Phone: (601) 271-9005, Fax: (601) 271-9019
- Comfort Suites Hattiesburg, 122 Plaza Dr, Hattiesburg, Mississippi 39402 , Phone: (601) 261-5555, Fax: (601) 261-5555
- DoubleTree by Hilton Hattiesburg, 10 Gateway Dr, Hattiesburg, Mississippi 39402 , Phone: (601) 296-0302, Fax: (601) 296-0343
- Best Western Inn, 2 Churchill Dr, Hattiesburg, Mississippi 39402 , Phone: (601) 264-7668, Fax: (601) 264-8254
- 15 other hotels and motels
| Most common first names in Hattiesburg, MS among deceased individuals | ||
| Name | Count | Lived (average) |
|---|---|---|
| James | 518 | 70.1 years |
| John | 439 | 73.4 years |
| Mary | 436 | 76.8 years |
| William | 385 | 73.0 years |
| Robert | 326 | 69.6 years |
| Willie | 296 | 72.2 years |
| Charles | 241 | 69.2 years |
| George | 203 | 73.0 years |
| Annie | 189 | 78.8 years |
| Thomas | 132 | 68.5 years |
| Most common last names in Hattiesburg, MS among deceased individuals | ||
| Last name | Count | Lived (average) |
|---|---|---|
| Smith | 324 | 73.8 years |
| Williams | 240 | 71.8 years |
| Jones | 212 | 74.3 years |
| Johnson | 188 | 73.7 years |
| Brown | 174 | 73.8 years |
| Davis | 150 | 74.8 years |
| Lee | 123 | 74.5 years |
| Jackson | 116 | 74.9 years |
| Clark | 114 | 73.6 years |
| Walker | 104 | 73.8 years |
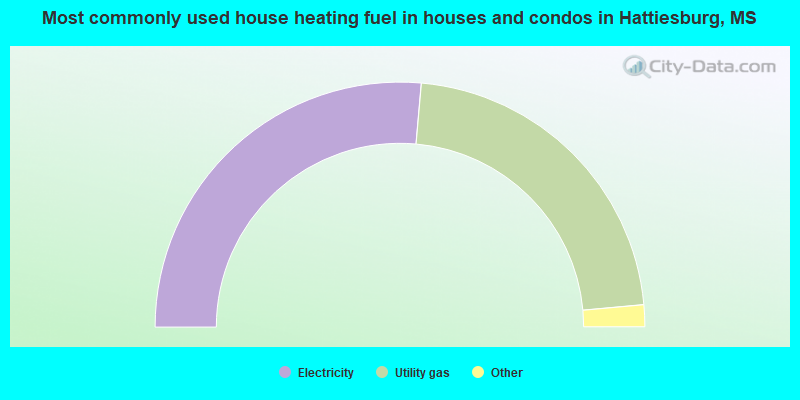
- 52.8%Electricity
- 44.3%Utility gas
- 1.4%Bottled, tank, or LP gas
- 0.9%Fuel oil, kerosene, etc.
- 0.6%No fuel used
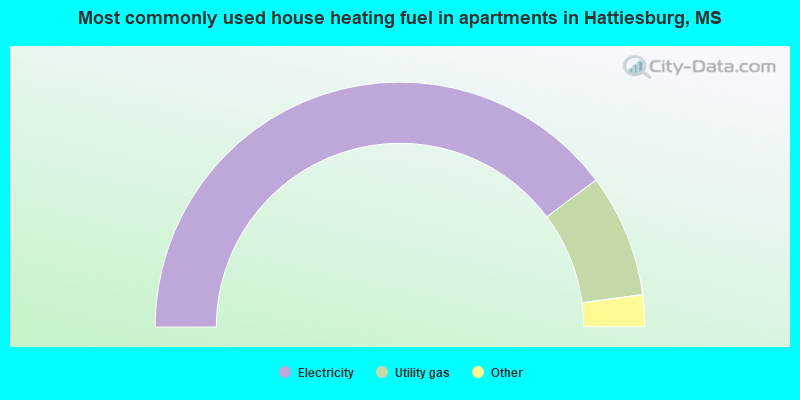
- 79.6%Electricity
- 16.3%Utility gas
- 3.5%Bottled, tank, or LP gas
- 0.5%No fuel used
- 0.1%Other fuel
Hattiesburg compared to Mississippi state average:
- Unemployed percentage below state average.
- Median age below state average.
- Renting percentage above state average.
- Length of stay since moving in above state average.
- Number of college students significantly above state average.
- Percentage of population with a bachelor's degree or higher above state average.
Hattiesburg on our top lists:
- #59 on the list of "Top 101 cities where the highest percentage of females (15+ years) which never married (with at least 10,000 females in this group)"
- #82 on the list of "Top 101 cities with the largest percentage of people in mental (psychiatric) hospitals or wards (population 1,000+)"
- #41 on the list of "Top 101 counties with the smallest number of children under 18 without health insurance coverage in 2000 (pop. 50,000+)"
- #60 on the list of "Top 101 counties with the highest percentage of residents relocating to other counties in 2011 (pop. 50,000+)"
- #67 on the list of "Top 101 counties with the highest percentage of residents relocating from other counties between 2010 and 2011 (pop. 50,000+)"
- #70 on the list of "Top 101 counties with the highest Particulate Matter (PM2.5) Annual air pollution readings in 2012 (µg/m3)"
- #72 on the list of "Top 101 counties with the smallest number of people without health insurance coverage in 2000 (pop. 50,000+)"

|
|
Total of 135 patent applications in 2008-2024.