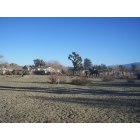
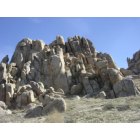
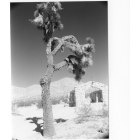
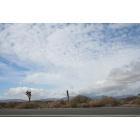
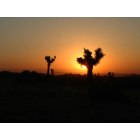
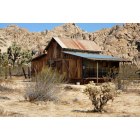
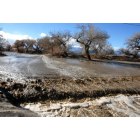
Lake Los Angeles, California Submit your own pictures of this place and show them to the world
OSM Map
General Map
Google Map
MSN Map
OSM Map
General Map
Google Map
MSN Map
OSM Map
General Map
Google Map
MSN Map
OSM Map
General Map
Google Map
MSN Map
Please wait while loading the map...
Population in 2010: 12,328. Population change since 2000: +7.0%Males: 6,076 Females: 6,252
March 2022 cost of living index in Lake Los Angeles: 127.3 (high, U.S. average is 100) Percentage of residents living in poverty in 2022: 14.0%for White Non-Hispanic residents , 26.5% for Black residents , 12.7% for Hispanic or Latino residents , 35.6% for American Indian residents , 13.9% for other race residents , 10.5% for two or more races residents )Business Search - 14 Million verified businesses
Data:
Median household income ($)
Median household income (% change since 2000)
Household income diversity
Ratio of average income to average house value (%)
Ratio of average income to average rent
Median household income ($) - White
Median household income ($) - Black or African American
Median household income ($) - Asian
Median household income ($) - Hispanic or Latino
Median household income ($) - American Indian and Alaska Native
Median household income ($) - Multirace
Median household income ($) - Other Race
Median household income for houses/condos with a mortgage ($)
Median household income for apartments without a mortgage ($)
Races - White alone (%)
Races - White alone (% change since 2000)
Races - Black alone (%)
Races - Black alone (% change since 2000)
Races - American Indian alone (%)
Races - American Indian alone (% change since 2000)
Races - Asian alone (%)
Races - Asian alone (% change since 2000)
Races - Hispanic (%)
Races - Hispanic (% change since 2000)
Races - Native Hawaiian and Other Pacific Islander alone (%)
Races - Native Hawaiian and Other Pacific Islander alone (% change since 2000)
Races - Two or more races (%)
Races - Two or more races (% change since 2000)
Races - Other race alone (%)
Races - Other race alone (% change since 2000)
Racial diversity
Unemployment (%)
Unemployment (% change since 2000)
Unemployment (%) - White
Unemployment (%) - Black or African American
Unemployment (%) - Asian
Unemployment (%) - Hispanic or Latino
Unemployment (%) - American Indian and Alaska Native
Unemployment (%) - Multirace
Unemployment (%) - Other Race
Population density (people per square mile)
Population - Males (%)
Population - Females (%)
Population - Males (%) - White
Population - Males (%) - Black or African American
Population - Males (%) - Asian
Population - Males (%) - Hispanic or Latino
Population - Males (%) - American Indian and Alaska Native
Population - Males (%) - Multirace
Population - Males (%) - Other Race
Population - Females (%) - White
Population - Females (%) - Black or African American
Population - Females (%) - Asian
Population - Females (%) - Hispanic or Latino
Population - Females (%) - American Indian and Alaska Native
Population - Females (%) - Multirace
Population - Females (%) - Other Race
Coronavirus confirmed cases (Apr 27, 2024)
Deaths caused by coronavirus (Apr 27, 2024)
Coronavirus confirmed cases (per 100k population) (Apr 27, 2024)
Deaths caused by coronavirus (per 100k population) (Apr 27, 2024)
Daily increase in number of cases (Apr 27, 2024)
Weekly increase in number of cases (Apr 27, 2024)
Cases doubled (in days) (Apr 27, 2024)
Hospitalized patients (Apr 18, 2022)
Negative test results (Apr 18, 2022)
Total test results (Apr 18, 2022)
COVID Vaccine doses distributed (per 100k population) (Sep 19, 2023)
COVID Vaccine doses administered (per 100k population) (Sep 19, 2023)
COVID Vaccine doses distributed (Sep 19, 2023)
COVID Vaccine doses administered (Sep 19, 2023)
Likely homosexual households (%)
Likely homosexual households (% change since 2000)
Likely homosexual households - Lesbian couples (%)
Likely homosexual households - Lesbian couples (% change since 2000)
Likely homosexual households - Gay men (%)
Likely homosexual households - Gay men (% change since 2000)
Cost of living index
Median gross rent ($)
Median contract rent ($)
Median monthly housing costs ($)
Median house or condo value ($)
Median house or condo value ($ change since 2000)
Mean house or condo value by units in structure - 1, detached ($)
Mean house or condo value by units in structure - 1, attached ($)
Mean house or condo value by units in structure - 2 ($)
Mean house or condo value by units in structure by units in structure - 3 or 4 ($)
Mean house or condo value by units in structure - 5 or more ($)
Mean house or condo value by units in structure - Boat, RV, van, etc. ($)
Mean house or condo value by units in structure - Mobile home ($)
Median house or condo value ($) - White
Median house or condo value ($) - Black or African American
Median house or condo value ($) - Asian
Median house or condo value ($) - Hispanic or Latino
Median house or condo value ($) - American Indian and Alaska Native
Median house or condo value ($) - Multirace
Median house or condo value ($) - Other Race
Median resident age
Resident age diversity
Median resident age - Males
Median resident age - Females
Median resident age - White
Median resident age - Black or African American
Median resident age - Asian
Median resident age - Hispanic or Latino
Median resident age - American Indian and Alaska Native
Median resident age - Multirace
Median resident age - Other Race
Median resident age - Males - White
Median resident age - Males - Black or African American
Median resident age - Males - Asian
Median resident age - Males - Hispanic or Latino
Median resident age - Males - American Indian and Alaska Native
Median resident age - Males - Multirace
Median resident age - Males - Other Race
Median resident age - Females - White
Median resident age - Females - Black or African American
Median resident age - Females - Asian
Median resident age - Females - Hispanic or Latino
Median resident age - Females - American Indian and Alaska Native
Median resident age - Females - Multirace
Median resident age - Females - Other Race
Commute - mean travel time to work (minutes)
Travel time to work - Less than 5 minutes (%)
Travel time to work - Less than 5 minutes (% change since 2000)
Travel time to work - 5 to 9 minutes (%)
Travel time to work - 5 to 9 minutes (% change since 2000)
Travel time to work - 10 to 19 minutes (%)
Travel time to work - 10 to 19 minutes (% change since 2000)
Travel time to work - 20 to 29 minutes (%)
Travel time to work - 20 to 29 minutes (% change since 2000)
Travel time to work - 30 to 39 minutes (%)
Travel time to work - 30 to 39 minutes (% change since 2000)
Travel time to work - 40 to 59 minutes (%)
Travel time to work - 40 to 59 minutes (% change since 2000)
Travel time to work - 60 to 89 minutes (%)
Travel time to work - 60 to 89 minutes (% change since 2000)
Travel time to work - 90 or more minutes (%)
Travel time to work - 90 or more minutes (% change since 2000)
Marital status - Never married (%)
Marital status - Now married (%)
Marital status - Separated (%)
Marital status - Widowed (%)
Marital status - Divorced (%)
Median family income ($)
Median family income (% change since 2000)
Median non-family income ($)
Median non-family income (% change since 2000)
Median per capita income ($)
Median per capita income (% change since 2000)
Median family income ($) - White
Median family income ($) - Black or African American
Median family income ($) - Asian
Median family income ($) - Hispanic or Latino
Median family income ($) - American Indian and Alaska Native
Median family income ($) - Multirace
Median family income ($) - Other Race
Median year house/condo built
Median year apartment built
Year house built - Built 2005 or later (%)
Year house built - Built 2000 to 2004 (%)
Year house built - Built 1990 to 1999 (%)
Year house built - Built 1980 to 1989 (%)
Year house built - Built 1970 to 1979 (%)
Year house built - Built 1960 to 1969 (%)
Year house built - Built 1950 to 1959 (%)
Year house built - Built 1940 to 1949 (%)
Year house built - Built 1939 or earlier (%)
Average household size
Household density (households per square mile)
Average household size - White
Average household size - Black or African American
Average household size - Asian
Average household size - Hispanic or Latino
Average household size - American Indian and Alaska Native
Average household size - Multirace
Average household size - Other Race
Occupied housing units (%)
Vacant housing units (%)
Owner occupied housing units (%)
Renter occupied housing units (%)
Vacancy status - For rent (%)
Vacancy status - For sale only (%)
Vacancy status - Rented or sold, not occupied (%)
Vacancy status - For seasonal, recreational, or occasional use (%)
Vacancy status - For migrant workers (%)
Vacancy status - Other vacant (%)
Residents with income below the poverty level (%)
Residents with income below 50% of the poverty level (%)
Children below poverty level (%)
Poor families by family type - Married-couple family (%)
Poor families by family type - Male, no wife present (%)
Poor families by family type - Female, no husband present (%)
Poverty status for native-born residents (%)
Poverty status for foreign-born residents (%)
Poverty among high school graduates not in families (%)
Poverty among people who did not graduate high school not in families (%)
Residents with income below the poverty level (%) - White
Residents with income below the poverty level (%) - Black or African American
Residents with income below the poverty level (%) - Asian
Residents with income below the poverty level (%) - Hispanic or Latino
Residents with income below the poverty level (%) - American Indian and Alaska Native
Residents with income below the poverty level (%) - Multirace
Residents with income below the poverty level (%) - Other Race
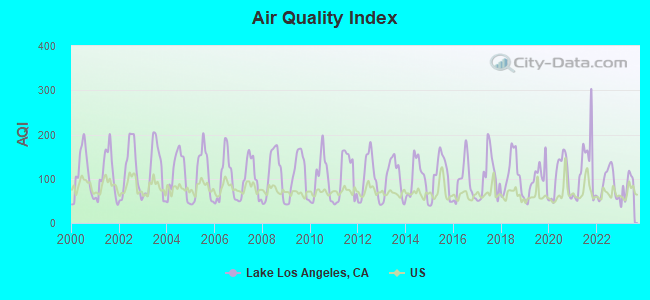
Air pollution - Air Quality Index (AQI)
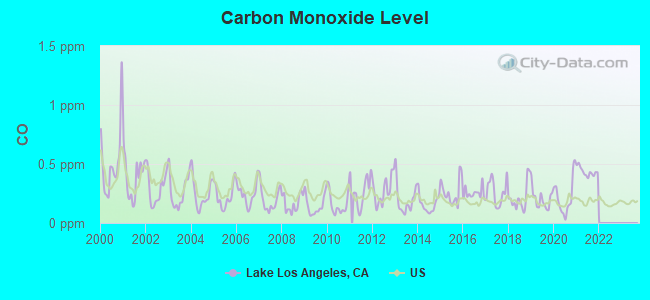
Air pollution - CO
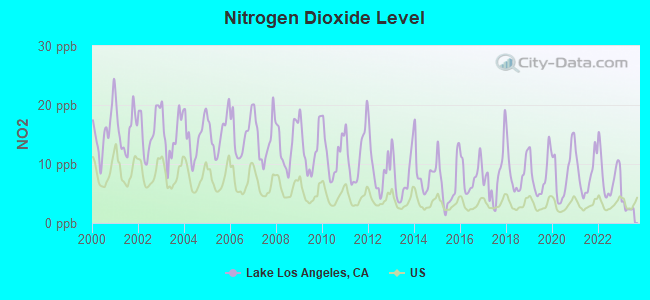
Air pollution - NO2
Air pollution - SO2
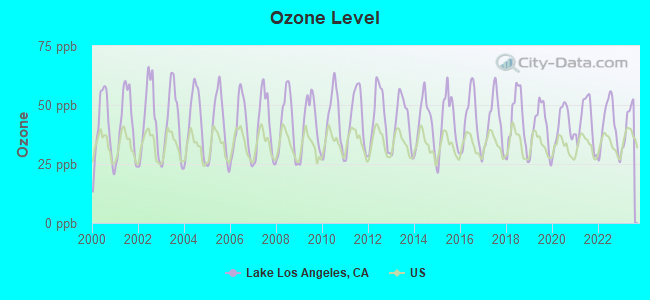
Air pollution - Ozone
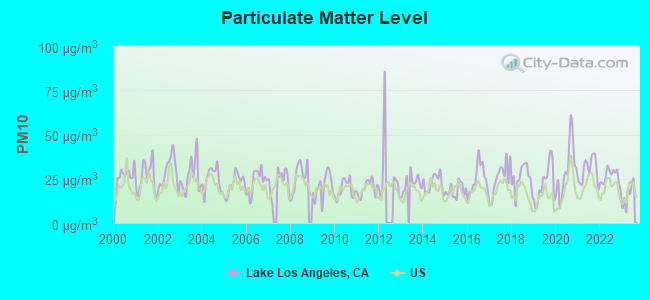
Air pollution - PM10
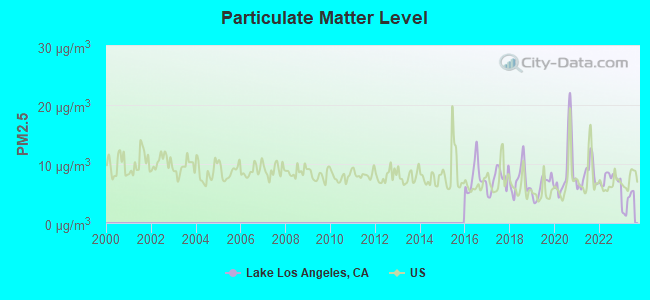
Air pollution - PM25
Air pollution - Pb
Crime - Murders per 100,000 population
Crime - Rapes per 100,000 population
Crime - Robberies per 100,000 population
Crime - Assaults per 100,000 population
Crime - Burglaries per 100,000 population
Crime - Thefts per 100,000 population
Crime - Auto thefts per 100,000 population
Crime - Arson per 100,000 population
Crime - City-data.com crime index
Crime - Violent crime index
Crime - Property crime index
Crime - Murders per 100,000 population (5 year average)
Crime - Rapes per 100,000 population (5 year average)
Crime - Robberies per 100,000 population (5 year average)
Crime - Assaults per 100,000 population (5 year average)
Crime - Burglaries per 100,000 population (5 year average)
Crime - Thefts per 100,000 population (5 year average)
Crime - Auto thefts per 100,000 population (5 year average)
Crime - Arson per 100,000 population (5 year average)
Crime - City-data.com crime index (5 year average)
Crime - Violent crime index (5 year average)
Crime - Property crime index (5 year average)
1996 Presidential Elections Results (%) - Democratic Party (Clinton)
1996 Presidential Elections Results (%) - Republican Party (Dole)
1996 Presidential Elections Results (%) - Other
2000 Presidential Elections Results (%) - Democratic Party (Gore)
2000 Presidential Elections Results (%) - Republican Party (Bush)
2000 Presidential Elections Results (%) - Other
2004 Presidential Elections Results (%) - Democratic Party (Kerry)
2004 Presidential Elections Results (%) - Republican Party (Bush)
2004 Presidential Elections Results (%) - Other
2008 Presidential Elections Results (%) - Democratic Party (Obama)
2008 Presidential Elections Results (%) - Republican Party (McCain)
2008 Presidential Elections Results (%) - Other
2012 Presidential Elections Results (%) - Democratic Party (Obama)
2012 Presidential Elections Results (%) - Republican Party (Romney)
2012 Presidential Elections Results (%) - Other
2016 Presidential Elections Results (%) - Democratic Party (Clinton)
2016 Presidential Elections Results (%) - Republican Party (Trump)
2016 Presidential Elections Results (%) - Other
2020 Presidential Elections Results (%) - Democratic Party (Biden)
2020 Presidential Elections Results (%) - Republican Party (Trump)
2020 Presidential Elections Results (%) - Other
Ancestries Reported - Arab (%)
Ancestries Reported - Czech (%)
Ancestries Reported - Danish (%)
Ancestries Reported - Dutch (%)
Ancestries Reported - English (%)
Ancestries Reported - French (%)
Ancestries Reported - French Canadian (%)
Ancestries Reported - German (%)
Ancestries Reported - Greek (%)
Ancestries Reported - Hungarian (%)
Ancestries Reported - Irish (%)
Ancestries Reported - Italian (%)
Ancestries Reported - Lithuanian (%)
Ancestries Reported - Norwegian (%)
Ancestries Reported - Polish (%)
Ancestries Reported - Portuguese (%)
Ancestries Reported - Russian (%)
Ancestries Reported - Scotch-Irish (%)
Ancestries Reported - Scottish (%)
Ancestries Reported - Slovak (%)
Ancestries Reported - Subsaharan African (%)
Ancestries Reported - Swedish (%)
Ancestries Reported - Swiss (%)
Ancestries Reported - Ukrainian (%)
Ancestries Reported - United States (%)
Ancestries Reported - Welsh (%)
Ancestries Reported - West Indian (%)
Ancestries Reported - Other (%)
Educational Attainment - No schooling completed (%)
Educational Attainment - Less than high school (%)
Educational Attainment - High school or equivalent (%)
Educational Attainment - Less than 1 year of college (%)
Educational Attainment - 1 or more years of college (%)
Educational Attainment - Associate degree (%)
Educational Attainment - Bachelor's degree (%)
Educational Attainment - Master's degree (%)
Educational Attainment - Professional school degree (%)
Educational Attainment - Doctorate degree (%)
School Enrollment - Nursery, preschool (%)
School Enrollment - Kindergarten (%)
School Enrollment - Grade 1 to 4 (%)
School Enrollment - Grade 5 to 8 (%)
School Enrollment - Grade 9 to 12 (%)
School Enrollment - College undergrad (%)
School Enrollment - Graduate or professional (%)
School Enrollment - Not enrolled in school (%)
School enrollment - Public schools (%)
School enrollment - Private schools (%)
School enrollment - Not enrolled (%)
Median number of rooms in houses and condos
Median number of rooms in apartments
Housing units lacking complete plumbing facilities (%)
Housing units lacking complete kitchen facilities (%)
Density of houses
Urban houses (%)
Rural houses (%)
Households with people 60 years and over (%)
Households with people 65 years and over (%)
Households with people 75 years and over (%)
Households with one or more nonrelatives (%)
Households with no nonrelatives (%)
Population in households (%)
Family households (%)
Nonfamily households (%)
Population in families (%)
Family households with own children (%)
Median number of bedrooms in owner occupied houses
Mean number of bedrooms in owner occupied houses
Median number of bedrooms in renter occupied houses
Mean number of bedrooms in renter occupied houses
Median number of vehichles in owner occupied houses
Mean number of vehichles in owner occupied houses
Median number of vehichles in renter occupied houses
Mean number of vehichles in renter occupied houses
Mortgage status - with mortgage (%)
Mortgage status - with second mortgage (%)
Mortgage status - with home equity loan (%)
Mortgage status - with both second mortgage and home equity loan (%)
Mortgage status - without a mortgage (%)
Average family size
Average family size - White
Average family size - Black or African American
Average family size - Asian
Average family size - Hispanic or Latino
Average family size - American Indian and Alaska Native
Average family size - Multirace
Average family size - Other Race
Geographical mobility - Same house 1 year ago (%)
Geographical mobility - Moved within same county (%)
Geographical mobility - Moved from different county within same state (%)
Geographical mobility - Moved from different state (%)
Geographical mobility - Moved from abroad (%)
Place of birth - Born in state of residence (%)
Place of birth - Born in other state (%)
Place of birth - Native, outside of US (%)
Place of birth - Foreign born (%)
Housing units in structures - 1, detached (%)
Housing units in structures - 1, attached (%)
Housing units in structures - 2 (%)
Housing units in structures - 3 or 4 (%)
Housing units in structures - 5 to 9 (%)
Housing units in structures - 10 to 19 (%)
Housing units in structures - 20 to 49 (%)
Housing units in structures - 50 or more (%)
Housing units in structures - Mobile home (%)
Housing units in structures - Boat, RV, van, etc. (%)
House/condo owner moved in on average (years ago)
Renter moved in on average (years ago)
Year householder moved into unit - Moved in 1999 to March 2000 (%)
Year householder moved into unit - Moved in 1995 to 1998 (%)
Year householder moved into unit - Moved in 1990 to 1994 (%)
Year householder moved into unit - Moved in 1980 to 1989 (%)
Year householder moved into unit - Moved in 1970 to 1979 (%)
Year householder moved into unit - Moved in 1969 or earlier (%)
Means of transportation to work - Drove car alone (%)
Means of transportation to work - Carpooled (%)
Means of transportation to work - Public transportation (%)
Means of transportation to work - Bus or trolley bus (%)
Means of transportation to work - Streetcar or trolley car (%)
Means of transportation to work - Subway or elevated (%)
Means of transportation to work - Railroad (%)
Means of transportation to work - Ferryboat (%)
Means of transportation to work - Taxicab (%)
Means of transportation to work - Motorcycle (%)
Means of transportation to work - Bicycle (%)
Means of transportation to work - Walked (%)
Means of transportation to work - Other means (%)
Working at home (%)
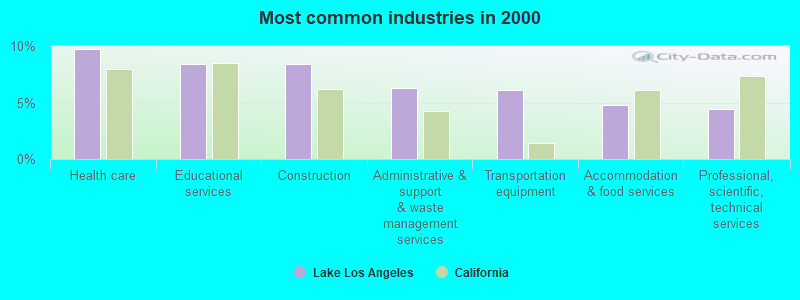
Industry diversity
Most Common Industries - Agriculture, forestry, fishing and hunting, and mining (%)
Most Common Industries - Agriculture, forestry, fishing and hunting (%)
Most Common Industries - Mining, quarrying, and oil and gas extraction (%)
Most Common Industries - Construction (%)
Most Common Industries - Manufacturing (%)
Most Common Industries - Wholesale trade (%)
Most Common Industries - Retail trade (%)
Most Common Industries - Transportation and warehousing, and utilities (%)
Most Common Industries - Transportation and warehousing (%)
Most Common Industries - Utilities (%)
Most Common Industries - Information (%)
Most Common Industries - Finance and insurance, and real estate and rental and leasing (%)
Most Common Industries - Finance and insurance (%)
Most Common Industries - Real estate and rental and leasing (%)
Most Common Industries - Professional, scientific, and management, and administrative and waste management services (%)
Most Common Industries - Professional, scientific, and technical services (%)
Most Common Industries - Management of companies and enterprises (%)
Most Common Industries - Administrative and support and waste management services (%)
Most Common Industries - Educational services, and health care and social assistance (%)
Most Common Industries - Educational services (%)
Most Common Industries - Health care and social assistance (%)
Most Common Industries - Arts, entertainment, and recreation, and accommodation and food services (%)
Most Common Industries - Arts, entertainment, and recreation (%)
Most Common Industries - Accommodation and food services (%)
Most Common Industries - Other services, except public administration (%)
Most Common Industries - Public administration (%)
Occupation diversity
Most Common Occupations - Management, business, science, and arts occupations (%)
Most Common Occupations - Management, business, and financial occupations (%)
Most Common Occupations - Management occupations (%)
Most Common Occupations - Business and financial operations occupations (%)
Most Common Occupations - Computer, engineering, and science occupations (%)
Most Common Occupations - Computer and mathematical occupations (%)
Most Common Occupations - Architecture and engineering occupations (%)
Most Common Occupations - Life, physical, and social science occupations (%)
Most Common Occupations - Education, legal, community service, arts, and media occupations (%)
Most Common Occupations - Community and social service occupations (%)
Most Common Occupations - Legal occupations (%)
Most Common Occupations - Education, training, and library occupations (%)
Most Common Occupations - Arts, design, entertainment, sports, and media occupations (%)
Most Common Occupations - Healthcare practitioners and technical occupations (%)
Most Common Occupations - Health diagnosing and treating practitioners and other technical occupations (%)
Most Common Occupations - Health technologists and technicians (%)
Most Common Occupations - Service occupations (%)
Most Common Occupations - Healthcare support occupations (%)
Most Common Occupations - Protective service occupations (%)
Most Common Occupations - Fire fighting and prevention, and other protective service workers including supervisors (%)
Most Common Occupations - Law enforcement workers including supervisors (%)
Most Common Occupations - Food preparation and serving related occupations (%)
Most Common Occupations - Building and grounds cleaning and maintenance occupations (%)
Most Common Occupations - Personal care and service occupations (%)
Most Common Occupations - Sales and office occupations (%)
Most Common Occupations - Sales and related occupations (%)
Most Common Occupations - Office and administrative support occupations (%)
Most Common Occupations - Natural resources, construction, and maintenance occupations (%)
Most Common Occupations - Farming, fishing, and forestry occupations (%)
Most Common Occupations - Construction and extraction occupations (%)
Most Common Occupations - Installation, maintenance, and repair occupations (%)
Most Common Occupations - Production, transportation, and material moving occupations (%)
Most Common Occupations - Production occupations (%)
Most Common Occupations - Transportation occupations (%)
Most Common Occupations - Material moving occupations (%)
People in Group quarters - Institutionalized population (%)
People in Group quarters - Correctional institutions (%)
People in Group quarters - Federal prisons and detention centers (%)
People in Group quarters - Halfway houses (%)
People in Group quarters - Local jails and other confinement facilities (including police lockups) (%)
People in Group quarters - Military disciplinary barracks (%)
People in Group quarters - State prisons (%)
People in Group quarters - Other types of correctional institutions (%)
People in Group quarters - Nursing homes (%)
People in Group quarters - Hospitals/wards, hospices, and schools for the handicapped (%)
People in Group quarters - Hospitals/wards and hospices for chronically ill (%)
People in Group quarters - Hospices or homes for chronically ill (%)
People in Group quarters - Military hospitals or wards for chronically ill (%)
People in Group quarters - Other hospitals or wards for chronically ill (%)
People in Group quarters - Hospitals or wards for drug/alcohol abuse (%)
People in Group quarters - Mental (Psychiatric) hospitals or wards (%)
People in Group quarters - Schools, hospitals, or wards for the mentally retarded (%)
People in Group quarters - Schools, hospitals, or wards for the physically handicapped (%)
People in Group quarters - Institutions for the deaf (%)
People in Group quarters - Institutions for the blind (%)
People in Group quarters - Orthopedic wards and institutions for the physically handicapped (%)
People in Group quarters - Wards in general hospitals for patients who have no usual home elsewhere (%)
People in Group quarters - Wards in military hospitals for patients who have no usual home elsewhere (%)
People in Group quarters - Juvenile institutions (%)
People in Group quarters - Long-term care (%)
People in Group quarters - Homes for abused, dependent, and neglected children (%)
People in Group quarters - Residential treatment centers for emotionally disturbed children (%)
People in Group quarters - Training schools for juvenile delinquents (%)
People in Group quarters - Short-term care, detention or diagnostic centers for delinquent children (%)
People in Group quarters - Type of juvenile institution unknown (%)
People in Group quarters - Noninstitutionalized population (%)
People in Group quarters - College dormitories (includes college quarters off campus) (%)
People in Group quarters - Military quarters (%)
People in Group quarters - On base (%)
People in Group quarters - Barracks, unaccompanied personnel housing (UPH), (Enlisted/Officer), ;and similar group living quarters for military personnel (%)
People in Group quarters - Transient quarters for temporary residents (%)
People in Group quarters - Military ships (%)
People in Group quarters - Group homes (%)
People in Group quarters - Homes or halfway houses for drug/alcohol abuse (%)
People in Group quarters - Homes for the mentally ill (%)
People in Group quarters - Homes for the mentally retarded (%)
People in Group quarters - Homes for the physically handicapped (%)
People in Group quarters - Other group homes (%)
People in Group quarters - Religious group quarters (%)
People in Group quarters - Dormitories (%)
People in Group quarters - Agriculture workers' dormitories on farms (%)
People in Group quarters - Job Corps and vocational training facilities (%)
People in Group quarters - Other workers' dormitories (%)
People in Group quarters - Crews of maritime vessels (%)
People in Group quarters - Other nonhousehold living situations (%)
People in Group quarters - Other noninstitutional group quarters (%)
Residents speaking English at home (%)
Residents speaking English at home - Born in the United States (%)
Residents speaking English at home - Native, born elsewhere (%)
Residents speaking English at home - Foreign born (%)
Residents speaking Spanish at home (%)
Residents speaking Spanish at home - Born in the United States (%)
Residents speaking Spanish at home - Native, born elsewhere (%)
Residents speaking Spanish at home - Foreign born (%)
Residents speaking other language at home (%)
Residents speaking other language at home - Born in the United States (%)
Residents speaking other language at home - Native, born elsewhere (%)
Residents speaking other language at home - Foreign born (%)
Class of Workers - Employee of private company (%)
Class of Workers - Self-employed in own incorporated business (%)
Class of Workers - Private not-for-profit wage and salary workers (%)
Class of Workers - Local government workers (%)
Class of Workers - State government workers (%)
Class of Workers - Federal government workers (%)
Class of Workers - Self-employed workers in own not incorporated business and Unpaid family workers (%)
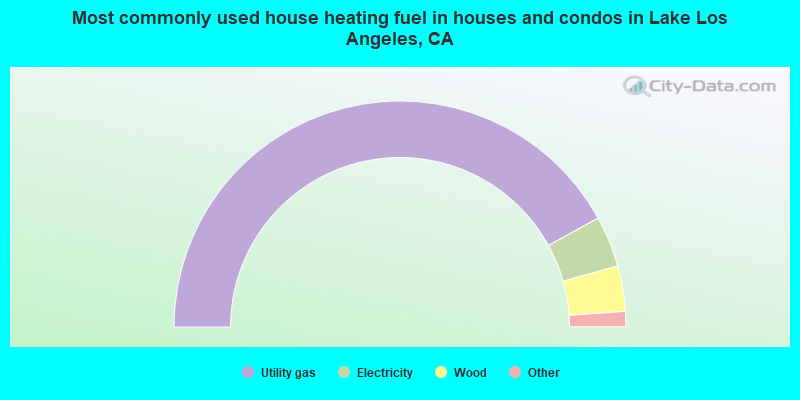
House heating fuel used in houses and condos - Utility gas (%)
House heating fuel used in houses and condos - Bottled, tank, or LP gas (%)
House heating fuel used in houses and condos - Electricity (%)
House heating fuel used in houses and condos - Fuel oil, kerosene, etc. (%)
House heating fuel used in houses and condos - Coal or coke (%)
House heating fuel used in houses and condos - Wood (%)
House heating fuel used in houses and condos - Solar energy (%)
House heating fuel used in houses and condos - Other fuel (%)
House heating fuel used in houses and condos - No fuel used (%)
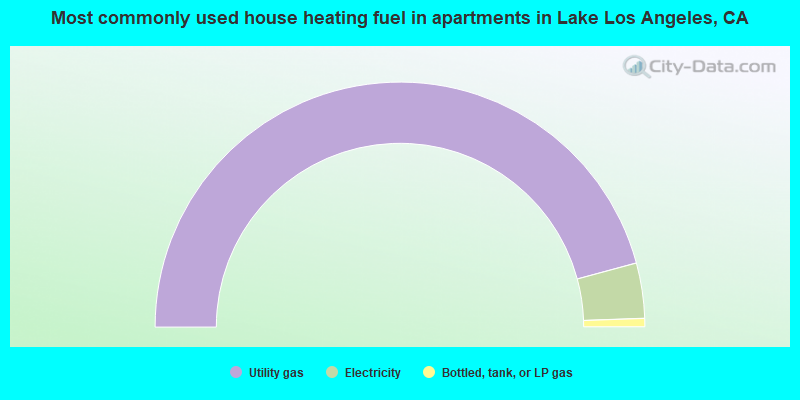
House heating fuel used in apartments - Utility gas (%)
House heating fuel used in apartments - Bottled, tank, or LP gas (%)
House heating fuel used in apartments - Electricity (%)
House heating fuel used in apartments - Fuel oil, kerosene, etc. (%)
House heating fuel used in apartments - Coal or coke (%)
House heating fuel used in apartments - Wood (%)
House heating fuel used in apartments - Solar energy (%)
House heating fuel used in apartments - Other fuel (%)
House heating fuel used in apartments - No fuel used (%)
Armed forces status - In Armed Forces (%)
Armed forces status - Civilian (%)
Armed forces status - Civilian - Veteran (%)
Armed forces status - Civilian - Nonveteran (%)
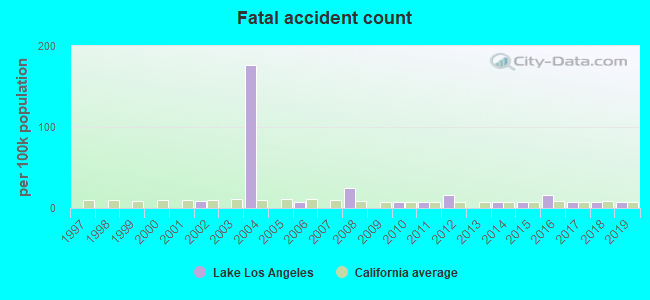
Fatal accidents locations in years 2005-2021
Fatal accidents locations in 2005
Fatal accidents locations in 2006
Fatal accidents locations in 2007
Fatal accidents locations in 2008
Fatal accidents locations in 2009
Fatal accidents locations in 2010
Fatal accidents locations in 2011
Fatal accidents locations in 2012
Fatal accidents locations in 2013
Fatal accidents locations in 2014
Fatal accidents locations in 2015
Fatal accidents locations in 2016
Fatal accidents locations in 2017
Fatal accidents locations in 2018
Fatal accidents locations in 2019
Fatal accidents locations in 2020
Fatal accidents locations in 2021
Alcohol use - People drinking some alcohol every month (%)
Alcohol use - People not drinking at all (%)
Alcohol use - Average days/month drinking alcohol
Alcohol use - Average drinks/week
Alcohol use - Average days/year people drink much
Audiometry - Average condition of hearing (%)
Audiometry - People that can hear a whisper from across a quiet room (%)
Audiometry - People that can hear normal voice from across a quiet room (%)
Audiometry - Ears ringing, roaring, buzzing (%)
Audiometry - Had a job exposure to loud noise (%)
Audiometry - Had off-work exposure to loud noise (%)
Blood Pressure & Cholesterol - Has high blood pressure (%)
Blood Pressure & Cholesterol - Checking blood pressure at home (%)
Blood Pressure & Cholesterol - Frequently checking blood cholesterol (%)
Blood Pressure & Cholesterol - Has high cholesterol level (%)
Consumer Behavior - Money monthly spent on food at supermarket/grocery store
Consumer Behavior - Money monthly spent on food at other stores
Consumer Behavior - Money monthly spent on eating out
Consumer Behavior - Money monthly spent on carryout/delivered foods
Consumer Behavior - Income spent on food at supermarket/grocery store (%)
Consumer Behavior - Income spent on food at other stores (%)
Consumer Behavior - Income spent on eating out (%)
Consumer Behavior - Income spent on carryout/delivered foods (%)
Current Health Status - General health condition (%)
Current Health Status - Blood donors (%)
Current Health Status - Has blood ever tested for HIV virus (%)
Current Health Status - Left-handed people (%)
Dermatology - People using sunscreen (%)
Diabetes - Diabetics (%)
Diabetes - Had a blood test for high blood sugar (%)
Diabetes - People taking insulin (%)
Diet Behavior & Nutrition - Diet health (%)
Diet Behavior & Nutrition - Milk product consumption (# of products/month)
Diet Behavior & Nutrition - Meals not home prepared (#/week)
Diet Behavior & Nutrition - Meals from fast food or pizza place (#/week)
Diet Behavior & Nutrition - Ready-to-eat foods (#/month)
Diet Behavior & Nutrition - Frozen meals/pizza (#/month)
Drug Use - People that ever used marijuana or hashish (%)
Drug Use - Ever used hard drugs (%)
Drug Use - Ever used any form of cocaine (%)
Drug Use - Ever used heroin (%)
Drug Use - Ever used methamphetamine (%)
Health Insurance - People covered by health insurance (%)
Kidney Conditions-Urology - Avg. # of times urinating at night
Medical Conditions - People with asthma (%)
Medical Conditions - People with anemia (%)
Medical Conditions - People with psoriasis (%)
Medical Conditions - People with overweight (%)
Medical Conditions - Elderly people having difficulties in thinking or remembering (%)
Medical Conditions - People who ever received blood transfusion (%)
Medical Conditions - People having trouble seeing even with glass/contacts (%)
Medical Conditions - People with arthritis (%)
Medical Conditions - People with gout (%)
Medical Conditions - People with congestive heart failure (%)
Medical Conditions - People with coronary heart disease (%)
Medical Conditions - People with angina pectoris (%)
Medical Conditions - People who ever had heart attack (%)
Medical Conditions - People who ever had stroke (%)
Medical Conditions - People with emphysema (%)
Medical Conditions - People with thyroid problem (%)
Medical Conditions - People with chronic bronchitis (%)
Medical Conditions - People with any liver condition (%)
Medical Conditions - People who ever had cancer or malignancy (%)
Mental Health - People who have little interest in doing things (%)
Mental Health - People feeling down, depressed, or hopeless (%)
Mental Health - People who have trouble sleeping or sleeping too much (%)
Mental Health - People feeling tired or having little energy (%)
Mental Health - People with poor appetite or overeating (%)
Mental Health - People feeling bad about themself (%)
Mental Health - People who have trouble concentrating on things (%)
Mental Health - People moving or speaking slowly or too fast (%)
Mental Health - People having thoughts they would be better off dead (%)
Oral Health - Average years since last visit a dentist
Oral Health - People embarrassed because of mouth (%)
Oral Health - People with gum disease (%)
Oral Health - General health of teeth and gums (%)
Oral Health - Average days a week using dental floss/device
Oral Health - Average days a week using mouthwash for dental problem
Oral Health - Average number of teeth
Pesticide Use - Households using pesticides to control insects (%)
Pesticide Use - Households using pesticides to kill weeds (%)
Physical Activity - People doing vigorous-intensity work activities (%)
Physical Activity - People doing moderate-intensity work activities (%)
Physical Activity - People walking or bicycling (%)
Physical Activity - People doing vigorous-intensity recreational activities (%)
Physical Activity - People doing moderate-intensity recreational activities (%)
Physical Activity - Average hours a day doing sedentary activities
Physical Activity - Average hours a day watching TV or videos
Physical Activity - Average hours a day using computer
Physical Functioning - People having limitations keeping them from working (%)
Physical Functioning - People limited in amount of work they can do (%)
Physical Functioning - People that need special equipment to walk (%)
Physical Functioning - People experiencing confusion/memory problems (%)
Physical Functioning - People requiring special healthcare equipment (%)
Prescription Medications - Average number of prescription medicines taking
Preventive Aspirin Use - Adults 40+ taking low-dose aspirin (%)
Reproductive Health - Vaginal deliveries (%)
Reproductive Health - Cesarean deliveries (%)
Reproductive Health - Deliveries resulted in a live birth (%)
Reproductive Health - Pregnancies resulted in a delivery (%)
Reproductive Health - Women breastfeeding newborns (%)
Reproductive Health - Women that had a hysterectomy (%)
Reproductive Health - Women that had both ovaries removed (%)
Reproductive Health - Women that have ever taken birth control pills (%)
Reproductive Health - Women taking birth control pills (%)
Reproductive Health - Women that have ever used Depo-Provera or injectables (%)
Reproductive Health - Women that have ever used female hormones (%)
Sexual Behavior - People 18+ that ever had sex (vaginal, anal, or oral) (%)
Sexual Behavior - Males 18+ that ever had vaginal sex with a woman (%)
Sexual Behavior - Males 18+ that ever performed oral sex on a woman (%)
Sexual Behavior - Males 18+ that ever had anal sex with a woman (%)
Sexual Behavior - Males 18+ that ever had any sex with a man (%)
Sexual Behavior - Females 18+ that ever had vaginal sex with a man (%)
Sexual Behavior - Females 18+ that ever performed oral sex on a man (%)
Sexual Behavior - Females 18+ that ever had anal sex with a man (%)
Sexual Behavior - Females 18+ that ever had any kind of sex with a woman (%)
Sexual Behavior - Average age people first had sex
Sexual Behavior - Average number of female sex partners in lifetime (males 18+)
Sexual Behavior - Average number of female vaginal sex partners in lifetime (males 18+)
Sexual Behavior - Average age people first performed oral sex on a woman (18+)
Sexual Behavior - Average number of woman performed oral sex on in lifetime (18+)
Sexual Behavior - Average number of male sex partners in lifetime (males 18+)
Sexual Behavior - Average number of male anal sex partners in lifetime (males 18+)
Sexual Behavior - Average age people first performed oral sex on a man (18+)
Sexual Behavior - Average number of male oral sex partners in lifetime (18+)
Sexual Behavior - People using protection when performing oral sex (%)
Sexual Behavior - Average number of times people have vaginal or anal sex a year
Sexual Behavior - People having sex without condom (%)
Sexual Behavior - Average number of male sex partners in lifetime (females 18+)
Sexual Behavior - Average number of male vaginal sex partners in lifetime (females 18+)
Sexual Behavior - Average number of female sex partners in lifetime (females 18+)
Sexual Behavior - Circumcised males 18+ (%)
Sleep Disorders - Average hours sleeping at night
Sleep Disorders - People that has trouble sleeping (%)
Smoking-Cigarette Use - People smoking cigarettes (%)
Taste & Smell - People 40+ having problems with smell (%)
Taste & Smell - People 40+ having problems with taste (%)
Taste & Smell - People 40+ that ever had wisdom teeth removed (%)
Taste & Smell - People 40+ that ever had tonsils teeth removed (%)
Taste & Smell - People 40+ that ever had a loss of consciousness because of a head injury (%)
Taste & Smell - People 40+ that ever had a broken nose or other serious injury to face or skull (%)
Taste & Smell - People 40+ that ever had two or more sinus infections (%)
Weight - Average height (inches)
Weight - Average weight (pounds)
Weight - Average BMI
Weight - People that are obese (%)
Weight - People that ever were obese (%)
Weight - People trying to lose weight (%)
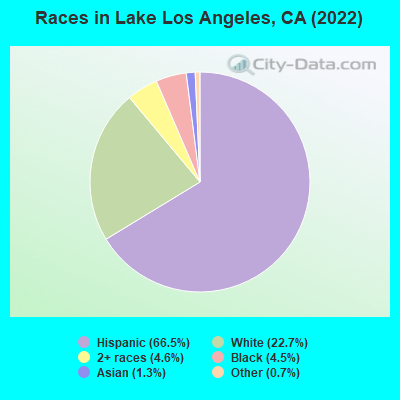
8,516 66.5% Hispanic 2,913 22.7% White alone 589 4.6% Two or more races 572 4.5% Black alone 169 1.3% Asian alone 92 0.7% Other race alone
Latest news from Lake Los Angeles, CA collected exclusively by city-data.com from local newspapers, TV, and radio stations
Ancestries: German (3.3%), Italian (1.0%).
Current Local Time:
Land area: 13.0 square miles.
Population density: 948 people per square mile (low).
1,428 residents are foreign born (9.9% Latin America ).
This place:
11.1%California:
26.5%
Median real estate property taxes paid for housing units with mortgages in 2022: $2,325 (0.8%)Median real estate property taxes paid for housing units with no mortgage in 2022: $2,035 (0.7%)
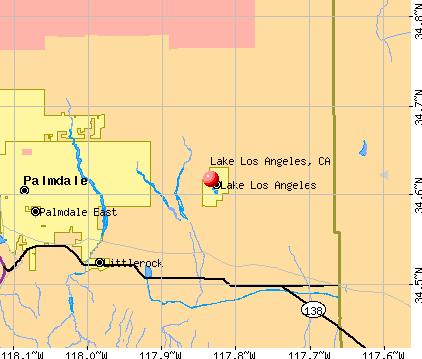
Nearest city with pop. 50,000+: Palmdale, CA
Nearest city with pop. 200,000+: Upper San Gabriel Valley, CA (36.9 miles
Nearest city with pop. 1,000,000+: Los Angeles, CA
Nearest cities:
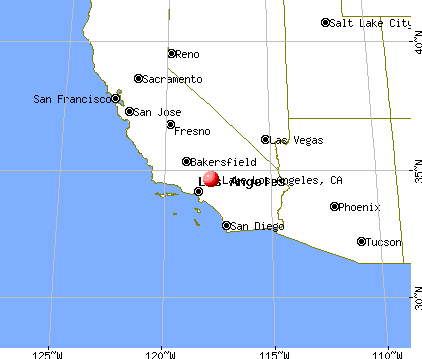
Latitude: 34.62 N, Longitude: 117.83 W
Daytime population change due to commuting: -3,845 (-30.0%)Workers who live and work in this place: 534 (13.9%)
Area code commonly used in this area: 661
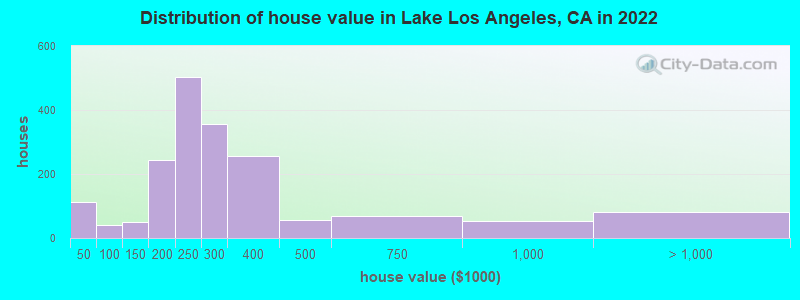
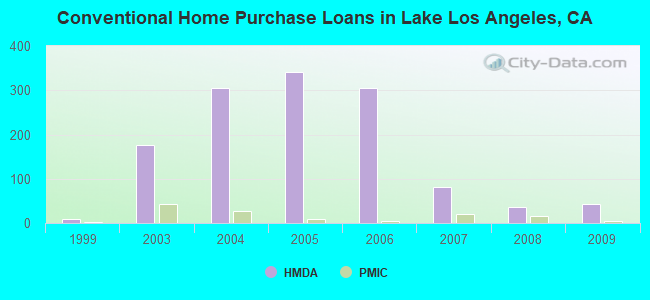
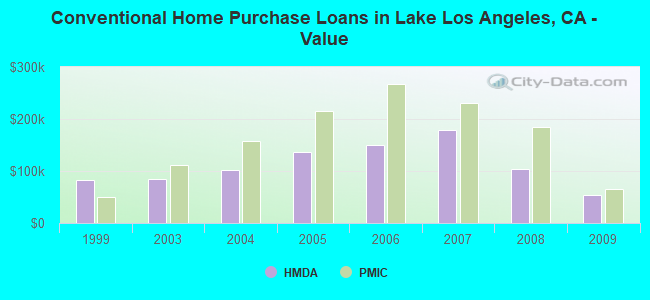
Property values in Lake Los Angeles, CA
Unemployment in December 2023:
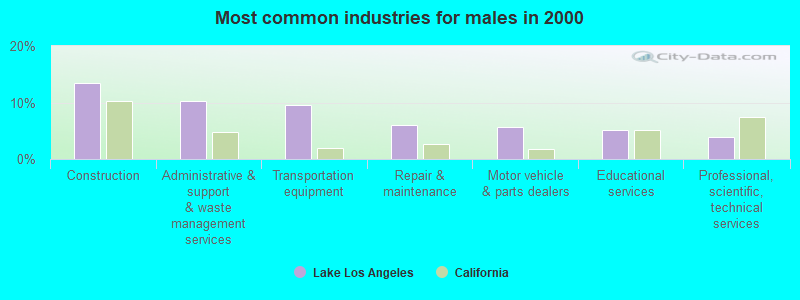
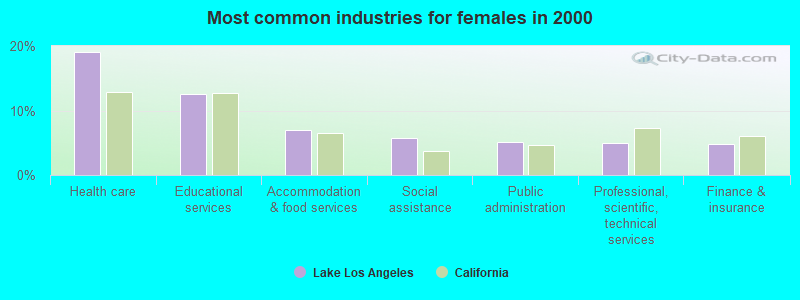
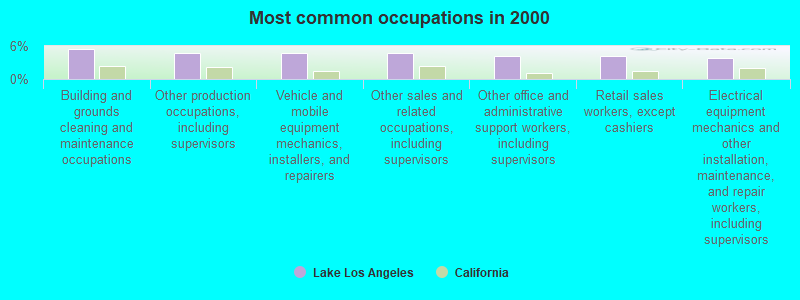
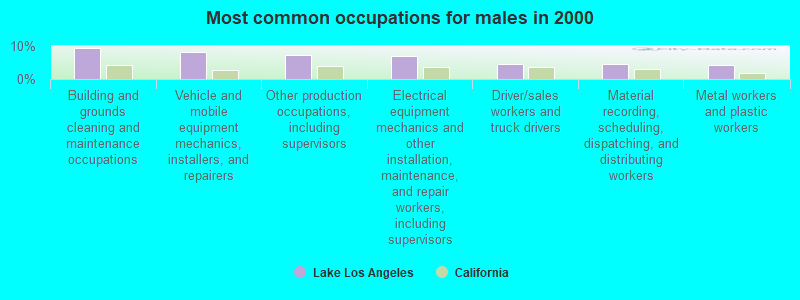
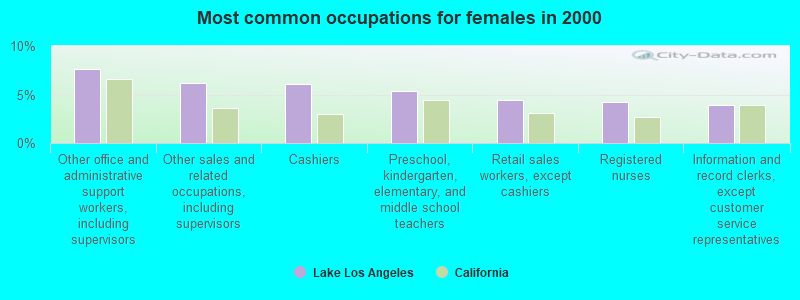
Most common occupations in Lake Los Angeles, CA (%)
Both Males Females
Building and grounds cleaning and maintenance occupations (5.5%)
Other production occupations, including supervisors (4.8%)
Vehicle and mobile equipment mechanics, installers, and repairers (4.7%)
Other sales and related occupations, including supervisors (4.7%)
Other office and administrative support workers, including supervisors (4.2%)
Retail sales workers, except cashiers (4.2%)
Electrical equipment mechanics and other installation, maintenance, and repair workers, including supervisors (3.8%)
Building and grounds cleaning and maintenance occupations (9.4%)
Vehicle and mobile equipment mechanics, installers, and repairers (8.2%)
Other production occupations, including supervisors (7.3%)
Electrical equipment mechanics and other installation, maintenance, and repair workers, including supervisors (6.9%)
Driver/sales workers and truck drivers (4.6%)
Material recording, scheduling, dispatching, and distributing workers (4.5%)
Metal workers and plastic workers (4.1%)
Other office and administrative support workers, including supervisors (7.6%)
Other sales and related occupations, including supervisors (6.2%)
Cashiers (6.0%)
Preschool, kindergarten, elementary, and middle school teachers (5.3%)
Retail sales workers, except cashiers (4.4%)
Registered nurses (4.2%)
Information and record clerks, except customer service representatives (3.9%)
Earthquake activity:
Lake Los Angeles-area historical earthquake activity is significantly above California state average. It is 7612% greater than the overall U.S. average. On 7/21/1952 at 11:52:14, a magnitude 7.7 (7.7 UK, Class: Major, Intensity: VIII - XII) earthquake occurred 71.3 miles away from the city center, causing $50,000,000 total damage On 6/28/1992 at 11:57:34, a magnitude 7.6 (6.2 MB, 7.6 MS, 7.3 MW, Depth: 0.7 mi) earthquake occurred 80.1 miles away from Lake Los Angeles center, causing 3 deaths ( 1 shaking deaths, 2 other deaths) and 400 injuries, causing $100,000,000 total damage and $40,000,000 insured lossesOn 10/16/1999 at 09:46:44, a magnitude 7.4 (6.3 MB, 7.4 MS, 7.2 MW, 7.3 ML) earthquake occurred 80.0 miles away from the city center On 11/4/1927 at 13:51:53, a magnitude 7.5 (7.5 UK) earthquake occurred 182.8 miles away from the city center On 6/28/1992 at 15:05:30, a magnitude 6.9 (6.3 MB, 6.7 MS, 6.5 MW, 6.9 ME, Depth: 3.1 mi, Class: Strong, Intensity: VII - IX) earthquake occurred 62.3 miles away from Lake Los Angeles center On 1/17/1994 at 12:30:55, a magnitude 6.8 (6.4 MB, 6.8 MS, 6.7 MW, Depth: 11.4 mi) earthquake occurred 53.0 miles away from the city center, causing 60 deaths ( 60 shaking deaths) and 7000 injuriesMagnitude types: body-wave magnitude (MB), energy magnitude (ME), local magnitude (ML), surface-wave magnitude (MS), moment magnitude (MW) Natural disasters: The number of natural disasters in Los Angeles County (57) is a lot greater than the US average (15).Major Disasters (Presidential) Declared: 27Emergencies Declared: 3Fires: 37, Floods: 16, Storms: 9, Winter Storms: 6, Landslides: 5, Mudslides: 5, Earthquakes: 3, Freeze: 1, Heavy Rain: 1, Hurricane: 1, Snow: 1, Tornado: 1, Wind: 1, Other: 1 (Note: some incidents may be assigned to more than one category). Hospitals and medical centers near Lake Los Angeles: DAVITA-PALMDALE REGIONAL DIALYSIS (Dialysis Facility, about 13 miles away; PALMDALE, CA)
EAST PALMDALE DIALYSIS CENTER (Dialysis Facility, about 13 miles away; PALMDALE, CA)
Amtrak stations near Lake Los Angeles: 17 miles: PALMDALE (120 E. PALMDALE BLVD.) - Bus Station Services: fully wheelchair accessible, public payphones, full-service food facilities, free short-term parking, call for taxi service.
19 miles: LANCASTER (44742 SIERRA HWY.) - Bus Station Services: fully wheelchair accessible, enclosed waiting area, public restrooms, public payphones, free short-term parking, free long-term parking, taxi stand, public transit connection.
Colleges/universities with over 2000 students nearest to Lake Los Angeles:
Antelope Valley College (about 21 miles; Lancaster, CA ; Full-time enrollment: 9,206)
Citrus College (about 34 miles; Glendora, CA ; FT enrollment: 8,456)
Azusa Pacific University (about 34 miles; Azusa, CA ; FT enrollment: 9,427)
Victor Valley College (about 35 miles; Victorville, CA ; FT enrollment: 7,630)
Chaffey College (about 36 miles; Rancho Cucamonga, CA ; FT enrollment: 10,496)
University of La Verne (about 36 miles; La Verne, CA ; FT enrollment: 6,983)
Pasadena City College (about 37 miles; Pasadena, CA ; FT enrollment: 14,712)
User-submitted facts and corrections:
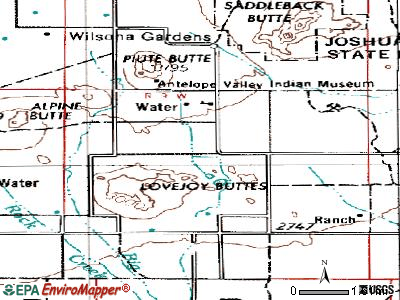
Notable location: Antelope Valley Indian Museum, www.avim.parks.ca.gov Avenue M between East 150th & 170th streets
Notable locations in Lake Los Angeles: (A) , Los Angeles County Fire Department Station 114 (B) . Display/hide their locations on the map
Los Angeles County has a predicted average indoor radon screening level between 2 and 4 pCi/L (pico curies per liter) - Moderate Potential Average household size: This place:
3.8 peopleCalifornia:
2.9 people
Percentage of family households: This place:
81.6%Whole state:
68.7%
Percentage of households with unmarried partners: This place:
8.7%Whole state:
7.2%
Likely homosexual households (counted as self-reported same-sex unmarried-partner households)
Lesbian couples: 0.3% of all households Gay men: 0.3% of all households
People in group quarters in Lake Los Angeles in 2010:
11 people in group homes intended for adults
11 people in residential treatment centers for adults
7 people in workers' group living quarters and job corps centers
People in group quarters in Lake Los Angeles in 2000:
12 people in homes for the mentally retarded
11 people in nursing homes
4 people in other noninstitutional group quarters
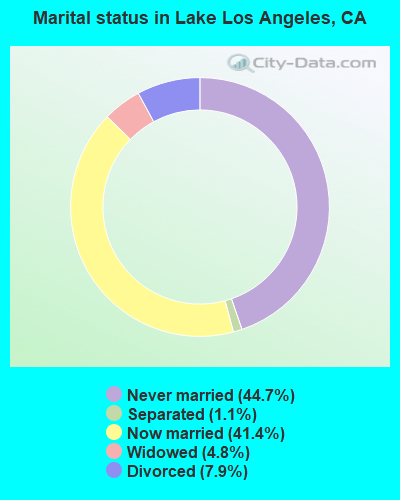
For population 15 years and over in Lake Los Angeles:
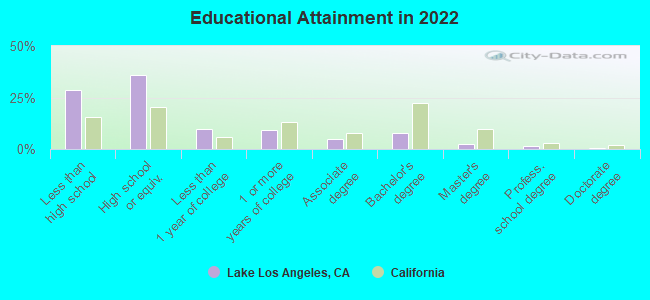
Never married: 44.7%Now married: 41.4%Separated: 1.1%Widowed: 4.8%Divorced: 7.9% For population 25 years and over in Lake Los Angeles:
High school or higher: 70.8%Bachelor's degree or higher: 11.3%Graduate or professional degree: 3.9%Unemployed: 11.7%Mean travel time to work (commute): 37.6 minutes
Education Gini index (Inequality in education) Here:
18.1California average:
15.5
Religion statistics for Lake Los Angeles, CA (based on Los Angeles County data)
Religion Adherents Congregations Catholic 3,542,994 275 Evangelical Protestant 814,611 3,249 Other 451,594 1,023 Mainline Protestant 229,056 860 Black Protestant 112,338 290 Orthodox 63,517 76 None 4,604,495 -
Source: Clifford Grammich, Kirk Hadaway, Richard Houseal, Dale E.Jones, Alexei Krindatch, Richie Stanley and Richard H.Taylor. 2012. 2010 U.S.Religion Census: Religious Congregations & Membership Study. Association of Statisticians of American Religious Bodies. Jones, Dale E., et al. 2002. Congregations and Membership in the United States 2000. Nashville, TN: Glenmary Research Center. Graphs represent county-level data
Food Environment Statistics: Number of grocery stores : 2,084Los Angeles County :
2.12 / 10,000 pop.State :
2.14 / 10,000 pop.
Number of supercenters and club stores : 32Los Angeles County :
0.03 / 10,000 pop.California :
0.04 / 10,000 pop.
Number of convenience stores (no gas) : 567Here :
0.58 / 10,000 pop.California :
0.62 / 10,000 pop.
Number of convenience stores (with gas) : 1,206Los Angeles County :
1.23 / 10,000 pop.California :
1.49 / 10,000 pop.
Number of full-service restaurants : 7,008Los Angeles County :
7.15 / 10,000 pop.California :
7.42 / 10,000 pop.
Adult obesity rate : This county :
20.4%State :
21.3%
Low-income preschool obesity rate : Los Angeles County :
18.6%California :
17.9%
Health and Nutrition: Healthy diet rate : Lake Los Angeles:
45.8%California:
49.4%
Average overall health of teeth and gums : This city:
43.2%State:
48.0%
Average BMI : Lake Los Angeles:
29.2California:
28.1
People feeling badly about themselves : This city:
24.1%State:
20.2%
People not drinking alcohol at all : Here:
10.9%California:
11.2%
Average hours sleeping at night : This city:
6.7California:
6.8
Overweight people : Lake Los Angeles:
34.7%State:
31.5%
General health condition : This city:
52.6%California:
56.4%
Average condition of hearing : Here:
80.1%California:
80.9%
More about Health and Nutrition of Lake Los Angeles, CA Residents
2.98% of this county's 2021 resident taxpayers lived in other counties in 2020 ($81,235 average adjusted gross income )
Here:
2.98%California average:
5.19%
0.01% of residents moved from foreign countries ($155 average AGI )Los Angeles County:
0.01%California average:
0.03%
Top counties from which taxpayers relocated into this county between 2020 and 2021:
4.68% of this county's 2020 resident taxpayers moved to other counties in 2021 ($97,324 average adjusted gross income )
Here:
4.68%California average:
6.14%
0.01% of residents moved to foreign countries ($196 average AGI )Los Angeles County:
0.01%California average:
0.02%
Top counties to which taxpayers relocated from this county between 2020 and 2021: Strongest AM radio stations in Lake Los Angeles:
KIRN (670 AM; 35 kW; SIMI VALLEY, CA; Owner: LOTUS OXNARD CORP.)
KLAC (570 AM; 50 kW; LOS ANGELES, CA; Owner: AMFM RADIO LICENSES, L.L.C.)
KDIS (1110 AM; 50 kW; PASADENA, CA; Owner: ABC,INC.)
KSPN (710 AM; 50 kW; LOS ANGELES, CA; Owner: KABC-AM RADIO, INC.)
KUTY (1470 AM; 5 kW; PALMDALE, CA; Owner: HIGH DESERT BROADCASTING LLC)
KTNQ (1020 AM; 50 kW; LOS ANGELES, CA; Owner: KTNQ-AM LICENSE CORP.)
KFI (640 AM; 50 kW; LOS ANGELES, CA; Owner: CAPSTAR TX LIMITED PARTNERSHIP)
KFWB (980 AM; 50 kW; LOS ANGELES, CA; Owner: INFINITY BROADCASTING OPERATIONS, INC.)
KXTA (1150 AM; 50 kW; LOS ANGELES, CA; Owner: CITICASTERS LICENSES, L.P.)
KPLS (830 AM; 50 kW; ORANGE, CA; Owner: CRN LICENSES, LLC)
KMPC (1540 AM; 50 kW; LOS ANGELES, CA; Owner: ROSE CITY RADIO CORPORATION)
KAVL (610 AM; 5 kW; LANCASTER, CA; Owner: CITICASTERS LICENSES, L.P.)
KBLA (1580 AM; 50 kW; SANTA MONICA, CA)
Strongest FM radio stations in Lake Los Angeles:
K241AJ (96.1 FM; PALMDALE, CA; Owner: FAMILY STATIONS, INC.)
KCBS-FM (93.1 FM; LOS ANGELES, CA; Owner: INFINITY BROADCASTING OPERATIONS, INC.)
KSCA (101.9 FM; GLENDALE, CA; Owner: HBC LICENSE CORPORATION)
K212FA (90.3 FM; TEMPLE CITY, CA; Owner: EDUCATIONAL MEDIA FOUNDATION)
KLOS (95.5 FM; LOS ANGELES, CA; Owner: KLOS-FM RADIO, INC.)
KOST (103.5 FM; LOS ANGELES, CA; Owner: CAPSTAR TX LIMITED PARTNERSHIP)
KLVE (107.5 FM; LOS ANGELES, CA; Owner: KLVE-FM LICENSE CORP.)
KIIS-FM (102.7 FM; LOS ANGELES, CA; Owner: CITICASTERS LICENSES, L.P.)
KPCC (89.3 FM; PASADENA, CA; Owner: PASADENA AREA COMMUNITY COLLEGE DISTRICT)
KHHT (92.3 FM; LOS ANGELES, CA; Owner: AMFM RADIO LICENSES, L.L.C.)
KBIG-FM (104.3 FM; LOS ANGELES, CA; Owner: AMFM RADIO LICENSES, L.L.C.)
KMZT-FM (105.1 FM; LOS ANGELES, CA; Owner: MOUNT WILSON FM BROADCASTERS, INC.)
KPFK (90.7 FM; LOS ANGELES, CA; Owner: PACIFICA FOUNDATION, INC)
K216EM (91.1 FM; ARCADIA, CA; Owner: LIFE ON THE WAY COMMUNICATIONS, INC.)
KTWV (94.7 FM; LOS ANGELES, CA; Owner: INFINITY BROADCASTING OPERATIONS, INC.)
K202DJ (88.3 FM; PALMDALE, CA; Owner: SANTA MONICA COMMUNITY COLLEGE DIST.)
KZLA-FM (93.9 FM; LOS ANGELES, CA; Owner: EMMIS RADIO LICENSE CORPORATION)
KRTH-FM (101.1 FM; LOS ANGELES, CA; Owner: INFINITY BROADCASTING OPERATIONS, INC.)
KPWR (105.9 FM; LOS ANGELES, CA; Owner: EMMIS RADIO LICENSE CORPORATION)
KLSX (97.1 FM; LOS ANGELES, CA; Owner: INFINITY BROADCASTING OPERATIONS, INC.)
TV broadcast stations around Lake Los Angeles:
KTRO-LP (Channel 50; LANCASTER, CA; Owner: ROBERT D. ADELMAN)
KHIZ (Channel 64; BARSTOW, CA; Owner: SUNBELT TELEVISION, INC.)
KCBS-TV (Channel 2; LOS ANGELES, CA; Owner: CBS BROADCASTING INC.)
KTLA-TV (Channel 5; LOS ANGELES, CA; Owner: KTLA INC.)
KNBC (Channel 4; LOS ANGELES, CA; Owner: NBC SUBSIDIARY (KNBC-TV), INC.)
National Bridge Inventory (NBI) Statistics 1 Number of bridges10ft / 3.1m Total length3,978 Total average daily traffic79 Total average daily truck traffic4,376 Total future (year 2040) average daily traffic
FCC Registered Microwave Towers: 2
DPW38, 39750 163rd St E (Lat: 34.604250 Lon: -117.840583), Type: Ltower, Structure height: 56.1 m, Overall height: 58.5 m, Call Sign: WRCW465, Licensee ID: L01906014, Assigned Frequencies: 6004.50 MHz, 6004.50 MHz, 6004.50 MHz, 6004.50 MHz, 6004.50 MHz, 6004.50 MHz, 6004.50 MHz, 6004.50 MHz, 6004.50 MHz, 11545.0 MHz... (+8 more), Grant Date: 02/12/2019, Expiration Date: 02/12/2029, Certifier: Ted Pao, Registrant: Los Angeles Regional Interoperable Communications System, 2525 Corporate Place Suite #100, Los Angeles, CA 91754, Phone: (323) 881-8028, Email:
PUMP STATION 38 COW, 39750 163rd Street E (Lat: 34.604417 Lon: -117.839833), Type: Mtower, Structure height: 16.8 m, Overall height: 18.6 m, Call Sign: WRDN434, Assigned Frequencies: 11345.0 MHz, 11385.0 MHz, Grant Date: 06/11/2019, Expiration Date: 06/11/2029, Certifier: Robert P Walters, Registrant: At&t Services, Inc., 208 S Akard St, 20f, Dallas, TX 75202, Phone: (855) 699-7073, Fax: (214) 746-6410, Email:
FCC Registered Amateur Radio Licenses: 19 (
See the full list of FCC Registered Amateur Radio Licenses in Lake Los Angeles )
FAA Registered Aircraft: 1
Aircraft: REELY SKYCOUPE SA7WR (Category: Land, Seats: 2, Weight: Up to 12,499 Pounds, Speed: 85 mph), Engine: LYCOMING 0-290 SERIES (140 HP) (Reciprocating)N-Number: 4073K, N4073K, N-4073K, Serial Number: P422, Airworthiness Date: 09/08/1981, Certificate Issue Date: 06/05/2019Registrant (Individual): Don D Evans, Po Box 500140, Lake Los Angeles, CA 93550
Home Mortgage Disclosure Act Aggregated Statistics For Year 2009(Based on 1 partial tract) A) FHA, FSA/RHS & VA B) Conventional C) Refinancings D) Home Improvement Loans F) Non-occupant Loans on G) Loans On Manufactured Number Average Value Number Average Value Number Average Value Number Average Value Number Average Value Number Average Value
LOANS ORIGINATED 64 $78,770 44 $54,609 18 $120,693 1 $10,840 27 $48,490 1 $175,580 APPLICATIONS APPROVED, NOT ACCEPTED 9 $87,066 7 $63,711 3 $127,890 1 $24,390 3 $39,740 0 $0 APPLICATIONS DENIED 11 $68,525 7 $52,874 34 $131,235 5 $26,878 2 $39,830 0 $0 APPLICATIONS WITHDRAWN 10 $79,984 7 $56,513 15 $120,988 1 $13,550 7 $62,937 0 $0 FILES CLOSED FOR INCOMPLETENESS 2 $69,635 1 $65,030 3 $146,493 1 $26,550 1 $93,750 0 $0
Aggregated Statistics For Year 2008(Based on 1 partial tract) A) FHA, FSA/RHS & VA B) Conventional C) Refinancings D) Home Improvement Loans F) Non-occupant Loans on G) Loans On Manufactured Number Average Value Number Average Value Number Average Value Number Average Value Number Average Value Number Average Value
LOANS ORIGINATED 28 $128,682 36 $103,473 53 $136,140 4 $52,700 22 $96,581 1 $170,700 APPLICATIONS APPROVED, NOT ACCEPTED 3 $138,183 8 $175,711 15 $174,600 2 $25,470 2 $123,825 1 $46,600 APPLICATIONS DENIED 6 $117,502 20 $130,679 95 $183,077 17 $76,312 18 $132,796 1 $32,510 APPLICATIONS WITHDRAWN 5 $110,656 6 $97,000 26 $173,116 1 $266,610 4 $115,425 0 $0 FILES CLOSED FOR INCOMPLETENESS 1 $128,430 4 $128,160 8 $176,389 1 $150,650 1 $146,310 0 $0
Aggregated Statistics For Year 2007(Based on 1 partial tract) A) FHA, FSA/RHS & VA B) Conventional C) Refinancings D) Home Improvement Loans F) Non-occupant Loans on G) Loans On Manufactured Number Average Value Number Average Value Number Average Value Number Average Value Number Average Value Number Average Value
LOANS ORIGINATED 3 $183,523 82 $178,034 212 $181,956 28 $131,101 24 $162,818 3 $179,910 APPLICATIONS APPROVED, NOT ACCEPTED 0 $0 24 $169,299 71 $189,627 9 $106,934 11 $180,453 1 $123,550 APPLICATIONS DENIED 2 $220,555 57 $184,094 274 $211,369 39 $109,492 33 $204,690 2 $130,055 APPLICATIONS WITHDRAWN 2 $220,280 16 $176,354 99 $203,639 10 $170,644 7 $169,227 1 $220,010 FILES CLOSED FOR INCOMPLETENESS 0 $0 9 $199,961 36 $213,132 2 $187,225 1 $279,620 0 $0
Aggregated Statistics For Year 2006(Based on 1 partial tract) A) FHA, FSA/RHS & VA B) Conventional C) Refinancings D) Home Improvement Loans F) Non-occupant Loans on G) Loans On Manufactured Number Average Value Number Average Value Number Average Value Number Average Value Number Average Value Number Average Value
LOANS ORIGINATED 3 $244,757 305 $150,680 443 $183,220 53 $121,447 62 $177,280 8 $140,759 APPLICATIONS APPROVED, NOT ACCEPTED 0 $0 63 $146,132 95 $183,784 10 $135,367 20 $161,052 2 $143,875 APPLICATIONS DENIED 1 $185,870 143 $154,934 299 $191,015 47 $129,330 29 $167,989 5 $129,840 APPLICATIONS WITHDRAWN 1 $100,790 70 $167,083 214 $185,662 12 $167,628 11 $144,983 4 $197,930 FILES CLOSED FOR INCOMPLETENESS 0 $0 15 $178,069 37 $198,584 2 $179,910 3 $168,893 1 $34,140
Aggregated Statistics For Year 2005(Based on 1 partial tract) A) FHA, FSA/RHS & VA B) Conventional C) Refinancings D) Home Improvement Loans F) Non-occupant Loans on G) Loans On Manufactured Number Average Value Number Average Value Number Average Value Number Average Value Number Average Value Number Average Value
LOANS ORIGINATED 5 $229,116 341 $135,585 558 $153,682 67 $106,843 66 $139,597 4 $114,882 APPLICATIONS APPROVED, NOT ACCEPTED 0 $0 64 $136,406 104 $148,455 9 $97,120 19 $142,805 5 $111,632 APPLICATIONS DENIED 1 $213,510 101 $137,095 290 $161,279 68 $81,939 29 $153,077 5 $86,162 APPLICATIONS WITHDRAWN 1 $238,980 79 $131,051 280 $159,142 21 $150,571 20 $141,572 1 $29,800 FILES CLOSED FOR INCOMPLETENESS 0 $0 12 $134,527 45 $151,864 1 $34,680 3 $177,563 1 $52,020
Aggregated Statistics For Year 2004(Based on 1 partial tract) A) FHA, FSA/RHS & VA B) Conventional C) Refinancings D) Home Improvement Loans F) Non-occupant Loans on G) Loans On Manufactured Number Average Value Number Average Value Number Average Value Number Average Value Number Average Value Number Average Value
LOANS ORIGINATED 18 $149,354 304 $102,471 474 $116,957 51 $78,629 64 $113,333 3 $65,750 APPLICATIONS APPROVED, NOT ACCEPTED 2 $170,700 55 $108,272 106 $122,071 15 $89,197 12 $98,671 2 $108,920 APPLICATIONS DENIED 2 $140,350 85 $109,668 254 $118,557 48 $61,347 24 $113,077 0 $0 APPLICATIONS WITHDRAWN 4 $149,158 55 $99,453 194 $116,718 18 $90,257 14 $109,464 1 $132,770 FILES CLOSED FOR INCOMPLETENESS 1 $63,940 11 $103,749 44 $113,811 4 $50,938 1 $97,540 0 $0
Aggregated Statistics For Year 2003(Based on 1 partial tract) A) FHA, FSA/RHS & VA B) Conventional C) Refinancings D) Home Improvement Loans F) Non-occupant Loans on Number Average Value Number Average Value Number Average Value Number Average Value Number Average Value
LOANS ORIGINATED 38 $117,821 176 $83,911 473 $87,212 15 $28,504 79 $84,283 APPLICATIONS APPROVED, NOT ACCEPTED 3 $120,303 29 $98,925 86 $90,397 5 $26,120 14 $92,007 APPLICATIONS DENIED 7 $112,560 56 $83,133 270 $95,750 25 $31,647 25 $83,713 APPLICATIONS WITHDRAWN 8 $106,958 26 $83,369 164 $91,812 8 $37,865 11 $91,581 FILES CLOSED FOR INCOMPLETENESS 0 $0 2 $74,510 31 $88,854 2 $41,725 3 $77,310
Aggregated Statistics For Year 1999(Based on 1 partial tract) A) FHA, FSA/RHS & VA B) Conventional C) Refinancings D) Home Improvement Loans F) Non-occupant Loans on Number Average Value Number Average Value Number Average Value Number Average Value Number Average Value
LOANS ORIGINATED 11 $63,021 10 $83,379 11 $73,569 3 $17,590 5 $46,144 APPLICATIONS APPROVED, NOT ACCEPTED 0 $0 2 $43,030 3 $63,870 2 $17,770 1 $42,560 APPLICATIONS DENIED 2 $55,130 4 $53,802 14 $52,784 4 $16,460 1 $58,610 APPLICATIONS WITHDRAWN 1 $48,600 3 $75,827 8 $59,736 0 $0 1 $73,660 FILES CLOSED FOR INCOMPLETENESS 0 $0 0 $0 2 $76,210 0 $0 0 $0
Detailed HMDA statistics for the following Tracts:
9001.01
Private Mortgage Insurance Companies Aggregated Statistics For Year 2009(Based on 1 partial tract) A) Conventional B) Refinancings C) Non-occupant Loans on D) Loans On Manufactured Number Average Value Number Average Value Number Average Value Number Average Value
LOANS ORIGINATED 5 $65,244 1 $165,820 1 $31,970 0 $0 APPLICATIONS APPROVED, NOT ACCEPTED 2 $100,795 1 $175,580 0 $0 0 $0 APPLICATIONS DENIED 1 $31,970 0 $0 1 $31,970 0 $0 APPLICATIONS WITHDRAWN 1 $48,770 0 $0 0 $0 0 $0 FILES CLOSED FOR INCOMPLETENESS 1 $173,410 0 $0 0 $0 1 $173,410
Aggregated Statistics For Year 2008(Based on 1 partial tract) A) Conventional B) Refinancings C) Non-occupant Loans on D) Loans On Manufactured Number Average Value Number Average Value Number Average Value Number Average Value
LOANS ORIGINATED 15 $185,294 4 $272,575 2 $148,210 1 $170,700 APPLICATIONS APPROVED, NOT ACCEPTED 13 $197,668 8 $248,055 2 $176,115 0 $0 APPLICATIONS DENIED 6 $145,952 1 $124,640 2 $169,885 0 $0 APPLICATIONS WITHDRAWN 2 $133,850 1 $267,160 1 $125,720 0 $0 FILES CLOSED FOR INCOMPLETENESS 1 $351,690 0 $0 1 $125,720 0 $0
Aggregated Statistics For Year 2007(Based on 1 partial tract) A) Conventional B) Refinancings C) Non-occupant Loans on D) Loans On Manufactured Number Average Value Number Average Value Number Average Value Number Average Value
LOANS ORIGINATED 20 $229,955 22 $252,845 4 $207,955 1 $219,470 APPLICATIONS APPROVED, NOT ACCEPTED 2 $263,905 7 $249,429 0 $0 0 $0 APPLICATIONS DENIED 1 $277,990 2 $270,950 1 $136,560 0 $0 APPLICATIONS WITHDRAWN 2 $181,535 2 $212,155 0 $0 0 $0 FILES CLOSED FOR INCOMPLETENESS 1 $132,770 0 $0 0 $0 0 $0
Aggregated Statistics For Year 2006(Based on 1 partial tract) A) Conventional B) Refinancings C) Non-occupant Loans on Number Average Value Number Average Value Number Average Value
LOANS ORIGINATED 5 $267,048 11 $250,358 1 $238,440 APPLICATIONS APPROVED, NOT ACCEPTED 3 $223,987 3 $206,643 1 $255,780 APPLICATIONS DENIED 2 $271,765 3 $278,537 1 $139,270 APPLICATIONS WITHDRAWN 1 $253,610 2 $202,670 0 $0 FILES CLOSED FOR INCOMPLETENESS 0 $0 0 $0 0 $0
Aggregated Statistics For Year 2005(Based on 1 partial tract) A) Conventional B) Refinancings C) Non-occupant Loans on Number Average Value Number Average Value Number Average Value
LOANS ORIGINATED 8 $216,150 8 $191,020 2 $189,935 APPLICATIONS APPROVED, NOT ACCEPTED 1 $267,160 6 $174,492 0 $0 APPLICATIONS DENIED 2 $205,110 1 $119,760 2 $153,630 APPLICATIONS WITHDRAWN 1 $88,330 0 $0 0 $0 FILES CLOSED FOR INCOMPLETENESS 0 $0 0 $0 0 $0
Aggregated Statistics For Year 2004(Based on 1 partial tract) A) Conventional B) Refinancings C) Non-occupant Loans on Number Average Value Number Average Value Number Average Value
LOANS ORIGINATED 28 $156,938 15 $139,015 5 $149,890 APPLICATIONS APPROVED, NOT ACCEPTED 2 $138,185 5 $120,086 2 $97,540 APPLICATIONS DENIED 1 $97,540 0 $0 0 $0 APPLICATIONS WITHDRAWN 2 $81,015 1 $124,640 1 $51,480 FILES CLOSED FOR INCOMPLETENESS 0 $0 1 $70,990 0 $0
Aggregated Statistics For Year 2003(Based on 1 partial tract) A) Conventional B) Refinancings C) Non-occupant Loans on Number Average Value Number Average Value Number Average Value
LOANS ORIGINATED 43 $112,438 35 $98,920 9 $95,254 APPLICATIONS APPROVED, NOT ACCEPTED 9 $106,092 8 $99,506 2 $68,550 APPLICATIONS DENIED 2 $115,965 0 $0 1 $176,120 APPLICATIONS WITHDRAWN 1 $66,650 2 $86,435 0 $0 FILES CLOSED FOR INCOMPLETENESS 0 $0 0 $0 0 $0
Aggregated Statistics For Year 1999(Based on 1 partial tract) A) Conventional B) Refinancings C) Non-occupant Loans on Number Average Value Number Average Value Number Average Value
LOANS ORIGINATED 3 $50,210 1 $57,350 1 $22,210 APPLICATIONS APPROVED, NOT ACCEPTED 0 $0 0 $0 0 $0 APPLICATIONS DENIED 0 $0 0 $0 0 $0 APPLICATIONS WITHDRAWN 0 $0 0 $0 0 $0 FILES CLOSED FOR INCOMPLETENESS 0 $0 0 $0 0 $0
Detailed PMIC statistics for the following Tracts:
9001.01
Lake Los Angeles compared to California state average:
Median household income below state average. Median house value significantly below state average. Hispanic race population percentage above state average. Foreign-born population percentage below state average. Renting percentage below state average. Percentage of population with a bachelor's degree or higher significantly below state average. Lake Los Angeles on our top lists :
#2 on the list of "Top 101 cities with largest percentage of workers with very long commute times (90 or more minutes) (population 5,000+)"
#8 on the list of "Top 100 cities with longest commuting times (pop. 5,000+)"
#80 on the list of "Top 101 cities with the largest percentage of one, detached housing units in structures (2,000+ housing units)"
#7 (93591) on the list of "Top 101 zip codes with the lowest 2012 average taxable interest for individuals (pop 5,000+)"
#1 on the list of "Top 101 counties with the most Evangelical Protestant congregations"
#1 on the list of "Top 101 counties with the most Mainline Protestant congregations"
#1 on the list of "Top 101 counties with the most Orthodox adherents"
#1 on the list of "Top 101 counties with the highest ground withdrawal of fresh water for public supply (pop. 50,000+)"
#1 on the list of "Top 101 counties with the most Catholic adherents (pop. 50,000+)"


 Recent articles from our blog. Our writers, many of them Ph.D. graduates or candidates, create easy-to-read articles on a wide variety of topics.


 (15.4 miles


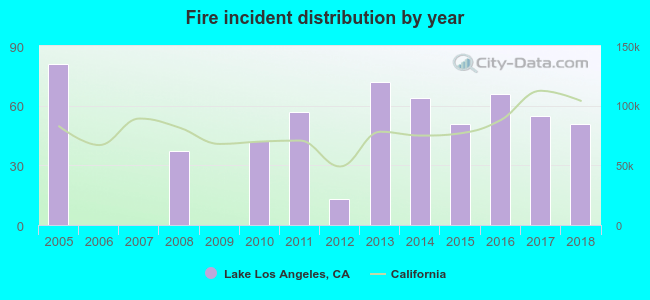 Based on the data from the years 2005 - 2018 the average number of fires per year is 42. The highest number of reported fires - 81 took place in 2005, and the least - 0 in 2006. The data has a declining trend.
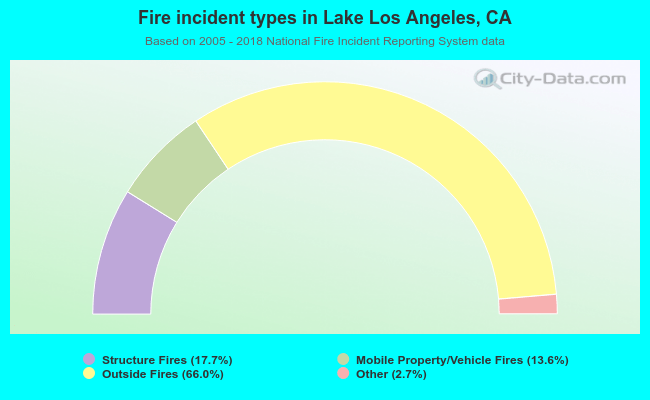 When looking into fire subcategories, the most reports belonged to: Outside Fires (66.0%), and Structure Fires (17.7%).