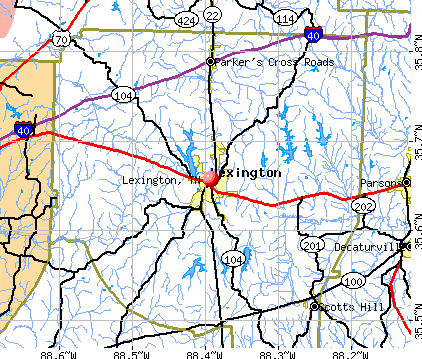
Lexington, Tennessee
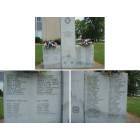
Lexington: Henderson County Veterans Memorial
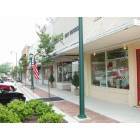
Lexington: Main Street
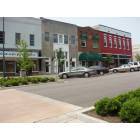
Lexington: Monroe Avenue

Lexington: Lexington, TN: Henderson County Courthouse
Lexington: do u know where this cave is?

Lexington: Beech Lake
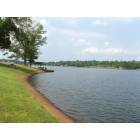
Lexington: Lexington, TN: Beech Lake
- add
your


Submit your own pictures of this city and show them to the world
- OSM Map
- General Map
- Google Map
- MSN Map
Population change since 2000: +7.6%
 |
| Males: 3,719 | |
| Females: 4,233 |
| Median resident age: | 36.9 years |
| Tennessee median age: | 39.2 years |
Zip codes: 38388.
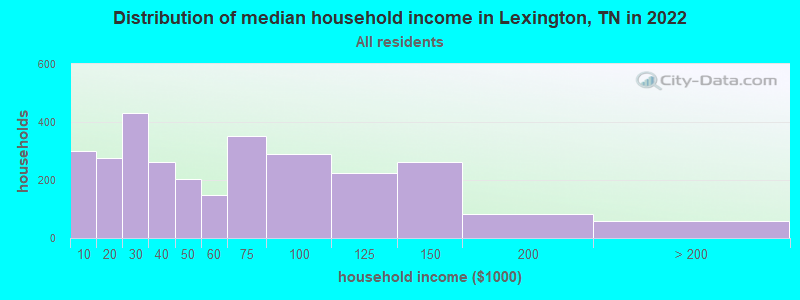
| Lexington: | $46,750 |
| TN: | $65,254 |
Estimated per capita income in 2022: $23,329 (it was $18,368 in 2000)
Lexington city income, earnings, and wages data
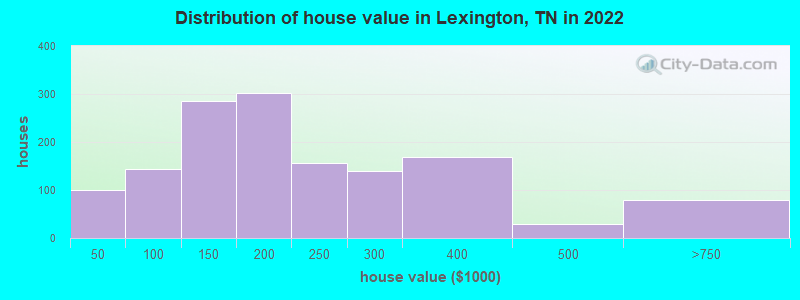
Estimated median house or condo value in 2022: $194,734 (it was $78,800 in 2000)
| Lexington: | $194,734 |
| TN: | $284,800 |
Mean prices in 2022: all housing units: $229,785; detached houses: $235,920; mobile homes: $27,750
Median gross rent in 2022: $752.
(20.7% for White Non-Hispanic residents, 19.1% for Black residents, 71.4% for Hispanic or Latino residents, 100.0% for Native Hawaiian and other Pacific Islander residents, 100.0% for other race residents, 7.5% for two or more races residents)
Detailed information about poverty and poor residents in Lexington, TN


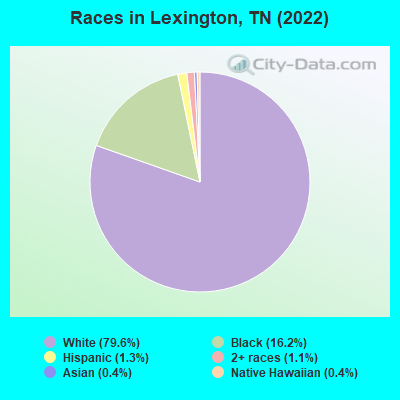
- 6,42379.6%White alone
- 1,30916.2%Black alone
- 1011.3%Hispanic
- 901.1%Two or more races
- 360.4%Asian alone
- 300.4%Native Hawaiian and Other
Pacific Islander alone
Races in Lexington detailed stats: ancestries, foreign born residents, place of birth
According to our research of Tennessee and other state lists, there were 72 registered sex offenders living in Lexington, Tennessee as of April 25, 2024.
The ratio of all residents to sex offenders in Lexington is 110 to 1.
Type |
2009 |
2010 |
2011 |
2012 |
2013 |
2014 |
2015 |
2016 |
2017 |
2018 |
2019 |
2020 |
2021 |
2022 |
|---|---|---|---|---|---|---|---|---|---|---|---|---|---|---|
| Murders (per 100,000) | 0 (0.0) | 1 (13.1) | 0 (0.0) | 0 (0.0) | 0 (0.0) | 0 (0.0) | 0 (0.0) | 0 (0.0) | 0 (0.0) | 0 (0.0) | 0 (0.0) | 1 (12.6) | 1 (12.7) | 1 (12.6) |
| Rapes (per 100,000) | 2 (25.3) | 6 (78.4) | 0 (0.0) | 4 (51.6) | 5 (63.7) | 2 (25.3) | 3 (38.1) | 2 (25.4) | 3 (38.5) | 4 (52.1) | 2 (25.9) | 5 (63.2) | 10 (126.8) | 2 (25.2) |
| Robberies (per 100,000) | 7 (88.5) | 4 (52.3) | 5 (64.8) | 6 (77.4) | 6 (76.5) | 4 (50.6) | 5 (63.5) | 6 (76.3) | 3 (38.5) | 3 (39.1) | 2 (25.9) | 1 (12.6) | 3 (38.0) | 0 (0.0) |
| Assaults (per 100,000) | 60 (758.7) | 81 (1,059) | 72 (932.5) | 106 (1,367) | 79 (1,007) | 33 (417.1) | 45 (571.6) | 51 (648.9) | 65 (834.2) | 38 (495.2) | 42 (543.8) | 34 (429.6) | 35 (443.7) | 21 (264.4) |
| Burglaries (per 100,000) | 79 (999.0) | 82 (1,072) | 97 (1,256) | 69 (889.7) | 82 (1,045) | 54 (682.5) | 44 (558.9) | 33 (419.9) | 36 (462.0) | 38 (495.2) | 24 (310.8) | 18 (227.4) | 17 (215.5) | 29 (365.1) |
| Thefts (per 100,000) | 342 (4,325) | 336 (4,391) | 396 (5,129) | 343 (4,423) | 307 (3,914) | 263 (3,324) | 219 (2,782) | 206 (2,621) | 230 (2,952) | 251 (3,271) | 201 (2,603) | 160 (2,021) | 145 (1,838) | 134 (1,687) |
| Auto thefts (per 100,000) | 18 (227.6) | 17 (222.2) | 10 (129.5) | 17 (219.2) | 18 (229.5) | 10 (126.4) | 15 (190.5) | 18 (229.0) | 27 (346.5) | 20 (260.7) | 13 (168.3) | 25 (315.9) | 21 (266.2) | 21 (264.4) |
| Arson (per 100,000) | 1 (12.6) | 6 (78.4) | 0 (0.0) | 1 (12.9) | 0 (0.0) | 1 (12.6) | 1 (12.7) | 1 (12.7) | 0 (0.0) | 1 (13.0) | 0 (0.0) | 1 (12.6) | 2 (25.4) | 1 (12.6) |
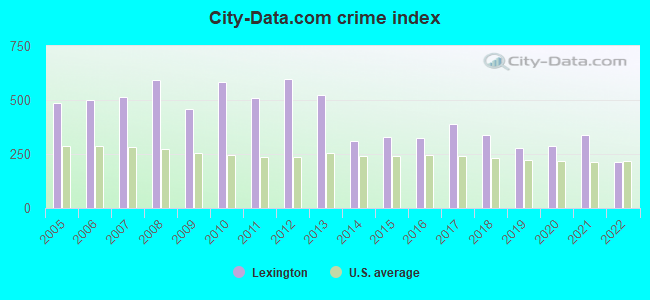
| City-Data.com crime index | 459.7 | 584.7 | 509.4 | 594.6 | 523.5 | 309.7 | 329.5 | 325.6 | 387.3 | 338.9 | 276.6 | 287.6 | 336.8 | 212.4 |
The City-Data.com crime index weighs serious crimes and violent crimes more heavily. Higher means more crime, U.S. average is 246.1. It adjusts for the number of visitors and daily workers commuting into cities.
Crime rate in Lexington detailed stats: murders, rapes, robberies, assaults, burglaries, thefts, arson
Full-time law enforcement employees in 2021, including police officers: 35 (29 officers - 24 male; 5 female).
| Officers per 1,000 residents here: | 3.68 |
| Tennessee average: | 2.57 |
 Recent articles from our blog. Our writers, many of them Ph.D. graduates or candidates, create easy-to-read articles on a wide variety of topics.


 | Igor Blevin's, "A Native Californian in Knoxville" (220 replies) |
| Christmas Day explosion in Downtown Nashville (119 replies) |
| Looking at a farm in Lexington TN (7 replies) |
| Month long road trip -(Dec-Jan) . (12 replies) |
| Leaving California Coast for Tennessee (knoxville/maryville) (60 replies) |
| Working at McGhee Tyson Airport. Where to live. (13 replies) |
Latest news from Lexington, TN collected exclusively by city-data.com from local newspapers, TV, and radio stations
Ancestries: American (20.1%), African (18.7%), Irish (13.3%), English (12.2%), German (7.1%), Scottish (3.3%).
Current Local Time: CST time zone
Incorporated in 1824
Elevation: 503 feet
Land area: 11.5 square miles.
Population density: 689 people per square mile (low).
44 residents are foreign born
| This city: | 0.5% |
| Tennessee: | 5.4% |
Median real estate property taxes paid for housing units with mortgages in 2022: $1,107 (0.6%)
Median real estate property taxes paid for housing units with no mortgage in 2022: $949 (0.5%)
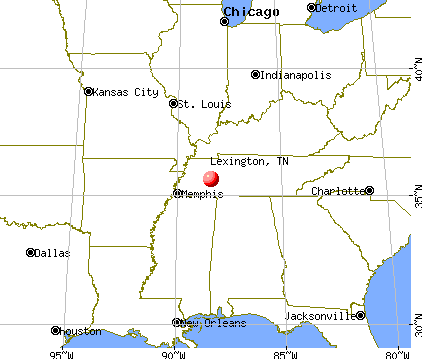
Nearest city with pop. 50,000+: Jackson, TN  (24.1 miles , pop. 59,643).
Nearest city with pop. 200,000+: Memphis, TN (96.5 miles , pop. 650,100).
Nearest city with pop. 1,000,000+: Chicago, IL (429.4 miles , pop. 2,896,016).
Nearest cities:
), ), ), ), ), )Latitude: 35.66 N, Longitude: 88.39 W
Daytime population change due to commuting: +3,737 (+46.3%)
Workers who live and work in this city: 1,895 (62.3%)
Area code: 731
Lexington, Tennessee accommodation & food services, waste management - Economy and Business Data
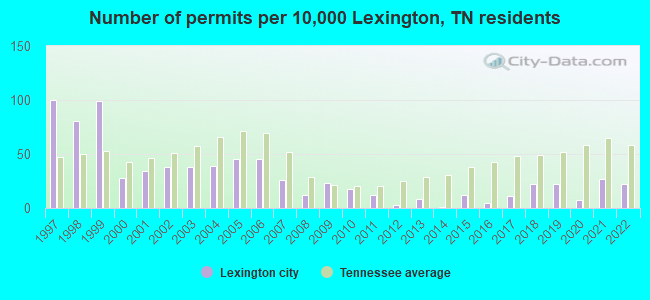
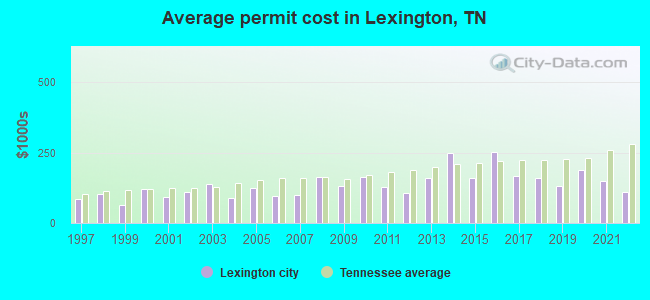
Single-family new house construction building permits:
- 2022: 16 buildings, average cost: $108,800
- 2021: 20 buildings, average cost: $150,000
- 2020: 5 buildings, average cost: $186,600
- 2019: 16 buildings, average cost: $130,100
- 2018: 16 buildings, average cost: $161,200
- 2017: 8 buildings, average cost: $167,500
- 2016: 4 buildings, average cost: $250,800
- 2015: 9 buildings, average cost: $159,800
- 2014: 1 building, cost: $247,000
- 2013: 6 buildings, average cost: $157,700
- 2012: 2 buildings, average cost: $105,000
- 2011: 9 buildings, average cost: $125,900
- 2010: 13 buildings, average cost: $162,800
- 2009: 17 buildings, average cost: $133,200
- 2008: 9 buildings, average cost: $163,600
- 2007: 19 buildings, average cost: $98,200
- 2006: 33 buildings, average cost: $94,400
- 2005: 33 buildings, average cost: $125,400
- 2004: 29 buildings, average cost: $88,900
- 2003: 28 buildings, average cost: $138,300
- 2002: 28 buildings, average cost: $110,900
- 2001: 25 buildings, average cost: $91,500
- 2000: 21 buildings, average cost: $120,600
- 1999: 73 buildings, average cost: $64,400
- 1998: 60 buildings, average cost: $102,000
- 1997: 74 buildings, average cost: $84,600
| Here: | 3.4% |
| Tennessee: | 3.0% |
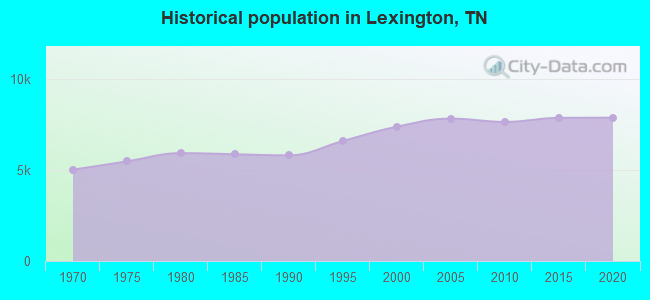
Population change in the 1990s: +74 (+1.0%).
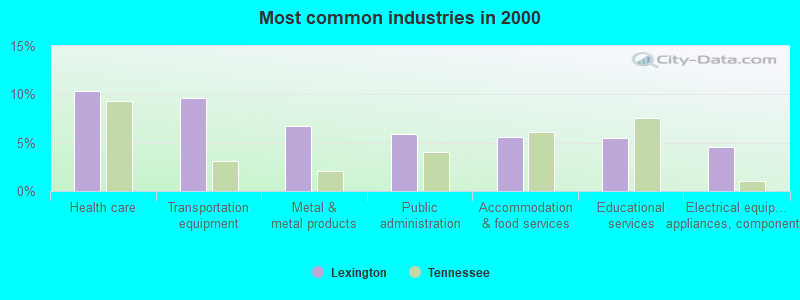
- Health care (10.3%)
- Transportation equipment (9.6%)
- Metal & metal products (6.7%)
- Public administration (5.9%)
- Accommodation & food services (5.6%)
- Educational services (5.4%)
- Electrical equipment, appliances, components (4.6%)
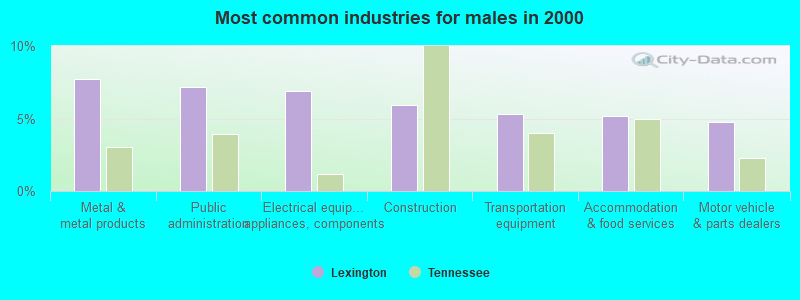
- Metal & metal products (7.7%)
- Public administration (7.2%)
- Electrical equipment, appliances, components (6.9%)
- Construction (5.9%)
- Transportation equipment (5.3%)
- Accommodation & food services (5.2%)
- Motor vehicle & parts dealers (4.7%)
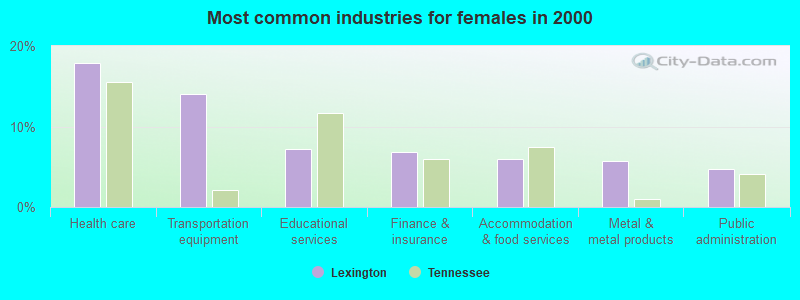
- Health care (17.9%)
- Transportation equipment (14.0%)
- Educational services (7.2%)
- Finance & insurance (6.8%)
- Accommodation & food services (6.0%)
- Metal & metal products (5.7%)
- Public administration (4.7%)
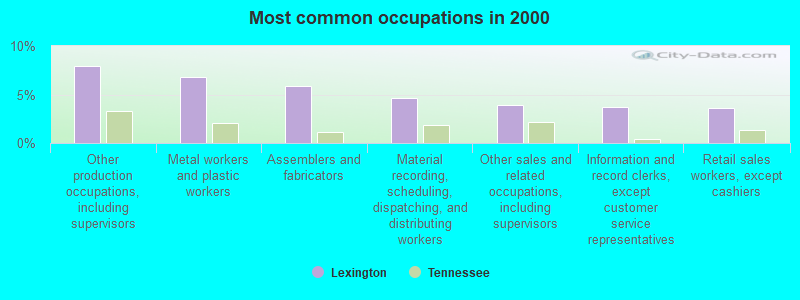
- Other production occupations, including supervisors (7.9%)
- Metal workers and plastic workers (6.8%)
- Assemblers and fabricators (5.9%)
- Material recording, scheduling, dispatching, and distributing workers (4.7%)
- Other sales and related occupations, including supervisors (3.9%)
- Information and record clerks, except customer service representatives (3.7%)
- Retail sales workers, except cashiers (3.6%)
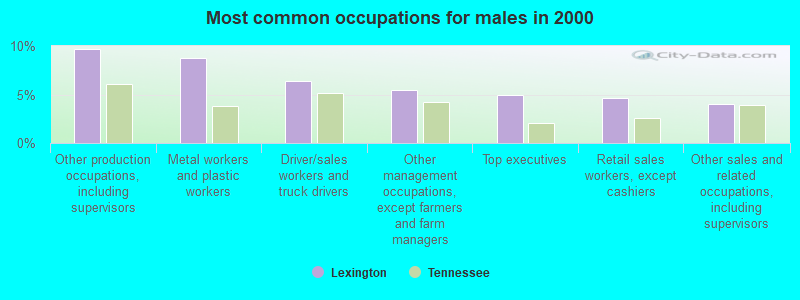
- Other production occupations, including supervisors (9.7%)
- Metal workers and plastic workers (8.7%)
- Driver/sales workers and truck drivers (6.4%)
- Other management occupations, except farmers and farm managers (5.5%)
- Top executives (4.9%)
- Retail sales workers, except cashiers (4.7%)
- Other sales and related occupations, including supervisors (4.0%)
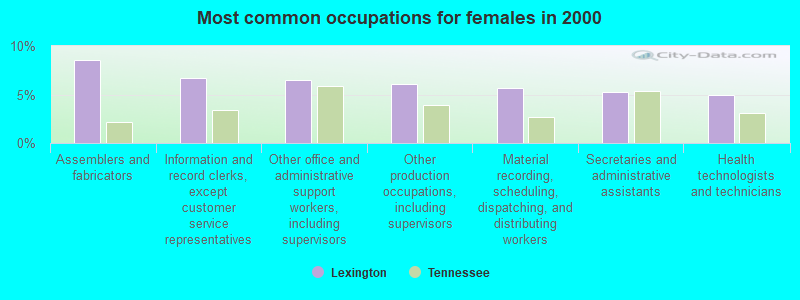
- Assemblers and fabricators (8.5%)
- Information and record clerks, except customer service representatives (6.7%)
- Other office and administrative support workers, including supervisors (6.5%)
- Other production occupations, including supervisors (6.1%)
- Material recording, scheduling, dispatching, and distributing workers (5.6%)
- Secretaries and administrative assistants (5.2%)
- Health technologists and technicians (5.0%)
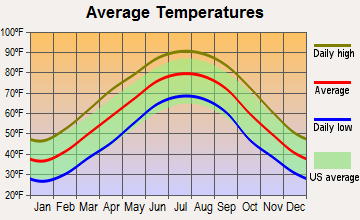
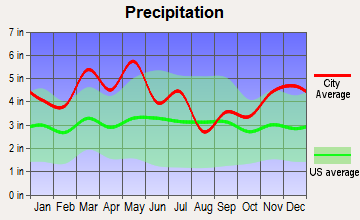
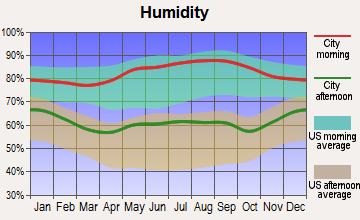
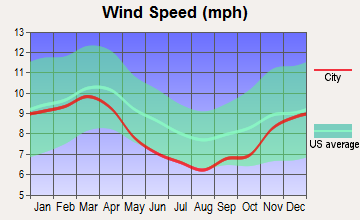
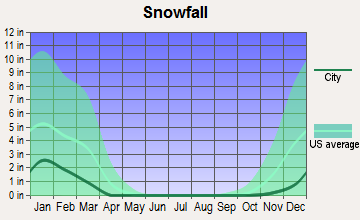
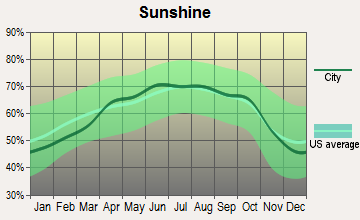
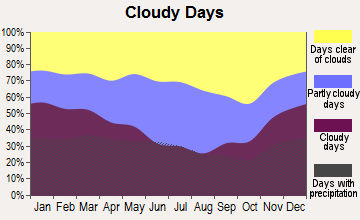
Average climate in Lexington, Tennessee
Based on data reported by over 4,000 weather stations
|
|

(lower is better)
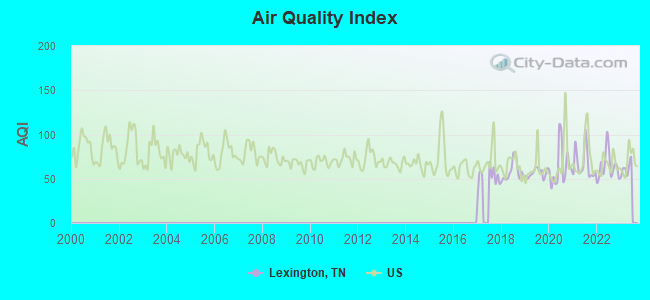
Air Quality Index (AQI) level in 2022 was 64.2. This is about average.
| City: | 64.2 |
| U.S.: | 72.6 |
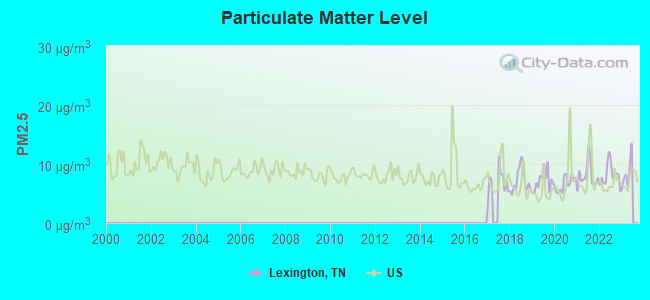
Particulate Matter (PM2.5) [µg/m3] level in 2022 was 8.18. This is about average. Closest monitor was 23.4 miles away from the city center.
| City: | 8.18 |
| U.S.: | 8.11 |
Tornado activity:
Lexington-area historical tornado activity is slightly above Tennessee state average. It is 84% greater than the overall U.S. average.
On 5/4/2003, a category F4 (max. wind speeds 207-260 mph) tornado 2.4 miles away from the Lexington city center killed 11 people and injured 86 people and caused $40 million in damages.
On 4/3/1956, a category F4 tornado 5.0 miles away from the city center killed 3 people and injured 60 people and caused between $500,000 and $5,000,000 in damages.
Earthquake activity:
Lexington-area historical earthquake activity is significantly above Tennessee state average. It is 298% greater than the overall U.S. average.On 5/4/1991 at 01:18:54, a magnitude 5.0 (4.4 MB, 4.6 LG, 5.0 LG, Depth: 3.1 mi, Class: Moderate, Intensity: VI - VII) earthquake occurred 101.6 miles away from the city center
On 3/25/1976 at 00:41:20, a magnitude 5.0 (4.9 MB, 5.0 LG) earthquake occurred 108.7 miles away from Lexington center
On 4/18/2008 at 09:36:59, a magnitude 5.4 (5.1 MB, 4.8 MS, 5.4 MW, 5.2 MW) earthquake occurred 195.3 miles away from the city center
On 9/26/1990 at 13:18:51, a magnitude 5.0 (4.7 MB, 4.8 LG, 5.0 LG, Depth: 7.7 mi) earthquake occurred 122.3 miles away from Lexington center
On 4/27/1989 at 16:47:49, a magnitude 4.7 (4.6 MB, 4.7 LG, 4.3 LG, Class: Light, Intensity: IV - V) earthquake occurred 80.8 miles away from the city center
On 4/18/2008 at 09:36:59, a magnitude 5.2 (5.2 MW, Depth: 8.9 mi) earthquake occurred 195.3 miles away from the city center
Magnitude types: regional Lg-wave magnitude (LG), body-wave magnitude (MB), surface-wave magnitude (MS), moment magnitude (MW)
Natural disasters:
The number of natural disasters in Henderson County (17) is near the US average (15).Major Disasters (Presidential) Declared: 14
Emergencies Declared: 1
Causes of natural disasters: Storms: 13, Floods: 11, Tornadoes: 10, Winds: 7, Flash Flood: 1, Hurricane: 1, Ice Storm: 1, Winter Storm: 1, Other: 1 (Note: some incidents may be assigned to more than one category).

Hospitals and medical centers in Lexington:
- HENDERSON COUNTY COMMUNITY HOSPITAL (Proprietary, 200 W CHURCH ST)
- METHODIST HOMECARE SVCS OF LEXINGTON (200 WEST CHURCH STREET)
- BRIARWOOD COMMUNITY LIVING CTR (41 HOSPITAL DRIVE, PO BOX 1067)
- BRIARWOOD MANOR (41 HOSPITAL DRIVE)
- LEXINGTON MANOR (727 EAST CHURCH STREET)
- DCI BEECH LAKE (870 W CHURCH STREET)
- LEXINGTON DIALYSIS (317 WEST CHURCH STREET)
- REGIONAL HOME CARE LEXINGTON (14 MONROE STREET 2ND FLOOR SUITE C)
College/University in Lexington:
Colleges/universities with over 2000 students nearest to Lexington:
- Jackson State Community College (about 22 miles; Jackson, TN; Full-time enrollment: 2,958)
- Union University (about 27 miles; Jackson, TN; FT enrollment: 4,051)
- Bethel University (about 35 miles; McKenzie, TN; FT enrollment: 5,878)
- The University of Tennessee-Martin (about 55 miles; Martin, TN; FT enrollment: 7,013)
- Dyersburg State Community College (about 63 miles; Dyersburg, TN; FT enrollment: 2,211)
- Murray State University (about 67 miles; Murray, KY; FT enrollment: 8,930)
- Northeast Mississippi Community College (about 70 miles; Booneville, MS; FT enrollment: 3,024)
Public high school in Lexington:
- LEXINGTON HIGH SCHOOL (Students: 1,017, Location: 284 WHITE ST, Grades: 9-12)
Private high school in Lexington:
Public elementary/middle schools in Lexington:
- PAUL G. CAYWOOD ELEMENTARY (Students: 741, Location: 162 MONROE AV, Grades: PK-5)
- PIN OAK ELEMENTARY (Students: 396, Location: 19925 HWY 412 EAST, Grades: PK-8)
- SOUTH HAVEN ELEMENTARY (Students: 358, Location: 5455 HIGHWAY 22 A, Grades: PK-8)
- BARGERTON ELEMENTARY (Students: 260, Location: 6141 POPLAR SPRINGS/BARGERTON, Grades: PK-8)
- LEXINGTON MIDDLE SCHOOL (Location: 112 AIRWAYS, Grades: 6-8)
User-submitted facts and corrections:
- METHODIST HEALTHCARE LEXINGTON HOSP (200 W CHURCH ST) is Henderson County Community Hospital, 200 West Church St., Lexington, TN 38351
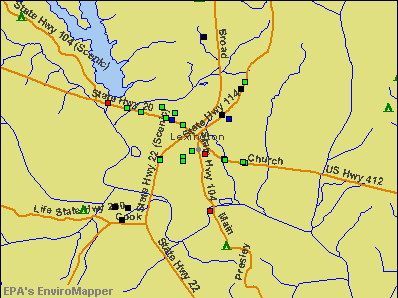
Points of interest:
Notable locations in Lexington: Lexington Landfill (A), Henderson County Courthouse (B), Lexington Fire Department Station 2 (C), Lexington Fire Department Station 1 Headquarters (D), Henderson County Rescue Squad (E), Lexington City Hall (F), Everett Horn Library (G), Henderson County Fire Department Station 7 (H), Henderson County EMS (I). Display/hide their locations on the map
Shopping Centers: Eastgate Shopping Center (1), Beechlake Shopping Center (2). Display/hide their locations on the map
Churches in Lexington include: Stringtown Church (A), Broad Street Church of Christ (B), First United Methodist Church (C), Keys Chapel United Methodist Church (D), Lewis Chapel African Methodist Episcopal Church (E). Display/hide their locations on the map
Cemetery: Beech River Cemetery (1). Display/hide its location on the map
Lakes and reservoirs: Carrington Pond (A), Beech Lake (B). Display/hide their locations on the map
Streams, rivers, and creeks: Brazil Branch (A), Wolf Creek (B). Display/hide their locations on the map
Park in Lexington: Amis City Park (1). Display/hide its location on the map
Tourist attractions: Beech River Heritage Museum (26 South Broad Street) (1), Gore Amusement CO (Arcades & Amusements; 82 Hatchett Road) (2), Eastgate Lanes (Arcades & Amusements; 759 East Church Street) (3), Confederate Bushwacking (Tours & Charters; 20650 Highway 22 North) (4). Display/hide their approximate locations on the map
Hotels: Econo Lodge (732 West Church Street) (1), Days Inn of Lexington (41 West Church Street) (2), Econo Lodge Lexington (732 West Church Street) (3). Display/hide their approximate locations on the map
Courts: Henderson County - General Sessions Court Clerk- Circuit Court Clerk (Courthouse) (1), Court Square Antiques (14 Monroe) (2), Henderson County - Juvenile Court (17 Monroe Avenue) (3), Henderson County - Juvenile Court Clerk (Courthouse) (4). Display/hide their approximate locations on the map
Birthplace of: Eddie Gilbert (wrestler) - Professional wrestler, Doug Gilbert - Professional wrestler, Neil Wilson (baseball) - Baseball player.
Drinking water stations with addresses in Lexington and their reported violations in the past:
LEXINGTON WATER SYSTEMS (Population served: 23,380, Surface water):Past health violations:Past monitoring violations:
- MCL, Monthly (TCR) - In OCT-2007, Contaminant: Coliform. Follow-up actions: St Compliance achieved (NOV-30-2007), St Public Notif requested (DEC-03-2007), St Violation/Reminder Notice (DEC-03-2007), St Formal NOV issued (AUG-06-2008), St BCA signed (AUG-11-2008)
- Monitoring and Reporting (DBP) - Between OCT-2008 and DEC-2008, Contaminant: Chlorine. Follow-up actions: St Public Notif requested (JAN-30-2009), St Violation/Reminder Notice (JAN-30-2009), St Compliance achieved (MAR-31-2009)
- Monitoring and Reporting (DBP) - Between APR-2008 and JUN-2008, Contaminant: Chlorine. Follow-up actions: St Public Notif requested (JUN-30-2008), St Violation/Reminder Notice (JUN-30-2008), St Formal NOV issued (AUG-06-2008), St BCA signed (AUG-11-2008), St Compliance achieved (SEP-30-2008)
- Monitoring and Reporting (DBP) - Between APR-2006 and JUN-2006, Contaminant: Chlorine. Follow-up actions: St Compliance achieved (JUL-01-2006), St Public Notif requested (JUL-31-2006), St Violation/Reminder Notice (JUL-31-2006), St Public Notif received (JUN-01-2007)
- Monitoring and Reporting (DBP) - Between APR-2005 and JUN-2005, Contaminant: CARBON, TOTAL. Follow-up actions: St Public Notif requested (JUN-30-2005), St Violation/Reminder Notice (JUN-30-2005), St Compliance achieved (JUL-01-2005)
- One routine major monitoring violation
- One minor monitoring violation
| This city: | 2.4 people |
| Tennessee: | 2.5 people |
| This city: | 64.4% |
| Whole state: | 67.3% |
| This city: | 5.4% |
| Whole state: | 5.8% |
Likely homosexual households (counted as self-reported same-sex unmarried-partner households)
- Lesbian couples: 0.5% of all households
- Gay men: 0.2% of all households
76 people in federal detention centers in 2010
People in group quarters in Lexington in 2000:
- 174 people in nursing homes
- 84 people in local jails and other confinement facilities (including police lockups)
- 25 people in homes for the mentally retarded
- 22 people in other noninstitutional group quarters
- 13 people in unknown juvenile institutions
- 12 people in other group homes
Banks with branches in Lexington (2011 data):
- First Bank: at 30 South Main Street, West End Branch, 53 East Church Street Branch, Lexington Branch, Henderson County Branch. Info updated 2012/02/21: Bank assets: $2,074.4 mil, Deposits: $1,734.5 mil, local headquarters, positive income, Commercial Lending Specialization, 54 total offices, Holding Company: First South Bancorp, Inc.
- Regions Bank: Beech Lake Branch at 605 West Church Street, branch established on 2009/07/01; Lexington Branch at 26 East Church Street, branch established on 1907/08/06. Info updated 2011/02/24: Bank assets: $123,368.2 mil, Deposits: $98,301.3 mil, headquarters in Birmingham, AL, positive income, Commercial Lending Specialization, 1778 total offices, Holding Company: Regions Financial Corporation
- Community Bank: Community Bank at 19 Natchez Trace Drive, branch established on 1961/08/04; West Church Street Branch at 435 West Church Street, branch established on 1998/06/01. Info updated 2006/11/03: Bank assets: $107.7 mil, Deposits: $89.8 mil, local headquarters, positive income, Commercial Lending Specialization, 3 total offices, Holding Company: Community National Corporation
- Community South Bank: Lexington Branch at 386 West Church Street, branch established on 2007/07/17. Info updated 2007/01/18: Bank assets: $569.9 mil, Deposits: $534.2 mil, headquarters in Parsons, TN, negative income in the last year, Commercial Lending Specialization, 23 total offices, Holding Company: Tennessee Central Bancshares, Inc.
- Clayton Bank and Trust: Lexington Branch at 679 West Church Street, branch established on 1997/04/22. Info updated 2011/11/16: Bank assets: $628.8 mil, Deposits: $500.3 mil, headquarters in Knoxville, TN, positive income, Commercial Lending Specialization, 14 total offices, Holding Company: Clayton Bancorp, Inc
- First State Bank: at 347 West Church Street, branch established on 1997/12/28. Info updated 2006/11/03: Bank assets: $1,646.2 mil, Deposits: $1,393.0 mil, headquarters in Union City, TN, positive income, Commercial Lending Specialization, 32 total offices, Holding Company: Community First Bancshares, Inc.
For population 15 years and over in Lexington:
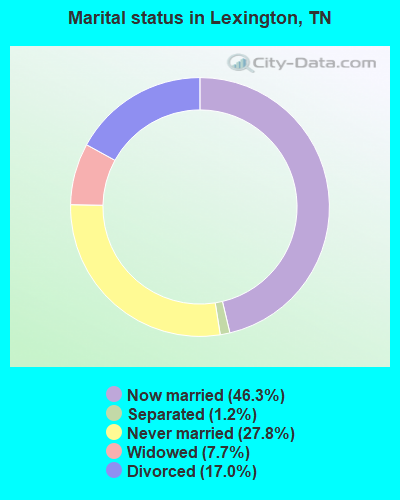
- Never married: 27.8%
- Now married: 46.3%
- Separated: 1.2%
- Widowed: 7.7%
- Divorced: 17.0%
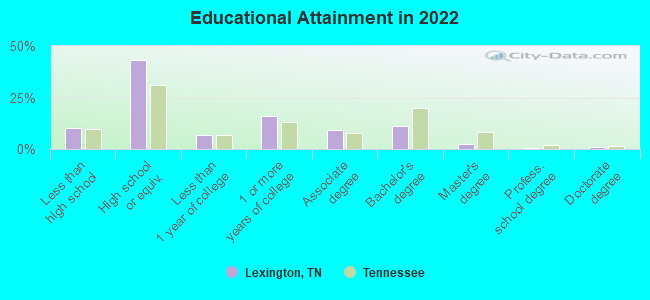
For population 25 years and over in Lexington:
- High school or higher: 88.7%
- Bachelor's degree or higher: 14.0%
- Graduate or professional degree: 3.4%
- Unemployed: 5.0%
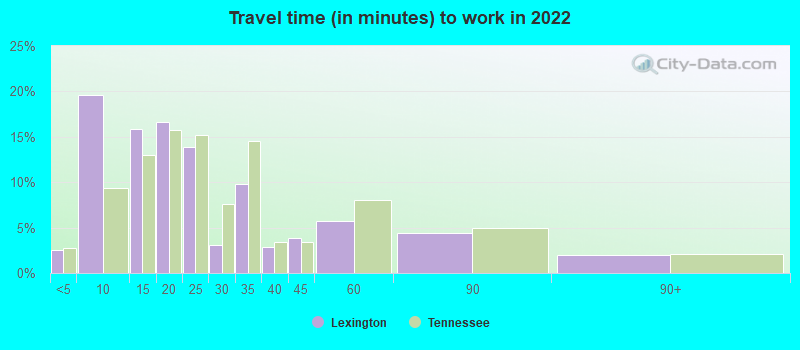
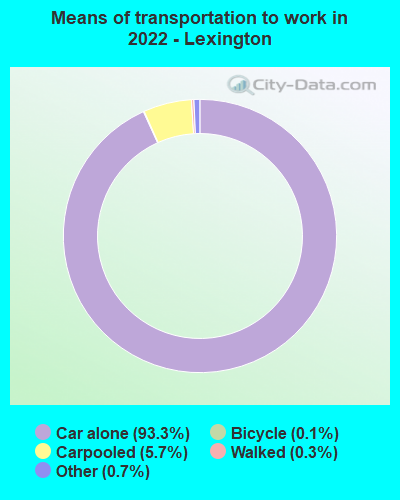
- Mean travel time to work (commute): 25.4 minutes
| Here: | 8.8 |
| Tennessee average: | 11.4 |
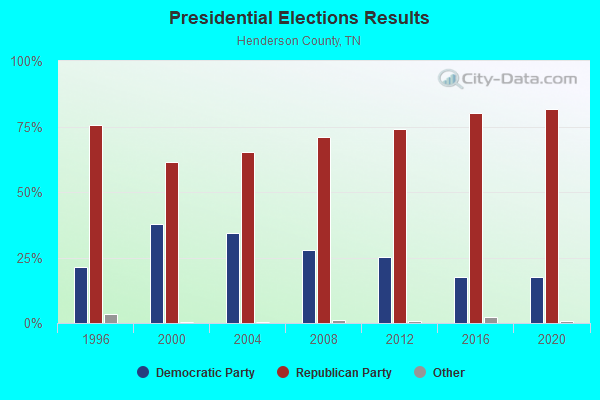
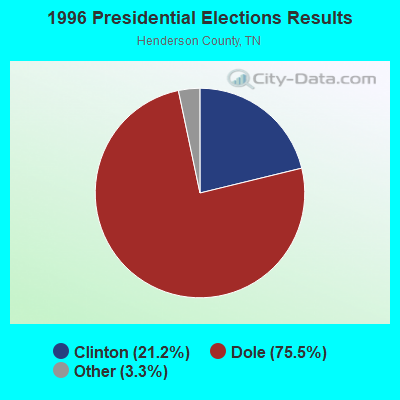
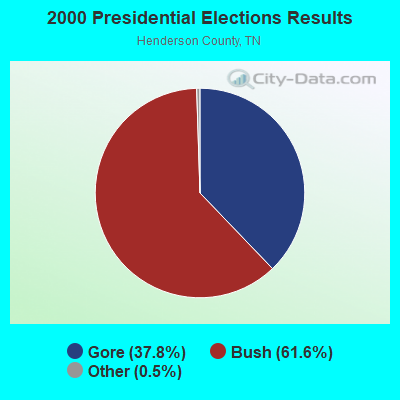
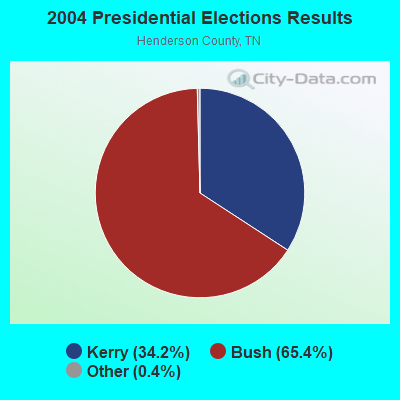
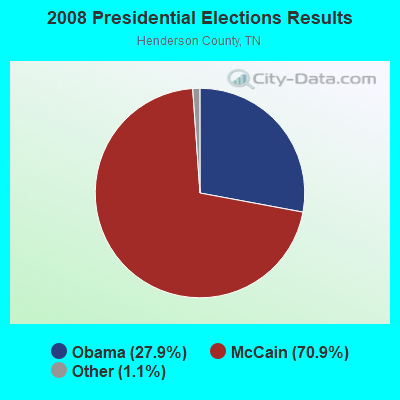
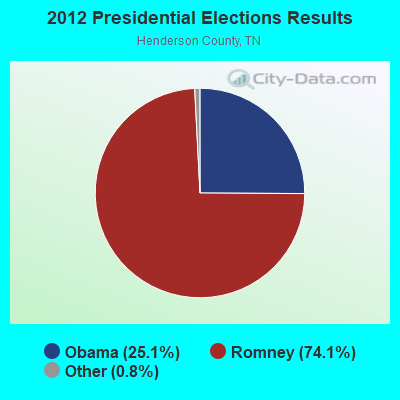
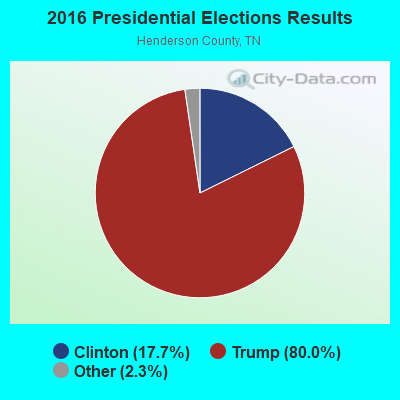
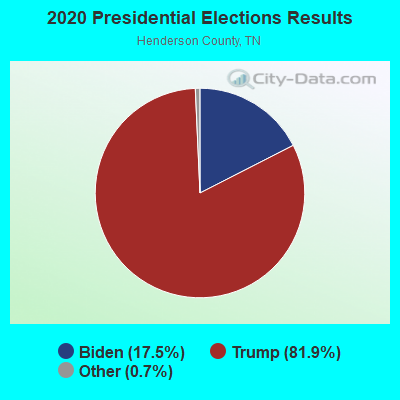
Graphs represent county-level data. Detailed 2008 Election Results
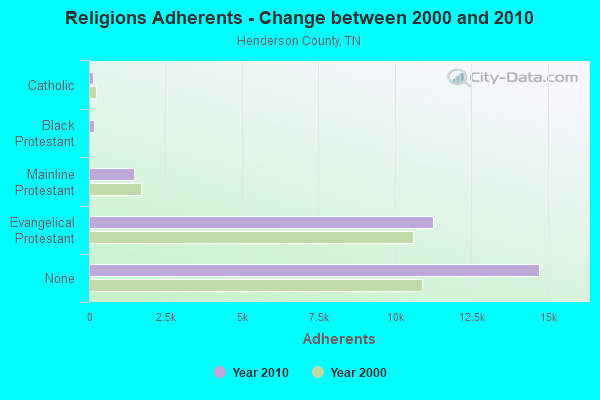
Religion statistics for Lexington, TN (based on Henderson County data)
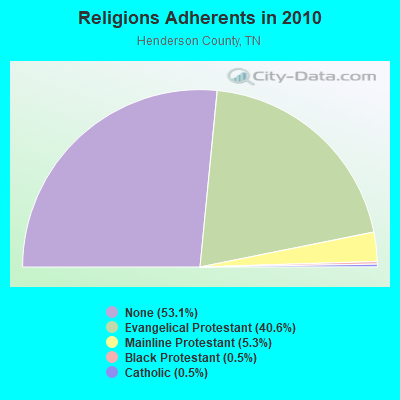
| Religion | Adherents | Congregations |
|---|---|---|
| Evangelical Protestant | 11,263 | 49 |
| Mainline Protestant | 1,475 | 12 |
| Black Protestant | 148 | 2 |
| Catholic | 140 | 1 |
| Other | 8 | 1 |
| None | 14,735 | - |
Food Environment Statistics:
| Here: | 1.87 / 10,000 pop. |
| Tennessee: | 1.99 / 10,000 pop. |
| Henderson County: | 0.37 / 10,000 pop. |
| State: | 0.65 / 10,000 pop. |
| Henderson County: | 8.99 / 10,000 pop. |
| Tennessee: | 5.16 / 10,000 pop. |
| Here: | 6.00 / 10,000 pop. |
| Tennessee: | 6.56 / 10,000 pop. |
| Henderson County: | 10.3% |
| Tennessee: | 11.4% |
| Henderson County: | 29.0% |
| Tennessee: | 30.2% |
| Henderson County: | 14.2% |
| Tennessee: | 13.5% |
Health and Nutrition:
| This city: | 46.4% |
| State: | 49.3% |
| Here: | 41.1% |
| State: | 46.1% |
| Lexington: | 29.2 |
| Tennessee: | 28.8 |
| This city: | 24.2% |
| Tennessee: | 21.0% |
| This city: | 12.3% |
| State: | 10.5% |
| Lexington: | 6.8 |
| Tennessee: | 6.8 |
| Lexington: | 33.0% |
| Tennessee: | 33.9% |
| Here: | 52.3% |
| Tennessee: | 55.9% |
| This city: | 76.6% |
| Tennessee: | 79.1% |
More about Health and Nutrition of Lexington, TN Residents
| Local government employment and payroll (March 2022) | |||||
| Function | Full-time employees | Monthly full-time payroll | Average yearly full-time wage | Part-time employees | Monthly part-time payroll |
|---|---|---|---|---|---|
| Elementary and Secondary - Instruction | 107 | $363,279 | $40,742 | 1 | $591 |
| Electric Power | 37 | $222,609 | $72,198 | 0 | $0 |
| Elementary and Secondary - Other Total | 31 | $103,840 | $40,196 | 3 | $4,028 |
| Police Protection - Officers | 31 | $125,712 | $48,663 | 0 | $0 |
| Financial Administration | 26 | $48,836 | $22,540 | 0 | $0 |
| Water Supply | 23 | $87,749 | $45,782 | 0 | $0 |
| Gas Supply | 22 | $88,490 | $48,267 | 0 | $0 |
| Firefighters | 12 | $52,260 | $52,260 | 1 | $296 |
| Sewerage | 11 | $48,442 | $52,846 | 0 | $0 |
| Other Government Administration | 10 | $28,194 | $33,833 | 0 | $0 |
| Solid Waste Management | 9 | $29,326 | $39,101 | 0 | $0 |
| Streets and Highways | 8 | $30,594 | $45,891 | 1 | $1,241 |
| Other and Unallocable | 8 | $31,182 | $46,773 | 0 | $0 |
| Parks and Recreation | 5 | $14,648 | $35,155 | 0 | $0 |
| Fire - Other | 2 | $10,163 | $60,978 | 0 | $0 |
| Police - Other | 2 | $11,059 | $66,354 | 0 | $0 |
| Judicial and Legal | 0 | $0 | 1 | $2,214 | |
| Totals for Government | 344 | $1,296,383 | $45,223 | 7 | $8,370 |
Lexington government finances - Expenditure in 2021 (per resident):
- Construction - Water Utilities: $2,979,000 ($374.62)
Electric Utilities: $2,228,000 ($280.18)
Elementary and Secondary Education: $29,000 ($3.65)
- Current Operations - Electric Utilities: $45,368,000 ($5705.23)
Elementary and Secondary Education: $9,020,000 ($1134.31)
Gas Utilities: $4,756,000 ($598.09)
Water Utilities: $4,387,000 ($551.69)
Police Protection: $2,316,000 ($291.25)
Regular Highways: $1,293,000 ($162.60)
Local Fire Protection: $986,000 ($123.99)
General - Other: $874,000 ($109.91)
Solid Waste Management: $697,000 ($87.65)
Central Staff Services: $538,000 ($67.66)
Parks and Recreation: $493,000 ($62.00)
Protective Inspection and Regulation - Other: $85,000 ($10.69)
Libraries: $48,000 ($6.04)
Health - Other: $43,000 ($5.41)
Air Transportation: $42,000 ($5.28)
General Public Buildings: $15,000 ($1.89)
Judicial and Legal Services: $10,000 ($1.26)
- Electric Utilities - Interest on Debt: $467,000 ($58.73)
- Gas Utilities - Interest on Debt: $78,000 ($9.81)
- General - Interest on Debt: $219,000 ($27.54)
- Intergovernmental to Local - Other - Elementary and Secondary Education: $26,000 ($3.27)
- Other Capital Outlay - General - Other: $1,173,000 ($147.51)
Police Protection: $712,000 ($89.54)
Gas Utilities: $363,000 ($45.65)
Elementary and Secondary Education: $273,000 ($34.33)
Electric Utilities: $46,000 ($5.78)
Regular Highways: $42,000 ($5.28)
Parks and Recreation: $26,000 ($3.27)
- Total Salaries and Wages: $14,043,000 ($1765.97)
- Water Utilities - Interest on Debt: $281,000 ($35.34)
Lexington government finances - Revenue in 2021 (per resident):
- Charges - Solid Waste Management: $761,000 ($95.70)
Elementary and Secondary Education - Other: $386,000 ($48.54)
Other: $148,000 ($18.61)
Elementary and Secondary Education School Lunch: $29,000 ($3.65)
Regular Highways: $27,000 ($3.40)
Parks and Recreation: $17,000 ($2.14)
Miscellaneous Commercial Activities: $8,000 ($1.01)
- Local Intergovernmental - Education: $1,426,000 ($179.33)
Other: $17,000 ($2.14)
- Miscellaneous - Special Assessments: $1,884,000 ($236.92)
Rents: $414,000 ($52.06)
Fines and Forfeits: $313,000 ($39.36)
General Revenue - Other: $296,000 ($37.22)
Interest Earnings: $207,000 ($26.03)
Sale of Property: $77,000 ($9.68)
Donations From Private Sources: $18,000 ($2.26)
- Revenue - Electric Utilities: $48,788,000 ($6135.31)
Water Utilities: $6,199,000 ($779.55)
Gas Utilities: $5,499,000 ($691.52)
- State Intergovernmental - Education: $6,921,000 ($870.35)
General Local Government Support: $1,070,000 ($134.56)
Highways: $275,000 ($34.58)
Other: $131,000 ($16.47)
- Tax - General Sales and Gross Receipts: $5,972,000 ($751.01)
Property: $4,216,000 ($530.18)
Alcoholic Beverage Sales: $867,000 ($109.03)
Other Selective Sales: $639,000 ($80.36)
Public Utilities Sales: $231,000 ($29.05)
Motor Vehicle License: $70,000 ($8.80)
Other License: $25,000 ($3.14)
Alcoholic Beverage License: $1,000 ($0.13)
Lexington government finances - Debt in 2021 (per resident):
- Long Term Debt - Beginning Outstanding - Unspecified Public Purpose: $25,547,000 ($3212.65)
Outstanding Unspecified Public Purpose: $22,571,000 ($2838.41)
Retired Unspecified Public Purpose: $2,976,000 ($374.25)
Lexington government finances - Cash and Securities in 2021 (per resident):
- Bond Funds - Cash and Securities: $834,000 ($104.88)
- Other Funds - Cash and Securities: $37,909,000 ($4767.23)
- Sinking Funds - Cash and Securities: $98,000 ($12.32)
| Businesses in Lexington, TN | ||||
| Name | Count | Name | Count | |
|---|---|---|---|---|
| AT&T | 1 | Lane Furniture | 1 | |
| Ace Hardware | 1 | Little Caesars Pizza | 1 | |
| AutoZone | 1 | Maurices | 1 | |
| Baskin-Robbins | 1 | McDonald's | 1 | |
| Burger King | 1 | Pizza Hut | 1 | |
| Chevrolet | 1 | RadioShack | 1 | |
| Dairy Queen | 1 | SONIC Drive-In | 1 | |
| Days Inn | 1 | Sears | 1 | |
| Domino's Pizza | 1 | Subway | 1 | |
| Econo Lodge | 1 | Taco Bell | 1 | |
| FedEx | 2 | U-Haul | 1 | |
| GameStop | 1 | UPS | 2 | |
| Goodwill | 1 | Walgreens | 1 | |
| H&R Block | 1 | Walmart | 1 | |
| KFC | 1 | Wendy's | 1 | |
| La-Z-Boy | 1 | |||
Strongest AM radio stations in Lexington:
- WDXL (1490 AM; 1 kW; LEXINGTON, TN; Owner: LEXINGTON BROADCASTING SERVICE, INC.)
- WSM (650 AM; 50 kW; NASHVILLE, TN; Owner: GAYLORD ENTERTAINMENT COMPANY)
- WCRV (640 AM; 50 kW; COLLIERVILLE, TN; Owner: BOTT BROADCASTING COMPANY/TENNESSEE)
- WDXI (1310 AM; 5 kW; JACKSON, TN; Owner: LIBERTY RADIO II, INC.)
- WTJS (1390 AM; 5 kW; JACKSON, TN; Owner: CAPSTAR TX LIMITED PARTNERSHIP)
- WGSF (1030 AM; 50 kW; MEMPHIS, TN; Owner: FLINN BROADCASTING CORPORATION)
- WDIA (1070 AM; 50 kW; MEMPHIS, TN; Owner: CLEAR CHANNEL BROADCASTING LICENSES, INC.)
- WKDA (1200 AM; 50 kW; NASHVILLE, TN; Owner: RADIO NASHVILLE, INC.)
- WNQM (1300 AM; 50 kW; NASHVILLE, TN; Owner: WNQM. INC.)
- WMQM (1600 AM; 50 kW; LAKELAND, TN; Owner: WMQM, INC.)
- WAMB (1160 AM; 50 kW; DONELSON, TN; Owner: GREAT SOUTHERN BROADCASTING COMPANY, INC.)
- WKJQ (1550 AM; daytime; 1 kW; PARSONS, TN; Owner: CLENNEY BROADCASTING CORPORATION)
- WCPC (940 AM; 50 kW; HOUSTON, MS; Owner: WCPC BROADCASTING CO., INC.)
Strongest FM radio stations in Lexington:
- WZLT (99.3 FM; LEXINGTON, TN; Owner: LEXINGTON BROADCASTING SERVICES, INC)
- WBFG (96.5 FM; PARKER'S CROSSROADS, TN; Owner: CROSSROADS BROADCASTING, LLC)
- WIGH (88.7 FM; LEXINGTON, TN; Owner: AMERICAN FAMILY ASSOCIATION)
- WYNU (92.3 FM; MILAN, TN; Owner: CAPSTAR TX LIMITED PARTNERSHIP)
- WWYN (106.9 FM; MCKENZIE, TN; Owner: RAINBOW MEDIA, INC.)
- WTNV (104.1 FM; JACKSON, TN; Owner: CAPSTAR TX LIMITED PARTNERSHIP)
- WHHM-FM (107.7 FM; HENDERSON, TN; Owner: THOMAS RADIO, LLC)
- WMXX-FM (103.1 FM; JACKSON, TN; Owner: GERALD W. HUNT)
- WFGZ (94.5 FM; LOBELVILLE, TN; Owner: OHIO BROADCAST ASSOCIATES)
- WLVS-FM (106.5 FM; CLIFTON, TN; Owner: GOLD COAST BROADCASTING CO.)
- WKNP (90.1 FM; JACKSON, TN; Owner: MID-SOUTH PUBLIC COMMUNICTNS FOUNDTN)
- WKJQ-FM (97.3 FM; PARSONS, TN; Owner: CLENNEY BROADCASTING CORPORATION)
- WNWS-FM (101.5 FM; JACKSON, TN; Owner: RADIOCORP OF JACKSON, INC.)
- WFKX (95.7 FM; HENDERSON, TN; Owner: THOMAS RADIO, LLC)
- WVHR (100.9 FM; HUNTINGDON, TN; Owner: MILAN BROADCASTING COMPANY, INC.)
- WFHC (91.5 FM; HENDERSON, TN; Owner: FREED-HARDEMAN UNIVERSITY)
TV broadcast stations around Lexington:
- WBBJ-TV (Channel 7; JACKSON, TN; Owner: TENNESSEE BROADCASTING PARTNERS)
- WLJT (Channel 11; LEXINGTON, TN; Owner: WEST TENNESSEE PUBLIC TV COUNCIL, INC)
- W26CJ (Channel 26; JACKSON, TN; Owner: MS COMMUNICATIONS, LLC)
- WJTE-LP (Channel 19; JACKSON, TN; Owner: TIGER EYE BROADCASTING CORPORATION)
- W22BR (Channel 22; JACKSON, TN; Owner: MS COMMUNICATIONS, LLC)
- W52CZ (Channel 52; JACKSON, TN; Owner: MS COMMUNICATIONS, LLC)
- W64BZ (Channel 64; JACKSON, TN; Owner: MS COMMUNICATIONS, LLC)
- W25BY (Channel 25; JACKSON, TN; Owner: MS COMMUNICATIONS, LLC)
- W38BY (Channel 38; JACKSON, TN; Owner: MS COMMUNICATIONS, LLC)
- W54BU (Channel 54; JACKSON, TN; Owner: MS COMMUNICATIONS, LLC)
- W35AH (Channel 35; JACKSON, TN; Owner: TRINITY BROADCASTING NETWORK)
- WJKT (Channel 16; JACKSON, TN; Owner: CLEAR CHANNEL BROADCASTING LICENSES, INC.)
- National Bridge Inventory (NBI) Statistics
- 42Number of bridges
- 246ft / 74.6mTotal length
- $5,476,000Total costs
- 147,743Total average daily traffic
- 11,087Total average daily truck traffic
- 258,752Total future (year 2038) average daily traffic
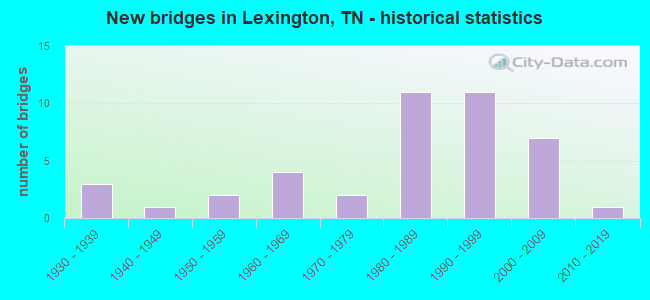
- New bridges - historical statistics
- 31930-1939
- 11940-1949
- 21950-1959
- 41960-1969
- 21970-1979
- 111980-1989
- 111990-1999
- 72000-2009
- 12010-2019
FCC Registered Antenna Towers: 163 (See the full list of FCC Registered Antenna Towers)
FCC Registered Commercial Land Mobile Towers: 2 (See the full list of FCC Registered Commercial Land Mobile Towers in Lexington, TN)
FCC Registered Broadcast Land Mobile Towers: 25 (See the full list of FCC Registered Broadcast Land Mobile Towers)
FCC Registered Microwave Towers: 21 (See the full list of FCC Registered Microwave Towers in this town)
FCC Registered Paging Towers: 2 (See the full list of FCC Registered Paging Towers)
FCC Registered Maritime Coast & Aviation Ground Towers: 2 (See the full list of FCC Registered Maritime Coast & Aviation Ground Towers)
FCC Registered Amateur Radio Licenses: 88 (See the full list of FCC Registered Amateur Radio Licenses in Lexington)
FAA Registered Aircraft Manufacturers and Dealers: 6 (See the full list of FAA Registered Manufacturers and Dealers in Lexington)
FAA Registered Aircraft: 9 (See the full list of FAA Registered Aircraft)
2005 - 2018 National Fire Incident Reporting System (NFIRS) incidents
- Fire incident types reported to NFIRS in Lexington, TN
- 60743.2%Outside Fires
- 51636.7%Structure Fires
- 27419.5%Mobile Property/Vehicle Fires
- 80.6%Other
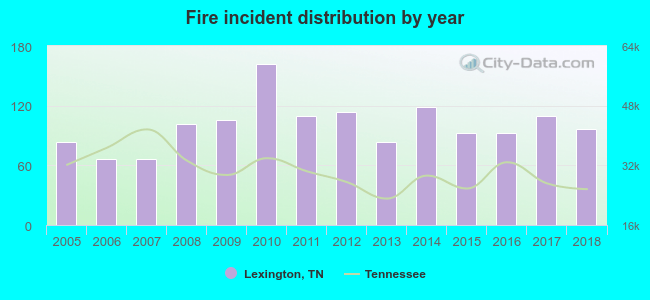 According to the data from the years 2005 - 2018 the average number of fire incidents per year is 100. The highest number of fire incidents - 162 took place in 2010, and the least - 66 in 2006. The data has an increasing trend.
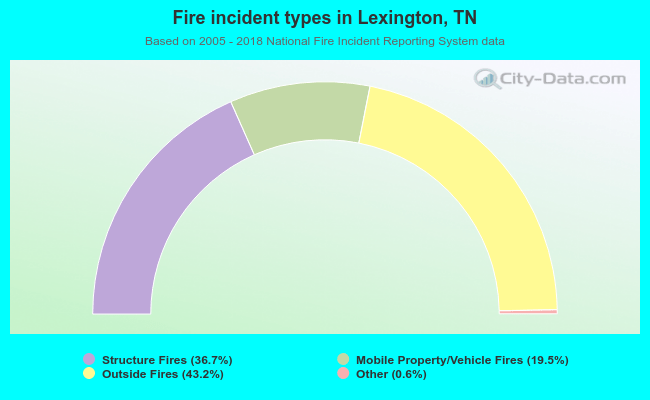 When looking into fire subcategories, the most incidents belonged to: Outside Fires (43.2%), and Structure Fires (36.7%).
| Most common first names in Lexington, TN among deceased individuals | ||
| Name | Count | Lived (average) |
|---|---|---|
| James | 185 | 72.0 years |
| William | 139 | 72.5 years |
| Mary | 128 | 76.1 years |
| John | 118 | 76.2 years |
| Robert | 74 | 70.1 years |
| Willie | 61 | 77.3 years |
| Thomas | 49 | 70.3 years |
| Joe | 49 | 74.5 years |
| Ruby | 43 | 82.1 years |
| Charles | 43 | 69.1 years |
| Most common last names in Lexington, TN among deceased individuals | ||
| Last name | Count | Lived (average) |
|---|---|---|
| Johnson | 92 | 75.0 years |
| Wood | 83 | 71.2 years |
| Williams | 79 | 76.7 years |
| Scott | 76 | 73.4 years |
| Jones | 66 | 77.8 years |
| Maness | 65 | 70.6 years |
| Smith | 61 | 74.9 years |
| Blankenship | 56 | 76.1 years |
| Lewis | 54 | 77.8 years |
| Woods | 54 | 73.0 years |
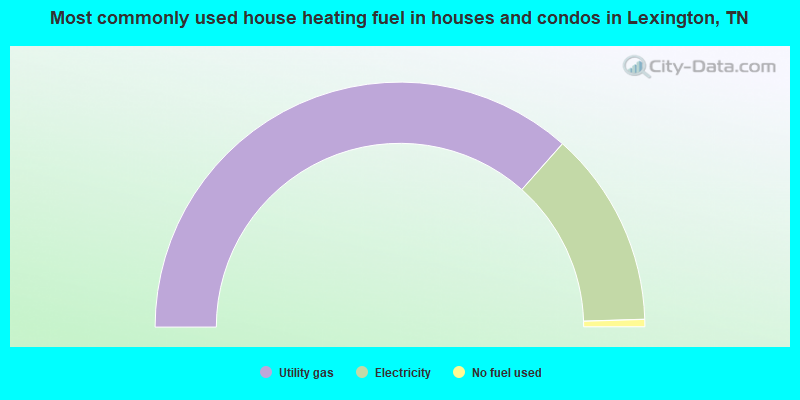
- 73.1%Utility gas
- 25.9%Electricity
- 1.0%No fuel used
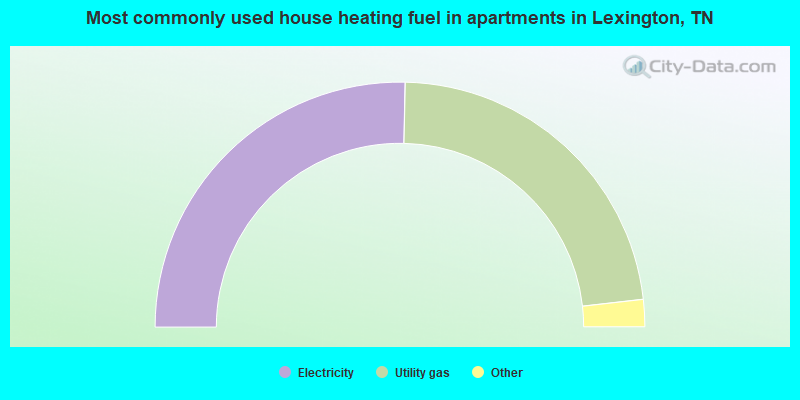
- 50.7%Electricity
- 45.7%Utility gas
- 2.3%No fuel used
- 1.2%Bottled, tank, or LP gas
Lexington compared to Tennessee state average:
- Unemployed percentage below state average.
- Hispanic race population percentage significantly below state average.
- Foreign-born population percentage significantly below state average.
- Length of stay since moving in significantly above state average.
- Institutionalized population percentage above state average.
- Number of college students below state average.
- Percentage of population with a bachelor's degree or higher below state average.
Lexington on our top lists:
- #26 on the list of "Top 101 cities with largest percentage of males in occupations: healthcare support occupations (population 5,000+)"
- #29 on the list of "Top 101 cities with the highest number of assaults per 100,000 residents, excludes tourist destinations and others with a lot of outsiders visiting based on city industries data (population 5,000+)"

|
|
Total of 29 patent applications in 2008-2024.