Percentage of residents living in poverty in 2022: 8.4%
(8.1% for White Non-Hispanic residents, 0.3% for Black residents, 26.0% for Hispanic or Latino residents, 100.0% for American Indian residents, 27.9% for other race residents, 2.4% for two or more races residents)
According to our research of Tennessee and other state lists, there were 2 registered sex offenders living in Millersville, Tennessee as of April 26, 2024. The ratio of all residents to sex offenders in Millersville is 3,353 to 1. The ratio of registered sex offenders to all residents in this city is much lower than the state average.
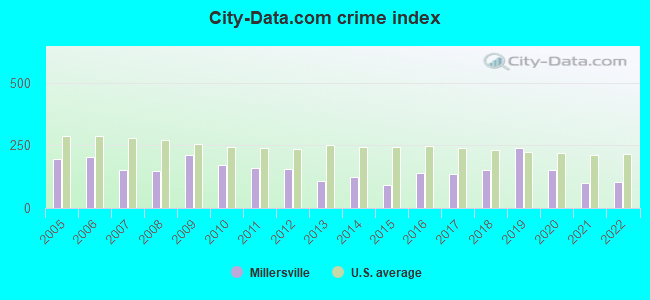
Crime rates in Millersville by year
Type
2009
2010
2011
2012
2013
2014
2015
2016
2017
2018
2019
2020
2021
2022
Murders (per 100,000)
0 (0.0)
0 (0.0)
0 (0.0)
0 (0.0)
0 (0.0)
0 (0.0)
0 (0.0)
0 (0.0)
0 (0.0)
0 (0.0)
1 (14.6)
0 (0.0)
0 (0.0)
0 (0.0)
Rapes (per 100,000)
0 (0.0)
0 (0.0)
1 (15.4)
1 (15.1)
2 (30.3)
0 (0.0)
0 (0.0)
1 (14.8)
4 (58.9)
2 (28.9)
4 (58.6)
1 (14.7)
4 (58.5)
2 (32.1)
Robberies (per 100,000)
3 (47.0)
1 (15.5)
0 (0.0)
1 (15.1)
0 (0.0)
3 (45.4)
4 (59.6)
2 (29.6)
0 (0.0)
2 (28.9)
0 (0.0)
1 (14.7)
0 (0.0)
0 (0.0)
Assaults (per 100,000)
19 (297.5)
19 (295.0)
12 (184.7)
23 (348.0)
11 (166.8)
15 (227.1)
12 (178.8)
25 (370.5)
12 (176.7)
20 (289.3)
33 (483.2)
33 (484.5)
10 (146.2)
16 (256.5)
Burglaries (per 100,000)
48 (751.5)
49 (760.9)
44 (677.1)
28 (423.7)
17 (257.7)
25 (378.5)
12 (178.8)
12 (177.8)
22 (323.9)
18 (260.3)
26 (380.7)
10 (146.8)
3 (43.9)
3 (48.1)
Thefts (per 100,000)
118 (1,848)
82 (1,273)
84 (1,293)
62 (938.1)
48 (727.7)
49 (741.9)
37 (551.3)
41 (607.6)
40 (588.9)
47 (679.8)
53 (776.1)
35 (513.9)
19 (277.8)
25 (400.7)
Auto thefts (per 100,000)
8 (125.3)
3 (46.6)
10 (153.9)
2 (30.3)
3 (45.5)
6 (90.8)
3 (44.7)
7 (103.7)
7 (103.1)
14 (202.5)
9 (131.8)
7 (102.8)
9 (131.6)
5 (80.1)
Arson (per 100,000)
7 (109.6)
1 (15.5)
0 (0.0)
1 (15.1)
0 (0.0)
0 (0.0)
0 (0.0)
0 (0.0)
1 (14.7)
1 (14.5)
1 (14.6)
2 (29.4)
1 (14.6)
1 (16.0)
City-Data.com crime index
210.1
171.6
160.7
155.8
108.4
122.5
91.8
139.9
136.9
151.3
241.0
152.1
100.7
102.7
The City-Data.com crime index weighs serious crimes and violent crimes more heavily. Higher means more crime, U.S. average is 246.1. It adjusts for the number of visitors and daily workers commuting into cities.
Latest news from Millersville, TN collected exclusively by city-data.com from local newspapers, TV, and radio stations
Ancestries: American (28.3%), English (8.2%), Irish (5.8%), European (5.4%), German (5.1%), Scotch-Irish (2.7%).
Current Local Time: CST time zone
Incorporated in 1981
Elevation: 500 feet
Land area: 13.5 square miles.
Population density: 463 people per square mile (low).
284 residents are foreign born (4.0% Latin America).
This city:
4.7%
Tennessee:
5.4%
Median real estate property taxes paid for housing units with mortgages in 2022: $1,920 (0.7%) Median real estate property taxes paid for housing units with no mortgage in 2022: $1,395 (0.6%)
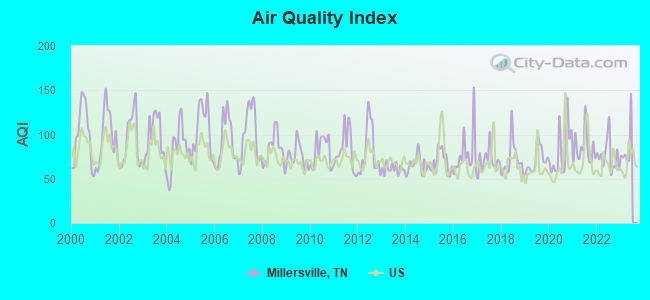
Air Quality Index (AQI) level in 2022 was 76.0. This is about average.
City:
76.0
U.S.:
72.6
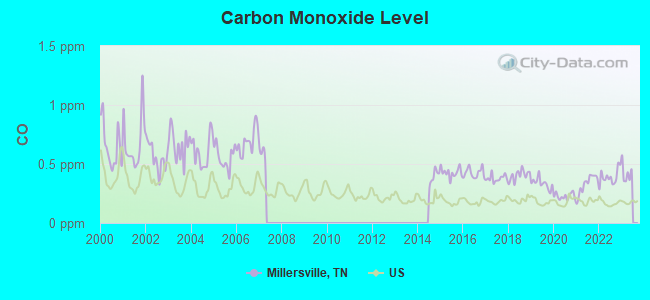
Carbon Monoxide (CO) [ppm] level in 2022 was 0.390. This is significantly worse than average.Closest monitor was 13.2 miles away from the city center.
City:
0.390
U.S.:
0.251
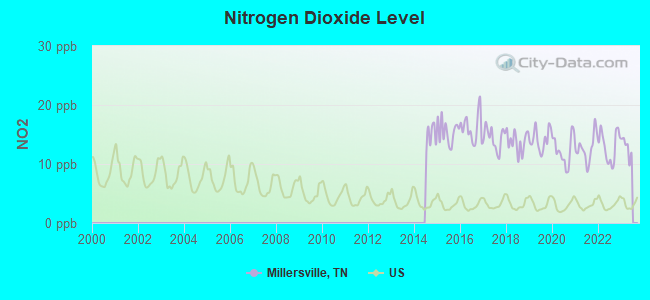
Nitrogen Dioxide (NO2) [ppb] level in 2022 was 13.0. This is significantly worse than average.Closest monitor was 4.6 miles away from the city center.
City:
13.0
U.S.:
5.1
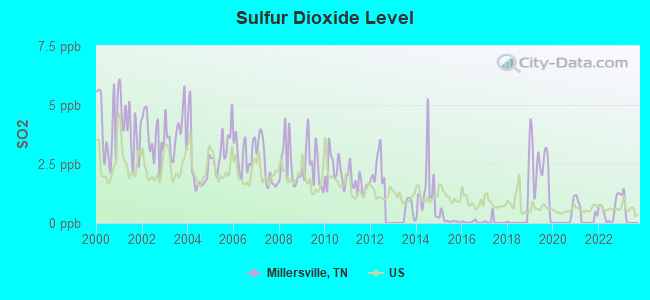
Sulfur Dioxide (SO2) [ppb] level in 2022 was 0.553. This is significantly better than average.Closest monitor was 4.6 miles away from the city center.
City:
0.553
U.S.:
1.515
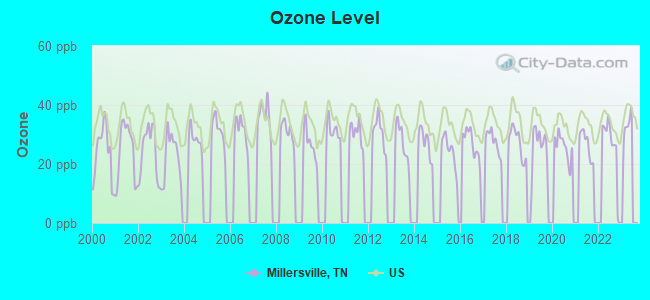
Ozone [ppb] level in 2022 was 27.1. This is better than average.Closest monitor was 9.4 miles away from the city center.
City:
27.1
U.S.:
33.3
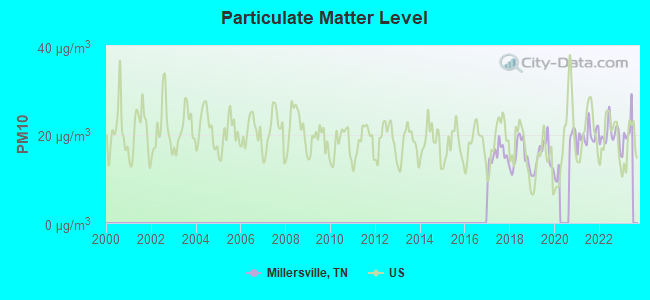
Particulate Matter (PM10) [µg/m3] level in 2022 was 20.0. This is about average.Closest monitor was 13.2 miles away from the city center.
City:
20.0
U.S.:
19.2
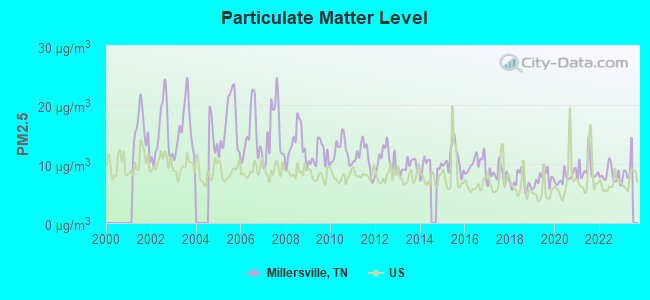
Particulate Matter (PM2.5) [µg/m3] level in 2022 was 8.15. This is about average.Closest monitor was 7.6 miles away from the city center.
City:
8.15
U.S.:
8.11
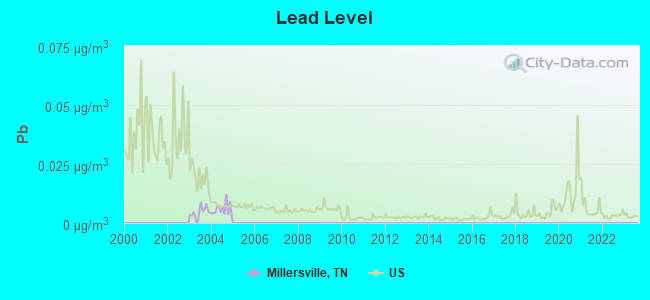
Lead (Pb) [µg/m3] level in 2004 was 0.00578. This is significantly better than average.Closest monitor was 4.6 miles away from the city center.
City:
0.00578
U.S.:
0.00931
Tornado activity:
Millersville-area historical tornado activity is slightly above Tennessee state average. It is 64% greater than the overall U.S. average.
On 4/27/1970, a category F4 (max. wind speeds 207-260 mph) tornado 22.1 miles away from the Millersville city center killed 3 peopleand injured 85 peopleand causedbetween $500,000 and $5,000,000 in damages.
On 12/24/1988, a category F4 tornado 25.5 miles away from the city center killed one personand injured 7 peopleand causedbetween $5,000,000 and $50,000,000 in damages.
Earthquake activity:
Millersville-area historical earthquake activity is significantly above Tennessee state average. It is 193% greater than the overall U.S. average.
On 4/18/2008 at 09:36:59, a magnitude 5.4 (5.1 MB, 4.8 MS, 5.4 MW, 5.2 MW, Class: Moderate, Intensity: VI - VII) earthquake occurred 156.1 miles away from Millersville center On 4/18/2008 at 09:36:59, a magnitude 5.2 (5.2 MW, Depth: 8.9 mi) earthquake occurred 156.1 miles away from the city center On 6/18/2002 at 17:37:15, a magnitude 5.0 (4.3 MB, 4.6 MW, 5.0 LG) earthquake occurred 124.8 miles away from the city center On 7/27/1980 at 18:52:21, a magnitude 5.2 (5.1 MB, 4.7 MS, 5.0 UK, 5.2 UK) earthquake occurred 197.4 miles away from the city center On 6/10/1987 at 23:48:54, a magnitude 5.1 (4.9 MB, 4.4 MS, 4.6 MS, 5.1 LG) earthquake occurred 179.6 miles away from the city center On 9/26/1990 at 13:18:51, a magnitude 5.0 (4.7 MB, 4.8 LG, 5.0 LG, Depth: 7.7 mi) earthquake occurred 165.0 miles away from Millersville center Magnitude types: regional Lg-wave magnitude (LG), body-wave magnitude (MB), surface-wave magnitude (MS), moment magnitude (MW)
Natural disasters:
The number of natural disasters in Sumner County (14) is near the US average (15). Major Disasters (Presidential) Declared: 12 Emergencies Declared: 1
Causes of natural disasters: Storms: 11, Floods: 10, Tornadoes: 8, Winds: 3, Flash Flood: 1, Hurricane: 1, Ice Storm: 1, Winter Storm: 1, Other: 1 (Note: some incidents may be assigned to more than one category).
Hospitals and medical centers near Millersville:
RIDGETOP HAVEN HEALTH CARE CENTER (Nursing Home, about 4 miles away; GOODLETTSVILLE, TN)
VANCO MANOR NURSING AND REHABILITATION CENTER (Nursing Home, about 4 miles away; GOODLETTSVILLE, TN)
ADVANCED HOME CARE AND HOSPICE INC (Hospital, about 6 miles away; WHITE HOUSE, TN)
NHC HEALTHCARE, HENDERSONVILLE (Nursing Home, about 8 miles away; HENDERSONVILLE, TN)
TRISTAR HENDERSONVILLE MEDICAL CENTER Acute Care Hospitals (about 8 miles away; HENDERSONVILLE, TN)
FMC HENDERSONVILLE (Dialysis Facility, about 8 miles away; HENDERSONVILLE, TN)
HENDERSONVILLE NURSING HOME (Nursing Home, about 8 miles away; HENDERSONVILLE, TN)
Amtrak station near Millersville:
17 miles: NASHVILLE (GREYHOUND STA., 200 8TH AVE. S.) - Bus Station . Services: enclosed waiting area, public restrooms, public payphones, intercity bus service.
Colleges/universities with over 2000 students nearest to Millersville:
Volunteer State Community College (about 13 miles; Gallatin, TN; Full-time enrollment: 5,311)
Tennessee State University (about 17 miles; Nashville, TN; FT enrollment: 7,341)
Trevecca Nazarene University (about 18 miles; Nashville, TN; FT enrollment: 2,223)
Vanderbilt University (about 18 miles; Nashville, TN; FT enrollment: 10,518)
Belmont University (about 19 miles; Nashville, TN; FT enrollment: 5,795)
Nashville State Community College (about 20 miles; Nashville, TN; FT enrollment: 6,436)
Lipscomb University (about 21 miles; Nashville, TN; FT enrollment: 3,827)
Notable locations in Millersville: Millersville Fire Department Station 2 (A), Millersville Fire Department Station 1 (B). Display/hide their locations on the map
Churches in Millersville include: Slaters Chapel (A), Bethel Baptist Church (B), Friendship Baptist Church (C), Millersville Church of Christ (D), Millersville First Baptist Church (E), Slaters Chapel United Methodist Church (F), White Hill Cemetery Church (G). Display/hide their locations on the map
Cemeteries: Hudgins Cemetery (1), Templeton Cemetery (2), Turpin Cemetery (3), Bethel Baptist Church Cemetery (4), White Hill Cemetery (5), Lassiter Cemetery (6), Alden Cemetery (7). Display/hide their locations on the map
Sumner County has a predicted average indoor radon screening level between 2 and 4 pCi/L (pico curies per liter) - Moderate Potential
Average household size:
This city:
2.6 people
Tennessee:
2.5 people
Percentage of family households:
This city:
70.5%
Whole state:
67.3%
Percentage of households with unmarried partners:
This city:
6.9%
Whole state:
5.8%
Likely homosexual households (counted as self-reported same-sex unmarried-partner households)
Lesbian couples: 0.3% of all households
Gay men: 0.1% of all households
2 people in emergency and transitional shelters (with sleeping facilities) for people experiencing homelessness in 2010
7 people in homes for the mentally retarded in 2000
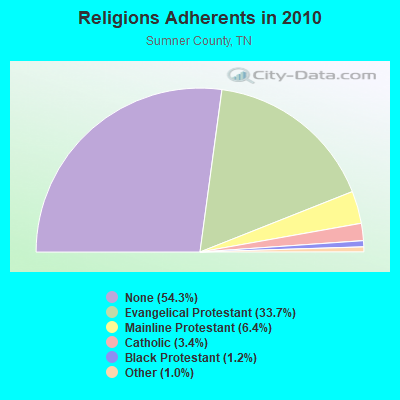
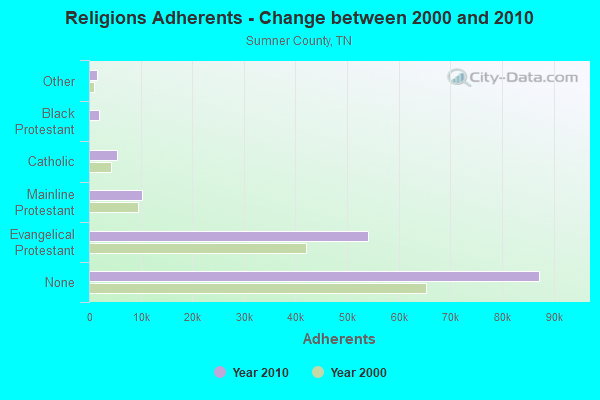
Religion statistics for Millersville, TN (based on Sumner County data)
Religion
Adherents
Congregations
Evangelical Protestant
54,140
135
Mainline Protestant
10,205
27
Catholic
5,500
2
Black Protestant
1,961
9
Other
1,579
6
None
87,260
-
Source: Clifford Grammich, Kirk Hadaway, Richard Houseal, Dale E.Jones, Alexei Krindatch, Richie Stanley and Richard H.Taylor. 2012. 2010 U.S.Religion Census: Religious Congregations & Membership Study. Association of Statisticians of American Religious Bodies. Jones, Dale E., et al. 2002. Congregations and Membership in the United States 2000. Nashville, TN: Glenmary Research Center. Graphs represent county-level data
Int Of Hwy 31 W & Long Dr (Lat: 36.351444 Lon: -86.715000), Type: Tower, Structure height: 12 m, Call Sign: WPMB914, Assigned Frequencies: 216.450 MHz, Grant Date: 03/01/2023, Expiration Date: 05/21/2033, Certifier: Jack Tompkins, Registrant: Federal License Management, 175 Pine St, Suite 104, Williamsport, PA 17701-6549, Phone: (866) 908-2220, Fax: (570) 323-4002, Email:
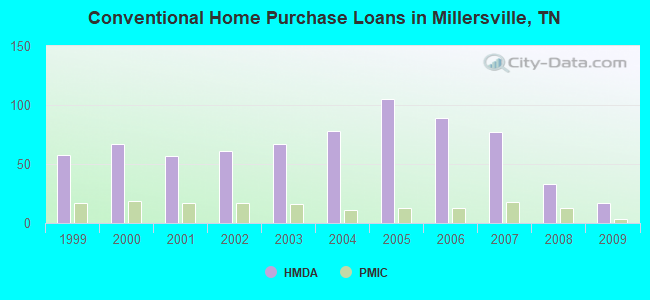
Home Mortgage Disclosure Act Aggregated Statistics For Year 2009 (Based on 1 partial tract)
A) FHA, FSA/RHS & VA Home Purchase Loans
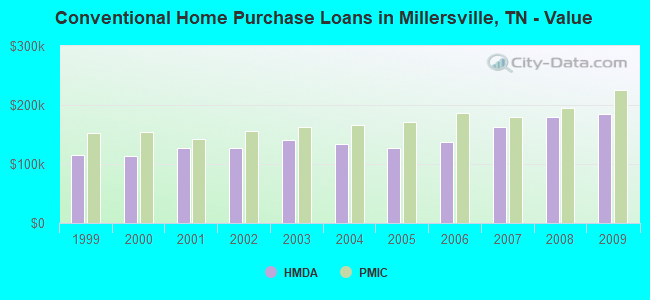
B) Conventional Home Purchase Loans
C) Refinancings
D) Home Improvement Loans
F) Non-occupant Loans on < 5 Family Dwellings (A B C & D)
G) Loans On Manufactured Home Dwelling (A B C & D)
Number
Average Value
Number
Average Value
Number
Average Value
Number
Average Value
Number
Average Value
Number
Average Value
LOANS ORIGINATED
24
$180,720
17
$185,158
96
$185,847
4
$84,375
7
$85,293
3
$67,610
APPLICATIONS APPROVED, NOT ACCEPTED
2
$86,110
2
$159,365
10
$191,848
1
$15,920
0
$0
0
$0
APPLICATIONS DENIED
3
$224,457
2
$273,225
35
$177,255
2
$56,320
1
$36,730
1
$59,580
APPLICATIONS WITHDRAWN
3
$148,957
2
$194,665
28
$200,042
0
$0
1
$119,570
0
$0
FILES CLOSED FOR INCOMPLETENESS
0
$0
0
$0
2
$183,440
0
$0
0
$0
0
$0
Aggregated Statistics For Year 2008 (Based on 1 partial tract)
A) FHA, FSA/RHS & VA Home Purchase Loans
B) Conventional Home Purchase Loans
C) Refinancings
D) Home Improvement Loans
F) Non-occupant Loans on < 5 Family Dwellings (A B C & D)
G) Loans On Manufactured Home Dwelling (A B C & D)
Number
Average Value
Number
Average Value
Number
Average Value
Number
Average Value
Number
Average Value
Number
Average Value
LOANS ORIGINATED
19
$171,166
33
$180,318
62
$174,206
4
$12,242
7
$173,267
4
$92,230
APPLICATIONS APPROVED, NOT ACCEPTED
0
$0
2
$122,225
5
$155,568
2
$17,345
0
$0
0
$0
APPLICATIONS DENIED
2
$92,435
7
$122,839
42
$181,925
10
$44,809
2
$101,415
3
$69,787
APPLICATIONS WITHDRAWN
3
$115,357
6
$202,893
20
$184,849
1
$21,220
1
$142,020
1
$100,800
FILES CLOSED FOR INCOMPLETENESS
1
$165,690
1
$293,830
6
$268,393
0
$0
0
$0
0
$0
Aggregated Statistics For Year 2007 (Based on 1 partial tract)
A) FHA, FSA/RHS & VA Home Purchase Loans
B) Conventional Home Purchase Loans
C) Refinancings
D) Home Improvement Loans
F) Non-occupant Loans on < 5 Family Dwellings (A B C & D)
G) Loans On Manufactured Home Dwelling (A B C & D)
Number
Average Value
Number
Average Value
Number
Average Value
Number
Average Value
Number
Average Value
Number
Average Value
LOANS ORIGINATED
8
$166,760
77
$162,827
80
$153,155
9
$71,690
9
$184,053
5
$113,370
APPLICATIONS APPROVED, NOT ACCEPTED
0
$0
5
$178,340
16
$168,112
1
$46,930
1
$103,660
1
$70,190
APPLICATIONS DENIED
1
$109,370
10
$166,586
58
$176,095
9
$100,483
2
$169,155
5
$101,698
APPLICATIONS WITHDRAWN
1
$95,900
9
$175,166
22
$172,552
3
$93,183
2
$174,465
1
$54,280
FILES CLOSED FOR INCOMPLETENESS
0
$0
1
$152,630
10
$221,149
0
$0
0
$0
0
$0
Aggregated Statistics For Year 2006 (Based on 1 partial tract)
A) FHA, FSA/RHS & VA Home Purchase Loans
B) Conventional Home Purchase Loans
C) Refinancings
D) Home Improvement Loans
F) Non-occupant Loans on < 5 Family Dwellings (A B C & D)
G) Loans On Manufactured Home Dwelling (A B C & D)
Number
Average Value
Number
Average Value
Number
Average Value
Number
Average Value
Number
Average Value
Number
Average Value
LOANS ORIGINATED
11
$145,135
89
$137,640
67
$139,138
10
$48,115
11
$113,415
3
$98,353
APPLICATIONS APPROVED, NOT ACCEPTED
0
$0
16
$85,268
11
$158,491
2
$31,830
3
$75,363
3
$45,980
APPLICATIONS DENIED
1
$96,720
12
$130,490
45
$143,325
11
$33,465
4
$115,085
2
$42,240
APPLICATIONS WITHDRAWN
2
$155,485
12
$138,448
36
$139,071
2
$77,130
3
$69,650
0
$0
FILES CLOSED FOR INCOMPLETENESS
0
$0
3
$187,727
11
$126,994
0
$0
0
$0
0
$0
Aggregated Statistics For Year 2005 (Based on 1 partial tract)
A) FHA, FSA/RHS & VA Home Purchase Loans
B) Conventional Home Purchase Loans
C) Refinancings
D) Home Improvement Loans
F) Non-occupant Loans on < 5 Family Dwellings (A B C & D)
G) Loans On Manufactured Home Dwelling (A B C & D)
Number
Average Value
Number
Average Value
Number
Average Value
Number
Average Value
Number
Average Value
Number
Average Value
LOANS ORIGINATED
18
$131,363
105
$127,693
72
$133,494
5
$164,628
10
$129,000
6
$72,913
APPLICATIONS APPROVED, NOT ACCEPTED
1
$199,560
15
$124,035
16
$121,052
1
$19,590
2
$149,160
2
$157,935
APPLICATIONS DENIED
2
$171,200
18
$110,777
61
$133,014
6
$67,132
3
$128,823
4
$72,335
APPLICATIONS WITHDRAWN
1
$172,630
14
$162,249
46
$148,566
2
$289,545
2
$99,575
0
$0
FILES CLOSED FOR INCOMPLETENESS
0
$0
1
$119,570
8
$147,579
0
$0
0
$0
0
$0
Aggregated Statistics For Year 2004 (Based on 1 partial tract)
A) FHA, FSA/RHS & VA Home Purchase Loans
B) Conventional Home Purchase Loans
C) Refinancings
D) Home Improvement Loans
F) Non-occupant Loans on < 5 Family Dwellings (A B C & D)
G) Loans On Manufactured Home Dwelling (A B C & D)
Number
Average Value
Number
Average Value
Number
Average Value
Number
Average Value
Number
Average Value
Number
Average Value
LOANS ORIGINATED
17
$143,195
78
$134,155
92
$137,743
6
$64,752
10
$105,290
5
$85,212
APPLICATIONS APPROVED, NOT ACCEPTED
1
$169,770
9
$135,217
21
$144,720
2
$14,285
0
$0
3
$55,093
APPLICATIONS DENIED
4
$109,370
19
$103,614
64
$137,440
8
$18,314
2
$159,365
8
$50,758
APPLICATIONS WITHDRAWN
2
$180,585
8
$112,686
36
$134,424
1
$88,150
2
$103,250
1
$67,340
FILES CLOSED FOR INCOMPLETENESS
0
$0
2
$142,225
6
$140,250
0
$0
0
$0
0
$0
Aggregated Statistics For Year 2003 (Based on 1 partial tract)
A) FHA, FSA/RHS & VA Home Purchase Loans
B) Conventional Home Purchase Loans
C) Refinancings
D) Home Improvement Loans
F) Non-occupant Loans on < 5 Family Dwellings (A B C & D)
Number
Average Value
Number
Average Value
Number
Average Value
Number
Average Value
Number
Average Value
LOANS ORIGINATED
18
$123,677
67
$140,989
217
$135,132
7
$19,530
6
$68,017
APPLICATIONS APPROVED, NOT ACCEPTED
0
$0
7
$117,591
33
$135,205
2
$16,730
1
$43,670
APPLICATIONS DENIED
3
$129,230
17
$92,111
66
$120,439
3
$41,083
2
$92,435
APPLICATIONS WITHDRAWN
2
$132,630
11
$132,039
36
$148,571
1
$63,660
1
$71,830
FILES CLOSED FOR INCOMPLETENESS
0
$0
2
$93,660
7
$142,310
0
$0
1
$151,000
Aggregated Statistics For Year 2002 (Based on 1 partial tract)
A) FHA, FSA/RHS & VA Home Purchase Loans
B) Conventional Home Purchase Loans
C) Refinancings
D) Home Improvement Loans
F) Non-occupant Loans on < 5 Family Dwellings (A B C & D)
Number
Average Value
Number
Average Value
Number
Average Value
Number
Average Value
Number
Average Value
LOANS ORIGINATED
29
$134,983
61
$126,832
137
$137,178
5
$13,468
6
$93,727
APPLICATIONS APPROVED, NOT ACCEPTED
2
$89,985
11
$109,259
22
$131,204
1
$25,300
1
$117,530
APPLICATIONS DENIED
2
$148,550
12
$70,295
42
$101,549
7
$11,834
2
$100,595
APPLICATIONS WITHDRAWN
1
$95,090
5
$148,140
20
$155,486
1
$210,580
0
$0
FILES CLOSED FOR INCOMPLETENESS
0
$0
4
$78,458
7
$129,834
0
$0
0
$0
Aggregated Statistics For Year 2001 (Based on 1 partial tract)
A) FHA, FSA/RHS & VA Home Purchase Loans
B) Conventional Home Purchase Loans
C) Refinancings
D) Home Improvement Loans
F) Non-occupant Loans on < 5 Family Dwellings (A B C & D)
Number
Average Value
Number
Average Value
Number
Average Value
Number
Average Value
Number
Average Value
LOANS ORIGINATED
29
$125,948
57
$127,521
122
$129,953
6
$12,718
3
$96,857
APPLICATIONS APPROVED, NOT ACCEPTED
0
$0
5
$80,396
17
$121,206
2
$44,075
1
$43,670
APPLICATIONS DENIED
3
$122,567
16
$72,973
48
$105,145
7
$19,239
0
$0
APPLICATIONS WITHDRAWN
2
$158,140
5
$170,504
28
$114,443
1
$59,580
0
$0
FILES CLOSED FOR INCOMPLETENESS
0
$0
3
$92,910
3
$148,140
0
$0
0
$0
Aggregated Statistics For Year 2000 (Based on 1 partial tract)
A) FHA, FSA/RHS & VA Home Purchase Loans
B) Conventional Home Purchase Loans
C) Refinancings
D) Home Improvement Loans
E) Loans on Dwellings For 5+ Families
F) Non-occupant Loans on < 5 Family Dwellings (A B C & D)
Number
Average Value
Number
Average Value
Number
Average Value
Number
Average Value
Number
Average Value
Number
Average Value
LOANS ORIGINATED
20
$121,410
67
$113,446
37
$102,874
6
$20,745
1
$1,163,090
4
$55,502
APPLICATIONS APPROVED, NOT ACCEPTED
2
$71,010
6
$85,905
13
$84,414
0
$0
0
$0
0
$0
APPLICATIONS DENIED
3
$119,437
26
$56,255
30
$100,828
7
$24,253
0
$0
1
$129,780
APPLICATIONS WITHDRAWN
5
$91,986
5
$115,002
21
$99,907
1
$24,890
0
$0
0
$0
FILES CLOSED FOR INCOMPLETENESS
0
$0
2
$136,100
10
$129,164
0
$0
0
$0
0
$0
Aggregated Statistics For Year 1999 (Based on 1 partial tract)
A) FHA, FSA/RHS & VA Home Purchase Loans
B) Conventional Home Purchase Loans
C) Refinancings
D) Home Improvement Loans
F) Non-occupant Loans on < 5 Family Dwellings (A B C & D)
Detailed PMIC statistics for the following Tracts:0210.01
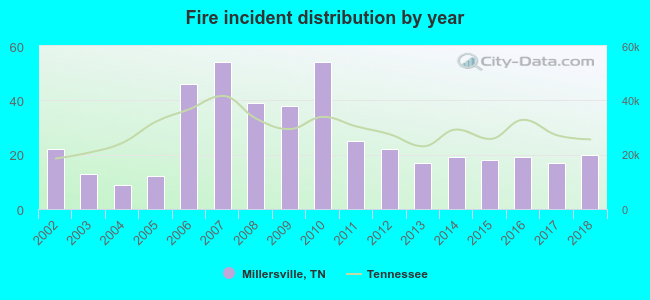
2002 - 2018 National Fire Incident Reporting System (NFIRS) incidents
According to the data from the years 2002 - 2018 the average number of fires per year is 26. The highest number of fires - 54 took place in 2007, and the least - 9 in 2004. The data has a decreasing trend.
When looking into fire subcategories, the most reports belonged to: Outside Fires (44.6%), and Structure Fires (27.0%).
Fire incident types reported to NFIRS in Millersville, TN
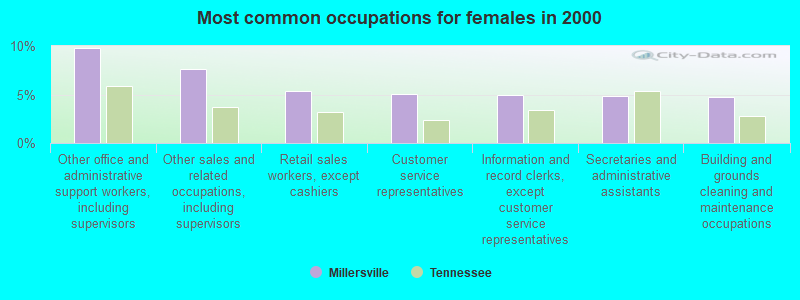
#16 on the list of "Top 101 cities with largest percentage of females in industries: management of companies and enterprises (population 5,000+)"
#68 on the list of "Top 101 cities with largest percentage of males in occupations: fire fighting and prevention workers including supervisors (population 5,000+)"
#77 on the list of "Top 101 counties with the largest number of people moving in compared to moving out (pop. 50,000+)"
#83 on the list of "Top 101 counties with the lowest percentage of residents relocating from foreign countries between 2010 and 2011 (pop. 50,000+)"
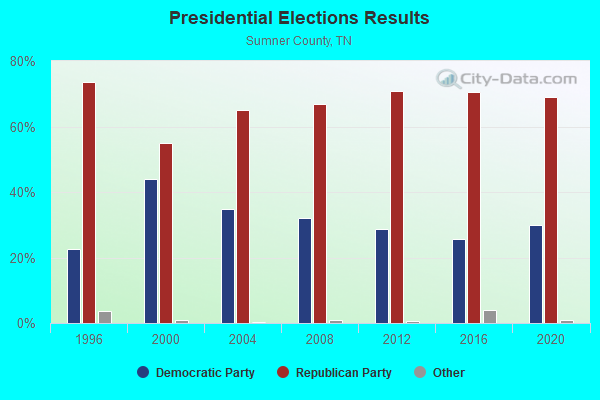
#91 on the list of "Top 101 counties with highest percentage of residents voting for Romney (Republican) in the 2012 Presidential Election (pop. 50,000+)"


 Recent articles from our blog. Our writers, many of them Ph.D. graduates or candidates, create easy-to-read articles on a wide variety of topics.


 (16.7 miles


 According to the data from the years 2002 - 2018 the average number of fires per year is 26. The highest number of fires - 54 took place in 2007, and the least - 9 in 2004. The data has a decreasing trend.
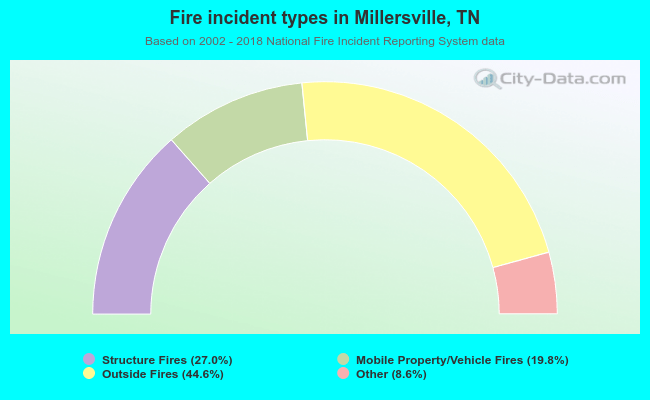 When looking into fire subcategories, the most reports belonged to: Outside Fires (44.6%), and Structure Fires (27.0%).