New Brunswick, New Jersey Submit your own pictures of this city and show them to the world
OSM Map
General Map
Google Map
MSN Map
OSM Map
General Map
Google Map
MSN Map
OSM Map
General Map
Google Map
MSN Map
OSM Map
General Map
Google Map
MSN Map
Please wait while loading the map...
Population in 2022: 55,998 (100% urban, 0% rural). Population change since 2000: +15.3%Males: 29,304 Females: 26,694
March 2022 cost of living index in New Brunswick: 122.1 (high, U.S. average is 100) Percentage of residents living in poverty in 2022: 31.9%for White Non-Hispanic residents , 30.4% for Black residents , 28.6% for Hispanic or Latino residents , 27.3% for American Indian residents , 31.8% for other race residents , 31.9% for two or more races residents )
Profiles of local businesses
Business Search - 14 Million verified businesses
Data:
Median household income ($)
Median household income (% change since 2000)
Household income diversity
Ratio of average income to average house value (%)
Ratio of average income to average rent
Median household income ($) - White
Median household income ($) - Black or African American
Median household income ($) - Asian
Median household income ($) - Hispanic or Latino
Median household income ($) - American Indian and Alaska Native
Median household income ($) - Multirace
Median household income ($) - Other Race
Median household income for houses/condos with a mortgage ($)
Median household income for apartments without a mortgage ($)
Races - White alone (%)
Races - White alone (% change since 2000)
Races - Black alone (%)
Races - Black alone (% change since 2000)
Races - American Indian alone (%)
Races - American Indian alone (% change since 2000)
Races - Asian alone (%)
Races - Asian alone (% change since 2000)
Races - Hispanic (%)
Races - Hispanic (% change since 2000)
Races - Native Hawaiian and Other Pacific Islander alone (%)
Races - Native Hawaiian and Other Pacific Islander alone (% change since 2000)
Races - Two or more races (%)
Races - Two or more races (% change since 2000)
Races - Other race alone (%)
Races - Other race alone (% change since 2000)
Racial diversity
Unemployment (%)
Unemployment (% change since 2000)
Unemployment (%) - White
Unemployment (%) - Black or African American
Unemployment (%) - Asian
Unemployment (%) - Hispanic or Latino
Unemployment (%) - American Indian and Alaska Native
Unemployment (%) - Multirace
Unemployment (%) - Other Race
Population density (people per square mile)
Population - Males (%)
Population - Females (%)
Population - Males (%) - White
Population - Males (%) - Black or African American
Population - Males (%) - Asian
Population - Males (%) - Hispanic or Latino
Population - Males (%) - American Indian and Alaska Native
Population - Males (%) - Multirace
Population - Males (%) - Other Race
Population - Females (%) - White
Population - Females (%) - Black or African American
Population - Females (%) - Asian
Population - Females (%) - Hispanic or Latino
Population - Females (%) - American Indian and Alaska Native
Population - Females (%) - Multirace
Population - Females (%) - Other Race
Coronavirus confirmed cases (Apr 27, 2024)
Deaths caused by coronavirus (Apr 27, 2024)
Coronavirus confirmed cases (per 100k population) (Apr 27, 2024)
Deaths caused by coronavirus (per 100k population) (Apr 27, 2024)
Daily increase in number of cases (Apr 27, 2024)
Weekly increase in number of cases (Apr 27, 2024)
Cases doubled (in days) (Apr 27, 2024)
Hospitalized patients (Apr 18, 2022)
Negative test results (Apr 18, 2022)
Total test results (Apr 18, 2022)
COVID Vaccine doses distributed (per 100k population) (Sep 19, 2023)
COVID Vaccine doses administered (per 100k population) (Sep 19, 2023)
COVID Vaccine doses distributed (Sep 19, 2023)
COVID Vaccine doses administered (Sep 19, 2023)
Likely homosexual households (%)
Likely homosexual households (% change since 2000)
Likely homosexual households - Lesbian couples (%)
Likely homosexual households - Lesbian couples (% change since 2000)
Likely homosexual households - Gay men (%)
Likely homosexual households - Gay men (% change since 2000)
Cost of living index
Median gross rent ($)
Median contract rent ($)
Median monthly housing costs ($)
Median house or condo value ($)
Median house or condo value ($ change since 2000)
Mean house or condo value by units in structure - 1, detached ($)
Mean house or condo value by units in structure - 1, attached ($)
Mean house or condo value by units in structure - 2 ($)
Mean house or condo value by units in structure by units in structure - 3 or 4 ($)
Mean house or condo value by units in structure - 5 or more ($)
Mean house or condo value by units in structure - Boat, RV, van, etc. ($)
Mean house or condo value by units in structure - Mobile home ($)
Median house or condo value ($) - White
Median house or condo value ($) - Black or African American
Median house or condo value ($) - Asian
Median house or condo value ($) - Hispanic or Latino
Median house or condo value ($) - American Indian and Alaska Native
Median house or condo value ($) - Multirace
Median house or condo value ($) - Other Race
Median resident age
Resident age diversity
Median resident age - Males
Median resident age - Females
Median resident age - White
Median resident age - Black or African American
Median resident age - Asian
Median resident age - Hispanic or Latino
Median resident age - American Indian and Alaska Native
Median resident age - Multirace
Median resident age - Other Race
Median resident age - Males - White
Median resident age - Males - Black or African American
Median resident age - Males - Asian
Median resident age - Males - Hispanic or Latino
Median resident age - Males - American Indian and Alaska Native
Median resident age - Males - Multirace
Median resident age - Males - Other Race
Median resident age - Females - White
Median resident age - Females - Black or African American
Median resident age - Females - Asian
Median resident age - Females - Hispanic or Latino
Median resident age - Females - American Indian and Alaska Native
Median resident age - Females - Multirace
Median resident age - Females - Other Race
Commute - mean travel time to work (minutes)
Travel time to work - Less than 5 minutes (%)
Travel time to work - Less than 5 minutes (% change since 2000)
Travel time to work - 5 to 9 minutes (%)
Travel time to work - 5 to 9 minutes (% change since 2000)
Travel time to work - 10 to 19 minutes (%)
Travel time to work - 10 to 19 minutes (% change since 2000)
Travel time to work - 20 to 29 minutes (%)
Travel time to work - 20 to 29 minutes (% change since 2000)
Travel time to work - 30 to 39 minutes (%)
Travel time to work - 30 to 39 minutes (% change since 2000)
Travel time to work - 40 to 59 minutes (%)
Travel time to work - 40 to 59 minutes (% change since 2000)
Travel time to work - 60 to 89 minutes (%)
Travel time to work - 60 to 89 minutes (% change since 2000)
Travel time to work - 90 or more minutes (%)
Travel time to work - 90 or more minutes (% change since 2000)
Marital status - Never married (%)
Marital status - Now married (%)
Marital status - Separated (%)
Marital status - Widowed (%)
Marital status - Divorced (%)
Median family income ($)
Median family income (% change since 2000)
Median non-family income ($)
Median non-family income (% change since 2000)
Median per capita income ($)
Median per capita income (% change since 2000)
Median family income ($) - White
Median family income ($) - Black or African American
Median family income ($) - Asian
Median family income ($) - Hispanic or Latino
Median family income ($) - American Indian and Alaska Native
Median family income ($) - Multirace
Median family income ($) - Other Race
Median year house/condo built
Median year apartment built
Year house built - Built 2005 or later (%)
Year house built - Built 2000 to 2004 (%)
Year house built - Built 1990 to 1999 (%)
Year house built - Built 1980 to 1989 (%)
Year house built - Built 1970 to 1979 (%)
Year house built - Built 1960 to 1969 (%)
Year house built - Built 1950 to 1959 (%)
Year house built - Built 1940 to 1949 (%)
Year house built - Built 1939 or earlier (%)
Average household size
Household density (households per square mile)
Average household size - White
Average household size - Black or African American
Average household size - Asian
Average household size - Hispanic or Latino
Average household size - American Indian and Alaska Native
Average household size - Multirace
Average household size - Other Race
Occupied housing units (%)
Vacant housing units (%)
Owner occupied housing units (%)
Renter occupied housing units (%)
Vacancy status - For rent (%)
Vacancy status - For sale only (%)
Vacancy status - Rented or sold, not occupied (%)
Vacancy status - For seasonal, recreational, or occasional use (%)
Vacancy status - For migrant workers (%)
Vacancy status - Other vacant (%)
Residents with income below the poverty level (%)
Residents with income below 50% of the poverty level (%)
Children below poverty level (%)
Poor families by family type - Married-couple family (%)
Poor families by family type - Male, no wife present (%)
Poor families by family type - Female, no husband present (%)
Poverty status for native-born residents (%)
Poverty status for foreign-born residents (%)
Poverty among high school graduates not in families (%)
Poverty among people who did not graduate high school not in families (%)
Residents with income below the poverty level (%) - White
Residents with income below the poverty level (%) - Black or African American
Residents with income below the poverty level (%) - Asian
Residents with income below the poverty level (%) - Hispanic or Latino
Residents with income below the poverty level (%) - American Indian and Alaska Native
Residents with income below the poverty level (%) - Multirace
Residents with income below the poverty level (%) - Other Race
Air pollution - Air Quality Index (AQI)
Air pollution - CO
Air pollution - NO2
Air pollution - SO2
Air pollution - Ozone
Air pollution - PM10
Air pollution - PM25
Air pollution - Pb
Crime - Murders per 100,000 population
Crime - Rapes per 100,000 population
Crime - Robberies per 100,000 population
Crime - Assaults per 100,000 population
Crime - Burglaries per 100,000 population
Crime - Thefts per 100,000 population
Crime - Auto thefts per 100,000 population
Crime - Arson per 100,000 population
Crime - City-data.com crime index
Crime - Violent crime index
Crime - Property crime index
Crime - Murders per 100,000 population (5 year average)
Crime - Rapes per 100,000 population (5 year average)
Crime - Robberies per 100,000 population (5 year average)
Crime - Assaults per 100,000 population (5 year average)
Crime - Burglaries per 100,000 population (5 year average)
Crime - Thefts per 100,000 population (5 year average)
Crime - Auto thefts per 100,000 population (5 year average)
Crime - Arson per 100,000 population (5 year average)
Crime - City-data.com crime index (5 year average)
Crime - Violent crime index (5 year average)
Crime - Property crime index (5 year average)
1996 Presidential Elections Results (%) - Democratic Party (Clinton)
1996 Presidential Elections Results (%) - Republican Party (Dole)
1996 Presidential Elections Results (%) - Other
2000 Presidential Elections Results (%) - Democratic Party (Gore)
2000 Presidential Elections Results (%) - Republican Party (Bush)
2000 Presidential Elections Results (%) - Other
2004 Presidential Elections Results (%) - Democratic Party (Kerry)
2004 Presidential Elections Results (%) - Republican Party (Bush)
2004 Presidential Elections Results (%) - Other
2008 Presidential Elections Results (%) - Democratic Party (Obama)
2008 Presidential Elections Results (%) - Republican Party (McCain)
2008 Presidential Elections Results (%) - Other
2012 Presidential Elections Results (%) - Democratic Party (Obama)
2012 Presidential Elections Results (%) - Republican Party (Romney)
2012 Presidential Elections Results (%) - Other
2016 Presidential Elections Results (%) - Democratic Party (Clinton)
2016 Presidential Elections Results (%) - Republican Party (Trump)
2016 Presidential Elections Results (%) - Other
2020 Presidential Elections Results (%) - Democratic Party (Biden)
2020 Presidential Elections Results (%) - Republican Party (Trump)
2020 Presidential Elections Results (%) - Other
Ancestries Reported - Arab (%)
Ancestries Reported - Czech (%)
Ancestries Reported - Danish (%)
Ancestries Reported - Dutch (%)
Ancestries Reported - English (%)
Ancestries Reported - French (%)
Ancestries Reported - French Canadian (%)
Ancestries Reported - German (%)
Ancestries Reported - Greek (%)
Ancestries Reported - Hungarian (%)
Ancestries Reported - Irish (%)
Ancestries Reported - Italian (%)
Ancestries Reported - Lithuanian (%)
Ancestries Reported - Norwegian (%)
Ancestries Reported - Polish (%)
Ancestries Reported - Portuguese (%)
Ancestries Reported - Russian (%)
Ancestries Reported - Scotch-Irish (%)
Ancestries Reported - Scottish (%)
Ancestries Reported - Slovak (%)
Ancestries Reported - Subsaharan African (%)
Ancestries Reported - Swedish (%)
Ancestries Reported - Swiss (%)
Ancestries Reported - Ukrainian (%)
Ancestries Reported - United States (%)
Ancestries Reported - Welsh (%)
Ancestries Reported - West Indian (%)
Ancestries Reported - Other (%)
Educational Attainment - No schooling completed (%)
Educational Attainment - Less than high school (%)
Educational Attainment - High school or equivalent (%)
Educational Attainment - Less than 1 year of college (%)
Educational Attainment - 1 or more years of college (%)
Educational Attainment - Associate degree (%)
Educational Attainment - Bachelor's degree (%)
Educational Attainment - Master's degree (%)
Educational Attainment - Professional school degree (%)
Educational Attainment - Doctorate degree (%)
School Enrollment - Nursery, preschool (%)
School Enrollment - Kindergarten (%)
School Enrollment - Grade 1 to 4 (%)
School Enrollment - Grade 5 to 8 (%)
School Enrollment - Grade 9 to 12 (%)
School Enrollment - College undergrad (%)
School Enrollment - Graduate or professional (%)
School Enrollment - Not enrolled in school (%)
School enrollment - Public schools (%)
School enrollment - Private schools (%)
School enrollment - Not enrolled (%)
Median number of rooms in houses and condos
Median number of rooms in apartments
Housing units lacking complete plumbing facilities (%)
Housing units lacking complete kitchen facilities (%)
Density of houses
Urban houses (%)
Rural houses (%)
Households with people 60 years and over (%)
Households with people 65 years and over (%)
Households with people 75 years and over (%)
Households with one or more nonrelatives (%)
Households with no nonrelatives (%)
Population in households (%)
Family households (%)
Nonfamily households (%)
Population in families (%)
Family households with own children (%)
Median number of bedrooms in owner occupied houses
Mean number of bedrooms in owner occupied houses
Median number of bedrooms in renter occupied houses
Mean number of bedrooms in renter occupied houses
Median number of vehichles in owner occupied houses
Mean number of vehichles in owner occupied houses
Median number of vehichles in renter occupied houses
Mean number of vehichles in renter occupied houses
Mortgage status - with mortgage (%)
Mortgage status - with second mortgage (%)
Mortgage status - with home equity loan (%)
Mortgage status - with both second mortgage and home equity loan (%)
Mortgage status - without a mortgage (%)
Average family size
Average family size - White
Average family size - Black or African American
Average family size - Asian
Average family size - Hispanic or Latino
Average family size - American Indian and Alaska Native
Average family size - Multirace
Average family size - Other Race
Geographical mobility - Same house 1 year ago (%)
Geographical mobility - Moved within same county (%)
Geographical mobility - Moved from different county within same state (%)
Geographical mobility - Moved from different state (%)
Geographical mobility - Moved from abroad (%)
Place of birth - Born in state of residence (%)
Place of birth - Born in other state (%)
Place of birth - Native, outside of US (%)
Place of birth - Foreign born (%)
Housing units in structures - 1, detached (%)
Housing units in structures - 1, attached (%)
Housing units in structures - 2 (%)
Housing units in structures - 3 or 4 (%)
Housing units in structures - 5 to 9 (%)
Housing units in structures - 10 to 19 (%)
Housing units in structures - 20 to 49 (%)
Housing units in structures - 50 or more (%)
Housing units in structures - Mobile home (%)
Housing units in structures - Boat, RV, van, etc. (%)
House/condo owner moved in on average (years ago)
Renter moved in on average (years ago)
Year householder moved into unit - Moved in 1999 to March 2000 (%)
Year householder moved into unit - Moved in 1995 to 1998 (%)
Year householder moved into unit - Moved in 1990 to 1994 (%)
Year householder moved into unit - Moved in 1980 to 1989 (%)
Year householder moved into unit - Moved in 1970 to 1979 (%)
Year householder moved into unit - Moved in 1969 or earlier (%)
Means of transportation to work - Drove car alone (%)
Means of transportation to work - Carpooled (%)
Means of transportation to work - Public transportation (%)
Means of transportation to work - Bus or trolley bus (%)
Means of transportation to work - Streetcar or trolley car (%)
Means of transportation to work - Subway or elevated (%)
Means of transportation to work - Railroad (%)
Means of transportation to work - Ferryboat (%)
Means of transportation to work - Taxicab (%)
Means of transportation to work - Motorcycle (%)
Means of transportation to work - Bicycle (%)
Means of transportation to work - Walked (%)
Means of transportation to work - Other means (%)
Working at home (%)
Industry diversity
Most Common Industries - Agriculture, forestry, fishing and hunting, and mining (%)
Most Common Industries - Agriculture, forestry, fishing and hunting (%)
Most Common Industries - Mining, quarrying, and oil and gas extraction (%)
Most Common Industries - Construction (%)
Most Common Industries - Manufacturing (%)
Most Common Industries - Wholesale trade (%)
Most Common Industries - Retail trade (%)
Most Common Industries - Transportation and warehousing, and utilities (%)
Most Common Industries - Transportation and warehousing (%)
Most Common Industries - Utilities (%)
Most Common Industries - Information (%)
Most Common Industries - Finance and insurance, and real estate and rental and leasing (%)
Most Common Industries - Finance and insurance (%)
Most Common Industries - Real estate and rental and leasing (%)
Most Common Industries - Professional, scientific, and management, and administrative and waste management services (%)
Most Common Industries - Professional, scientific, and technical services (%)
Most Common Industries - Management of companies and enterprises (%)
Most Common Industries - Administrative and support and waste management services (%)
Most Common Industries - Educational services, and health care and social assistance (%)
Most Common Industries - Educational services (%)
Most Common Industries - Health care and social assistance (%)
Most Common Industries - Arts, entertainment, and recreation, and accommodation and food services (%)
Most Common Industries - Arts, entertainment, and recreation (%)
Most Common Industries - Accommodation and food services (%)
Most Common Industries - Other services, except public administration (%)
Most Common Industries - Public administration (%)
Occupation diversity
Most Common Occupations - Management, business, science, and arts occupations (%)
Most Common Occupations - Management, business, and financial occupations (%)
Most Common Occupations - Management occupations (%)
Most Common Occupations - Business and financial operations occupations (%)
Most Common Occupations - Computer, engineering, and science occupations (%)
Most Common Occupations - Computer and mathematical occupations (%)
Most Common Occupations - Architecture and engineering occupations (%)
Most Common Occupations - Life, physical, and social science occupations (%)
Most Common Occupations - Education, legal, community service, arts, and media occupations (%)
Most Common Occupations - Community and social service occupations (%)
Most Common Occupations - Legal occupations (%)
Most Common Occupations - Education, training, and library occupations (%)
Most Common Occupations - Arts, design, entertainment, sports, and media occupations (%)
Most Common Occupations - Healthcare practitioners and technical occupations (%)
Most Common Occupations - Health diagnosing and treating practitioners and other technical occupations (%)
Most Common Occupations - Health technologists and technicians (%)
Most Common Occupations - Service occupations (%)
Most Common Occupations - Healthcare support occupations (%)
Most Common Occupations - Protective service occupations (%)
Most Common Occupations - Fire fighting and prevention, and other protective service workers including supervisors (%)
Most Common Occupations - Law enforcement workers including supervisors (%)
Most Common Occupations - Food preparation and serving related occupations (%)
Most Common Occupations - Building and grounds cleaning and maintenance occupations (%)
Most Common Occupations - Personal care and service occupations (%)
Most Common Occupations - Sales and office occupations (%)
Most Common Occupations - Sales and related occupations (%)
Most Common Occupations - Office and administrative support occupations (%)
Most Common Occupations - Natural resources, construction, and maintenance occupations (%)
Most Common Occupations - Farming, fishing, and forestry occupations (%)
Most Common Occupations - Construction and extraction occupations (%)
Most Common Occupations - Installation, maintenance, and repair occupations (%)
Most Common Occupations - Production, transportation, and material moving occupations (%)
Most Common Occupations - Production occupations (%)
Most Common Occupations - Transportation occupations (%)
Most Common Occupations - Material moving occupations (%)
People in Group quarters - Institutionalized population (%)
People in Group quarters - Correctional institutions (%)
People in Group quarters - Federal prisons and detention centers (%)
People in Group quarters - Halfway houses (%)
People in Group quarters - Local jails and other confinement facilities (including police lockups) (%)
People in Group quarters - Military disciplinary barracks (%)
People in Group quarters - State prisons (%)
People in Group quarters - Other types of correctional institutions (%)
People in Group quarters - Nursing homes (%)
People in Group quarters - Hospitals/wards, hospices, and schools for the handicapped (%)
People in Group quarters - Hospitals/wards and hospices for chronically ill (%)
People in Group quarters - Hospices or homes for chronically ill (%)
People in Group quarters - Military hospitals or wards for chronically ill (%)
People in Group quarters - Other hospitals or wards for chronically ill (%)
People in Group quarters - Hospitals or wards for drug/alcohol abuse (%)
People in Group quarters - Mental (Psychiatric) hospitals or wards (%)
People in Group quarters - Schools, hospitals, or wards for the mentally retarded (%)
People in Group quarters - Schools, hospitals, or wards for the physically handicapped (%)
People in Group quarters - Institutions for the deaf (%)
People in Group quarters - Institutions for the blind (%)
People in Group quarters - Orthopedic wards and institutions for the physically handicapped (%)
People in Group quarters - Wards in general hospitals for patients who have no usual home elsewhere (%)
People in Group quarters - Wards in military hospitals for patients who have no usual home elsewhere (%)
People in Group quarters - Juvenile institutions (%)
People in Group quarters - Long-term care (%)
People in Group quarters - Homes for abused, dependent, and neglected children (%)
People in Group quarters - Residential treatment centers for emotionally disturbed children (%)
People in Group quarters - Training schools for juvenile delinquents (%)
People in Group quarters - Short-term care, detention or diagnostic centers for delinquent children (%)
People in Group quarters - Type of juvenile institution unknown (%)
People in Group quarters - Noninstitutionalized population (%)
People in Group quarters - College dormitories (includes college quarters off campus) (%)
People in Group quarters - Military quarters (%)
People in Group quarters - On base (%)
People in Group quarters - Barracks, unaccompanied personnel housing (UPH), (Enlisted/Officer), ;and similar group living quarters for military personnel (%)
People in Group quarters - Transient quarters for temporary residents (%)
People in Group quarters - Military ships (%)
People in Group quarters - Group homes (%)
People in Group quarters - Homes or halfway houses for drug/alcohol abuse (%)
People in Group quarters - Homes for the mentally ill (%)
People in Group quarters - Homes for the mentally retarded (%)
People in Group quarters - Homes for the physically handicapped (%)
People in Group quarters - Other group homes (%)
People in Group quarters - Religious group quarters (%)
People in Group quarters - Dormitories (%)
People in Group quarters - Agriculture workers' dormitories on farms (%)
People in Group quarters - Job Corps and vocational training facilities (%)
People in Group quarters - Other workers' dormitories (%)
People in Group quarters - Crews of maritime vessels (%)
People in Group quarters - Other nonhousehold living situations (%)
People in Group quarters - Other noninstitutional group quarters (%)
Residents speaking English at home (%)
Residents speaking English at home - Born in the United States (%)
Residents speaking English at home - Native, born elsewhere (%)
Residents speaking English at home - Foreign born (%)
Residents speaking Spanish at home (%)
Residents speaking Spanish at home - Born in the United States (%)
Residents speaking Spanish at home - Native, born elsewhere (%)
Residents speaking Spanish at home - Foreign born (%)
Residents speaking other language at home (%)
Residents speaking other language at home - Born in the United States (%)
Residents speaking other language at home - Native, born elsewhere (%)
Residents speaking other language at home - Foreign born (%)
Class of Workers - Employee of private company (%)
Class of Workers - Self-employed in own incorporated business (%)
Class of Workers - Private not-for-profit wage and salary workers (%)
Class of Workers - Local government workers (%)
Class of Workers - State government workers (%)
Class of Workers - Federal government workers (%)
Class of Workers - Self-employed workers in own not incorporated business and Unpaid family workers (%)
House heating fuel used in houses and condos - Utility gas (%)
House heating fuel used in houses and condos - Bottled, tank, or LP gas (%)
House heating fuel used in houses and condos - Electricity (%)
House heating fuel used in houses and condos - Fuel oil, kerosene, etc. (%)
House heating fuel used in houses and condos - Coal or coke (%)
House heating fuel used in houses and condos - Wood (%)
House heating fuel used in houses and condos - Solar energy (%)
House heating fuel used in houses and condos - Other fuel (%)
House heating fuel used in houses and condos - No fuel used (%)
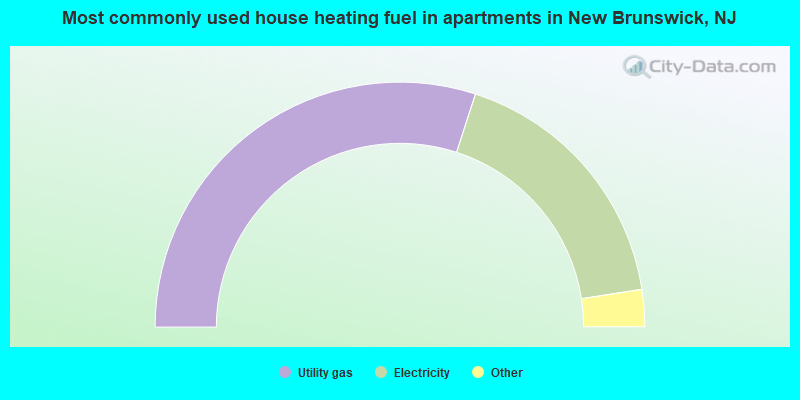
House heating fuel used in apartments - Utility gas (%)
House heating fuel used in apartments - Bottled, tank, or LP gas (%)
House heating fuel used in apartments - Electricity (%)
House heating fuel used in apartments - Fuel oil, kerosene, etc. (%)
House heating fuel used in apartments - Coal or coke (%)
House heating fuel used in apartments - Wood (%)
House heating fuel used in apartments - Solar energy (%)
House heating fuel used in apartments - Other fuel (%)
House heating fuel used in apartments - No fuel used (%)
Armed forces status - In Armed Forces (%)
Armed forces status - Civilian (%)
Armed forces status - Civilian - Veteran (%)
Armed forces status - Civilian - Nonveteran (%)
Fatal accidents locations in years 2005-2021
Fatal accidents locations in 2005
Fatal accidents locations in 2006
Fatal accidents locations in 2007
Fatal accidents locations in 2008
Fatal accidents locations in 2009
Fatal accidents locations in 2010
Fatal accidents locations in 2011
Fatal accidents locations in 2012
Fatal accidents locations in 2013
Fatal accidents locations in 2014
Fatal accidents locations in 2015
Fatal accidents locations in 2016
Fatal accidents locations in 2017
Fatal accidents locations in 2018
Fatal accidents locations in 2019
Fatal accidents locations in 2020
Fatal accidents locations in 2021
Alcohol use - People drinking some alcohol every month (%)
Alcohol use - People not drinking at all (%)
Alcohol use - Average days/month drinking alcohol
Alcohol use - Average drinks/week
Alcohol use - Average days/year people drink much
Audiometry - Average condition of hearing (%)
Audiometry - People that can hear a whisper from across a quiet room (%)
Audiometry - People that can hear normal voice from across a quiet room (%)
Audiometry - Ears ringing, roaring, buzzing (%)
Audiometry - Had a job exposure to loud noise (%)
Audiometry - Had off-work exposure to loud noise (%)
Blood Pressure & Cholesterol - Has high blood pressure (%)
Blood Pressure & Cholesterol - Checking blood pressure at home (%)
Blood Pressure & Cholesterol - Frequently checking blood cholesterol (%)
Blood Pressure & Cholesterol - Has high cholesterol level (%)
Consumer Behavior - Money monthly spent on food at supermarket/grocery store
Consumer Behavior - Money monthly spent on food at other stores
Consumer Behavior - Money monthly spent on eating out
Consumer Behavior - Money monthly spent on carryout/delivered foods
Consumer Behavior - Income spent on food at supermarket/grocery store (%)
Consumer Behavior - Income spent on food at other stores (%)
Consumer Behavior - Income spent on eating out (%)
Consumer Behavior - Income spent on carryout/delivered foods (%)
Current Health Status - General health condition (%)
Current Health Status - Blood donors (%)
Current Health Status - Has blood ever tested for HIV virus (%)
Current Health Status - Left-handed people (%)
Dermatology - People using sunscreen (%)
Diabetes - Diabetics (%)
Diabetes - Had a blood test for high blood sugar (%)
Diabetes - People taking insulin (%)
Diet Behavior & Nutrition - Diet health (%)
Diet Behavior & Nutrition - Milk product consumption (# of products/month)
Diet Behavior & Nutrition - Meals not home prepared (#/week)
Diet Behavior & Nutrition - Meals from fast food or pizza place (#/week)
Diet Behavior & Nutrition - Ready-to-eat foods (#/month)
Diet Behavior & Nutrition - Frozen meals/pizza (#/month)
Drug Use - People that ever used marijuana or hashish (%)
Drug Use - Ever used hard drugs (%)
Drug Use - Ever used any form of cocaine (%)
Drug Use - Ever used heroin (%)
Drug Use - Ever used methamphetamine (%)
Health Insurance - People covered by health insurance (%)
Kidney Conditions-Urology - Avg. # of times urinating at night
Medical Conditions - People with asthma (%)
Medical Conditions - People with anemia (%)
Medical Conditions - People with psoriasis (%)
Medical Conditions - People with overweight (%)
Medical Conditions - Elderly people having difficulties in thinking or remembering (%)
Medical Conditions - People who ever received blood transfusion (%)
Medical Conditions - People having trouble seeing even with glass/contacts (%)
Medical Conditions - People with arthritis (%)
Medical Conditions - People with gout (%)
Medical Conditions - People with congestive heart failure (%)
Medical Conditions - People with coronary heart disease (%)
Medical Conditions - People with angina pectoris (%)
Medical Conditions - People who ever had heart attack (%)
Medical Conditions - People who ever had stroke (%)
Medical Conditions - People with emphysema (%)
Medical Conditions - People with thyroid problem (%)
Medical Conditions - People with chronic bronchitis (%)
Medical Conditions - People with any liver condition (%)
Medical Conditions - People who ever had cancer or malignancy (%)
Mental Health - People who have little interest in doing things (%)
Mental Health - People feeling down, depressed, or hopeless (%)
Mental Health - People who have trouble sleeping or sleeping too much (%)
Mental Health - People feeling tired or having little energy (%)
Mental Health - People with poor appetite or overeating (%)
Mental Health - People feeling bad about themself (%)
Mental Health - People who have trouble concentrating on things (%)
Mental Health - People moving or speaking slowly or too fast (%)
Mental Health - People having thoughts they would be better off dead (%)
Oral Health - Average years since last visit a dentist
Oral Health - People embarrassed because of mouth (%)
Oral Health - People with gum disease (%)
Oral Health - General health of teeth and gums (%)
Oral Health - Average days a week using dental floss/device
Oral Health - Average days a week using mouthwash for dental problem
Oral Health - Average number of teeth
Pesticide Use - Households using pesticides to control insects (%)
Pesticide Use - Households using pesticides to kill weeds (%)
Physical Activity - People doing vigorous-intensity work activities (%)
Physical Activity - People doing moderate-intensity work activities (%)
Physical Activity - People walking or bicycling (%)
Physical Activity - People doing vigorous-intensity recreational activities (%)
Physical Activity - People doing moderate-intensity recreational activities (%)
Physical Activity - Average hours a day doing sedentary activities
Physical Activity - Average hours a day watching TV or videos
Physical Activity - Average hours a day using computer
Physical Functioning - People having limitations keeping them from working (%)
Physical Functioning - People limited in amount of work they can do (%)
Physical Functioning - People that need special equipment to walk (%)
Physical Functioning - People experiencing confusion/memory problems (%)
Physical Functioning - People requiring special healthcare equipment (%)
Prescription Medications - Average number of prescription medicines taking
Preventive Aspirin Use - Adults 40+ taking low-dose aspirin (%)
Reproductive Health - Vaginal deliveries (%)
Reproductive Health - Cesarean deliveries (%)
Reproductive Health - Deliveries resulted in a live birth (%)
Reproductive Health - Pregnancies resulted in a delivery (%)
Reproductive Health - Women breastfeeding newborns (%)
Reproductive Health - Women that had a hysterectomy (%)
Reproductive Health - Women that had both ovaries removed (%)
Reproductive Health - Women that have ever taken birth control pills (%)
Reproductive Health - Women taking birth control pills (%)
Reproductive Health - Women that have ever used Depo-Provera or injectables (%)
Reproductive Health - Women that have ever used female hormones (%)
Sexual Behavior - People 18+ that ever had sex (vaginal, anal, or oral) (%)
Sexual Behavior - Males 18+ that ever had vaginal sex with a woman (%)
Sexual Behavior - Males 18+ that ever performed oral sex on a woman (%)
Sexual Behavior - Males 18+ that ever had anal sex with a woman (%)
Sexual Behavior - Males 18+ that ever had any sex with a man (%)
Sexual Behavior - Females 18+ that ever had vaginal sex with a man (%)
Sexual Behavior - Females 18+ that ever performed oral sex on a man (%)
Sexual Behavior - Females 18+ that ever had anal sex with a man (%)
Sexual Behavior - Females 18+ that ever had any kind of sex with a woman (%)
Sexual Behavior - Average age people first had sex
Sexual Behavior - Average number of female sex partners in lifetime (males 18+)
Sexual Behavior - Average number of female vaginal sex partners in lifetime (males 18+)
Sexual Behavior - Average age people first performed oral sex on a woman (18+)
Sexual Behavior - Average number of woman performed oral sex on in lifetime (18+)
Sexual Behavior - Average number of male sex partners in lifetime (males 18+)
Sexual Behavior - Average number of male anal sex partners in lifetime (males 18+)
Sexual Behavior - Average age people first performed oral sex on a man (18+)
Sexual Behavior - Average number of male oral sex partners in lifetime (18+)
Sexual Behavior - People using protection when performing oral sex (%)
Sexual Behavior - Average number of times people have vaginal or anal sex a year
Sexual Behavior - People having sex without condom (%)
Sexual Behavior - Average number of male sex partners in lifetime (females 18+)
Sexual Behavior - Average number of male vaginal sex partners in lifetime (females 18+)
Sexual Behavior - Average number of female sex partners in lifetime (females 18+)
Sexual Behavior - Circumcised males 18+ (%)
Sleep Disorders - Average hours sleeping at night
Sleep Disorders - People that has trouble sleeping (%)
Smoking-Cigarette Use - People smoking cigarettes (%)
Taste & Smell - People 40+ having problems with smell (%)
Taste & Smell - People 40+ having problems with taste (%)
Taste & Smell - People 40+ that ever had wisdom teeth removed (%)
Taste & Smell - People 40+ that ever had tonsils teeth removed (%)
Taste & Smell - People 40+ that ever had a loss of consciousness because of a head injury (%)
Taste & Smell - People 40+ that ever had a broken nose or other serious injury to face or skull (%)
Taste & Smell - People 40+ that ever had two or more sinus infections (%)
Weight - Average height (inches)
Weight - Average weight (pounds)
Weight - Average BMI
Weight - People that are obese (%)
Weight - People that ever were obese (%)
Weight - People trying to lose weight (%)
The City-Data.com crime index weighs serious crimes and violent crimes more heavily. Higher means more crime, U.S. average is 246.1. It adjusts for the number of visitors and daily workers commuting into cities.
- means the value is smaller than the state average.
- means the value is about the same as the state average.
- means the value is bigger than the state average.
- means the value is much bigger than the state average.
Crime rate in New Brunswick detailed stats: murders, rapes, robberies, assaults, burglaries, thefts, arson Officers per 1,000 residents here:
2.49New Jersey average:
5.53
Latest news from New Brunswick, NJ collected exclusively by city-data.com from local newspapers, TV, and radio stations
Ancestries: American (5.2%), Italian (1.7%).
Current Local Time:
Land area: 5.23 square miles.
Population density: 10,714 people per square mile (high).
19,129 residents are foreign born (26.4% Latin America , 4.3% Asia ).
This city:
34.3%New Jersey:
23.2%
Median real estate property taxes paid for housing units with mortgages in 2022: $5,872 (1.9%)Median real estate property taxes paid for housing units with no mortgage in 2022: $5,424 (1.8%)
Nearest city with pop. 50,000+: Edison, NJ
Nearest city with pop. 200,000+: Staten Island, NY
Nearest city with pop. 1,000,000+: Brooklyn, NY
Nearest cities:
Latitude: 40.49 N, Longitude: 74.45 W
New Brunswick nicknames or aliases (official or unofficial):
Health Care City, Hub CityDaytime population change due to commuting: +17,135 (+30.7%)Workers who live and work in this city: 7,967 (31.8%)
Area codes: 732, 908, 848
New Brunswick tourist attractions:
Single-family new house construction building permits:
2022: 14 buildings , average cost: $2,585,1002021: 3 buildings , average cost: $201,7002020: 3 buildings , average cost: $149,5002019: 3 buildings , average cost: $193,1002018: 3 buildings , average cost: $109,3002017: 1 building , cost: $28,0002016: 5 buildings , average cost: $117,5002015: 7 buildings , average cost: $117,5002014: 9 buildings , average cost: $117,5002013: 15 buildings , average cost: $117,5002012: 20 buildings , average cost: $128,7002011: 19 buildings , average cost: $123,9002010: 31 buildings , average cost: $147,7002009: 21 buildings , average cost: $68,5002008: 37 buildings , average cost: $56,2002007: 40 buildings , average cost: $79,8002006: 19 buildings , average cost: $49,4002005: 29 buildings , average cost: $49,5002004: 30 buildings , average cost: $49,2002003: 30 buildings , average cost: $50,9002002: 30 buildings , average cost: $41,1002001: 8 buildings , average cost: $51,1002000: 30 buildings , average cost: $66,4001999: 7 buildings , average cost: $69,0001998: 1 building , cost: $114,9001997: 16 buildings , average cost: $114,900Unemployment in December 2023:
Population change in the 1990s: +6,870 (+16.5%).
Most common occupations in New Brunswick, NJ (%)
Both Males Females
Other production occupations, including supervisors (6.6%)
Building and grounds cleaning and maintenance occupations (6.5%)
Laborers and material movers, hand (5.8%)
Other office and administrative support workers, including supervisors (4.5%)
Waiters and waitresses (3.6%)
Material recording, scheduling, dispatching, and distributing workers (3.4%)
Information and record clerks, except customer service representatives (3.1%)
Building and grounds cleaning and maintenance occupations (7.7%)
Other production occupations, including supervisors (7.5%)
Laborers and material movers, hand (6.1%)
Computer specialists (4.4%)
Material recording, scheduling, dispatching, and distributing workers (3.8%)
Cooks and food preparation workers (3.4%)
Driver/sales workers and truck drivers (3.2%)
Other office and administrative support workers, including supervisors (6.2%)
Other production occupations, including supervisors (5.5%)
Laborers and material movers, hand (5.5%)
Waiters and waitresses (5.3%)
Building and grounds cleaning and maintenance occupations (5.1%)
Information and record clerks, except customer service representatives (4.9%)
Secretaries and administrative assistants (4.8%)
Tornado activity:
New Brunswick-area historical tornado activity is near New Jersey state average. It is 29% smaller than the overall U.S. average.
On 10/18/1990, a category F3 (max. wind speeds 158-206 mph) tornado 17.0 miles away from the New Brunswick city center injured 8 people and caused between $500,000 and $5,000,000 in damages.
On 5/28/1973, a category F3 tornado 21.7 miles away from the city center caused between $50,000 and $500,000 in damages.
Earthquake activity:
New Brunswick-area historical earthquake activity is significantly above New Jersey state average. It is 68% smaller than the overall U.S. average. On 8/23/2011 at 17:51:04, a magnitude 5.8 (5.8 MW, Depth: 3.7 mi, Class: Moderate, Intensity: VI - VII) earthquake occurred 258.4 miles away from New Brunswick center On 1/16/1994 at 01:49:16, a magnitude 4.6 (4.6 MB, 4.6 LG, Depth: 3.1 mi, Class: Light, Intensity: IV - V) earthquake occurred 84.4 miles away from New Brunswick center On 10/7/1983 at 10:18:46, a magnitude 5.3 (5.1 MB, 5.3 LG, 5.1 ML) earthquake occurred 239.7 miles away from New Brunswick center On 4/20/2002 at 10:50:47, a magnitude 5.3 (5.3 ML, Depth: 3.0 mi) earthquake occurred 280.9 miles away from New Brunswick center On 1/16/1994 at 00:42:43, a magnitude 4.2 (4.2 MB, 4.0 LG, Depth: 3.1 mi) earthquake occurred 82.9 miles away from the city center On 4/20/2002 at 10:50:47, a magnitude 5.2 (5.2 MB, 4.2 MS, 5.2 MW, 5.0 MW) earthquake occurred 279.1 miles away from the city center Magnitude types: regional Lg-wave magnitude (LG), body-wave magnitude (MB), local magnitude (ML), surface-wave magnitude (MS), moment magnitude (MW) Natural disasters: The number of natural disasters in Middlesex County (26) is a lot greater than the US average (15).Major Disasters (Presidential) Declared: 17Emergencies Declared: 9Floods: 7, Hurricanes: 7, Storms: 6, Heavy Rains: 4, Snowstorms: 3, Blizzards: 2, Water Shortages: 2, Winter Storms: 2, Tornado: 1, Wind: 1, Other: 3 (Note: some incidents may be assigned to more than one category). Main business address for: ARBINET THEXCHANGE INC SERVICES-BUSINESS SERVICES, NEC ), JOHNSON & JOHNSON PHARMACEUTICAL PREPARATIONS ).
Hospitals and medical centers in New Brunswick: CARES SURGI CENTER, LLC (240 EASTON AVENUE) CHILDRENS SPECIALIZED HOSPITAL (200 SOMERSET STREET) ROBERT WOOD JOHNSON UNIVERSITY HOSPITAL (Voluntary non-profit - Private, ONE ROBERT WOOD JOHNSON PL) SAINT PETER'S UNIVERSITY HOSPITAL (Voluntary non-profit - Church, 254 EASTON AVE) BRUNSWICK PARK NURSING HOME (INTERSECTION ROUTES 1 + 18)
ROSE MOUNTAIN CARE CENTER (ROUTE 1 & 18)
ST PETER'S UNIVERSITY TCU (254 EASTON AVE)
DCI ST PETER UNIV HOSP (DIALYSIS UNIT)
RW JOHNSON UNIVERSITY HOSPITAL DIALYSIS (1 ROBERT WOOD JOHNSON PLACE)
Amtrak station: NEW BRUNSWICK (FRENCH & ALBANY STS.)
.
Services: ticket office, fully wheelchair accessible, enclosed waiting area, public restrooms, public payphones, snack bar, ATM, free short-term parking, free long-term parking, call for car rental service, taxi stand, public transit connection.
Colleges/Universities in New Brunswick: Rutgers University-New Brunswick Full-time enrollment: 39,388; Location: 83 Somerset St; Public; Website: www.rutgers.edu/; Offers Doctor's degree )
New Brunswick Theological Seminary Full-time enrollment: 128; Location: 17 Seminary Place; Private, not-for-profit; Website: www.nbts.edu; Offers Doctor's degree )
Other colleges/universities with over 2000 students near New Brunswick:
Middlesex County College (about 5 miles; Edison, NJ ; Full-time enrollment: 9,849)
Union County College (about 15 miles; Cranford, NJ ; FT enrollment: 9,148)
Princeton University (about 15 miles; Princeton, NJ ; FT enrollment: 6,897)
Raritan Valley Community College (about 16 miles; Branchburg, NJ ; FT enrollment: 5,735)
Kean University (about 18 miles; Union, NJ ; FT enrollment: 12,648)
College of Staten Island CUNY (about 18 miles; Staten Island, NY ; FT enrollment: 11,684)
Drew University (about 19 miles; Madison, NJ ; FT enrollment: 2,272)
Public high schools in New Brunswick: MIDDLESEX CO YOUTH CTR Location: US HIGHWAY 130, Grades: 6-12)
NEW BRUNSWICK HIGH SCHOOL Location: 1000 SOMERSET ST, Grades: PK-12)
Biggest public elementary/middle schools in New Brunswick: ROOSEVELT ELEMENTARY SCHOOL Students: 1,025, Location: 83 LIVINGSTON AVE, Grades: PK-5)A CHESTER REDSHAW SCHOOL Students: 720, Location: 40 VAN DYKE AVENUE, Grades: KG-5)LORD STLRLING ELEMENTARY SCHOOL Students: 708, Location: 101 REDMOND STREET, Grades: PK-5)MCKINLEY COMMUNITY SCHOOL Students: 650, Location: 15 VAN DYKE AVE, Grades: PK-8)LIVINGSTON ELEMENTARY SCHOOL Students: 535, Location: 206 DELAVAN STREET, Grades: KG-5)PAUL ROBESON COMMUNITY SCHOOL Students: 490, Location: 199 COMMERCIAL AVE, Grades: PK-5)WOODROW WILSON ELEMENTARY SCHOOL Students: 426, Location: 133 TUNISON RD, Grades: PK-8)GREATER BRUNSWICK CHARTER SCHOOL Students: 219, Location: 429 JOYCE KILMER AVENUE, Grades: KG-8, Charter school )NEW BRUNSWICK MIDDLE SCHOOL Location: 1125 LIVINGSTON AVENUE, Grades: 6-8)
LINCOLN ELEMENTARY SCHOOL Location: 66 BARTLETT STREET, Grades: PK-5)
See full list of schools located in New Brunswick Library in New Brunswick: NEW BRUNSWICK FREE PUBLIC LIBRARY Operating income: $1,653,756; Location: 60 LIVINGSTON AVENUE; 78,850 books ; 60 e-books ; 1,236 audio materials ; 2,880 video materials ; 6 local licensed databases ; 22 state licensed databases ; 143 print serial subscriptions )
User-submitted facts and corrections:
Another high school in New Brunswick is New Brunswick Health Sciences Technology High School.
Notable locations in New Brunswick: (A) , New Brunswick Free Public Library (B) , New Brunswick City Hall (C) , Middlesex County Courthouse (D) , State Theatre (E) , Bristol - Myers Squibb Emergency Services (F) , First Response Ambulance (G) , Childrens Specialized Hospital at New Brunswick (H) , Cancer Institute of New Jersey (I) , New Brunswick Fire Department Engine Company 5 (J) , New Brunswick Fire Department Engine Company 2 (K) , New Brunswick Fire Department Engine Company 1 / Ladder Company 1 (L) , New Brunswick Art Center (M) , Raritan Engine Company Number 4 (N) , Citizens Building (O) , New Brunswick Engine Company Number 40 (P) , City of New Brunswick Police Station (Q) , Middlesex County Jail (R) , Gardner A Sage Library (S) , Scudder Hall (T) . Display/hide their locations on the map
Main business address in New Brunswick include: (A) , JOHNSON & JOHNSON (B) . Display/hide their locations on the map
Churches in New Brunswick include: (A) , Seventh Day Adventist Church (B) , Anshe Emethodist Memorial Temple (C) , Saint Alban's Episcopal Church (D) , New Brunswick Islamic Center (E) , Ebenezer Baptist Church (F) , Iglesia De Dios Peniel (G) , Voorhees Chapel (H) , Saint James Methodist Church (I) . Display/hide their locations on the map
Cemeteries: (1) , Saint Peters Cemetery (2) , First Methodist Cemetery (3) , Poile Zeda Cemetery (4) . Display/hide their locations on the map
Parks in New Brunswick include: (1) , Baker Park (2) , Elmer B Boyd Park (3) , Kossuth Park (4) , Memorial Stadium (5) , Buccleuch Park (6) . Display/hide their locations on the map
Tourist attractions:
Hotels:
Courts:
Birthplace of: Brian Lawton - Ice hockey player, Arthur S. Carpender - Navy vice admiral, Alan Guth - Cosmologist, Wheeler Winston Dixon - Experimental filmmaker, Michael Douglas - (born 1944), actor, Edward M. Liddy - Businessman, Ellen Spiro - Documentary filmmaker, Abbot Kinney - Real estate businessman, John Seward Johnson I - Businessman, Joseph Cross (actor) - Film actor.
Middlesex County has a predicted average indoor radon screening level between 2 and 4 pCi/L (pico curies per liter) - Moderate Potential Drinking water stations with addresses in New Brunswick and their reported violations in the past:
NEW BRUNSWICK W DEPT (Population served: 50,000, Surface water):
Past health violations:
Treatment Technique (SWTR and GWR) - In MAR-2013
Treatment Technique (SWTR and GWR) - In NOV-2012
Treatment Technique (SWTR and GWR) - In NOV-2012
Treatment Technique (SWTR and GWR) - In OCT-2012
Treatment Technique (SWTR and GWR) - In SEP-2012
Treatment Technique (SWTR and GWR) - In AUG-2012
32 other older health violations
Past monitoring violations:
Monitoring of Treatment (SWTR-Filter) - In MAR-2014. Follow-up actions: St Formal NOV issued (APR-23-2014), St Compliance achieved (JUN-02-2014)
Monitoring of Treatment (SWTR-Filter) - In FEB-2014. Follow-up actions: St Formal NOV issued (MAR-25-2014), St Compliance achieved (APR-17-2014)
Monitoring and Reporting (DBP) - Between JAN-2014 and MAR-2014, Contaminant: Chlorine. Follow-up actions: St Formal NOV issued (APR-28-2014), St Compliance achieved (JUN-02-2014)
Single Turbidity Exceed (Enhanced SWTR) - In JUN-2013, Contaminant: IESWTR. Follow-up actions: St Compliance achieved (JUN-13-2013), St Public Notif requested (JUN-14-2013), St Formal NOV issued (JUN-14-2013), St Public Notif received (DEC-09-2013)
Monitoring, Turbidity (Enhanced SWTR) - In MAY-2013, Contaminant: IESWTR
One routine major monitoring violation
8 minor monitoring violations
2 regular monitoring violations
129 other older monitoring violations
Address: 94 BAYARD ST Serves VT, Population served: 31, Groundwater):
Past health violations:
MCL, Acute (TCR) - In AUG-2012, Contaminant: Coliform. Follow-up actions: St Tech Assistance Visit (AUG-06-2012), St Formal NOV issued (AUG-06-2012), St Public Notif requested (AUG-06-2012), St Boil Water Order (AUG-06-2012), St Compliance achieved (AUG-22-2012)
MCL, Monthly (TCR) - In SEP-2009, Contaminant: Coliform. Follow-up actions: St Tech Assistance Visit (SEP-16-2009), St Formal NOV issued (SEP-16-2009), St Public Notif requested (SEP-16-2009), St Boil Water Order (SEP-16-2009), St Compliance achieved (NOV-08-2010)
MCL, Monthly (TCR) - In SEP-2008, Contaminant: Coliform. Follow-up actions: St Tech Assistance Visit (SEP-17-2008), St Formal NOV issued (SEP-17-2008), St Boil Water Order (SEP-17-2008), St Public Notif requested (SEP-17-2008), St Public Notif received (SEP-23-2008), St Compliance achieved (NOV-08-2010)
MCL, Monthly (TCR) - In MAY-2008, Contaminant: Coliform. Follow-up actions: St Tech Assistance Visit (MAY-14-2008), St Formal NOV issued (MAY-14-2008), St Public Notif requested (MAY-14-2008), St Boil Water Order (MAY-14-2008), St Compliance achieved (NOV-08-2010)
MCL, Monthly (TCR) - In NOV-2007, Contaminant: Coliform. Follow-up actions: St Tech Assistance Visit (NOV-30-2007), St Formal NOV issued (NOV-30-2007), St Public Notif requested (NOV-30-2007), St Boil Water Order (NOV-30-2007), St Compliance achieved (NOV-08-2010)
MCL, Monthly (TCR) - In OCT-2006, Contaminant: Coliform. Follow-up actions: St Formal NOV issued (OCT-31-2006), St Boil Water Order (OCT-31-2006), St Tech Assistance Visit (OCT-31-2006), St Public Notif requested (OCT-31-2006), St Public Notif received (2 times from NOV-06-2006 to NOV-06-2006), St Compliance achieved (JAN-08-2007)
Past monitoring violations:
3 routine major monitoring violations
One regular monitoring violation
Average household size: This city:
3.4 peopleNew Jersey:
2.7 people
Percentage of family households: This city:
54.9%Whole state:
69.3%
Percentage of households with unmarried partners: This city:
9.3%Whole state:
5.9%
Likely homosexual households (counted as self-reported same-sex unmarried-partner households)
Lesbian couples: 0.4% of all households Gay men: 0.5% of all households
People in group quarters in New Brunswick in 2010:
7,272 people in college/university student housing
189 people in other noninstitutional facilities
147 people in nursing facilities/skilled-nursing facilities
86 people in emergency and transitional shelters (with sleeping facilities) for people experiencing homelessness
19 people in correctional residential facilities
16 people in group homes for juveniles (non-correctional)
16 people in group homes intended for adults
People in group quarters in New Brunswick in 2000:
5,747 people in college dormitories (includes college quarters off campus)
362 people in other noninstitutional group quarters
123 people in other group homes
90 people in nursing homes
54 people in homes or halfway houses for drug/alcohol abuse
25 people in religious group quarters
20 people in homes for the mentally retarded
19 people in halfway houses
6 people in homes for the mentally ill
Banks with most branches in New Brunswick (2011 data):
Bank of America, National Association: Easton Avenue Branch, Livingston Avenue Branch, Golden Triangle Branch. Info updated 2009/11/18: Bank assets: $1,451,969.3 mil, Deposits: $1,077,176.8 mil, headquarters in Charlotte, NC, positive income , 5782 total offices , Holding Company: Bank Of America Corporation
Brunswick Bank and Trust Company: New Brunswick Branch at 352 George Street, branch established on 1902/03/17; Brunswick Bank And Trust Company at 439 Livingston Avenue, branch established on 1970/07/27. Info updated 2012/02/15: Bank assets: $140.0 mil, Deposits: $114.4 mil, local headquarters , negative income in the last year , Commercial Lending Specialization, 7 total offices , Holding Company: Brunswick Bancorp
Wells Fargo Bank, National Association: New Brunswick at 120 Albany Street Plaza, branch established on 1988/08/15; New Brunswick Drive-In at 150 Church Street, branch established on 1973/11/26. Info updated 2011/04/05: Bank assets: $1,161,490.0 mil, Deposits: $905,653.0 mil, headquarters in Sioux Falls, SD, positive income , 6395 total offices , Holding Company: Wells Fargo & Company
JPMorgan Chase Bank, National Association: New Brunswick Branch at 390 George Street, branch established on 2005/07/01; New Brunswick Branch at 133 Neilson Street, branch established on 1990/11/05. Info updated 2011/11/10: Bank assets: $1,811,678.0 mil, Deposits: $1,190,738.0 mil, headquarters in Columbus, OH, positive income , International Specialization, 5577 total offices , Holding Company: Jpmorgan Chase & Co.
PNC Bank, National Association: New Brunswick Branch at 1 Penn Plaza, branch established on 1984/05/07. Info updated 2012/03/20: Bank assets: $263,309.6 mil, Deposits: $197,343.0 mil, headquarters in Wilmington, DE, positive income , Commercial Lending Specialization, 3085 total offices , Holding Company: Pnc Financial Services Group, Inc., The
Magyar Bank: at 400 Somerset Street, branch established on 1922/01/01. Info updated 2012/02/10: Bank assets: $526.3 mil, Deposits: $429.5 mil, local headquarters , positive income , Commercial Lending Specialization, 6 total offices , Holding Company: Magyar Bancorp, Mhc
TD Bank, National Association: New Brunswick Branch at 70 Bayard Street, branch established on 2002/10/18. Info updated 2010/10/04: Bank assets: $188,912.6 mil, Deposits: $153,149.8 mil, headquarters in Wilmington, DE, positive income , 1314 total offices , Holding Company: Toronto-Dominion Bank, The
New Millennium Bank: at 57 Livingston Avenue, branch established on 1999/07/19. Info updated 2011/10/13: Bank assets: $212.1 mil, Deposits: $178.2 mil, local headquarters , negative income in the last year , Commercial Lending Specialization, 3 total offices
Amboy Bank: New Brunswick Branch at 350 George Street, branch established on 2005/11/21. Info updated 2010/06/02: Bank assets: $2,329.0 mil, Deposits: $1,766.2 mil, headquarters in Old Bridge, NJ, positive income , Commercial Lending Specialization, 23 total offices , Holding Company: Amboy Bancorporation
For population 15 years and over in New Brunswick:
Never married: 65.4%Now married: 24.7%Separated: 2.3%Widowed: 2.3%Divorced: 5.4% For population 25 years and over in New Brunswick:
High school or higher: 66.7%Bachelor's degree or higher: 24.3%Graduate or professional degree: 10.9%Unemployed: 10.6%Mean travel time to work (commute): 21.7 minutes
Education Gini index (Inequality in education) Here:
22.4New Jersey average:
12.8
Religion statistics for New Brunswick, NJ (based on Middlesex County data)
Religion Adherents Congregations Catholic 322,340 74 Other 48,717 73 Mainline Protestant 35,693 113 Evangelical Protestant 29,296 130 Orthodox 13,491 14 Black Protestant 5,879 17 None 354,442 -
Source: Clifford Grammich, Kirk Hadaway, Richard Houseal, Dale E.Jones, Alexei Krindatch, Richie Stanley and Richard H.Taylor. 2012. 2010 U.S.Religion Census: Religious Congregations & Membership Study. Association of Statisticians of American Religious Bodies. Jones, Dale E., et al. 2002. Congregations and Membership in the United States 2000. Nashville, TN: Glenmary Research Center. Graphs represent county-level data
Food Environment Statistics: Number of grocery stores : 221Here :
2.82 / 10,000 pop.New Jersey :
2.90 / 10,000 pop.
Number of supercenters and club stores : 4Here :
0.05 / 10,000 pop.New Jersey :
0.06 / 10,000 pop.
Number of convenience stores (no gas) : 172Middlesex County :
2.20 / 10,000 pop.State :
1.76 / 10,000 pop.
Number of convenience stores (with gas) : 69Here :
0.88 / 10,000 pop.State :
0.81 / 10,000 pop.
Number of full-service restaurants : 477This county :
6.09 / 10,000 pop.State :
7.15 / 10,000 pop.
Adult obesity rate : This county :
23.8%New Jersey :
23.3%
Low-income preschool obesity rate : Middlesex County :
18.2%State :
18.0%
Health and Nutrition: Healthy diet rate : New Brunswick:
46.3%State:
50.6%
Average overall health of teeth and gums : New Brunswick:
46.6%New Jersey:
48.5%
People feeling badly about themselves : New Brunswick:
18.8%New Jersey:
20.0%
People not drinking alcohol at all : New Brunswick:
11.4%New Jersey:
11.1%
Average hours sleeping at night : This city:
6.8New Jersey:
6.8
Overweight people : This city:
27.4%New Jersey:
33.6%
General health condition : New Brunswick:
56.6%New Jersey:
56.9%
Average condition of hearing : New Brunswick:
83.2%State:
80.0%
More about Health and Nutrition of New Brunswick, NJ Residents
Local government employment and payroll (March 2022)
Function
Full-time employees
Monthly full-time payroll
Average yearly full-time wage
Part-time employees
Monthly part-time payroll
Elementary and Secondary - Instruction
1,115 $8,565,353 $92,183 85 $192,981 Elementary and Secondary - Other Total
392 $1,790,716 $54,818 38 $81,485 Police Protection - Officers
137 $1,360,287 $119,149 0 $0 Firefighters
94 $794,293 $101,399 0 $0 Other and Unallocable
61 $272,020 $53,512 5 $5,226 Local Libraries
33 $124,981 $45,448 0 $0 Water Supply
33 $154,004 $56,001 0 $0 Judicial and Legal
29 $119,237 $49,339 0 $0 Housing and Community Development (Local)
28 $151,831 $65,070 1 $1,071 Parks and Recreation
27 $102,998 $45,777 2 $2,225 Solid Waste Management
23 $79,562 $41,511 0 $0 Streets and Highways
21 $98,064 $56,037 0 $0 Welfare
21 $87,068 $49,753 51 $87,843 Police - Other
19 $79,703 $50,339 33 $39,939 Financial Administration
11 $60,731 $66,252 0 $0 Other Government Administration
6 $41,463 $82,926 0 $0 Fire - Other
3 $14,269 $57,076 0 $0 Health
3 $12,641 $50,564 1 $450
Totals for Government
2,056 $13,909,219 $81,182 216 $411,221
New Brunswick government finances - Expenditure in 2021 (per resident):
Current Operations - Elementary and Secondary Education: $210,285,000 ($3755.22)
Police Protection: $19,471,000 ($347.71)Housing and Community Development: $16,568,000 ($295.87)Local Fire Protection: $11,299,000 ($201.78)Parking Facilities: $7,409,000 ($132.31)General - Other: $3,632,000 ($64.86)Solid Waste Management: $1,908,000 ($34.07)Central Staff Services: $1,721,000 ($30.73)Judicial and Legal Services: $1,451,000 ($25.91)Financial Administration: $1,194,000 ($21.32)Libraries: $1,116,000 ($19.93)Parks and Recreation: $545,000 ($9.73)Health - Other: $452,000 ($8.07)Protective Inspection and Regulation - Other: $447,000 ($7.98)General - Interest on Debt: $2,171,000 ($38.77)
Intergovernmental to Local - Other - Elementary and Secondary Education: $7,447,000 ($132.99)
Other - Parking Facilities: $4,975,000 ($88.84)Intergovernmental to State - Elementary and Secondary Education: $382,000 ($6.82)
Other Capital Outlay - Elementary and Secondary Education: $1,476,000 ($26.36)
Housing and Community Development: $108,000 ($1.93)Total Salaries and Wages: $104,236,000 ($1861.42)
New Brunswick government finances - Revenue in 2021 (per resident):
Charges - Parking Facilities: $23,488,000 ($419.44)
Housing and Community Development: $1,743,000 ($31.13)Elementary and Secondary Education School Lunch: $213,000 ($3.80)Elementary and Secondary Education - Other: $168,000 ($3.00)Federal Intergovernmental - Housing and Community Development: $15,990,000 ($285.55)
Local Intergovernmental - Education: $237,000 ($4.23)
Housing and Community Development: $77,000 ($1.38)Miscellaneous - General Revenue - Other: $9,361,000 ($167.17)
Interest Earnings: $433,000 ($7.73)Sale of Property: $28,000 ($0.50)Revenue - Water Utilities: $17,541,000 ($313.24)
State Intergovernmental - Education: $186,997,000 ($3339.35)
Other: $2,589,000 ($46.23)Highways: $569,000 ($10.16)Public Welfare: $322,000 ($5.75)Tax - Property: $85,519,000 ($1527.18)
Other License: $1,384,000 ($24.72)Alcoholic Beverage License: $87,000 ($1.55)
New Brunswick government finances - Debt in 2021 (per resident):
Long Term Debt - Beginning Outstanding - Unspecified Public Purpose: $549,922,000 ($9820.39)
Outstanding Unspecified Public Purpose: $392,910,000 ($7016.50)Retired Unspecified Public Purpose: $186,760,000 ($3335.12)Issue, Unspecified Public Purpose: $29,748,000 ($531.23)Beginning Outstanding - Public Debt for Private Purpose: $4,030,000 ($71.97)Retired Nonguaranteed - Public Debt for Private Purpose: $3,500,000 ($62.50)Outstanding Nonguaranteed - Industrial Revenue: $530,000 ($9.46)Short Term Debt Outstanding - Beginning: $18,125,000 ($323.67)
End of Fiscal Year: $18,125,000 ($323.67)
New Brunswick government finances - Cash and Securities in 2021 (per resident):
Other Funds - Cash and Securities: $65,421,000 ($1168.27)
Sinking Funds - Cash and Securities: $29,679,000 ($530.00)
6.75% of this county's 2021 resident taxpayers lived in other counties in 2020 ($80,605 average adjusted gross income )
Here:
6.75%New Jersey average:
6.70%
0.01% of residents moved from foreign countries ($55 average AGI )Middlesex County:
0.01%New Jersey average:
0.01%
Top counties from which taxpayers relocated into this county between 2020 and 2021:
7.27% of this county's 2020 resident taxpayers moved to other counties in 2021 ($94,247 average adjusted gross income )
Here:
7.27%New Jersey average:
7.02%
0.02% of residents moved to foreign countries ($103 average AGI )Middlesex County:
0.02%New Jersey average:
0.02%
Top counties to which taxpayers relocated from this county between 2020 and 2021:
Businesses in New Brunswick, NJ
Name Count Name Count
7-Eleven 1 Payless 1 AT&T 1 Qdoba Mexican Grill 1 AutoZone 1 RadioShack 1 Baskin-Robbins 1 Rite Aid 1 Burger King 1 Ryder Rental & Truck Leasing 1 Chipotle 1 Sears 3 Cold Stone Creamery 1 Sprint Nextel 1 Dunkin Donuts 4 Starbucks 1 FedEx 9 Subway 4 GNC 1 Taco Bell 1 H&R Block 2 Toys"R"Us 1 Houlihan's 1 U-Haul 1 Hyatt 1 UPS 12 Jimmy John's 1 Walgreens 2 McDonald's 1 Wendy's 1 Nike 1 White Castle 1 On The Border 1
Strongest AM radio stations in New Brunswick:
WCTC (1450 AM; 1 kW; NEW BRUNSWICK, NJ; Owner: THE SENTINEL PUBLISHING CO.)
WMCA (570 AM; 50 kW; NEW YORK, NY; Owner: SALEM MEDIA OF NEW YORK, LLC)
WOR (710 AM; 50 kW; NEW YORK, NY; Owner: BUCKLEY BROADCASTING CORPORATION)
WINS (1010 AM; 50 kW; NEW YORK, NY; Owner: INFINITY BROADCASTING OPERATIONS, INC.)
WABC (770 AM; 50 kW; NEW YORK, NY; Owner: WABC-AM RADIO, INC.)
WEPN (1050 AM; 50 kW; NEW YORK, NY; Owner: NEW YORK AM RADIO, LLC)
WBBR (1130 AM; 50 kW; NEW YORK, NY; Owner: BLOOMBERG COMMUNICATIONS INC.)
WADO (1280 AM; 50 kW; NEW YORK, NY; Owner: WADO-AM LICENSE CORP.)
WWJZ (640 AM; 50 kW; MOUNT HOLLY, NJ; Owner: ABC, INC.)
WFAN (660 AM; 50 kW; NEW YORK, NY; Owner: INFINITY BROADCASTING OPERATIONS, INC.)
WLIB (1190 AM; 30 kW; NEW YORK, NY; Owner: ICBC BROADCAST HOLDINGS-NY, INC.)
WQEW (1560 AM; 50 kW; NEW YORK, NY; Owner: THE NEW YORK TIMES ELECTRONIC MEDIA COMPANY)
WCBS (880 AM; 50 kW; NEW YORK, NY; Owner: INFINITY BROADCASTING OPERATIONS, INC.)
Strongest FM radio stations in New Brunswick:
WMGQ (98.3 FM; NEW BRUNSWICK, NJ; Owner: THE SENTINEL PUBLISHING CO.)
WRSU-FM (88.7 FM; NEW BRUNSWICK, NJ; Owner: BD. OF GOVERNORS OF RUTGERS)
WAWZ (99.1 FM; ZAREPHATH, NJ; Owner: PILLAR OF FIRE)
WRKS (98.7 FM; NEW YORK, NY; Owner: EMMIS RADIO LICENSE CORP OF NEW YORK)
WKXW-FM (101.5 FM; TRENTON, NJ; Owner: MILLENNIUM CENTRAL NEW JERSEY LICENSE HOLDCO, LLC)
WNYC-FM (93.9 FM; NEW YORK, NY; Owner: WNYC RADIO)
WPAT-FM (93.1 FM; PATERSON, NJ; Owner: WPAT LICENSING, INC.)
WNEW (102.7 FM; NEW YORK, NY; Owner: INFINITY BROADCASTING OPERATIONS, INC.)
WNJT-FM (88.1 FM; TRENTON, NJ; Owner: NEW JERSEY PUBLIC BRD/CST AUTHORITY)
WQCD (101.9 FM; NEW YORK, NY; Owner: EMMIS RADIO LICENSE CORPORATION)
WKTU (103.5 FM; LAKE SUCCESS, NY; Owner: AMFM RADIO LICENSES, LLC)
WCAA (105.9 FM; NEWARK, NJ; Owner: WADO-AM LICENSE CORP. ("WADO"))
WBAI (99.5 FM; NEW YORK, NY; Owner: PACIFICA FOUNDATION, INC.)
WBLS (107.5 FM; NEW YORK, NY; Owner: ICBC BROADCAST HOLDINGS-NY, INC.)
WLTW (106.7 FM; NEW YORK, NY; Owner: AMFM NEW YORK LICENSES, LLC)
WQXR-FM (96.3 FM; NEW YORK, NY; Owner: THE NEW YORK TIMES ELECTRONIC MEDIA COMPANY)
WSKQ-FM (97.9 FM; NEW YORK, NY; Owner: WSKQ LICENSING, INC.)
WXRK (92.3 FM; NEW YORK, NY; Owner: INFINITY BROADCASTING OPERATIONS, INC.)
WPRB (103.3 FM; PRINCETON, NJ; Owner: PRINCETON BROADCASTING SERVICE, INC.)
WAXQ (104.3 FM; NEW YORK, NY; Owner: AMFM NEW YORK LICENSES, LLC)
TV broadcast stations around New Brunswick:
W36AS (Channel 36; NEW BRUNSWICK, NJ; Owner: DEEPAK VISWANATH)
WLBX-LP (Channel 22; CRANFORD, NJ; Owner: RENARD COMMUNICATIONS CORP.)
WCBS-TV (Channel 2; NEW YORK, NY; Owner: CBS BROADCASTING INC.)
WNYW (Channel 5; NEW YORK, NY; Owner: FOX TELEVISION STATIONS, INC.)
WABC-TV (Channel 7; NEW YORK, NY; Owner: AMERICAN BROADCASTING COMPANIES, INC)
WPIX (Channel 11; NEW YORK, NY; Owner: WPIX, INC.)
WWOR-TV (Channel 9; SECAUCUS, NJ; Owner: FOX TELEVISION STATIONS, INC.)
WPXN-TV (Channel 31; NEW YORK, NY; Owner: PAXSON COMMUNICATIONS LICENSE COMPANY, LLC)
WNJT (Channel 52; TRENTON, NJ; Owner: NEW JERSEY PUBLIC BROADCASTING AUTHORITY)
WNJB (Channel 58; NEW BRUNSWICK, NJ; Owner: NEW JERSEY PUBLIC BROADCASTING AUTHORITY)
WNBC (Channel 4; NEW YORK, NY; Owner: NATIONAL BROADCASTING COMPANY, INC.)
WNET (Channel 13; NEWARK, NJ; Owner: EDUCATIONAL BROADCASTING CORPORATION)
WXTV (Channel 41; PATERSON, NJ; Owner: WXTV LICENSE PARTNERSHIP, G.P.)
WPXO-LP (Channel 34; EAST ORANGE, NJ; Owner: PAXSON COMMUNICATIONS LPTV, INC.)
WNJU (Channel 47; LINDEN, NJ; Owner: WNJU LICENSE CORPORATION)
WFUT (Channel 68; NEWARK, NJ; Owner: UNIVISION NEW YORK LLC)
WNYE-TV (Channel 25; NEW YORK, NY; Owner: NEW YORK CITY BOARD OF EDUCATION)
WXNY-LP (Channel 32; NEW YORK, NY; Owner: ISLAND BROADCASTING COMPANY)
WKOB-LP (Channel 53; NEW YORK, NY; Owner: WKOB COMMUNICATIONS, INC.)
WEBR-CA (Channel 17; MANHATTAN, NY; Owner: K LICENSEE INC.)
WRNN-LP (Channel 57; NYACK, NY; Owner: LP NYACK LIMITED PARTNERSHIP)
WNJN (Channel 50; MONTCLAIR, NJ; Owner: NEW JERSEY PUBLIC B/CNG AUTHORITY)
W60AI (Channel 60; NEW YORK, NY; Owner: VENTANA TELEVISION, INC.)
WNXY-LP (Channel 26; NEW YORK, NY; Owner: ISLAND BROADCASTING COMPANY)
W54CZ (Channel 54; MORRISTOWN, NJ; Owner: WLNY-TV, INC.)
National Bridge Inventory (NBI) Statistics 55 Number of bridges1,263ft / 385m Total length $5,433,000 Total costs1,945,856 Total average daily traffic156,348 Total average daily truck traffic
New bridges - historical statistics
2 Before 1900 4 1920-1929 1 1930-1939 5 1950-1959 6 1960-1969 9 1970-1979 13 1980-1989 15 2000-2009
See full National Bridge Inventory statistics for New Brunswick, NJ
Home Mortgage Disclosure Act Aggregated Statistics For Year 2009(Based on 10 full tracts) A) FHA, FSA/RHS & VA B) Conventional C) Refinancings D) Home Improvement Loans E) Loans on Dwellings For 5+ Families F) Non-occupant Loans on G) Loans On Manufactured Number Average Value Number Average Value Number Average Value Number Average Value Number Average Value Number Average Value Number Average Value
LOANS ORIGINATED 71 $206,732 107 $205,271 242 $223,062 14 $66,071 7 $2,311,857 87 $222,621 1 $214,000 APPLICATIONS APPROVED, NOT ACCEPTED 3 $159,667 15 $210,000 30 $217,167 2 $25,500 0 $0 14 $260,286 0 $0 APPLICATIONS DENIED 21 $207,810 37 $200,919 168 $232,095 24 $58,583 0 $0 59 $214,983 1 $20,000 APPLICATIONS WITHDRAWN 6 $209,333 19 $253,000 114 $220,263 6 $57,667 1 $500,000 33 $225,455 0 $0 FILES CLOSED FOR INCOMPLETENESS 4 $245,750 11 $241,636 32 $215,031 2 $125,000 0 $0 6 $252,333 0 $0
Aggregated Statistics For Year 2008(Based on 10 full tracts) A) FHA, FSA/RHS & VA B) Conventional C) Refinancings D) Home Improvement Loans E) Loans on Dwellings For 5+ Families F) Non-occupant Loans on Number Average Value Number Average Value Number Average Value Number Average Value Number Average Value Number Average Value
LOANS ORIGINATED 37 $242,568 156 $242,500 260 $240,977 40 $97,200 10 $1,649,300 96 $298,271 APPLICATIONS APPROVED, NOT ACCEPTED 9 $241,778 29 $271,759 78 $216,846 19 $60,105 0 $0 26 $275,115 APPLICATIONS DENIED 13 $267,538 60 $288,233 264 $233,689 53 $62,434 1 $350,000 66 $264,242 APPLICATIONS WITHDRAWN 7 $251,714 26 $273,154 90 $232,033 5 $87,400 1 $471,000 23 $264,609 FILES CLOSED FOR INCOMPLETENESS 2 $298,000 6 $242,000 31 $255,194 3 $59,333 0 $0 9 $222,556
Aggregated Statistics For Year 2007(Based on 10 full tracts) A) FHA, FSA/RHS & VA B) Conventional C) Refinancings D) Home Improvement Loans E) Loans on Dwellings For 5+ Families F) Non-occupant Loans on G) Loans On Manufactured Number Average Value Number Average Value Number Average Value Number Average Value Number Average Value Number Average Value Number Average Value
LOANS ORIGINATED 26 $292,154 486 $206,601 456 $223,096 77 $90,403 8 $1,167,375 185 $275,378 0 $0 APPLICATIONS APPROVED, NOT ACCEPTED 5 $337,800 86 $235,512 118 $223,797 25 $76,120 3 $498,667 34 $250,147 0 $0 APPLICATIONS DENIED 6 $279,000 228 $249,544 420 $243,726 83 $90,048 1 $750,000 106 $253,698 2 $38,500 APPLICATIONS WITHDRAWN 8 $314,875 62 $210,194 167 $246,958 8 $55,125 1 $364,000 45 $257,956 0 $0 FILES CLOSED FOR INCOMPLETENESS 0 $0 19 $273,895 70 $289,700 1 $263,000 0 $0 13 $323,385 0 $0
Aggregated Statistics For Year 2006(Based on 10 full tracts) A) FHA, FSA/RHS & VA B) Conventional C) Refinancings D) Home Improvement Loans E) Loans on Dwellings For 5+ Families F) Non-occupant Loans on G) Loans On Manufactured Number Average Value Number Average Value Number Average Value Number Average Value Number Average Value Number Average Value Number Average Value
LOANS ORIGINATED 8 $213,000 782 $221,781 700 $215,270 86 $93,744 8 $674,875 288 $246,326 0 $0 APPLICATIONS APPROVED, NOT ACCEPTED 3 $255,667 148 $241,973 179 $203,955 19 $76,684 3 $750,000 45 $260,711 0 $0 APPLICATIONS DENIED 5 $241,400 284 $216,757 417 $224,957 95 $86,589 0 $0 114 $244,588 1 $47,000 APPLICATIONS WITHDRAWN 7 $179,000 152 $220,066 245 $233,090 12 $143,833 2 $65,000 65 $286,631 1 $30,000 FILES CLOSED FOR INCOMPLETENESS 1 $264,000 29 $283,931 89 $250,258 7 $77,143 0 $0 16 $314,375 0 $0
Aggregated Statistics For Year 2005(Based on 10 full tracts) A) FHA, FSA/RHS & VA B) Conventional C) Refinancings D) Home Improvement Loans E) Loans on Dwellings For 5+ Families F) Non-occupant Loans on G) Loans On Manufactured Number Average Value Number Average Value Number Average Value Number Average Value Number Average Value Number Average Value Number Average Value
LOANS ORIGINATED 40 $249,775 713 $205,547 734 $194,896 80 $97,812 12 $27,122,333 341 $227,622 0 $0 APPLICATIONS APPROVED, NOT ACCEPTED 2 $265,000 100 $243,160 113 $190,796 17 $73,235 0 $0 54 $251,500 0 $0 APPLICATIONS DENIED 10 $265,500 268 $236,246 377 $191,549 102 $90,990 1 $450,000 115 $231,713 3 $234,333 APPLICATIONS WITHDRAWN 5 $185,800 195 $228,103 262 $203,168 31 $105,355 3 $313,000 78 $268,346 0 $0 FILES CLOSED FOR INCOMPLETENESS 4 $264,250 43 $235,140 148 $200,439 4 $61,250 0 $0 9 $220,667 0 $0
Aggregated Statistics For Year 2004(Based on 10 full tracts) A) FHA, FSA/RHS & VA B) Conventional C) Refinancings D) Home Improvement Loans E) Loans on Dwellings For 5+ Families F) Non-occupant Loans on G) Loans On Manufactured Number Average Value Number Average Value Number Average Value Number Average Value Number Average Value Number Average Value Number Average Value
LOANS ORIGINATED 70 $206,943 538 $205,178 671 $174,793 83 $92,904 8 $1,620,250 339 $209,501 0 $0 APPLICATIONS APPROVED, NOT ACCEPTED 5 $276,400 82 $202,207 115 $172,687 24 $74,292 0 $0 55 $213,764 0 $0 APPLICATIONS DENIED 12 $229,917 112 $198,402 333 $164,574 80 $79,375 1 $255,000 92 $194,946 2 $132,500 APPLICATIONS WITHDRAWN 14 $193,000 93 $188,355 184 $167,652 23 $103,174 2 $248,000 60 $205,033 0 $0 FILES CLOSED FOR INCOMPLETENESS 6 $245,833 26 $191,269 51 $181,569 1 $28,000 0 $0 9 $179,667 0 $0
Aggregated Statistics For Year 2003(Based on 10 full tracts) A) FHA, FSA/RHS & VA B) Conventional C) Refinancings D) Home Improvement Loans E) Loans on Dwellings For 5+ Families F) Non-occupant Loans on Number Average Value Number Average Value Number Average Value Number Average Value Number Average Value Number Average Value
LOANS ORIGINATED 89 $186,854 467 $181,107 1,026 $154,086 36 $46,472 15 $1,182,067 514 $175,053 APPLICATIONS APPROVED, NOT ACCEPTED 7 $212,857 80 $185,825 197 $137,716 25 $32,680 2 $395,000 59 $180,627 APPLICATIONS DENIED 14 $169,429 120 $177,908 405 $129,267 76 $34,092 1 $2,000,000 97 $152,206 APPLICATIONS WITHDRAWN 15 $154,933 89 $183,584 267 $145,015 17 $47,000 0 $0 80 $167,100 FILES CLOSED FOR INCOMPLETENESS 2 $189,000 5 $170,800 56 $140,482 0 $0 0 $0 18 $145,167
Aggregated Statistics For Year 2002(Based on 10 full tracts) A) FHA, FSA/RHS & VA B) Conventional C) Refinancings D) Home Improvement Loans E) Loans on Dwellings For 5+ Families F) Non-occupant Loans on Number Average Value Number Average Value Number Average Value Number Average Value Number Average Value Number Average Value
LOANS ORIGINATED 106 $261,198 378 $805,384 686 $451,041 70 $25,014 6 $541,000 366 $854,393 APPLICATIONS APPROVED, NOT ACCEPTED 19 $157,158 65 $141,323 134 $131,948 42 $32,643 1 $368,000 52 $152,712 APPLICATIONS DENIED 16 $124,750 85 $123,376 323 $107,759 65 $28,354 2 $441,000 94 $136,351 APPLICATIONS WITHDRAWN 7 $151,857 49 $159,653 202 $114,282 12 $34,417 1 $319,000 43 $142,302 FILES CLOSED FOR INCOMPLETENESS 2 $169,500 12 $152,500 46 $131,435 0 $0 0 $0 13 $173,308
Aggregated Statistics For Year 2001(Based on 10 full tracts) A) FHA, FSA/RHS & VA B) Conventional C) Refinancings D) Home Improvement Loans E) Loans on Dwellings For 5+ Families F) Non-occupant Loans on Number Average Value Number Average Value Number Average Value Number Average Value Number Average Value Number Average Value
LOANS ORIGINATED 129 $134,899 312 $127,622 461 $123,169 45 $19,911 7 $574,286 259 $130,988 APPLICATIONS APPROVED, NOT ACCEPTED 22 $131,364 48 $121,312 88 $106,023 20 $24,550 0 $0 37 $120,784 APPLICATIONS DENIED 19 $149,211 77 $123,974 244 $105,475 110 $25,073 1 $144,000 58 $110,259 APPLICATIONS WITHDRAWN 35 $137,800 49 $121,612 117 $102,274 18 $22,944 0 $0 31 $141,613 FILES CLOSED FOR INCOMPLETENESS 7 $99,000 10 $131,300 50 $103,900 1 $100,000 0 $0 9 $93,556
Aggregated Statistics For Year 2000(Based on 10 full tracts) A) FHA, FSA/RHS & VA B) Conventional C) Refinancings D) Home Improvement Loans E) Loans on Dwellings For 5+ Families F) Non-occupant Loans on Number Average Value Number Average Value Number Average Value Number Average Value Number Average Value Number Average Value
LOANS ORIGINATED 99 $115,505 257 $117,798 174 $98,385 48 $31,625 7 $847,714 156 $117,987 APPLICATIONS APPROVED, NOT ACCEPTED 12 $88,000 38 $122,737 73 $99,685 22 $26,727 0 $0 26 $119,731 APPLICATIONS DENIED 14 $113,429 99 $112,990 241 $82,589 80 $25,475 1 $400,000 69 $121,696 APPLICATIONS WITHDRAWN 16 $137,562 40 $109,100 95 $81,600 9 $29,667 0 $0 21 $117,810 FILES CLOSED FOR INCOMPLETENESS 2 $81,500 15 $112,267 48 $107,771 3 $22,667 0 $0 8 $120,000
Aggregated Statistics For Year 1999(Based on 9 full and 1 partial tracts) A) FHA, FSA/RHS & VA B) Conventional C) Refinancings D) Home Improvement Loans E) Loans on Dwellings For 5+ Families F) Non-occupant Loans on Number Average Value Number Average Value Number Average Value Number Average Value Number Average Value Number Average Value
LOANS ORIGINATED 94 $107,649 244 $119,051 303 $94,047 47 $28,131 5 $2,572,138 179 $110,988 APPLICATIONS APPROVED, NOT ACCEPTED 5 $138,760 37 $98,931 106 $87,818 29 $26,234 0 $0 31 $111,263 APPLICATIONS DENIED 7 $107,329 55 $105,815 219 $102,731 58 $24,727 0 $0 62 $88,447 APPLICATIONS WITHDRAWN 18 $102,821 48 $105,785 127 $81,354 9 $33,916 0 $0 30 $95,359 FILES CLOSED FOR INCOMPLETENESS 3 $114,120 6 $85,135 45 $88,926 2 $12,290 0 $0 8 $89,071
Detailed mortgage data for all 10 tracts in New Brunswick, NJ
Private Mortgage Insurance Companies Aggregated Statistics For Year 2009(Based on 9 full tracts) A) Conventional B) Refinancings C) Non-occupant Loans on Number Average Value Number Average Value Number Average Value
LOANS ORIGINATED 7 $209,571 2 $217,500 0 $0 APPLICATIONS APPROVED, NOT ACCEPTED 10 $231,600 5 $275,800 1 $245,000 APPLICATIONS DENIED 4 $225,000 1 $255,000 0 $0 APPLICATIONS WITHDRAWN 2 $239,500 0 $0 0 $0 FILES CLOSED FOR INCOMPLETENESS 0 $0 0 $0 0 $0
Aggregated Statistics For Year 2008(Based on 10 full tracts) A) Conventional B) Refinancings C) Non-occupant Loans on Number Average Value Number Average Value Number Average Value
LOANS ORIGINATED 61 $250,016 28 $307,179 4 $299,750 APPLICATIONS APPROVED, NOT ACCEPTED 30 $271,333 24 $313,708 6 $293,667 APPLICATIONS DENIED 25 $228,480 2 $252,500 7 $271,857 APPLICATIONS WITHDRAWN 7 $210,857 3 $290,333 0 $0 FILES CLOSED FOR INCOMPLETENESS 2 $287,000 2 $282,500 2 $290,500
Aggregated Statistics For Year 2007(Based on 9 full tracts) A) Conventional B) Refinancings C) Non-occupant Loans on Number Average Value Number Average Value Number Average Value
LOANS ORIGINATED 144 $222,285 40 $275,725 15 $266,867 APPLICATIONS APPROVED, NOT ACCEPTED 24 $214,000 13 $272,231 2 $346,000 APPLICATIONS DENIED 7 $210,714 1 $395,000 0 $0 APPLICATIONS WITHDRAWN 7 $203,571 3 $280,333 1 $245,000 FILES CLOSED FOR INCOMPLETENESS 0 $0 0 $0 0 $0
Aggregated Statistics For Year 2006(Based on 10 full tracts) A) Conventional B) Refinancings C) Non-occupant Loans on Number Average Value Number Average Value Number Average Value
LOANS ORIGINATED 67 $272,791 26 $269,962 7 $239,143 APPLICATIONS APPROVED, NOT ACCEPTED 21 $310,905 5 $269,200 3 $314,333 APPLICATIONS DENIED 5 $297,800 3 $367,000 1 $429,000 APPLICATIONS WITHDRAWN 5 $197,600 6 $291,167 0 $0 FILES CLOSED FOR INCOMPLETENESS 0 $0 0 $0 0 $0
Aggregated Statistics For Year 2005(Based on 10 full tracts) A) Conventional B) Refinancings C) Non-occupant Loans on Number Average Value Number Average Value Number Average Value
LOANS ORIGINATED 103 $251,854 15 $233,733 18 $266,278 APPLICATIONS APPROVED, NOT ACCEPTED 26 $239,308 9 $226,333 6 $278,167 APPLICATIONS DENIED 7 $284,286 1 $325,000 4 $273,500 APPLICATIONS WITHDRAWN 15 $288,933 1 $161,000 5 $326,600 FILES CLOSED FOR INCOMPLETENESS 2 $158,500 0 $0 1 $133,000
Aggregated Statistics For Year 2004(Based on 10 full tracts) A) Conventional B) Refinancings C) Non-occupant Loans on Number Average Value Number Average Value Number Average Value
LOANS ORIGINATED 193 $220,694 19 $232,789 50 $229,760 APPLICATIONS APPROVED, NOT ACCEPTED 33 $210,212 11 $214,182 8 $225,500 APPLICATIONS DENIED 12 $280,500 0 $0 5 $317,800 APPLICATIONS WITHDRAWN 13 $206,077 3 $193,333 1 $275,000 FILES CLOSED FOR INCOMPLETENESS 1 $189,000 1 $130,000 1 $189,000
Aggregated Statistics For Year 2003(Based on 10 full tracts) A) Conventional B) Refinancings C) Non-occupant Loans on Number Average Value Number Average Value Number Average Value
LOANS ORIGINATED 190 $190,184 40 $171,150 62 $211,774 APPLICATIONS APPROVED, NOT ACCEPTED 61 $171,689 22 $158,227 13 $185,000 APPLICATIONS DENIED 11 $225,182 2 $210,500 5 $308,000 APPLICATIONS WITHDRAWN 6 $178,333 4 $125,750 3 $187,000 FILES CLOSED FOR INCOMPLETENESS 2 $182,000 2 $281,000 4 $231,500
Aggregated Statistics For Year 2002(Based on 10 full tracts) A) Conventional B) Refinancings C) Non-occupant Loans on Number Average Value Number Average Value Number Average Value
LOANS ORIGINATED 170 $168,018 21 $182,905 57 $183,877 APPLICATIONS APPROVED, NOT ACCEPTED 44 $180,614 27 $165,407 17 $190,353 APPLICATIONS DENIED 8 $228,000 1 $80,000 6 $246,167 APPLICATIONS WITHDRAWN 6 $159,333 3 $190,667 3 $195,333 FILES CLOSED FOR INCOMPLETENESS 1 $158,000 0 $0 1 $158,000
Aggregated Statistics For Year 2001(Based on 10 full tracts) A) Conventional B) Refinancings C) Non-occupant Loans on Number Average Value Number Average Value Number Average Value
LOANS ORIGINATED 162 $141,802 24 $136,208 63 $136,730 APPLICATIONS APPROVED, NOT ACCEPTED 25 $136,520 4 $128,250 12 $154,833 APPLICATIONS DENIED 6 $181,333 4 $177,750 5 $176,600 APPLICATIONS WITHDRAWN 2 $86,000 1 $72,000 0 $0 FILES CLOSED FOR INCOMPLETENESS 2 $102,000 3 $269,333 2 $181,000
Aggregated Statistics For Year 2000(Based on 10 full tracts) A) Conventional B) Refinancings C) Non-occupant Loans on Number Average Value Number Average Value Number Average Value
LOANS ORIGINATED 134 $123,306 8 $146,125 57 $125,561 APPLICATIONS APPROVED, NOT ACCEPTED 26 $123,846 3 $139,667 10 $135,400 APPLICATIONS DENIED 7 $118,143 4 $154,250 5 $163,400 APPLICATIONS WITHDRAWN 2 $138,500 1 $204,000 2 $183,000 FILES CLOSED FOR INCOMPLETENESS 0 $0 0 $0 0 $0
Aggregated Statistics For Year 1999(Based on 9 full and 1 partial tracts) A) Conventional B) Refinancings C) Non-occupant Loans on Number Average Value Number Average Value Number Average Value
LOANS ORIGINATED 105 $120,624 18 $122,526 40 $124,385 APPLICATIONS APPROVED, NOT ACCEPTED 13 $126,948 7 $113,854 7 $123,147 APPLICATIONS DENIED 7 $121,069 2 $111,595 5 $145,348 APPLICATIONS WITHDRAWN 2 $76,965 0 $0 2 $76,965 FILES CLOSED FOR INCOMPLETENESS 2 $147,305 1 $112,000 1 $223,490
Fire-safe hotels and motels in New Brunswick, New Jersey:
Howard Johnson Express Inn, 26 Rte One N, New Brunswick, New Jersey 08901 Phone: (732) 828-8000, Fax: (732) 220-0314
The Heldrich Hotel & Spa, 10 Livingston Ave, New Brunswick, New Jersey 08901 Phone: (732) 729-4670
MOTEL 6, 26 US HIGHWAY1, New brunswick, New Jersey 08901 Phone: (732) 828-8001, Fax: (732) 828-8005
All 3 fire-safe hotels and motels in New Brunswick, New Jersey
Most common first names in New Brunswick, NJ among deceased individuals Name Count Lived (average)
John 348 73.2 years Mary 339 80.0 years Joseph 240 71.8 years William 202 71.3 years James 173 68.3 years Elizabeth 165 80.5 years Anna 163 81.3 years Helen 150 79.4 years Frank 139 75.3 years George 136 72.6 years
Most common last names in New Brunswick, NJ among deceased individuals Last name Count Lived (average)
Smith 75 71.5 years Johnson 56 72.9 years Williams 47 70.8 years Brown 46 70.6 years Jackson 40 69.0 years Davis 39 72.2 years Jones 37 68.4 years Miller 36 73.1 years Horvath 34 78.0 years Thomas 34 70.1 years
New Brunswick compared to New Jersey state average:
Median household income below state average. Hispanic race population percentage above state average. Median age significantly below state average. Foreign-born population percentage above state average. Renting percentage above state average. Length of stay since moving in significantly above state average. Number of rooms per house below state average. Number of college students significantly above state average. New Brunswick on our top lists :
#3 on the list of "Top 101 cities with largest percentage of females in industries: administrative and support and waste management services (population 50,000+)"
#3 on the list of "Top 101 cities with largest percentage of females in occupations: material moving occupations (population 50,000+)"
#5 on the list of "Top 100 cities with youngest residents (pop. 50,000+)"
#6 on the list of "Top 100 cities with highest percentage of renters (pop. 50,000+)"
#6 on the list of "Top 101 cities where the highest percentage of females (15+ years) which never married (with at least 10,000 females in this group)"
#10 on the list of "Top 101 cities with the most local government spending on current operations of parking facilities per resident (population 10,000+)"
#10 on the list of "Top 101 cities where the highest percentage of males (15+ years) which never married (with at least 10,000 males in this group)"
#10 on the list of "Top 101 cities with largest percentage of males in industries: administrative and support and waste management services (population 50,000+)"
#11 on the list of "Top 101 cities with largest percentage of males in occupations: food preparation and serving related occupations (population 50,000+)"
#11 on the list of "Top 101 cities with largest percentage of females in industries: wholesale trade (population 50,000+)"
#12 on the list of "Top 101 cities with largest percentage of females in occupations: production occupations (population 50,000+)"
#13 on the list of "Top 101 cities with largest percentage of males in occupations: material moving occupations (population 50,000+)"
#14 on the list of "Top 101 cities with largest percentage of males in industries: wholesale trade (population 50,000+)"
#14 on the list of "Top 100 cities with highest percentage of college students (pop. 50,000+)"
#15 on the list of "Top 100 high-educated but low-earning cities (pop. 50,000+)"
#17 on the list of "Top 101 cities with largest percentage of males in industries: accommodation and food services (population 50,000+)"
#21 on the list of "Top 101 cities with largest percentage of males in occupations: building and grounds cleaning and maintenance occupations (population 50,000+)"
#21 on the list of "Top 101 cities with the highest percentage of single-parent households, population 50,000+"
#25 on the list of "Top 101 cities with the most residents born in Dominican Republic (population 500+)"
#28 on the list of "Top 100 cities with the largest percentage of males (pop. 50,000+)"
#63 (08901) on the list of "Top 101 zip codes with the most big companies in 2005 (at least 1000 employees)"
#15 on the list of "Top 101 counties with the most Orthodox adherents"
#17 on the list of "Top 101 counties with the lowest percentage of residents that keep firearms around their homes"
#24 on the list of "Top 101 counties with the lowest number of infant deaths per 1000 residents 2007-2013 (pop. 50,000+)"
#25 on the list of "Top 101 counties with the largest decrease in the number of infant deaths per 1000 residents 2000-2006 to 2007-2013 (pop. 50,000+)"
#29 on the list of "Top 101 counties with the most Catholic congregations"
Top Patent Applicants
Edmond J. Lavoie (20)
Masayori Inouye (18)
Kathryn E. Uhrich (16)
Jack A. Dejovin (13)
Richard H. Ebright (13)
Isabelle Jean Dejovin (12)
Ajit Parhi (11)
Janssen Pharmaceutica Nv (11)
Konstantinos Kanonakis (10)
Daniel Wainless (8)
Total of 437 patent applications in 2008-2024.


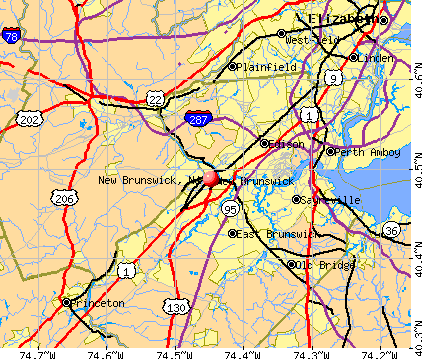


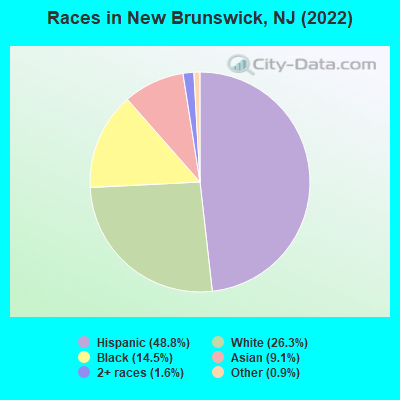
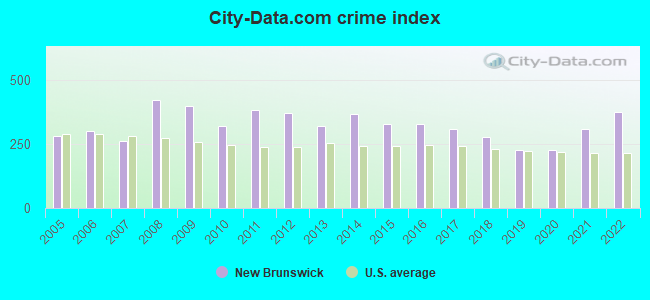
 Recent articles from our blog. Our writers, many of them Ph.D. graduates or candidates, create easy-to-read articles on a wide variety of topics.


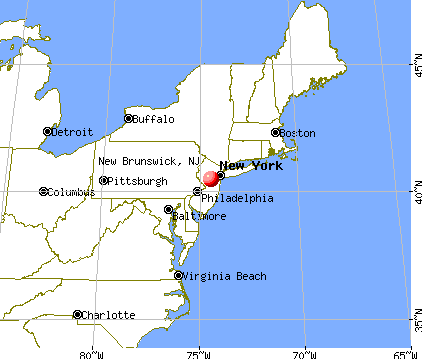
 (5.0 miles
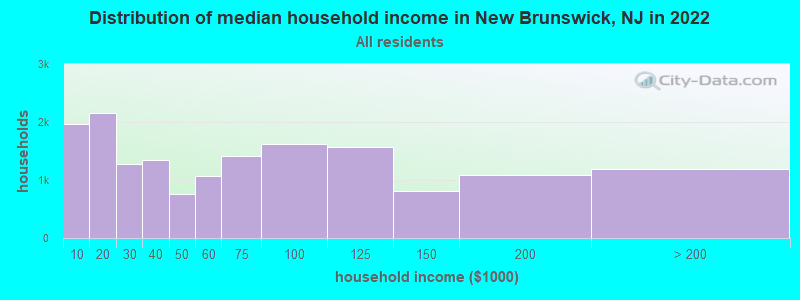
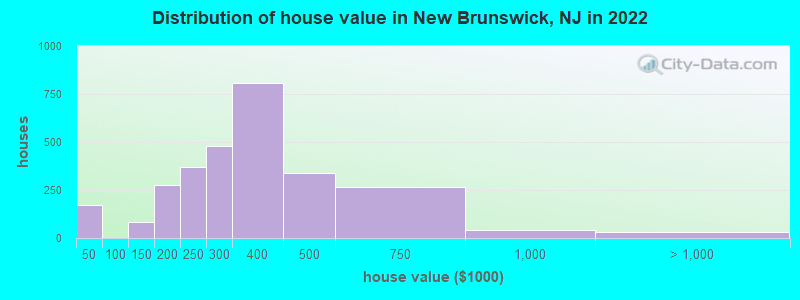
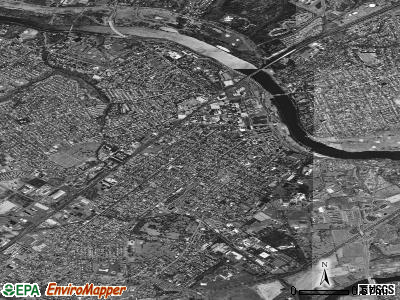
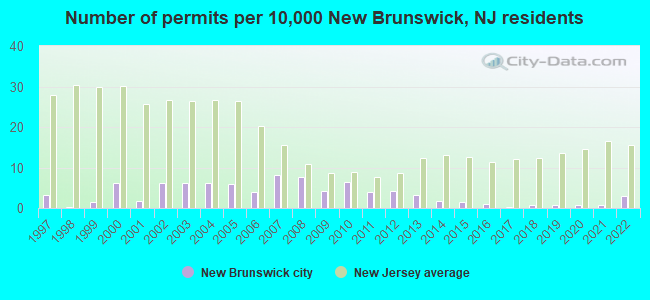
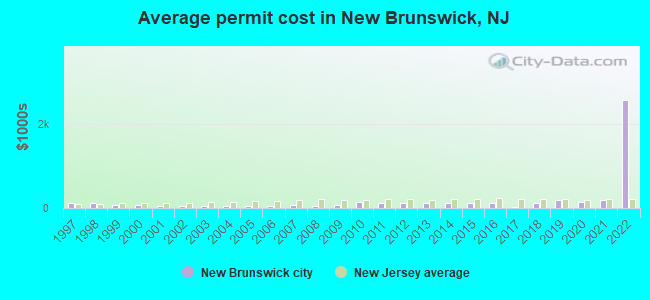
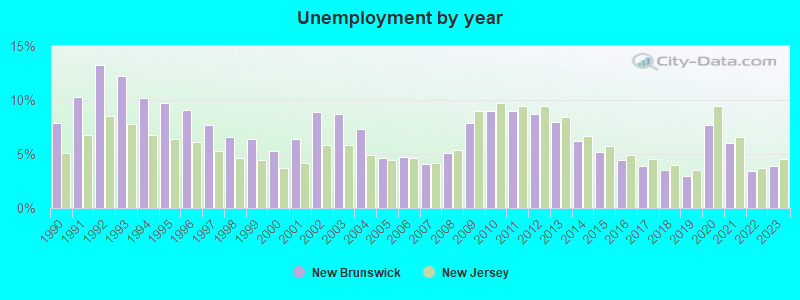
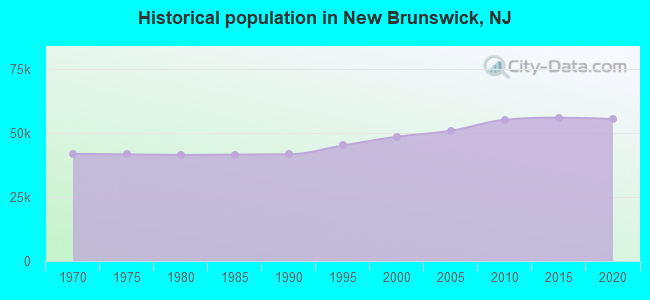
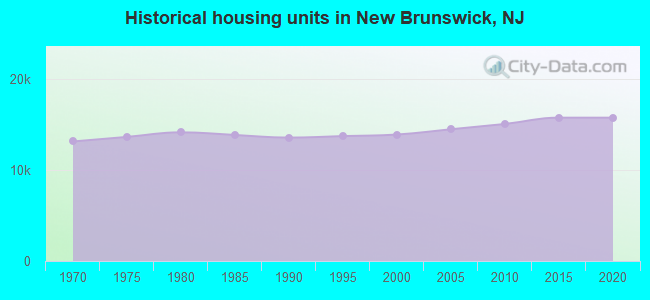
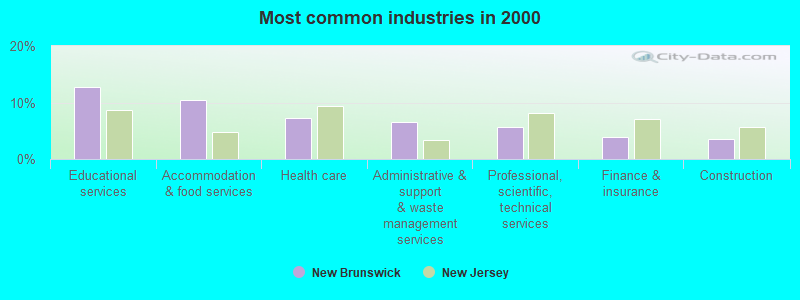
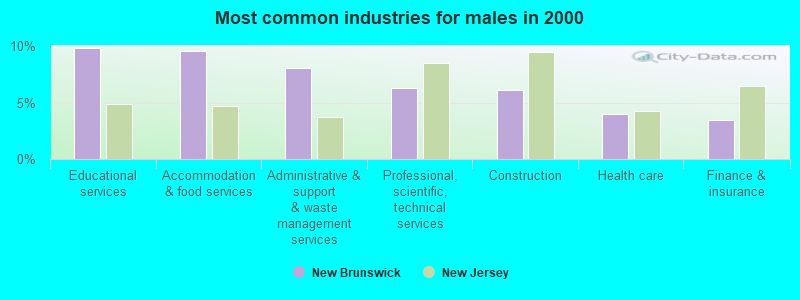
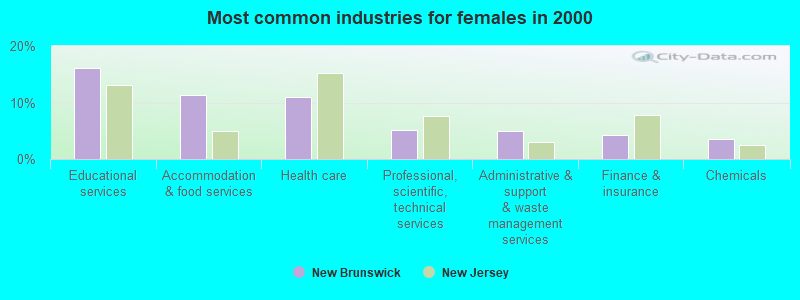
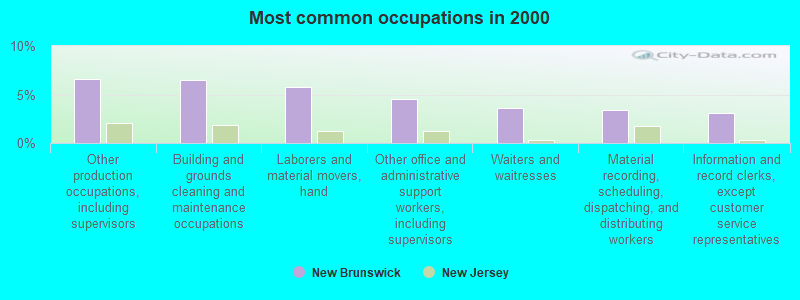
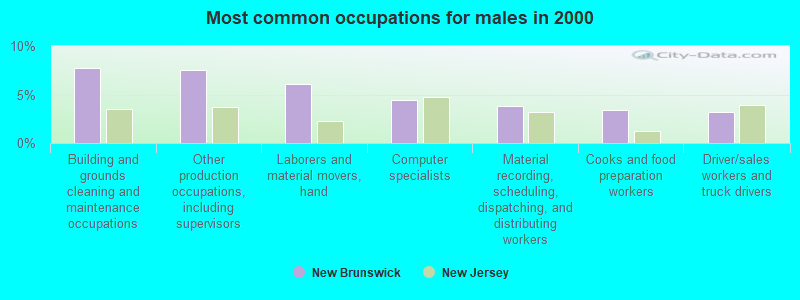
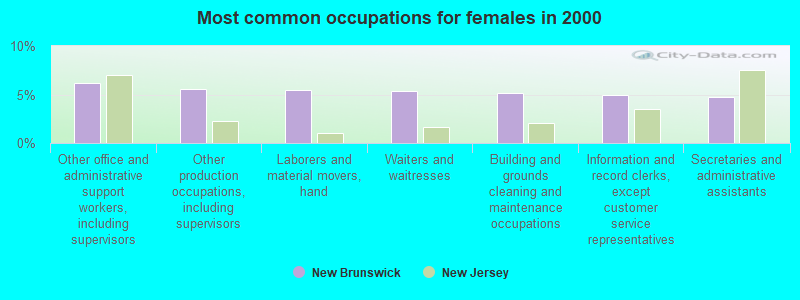
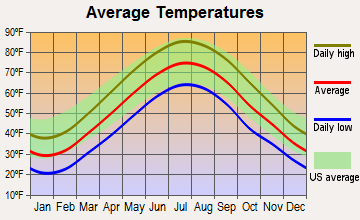
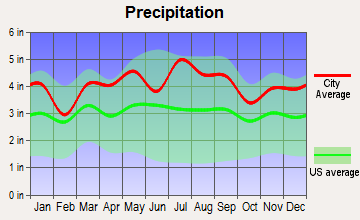
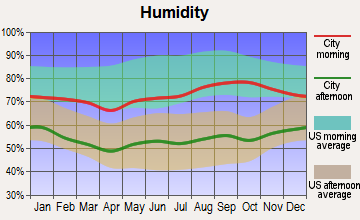
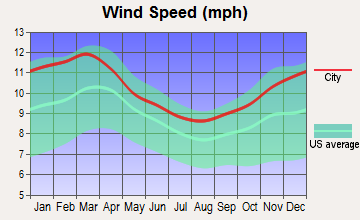
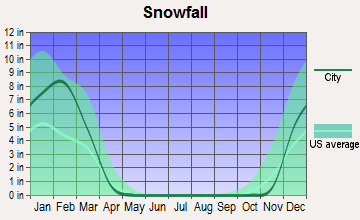
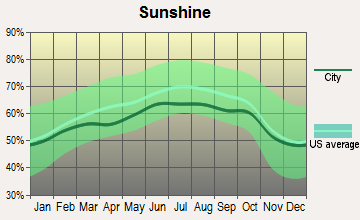
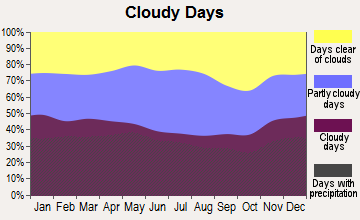
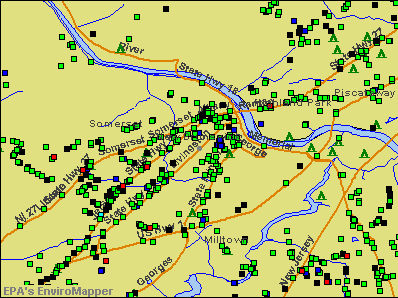

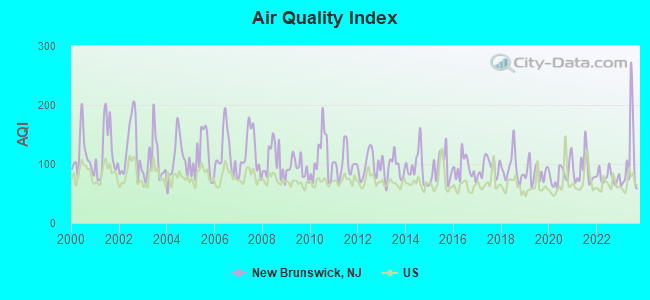
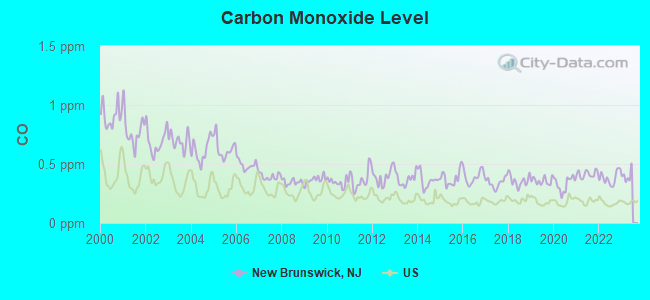
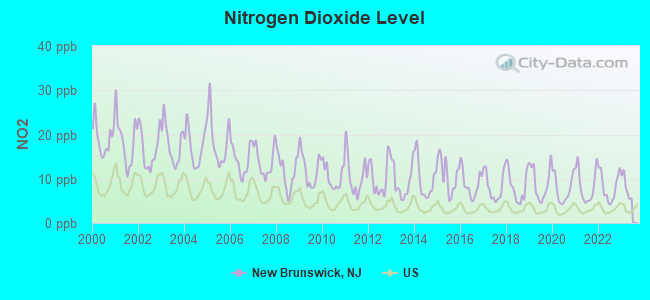
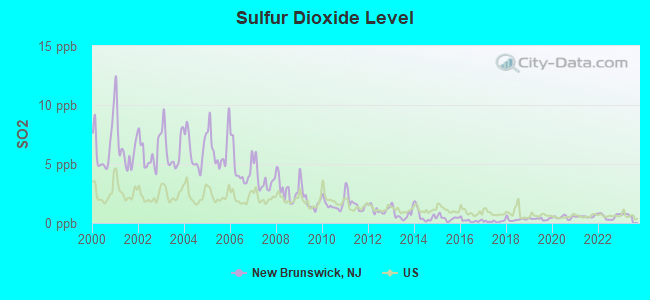
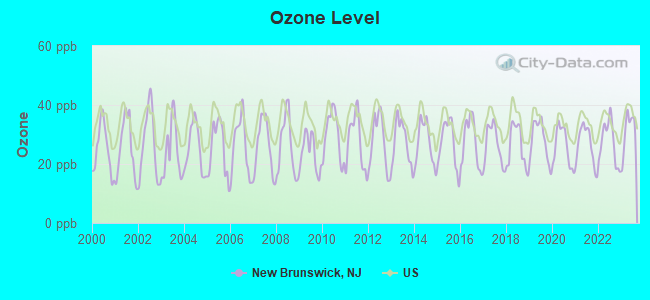
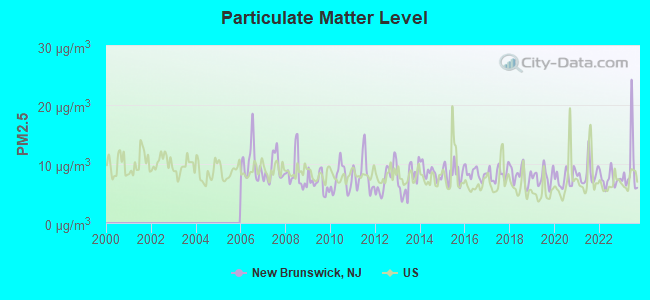
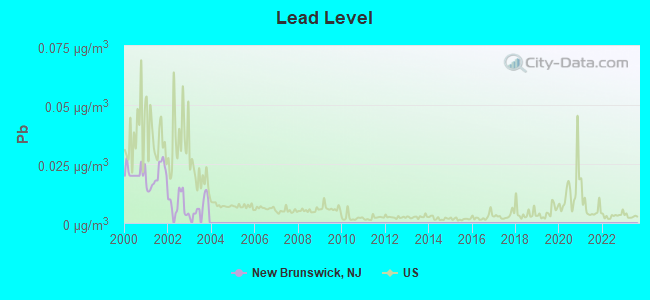
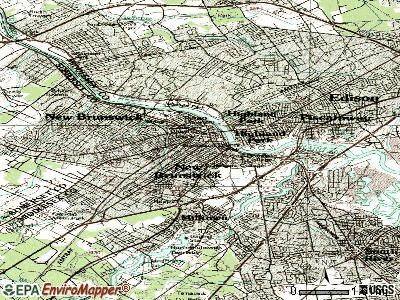
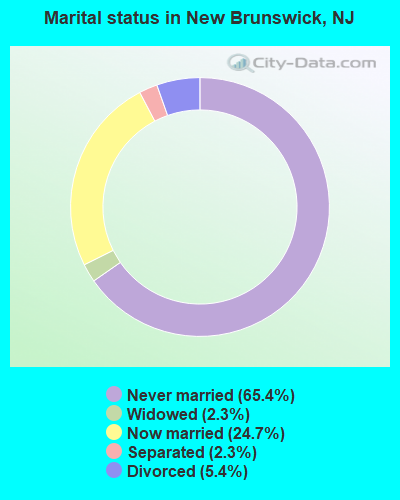
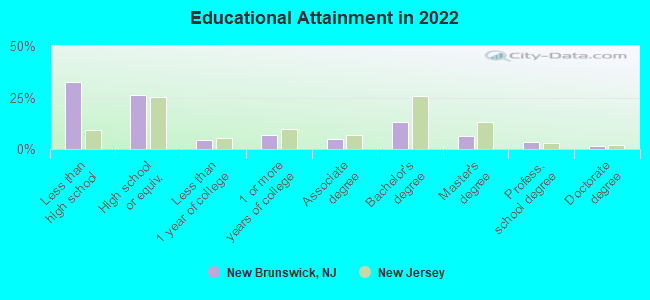
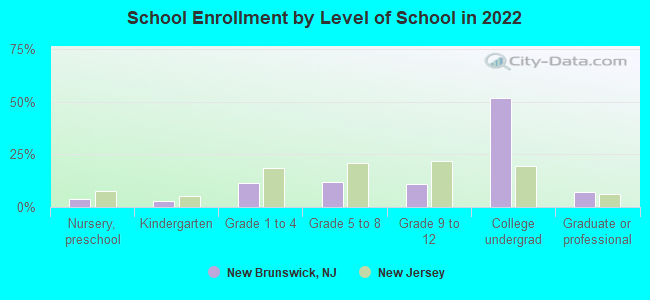
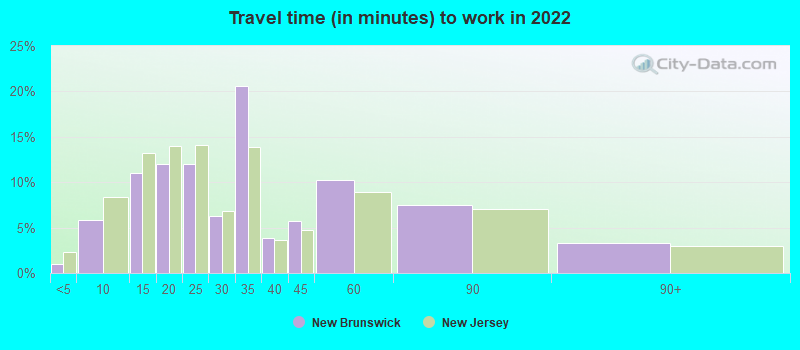
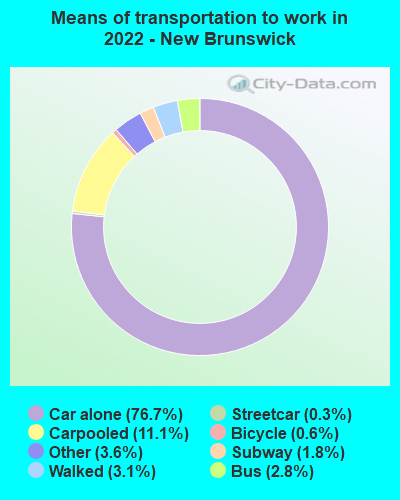
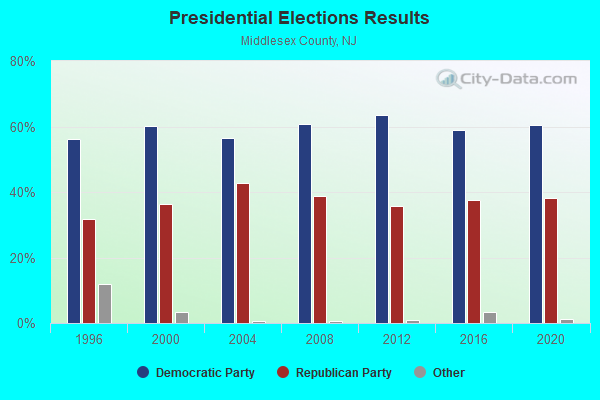
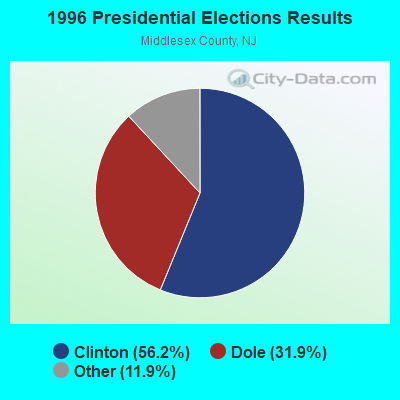
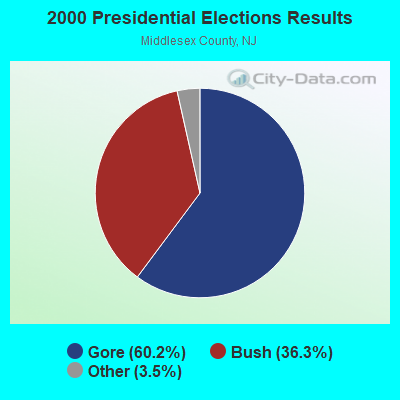
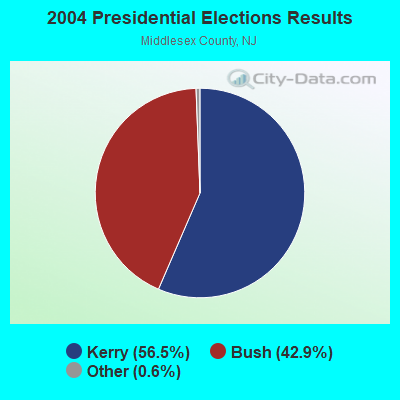
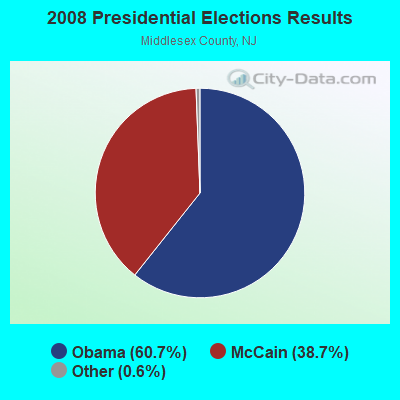
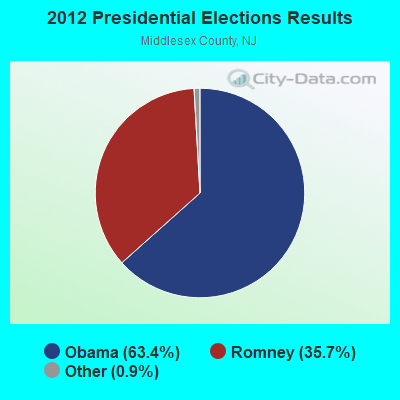
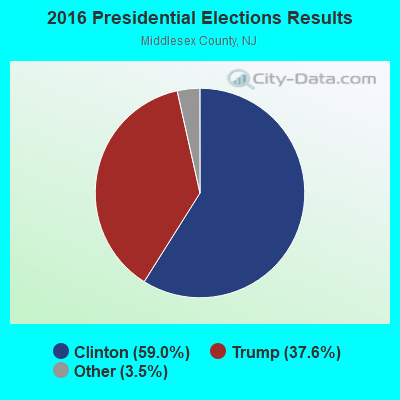
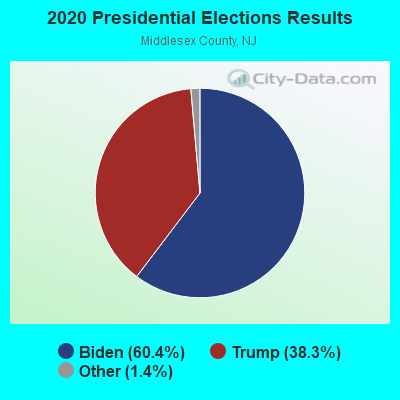
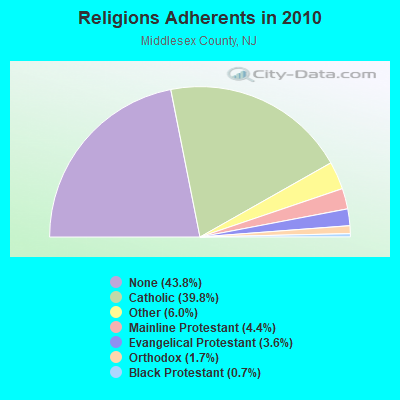
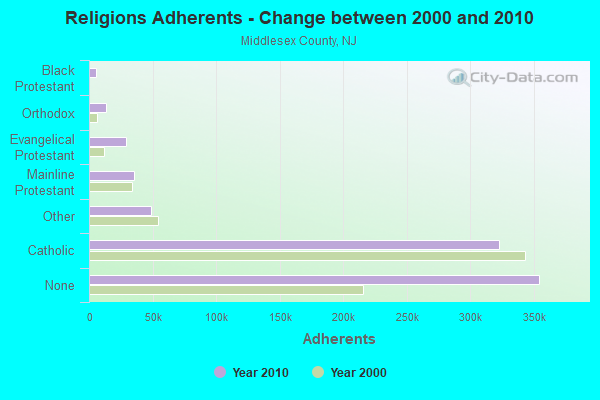
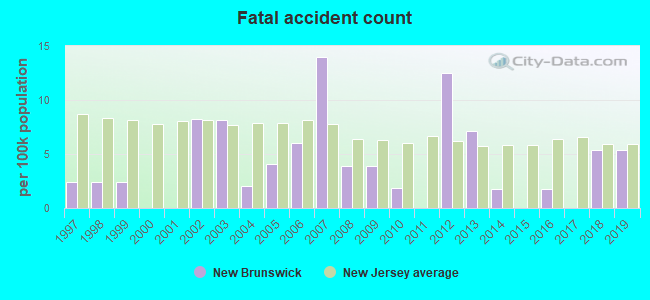
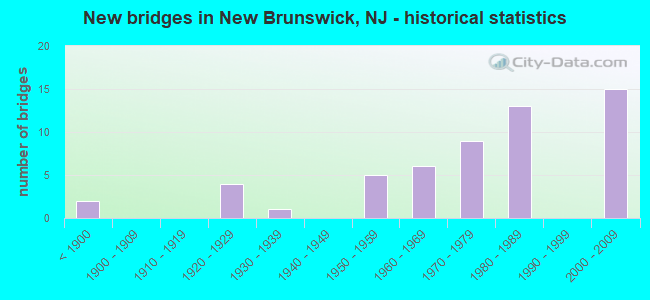
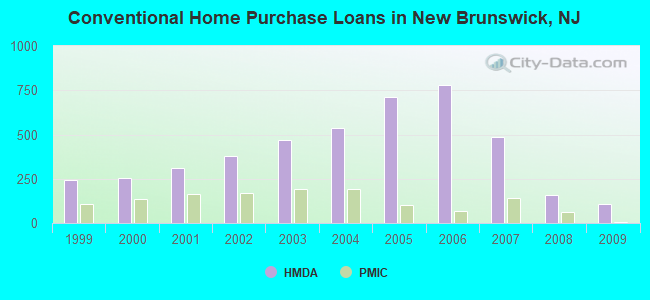
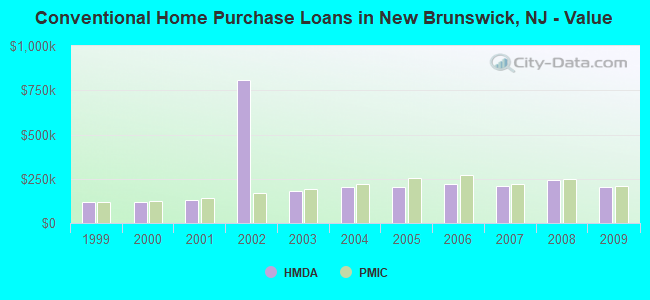
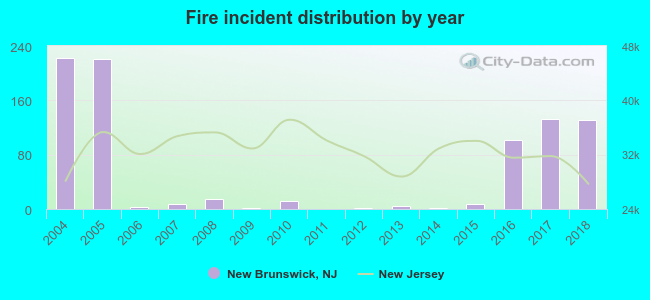 Based on the data from the years 2004 - 2018 the average number of fire incidents per year is 57. The highest number of fires - 222 took place in 2004, and the least - 0 in 2011. The data has a declining trend.
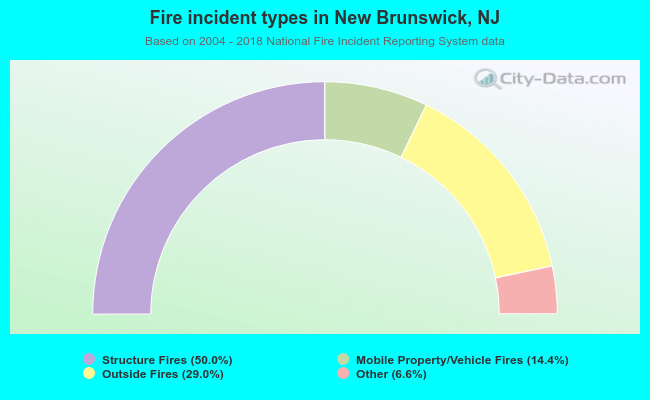 When looking into fire subcategories, the most reports belonged to: Structure Fires (50.0%), and Outside Fires (29.0%).