Troy, Ohio Submit your own pictures of this city and show them to the world
OSM Map
General Map
Google Map
MSN Map
OSM Map
General Map
Google Map
MSN Map
OSM Map
General Map
Google Map
MSN Map
OSM Map
General Map
Google Map
MSN Map
Please wait while loading the map...
Population in 2022: 26,679 (100% urban, 0% rural). Population change since 2000: +21.3%Males: 13,063 Females: 13,616
March 2022 cost of living index in Troy: 93.7 (less than average, U.S. average is 100) Percentage of residents living in poverty in 2022: 9.9%for White Non-Hispanic residents , 19.2% for Black residents , 7.0% for Hispanic or Latino residents , 20.7% for other race residents , 22.4% for two or more races residents )
Profiles of local businesses
Business Search - 14 Million verified businesses
Data:
Median household income ($)
Median household income (% change since 2000)
Household income diversity
Ratio of average income to average house value (%)
Ratio of average income to average rent
Median household income ($) - White
Median household income ($) - Black or African American
Median household income ($) - Asian
Median household income ($) - Hispanic or Latino
Median household income ($) - American Indian and Alaska Native
Median household income ($) - Multirace
Median household income ($) - Other Race
Median household income for houses/condos with a mortgage ($)
Median household income for apartments without a mortgage ($)
Races - White alone (%)
Races - White alone (% change since 2000)
Races - Black alone (%)
Races - Black alone (% change since 2000)
Races - American Indian alone (%)
Races - American Indian alone (% change since 2000)
Races - Asian alone (%)
Races - Asian alone (% change since 2000)
Races - Hispanic (%)
Races - Hispanic (% change since 2000)
Races - Native Hawaiian and Other Pacific Islander alone (%)
Races - Native Hawaiian and Other Pacific Islander alone (% change since 2000)
Races - Two or more races (%)
Races - Two or more races (% change since 2000)
Races - Other race alone (%)
Races - Other race alone (% change since 2000)
Racial diversity
Unemployment (%)
Unemployment (% change since 2000)
Unemployment (%) - White
Unemployment (%) - Black or African American
Unemployment (%) - Asian
Unemployment (%) - Hispanic or Latino
Unemployment (%) - American Indian and Alaska Native
Unemployment (%) - Multirace
Unemployment (%) - Other Race
Population density (people per square mile)
Population - Males (%)
Population - Females (%)
Population - Males (%) - White
Population - Males (%) - Black or African American
Population - Males (%) - Asian
Population - Males (%) - Hispanic or Latino
Population - Males (%) - American Indian and Alaska Native
Population - Males (%) - Multirace
Population - Males (%) - Other Race
Population - Females (%) - White
Population - Females (%) - Black or African American
Population - Females (%) - Asian
Population - Females (%) - Hispanic or Latino
Population - Females (%) - American Indian and Alaska Native
Population - Females (%) - Multirace
Population - Females (%) - Other Race
Coronavirus confirmed cases (May 05, 2024)
Deaths caused by coronavirus (May 05, 2024)
Coronavirus confirmed cases (per 100k population) (May 05, 2024)
Deaths caused by coronavirus (per 100k population) (May 05, 2024)
Daily increase in number of cases (May 05, 2024)
Weekly increase in number of cases (May 05, 2024)
Cases doubled (in days) (May 05, 2024)
Hospitalized patients (Apr 18, 2022)
Negative test results (Apr 18, 2022)
Total test results (Apr 18, 2022)
COVID Vaccine doses distributed (per 100k population) (Sep 19, 2023)
COVID Vaccine doses administered (per 100k population) (Sep 19, 2023)
COVID Vaccine doses distributed (Sep 19, 2023)
COVID Vaccine doses administered (Sep 19, 2023)
Likely homosexual households (%)
Likely homosexual households (% change since 2000)
Likely homosexual households - Lesbian couples (%)
Likely homosexual households - Lesbian couples (% change since 2000)
Likely homosexual households - Gay men (%)
Likely homosexual households - Gay men (% change since 2000)
Cost of living index
Median gross rent ($)
Median contract rent ($)
Median monthly housing costs ($)
Median house or condo value ($)
Median house or condo value ($ change since 2000)
Mean house or condo value by units in structure - 1, detached ($)
Mean house or condo value by units in structure - 1, attached ($)
Mean house or condo value by units in structure - 2 ($)
Mean house or condo value by units in structure by units in structure - 3 or 4 ($)
Mean house or condo value by units in structure - 5 or more ($)
Mean house or condo value by units in structure - Boat, RV, van, etc. ($)
Mean house or condo value by units in structure - Mobile home ($)
Median house or condo value ($) - White
Median house or condo value ($) - Black or African American
Median house or condo value ($) - Asian
Median house or condo value ($) - Hispanic or Latino
Median house or condo value ($) - American Indian and Alaska Native
Median house or condo value ($) - Multirace
Median house or condo value ($) - Other Race
Median resident age
Resident age diversity
Median resident age - Males
Median resident age - Females
Median resident age - White
Median resident age - Black or African American
Median resident age - Asian
Median resident age - Hispanic or Latino
Median resident age - American Indian and Alaska Native
Median resident age - Multirace
Median resident age - Other Race
Median resident age - Males - White
Median resident age - Males - Black or African American
Median resident age - Males - Asian
Median resident age - Males - Hispanic or Latino
Median resident age - Males - American Indian and Alaska Native
Median resident age - Males - Multirace
Median resident age - Males - Other Race
Median resident age - Females - White
Median resident age - Females - Black or African American
Median resident age - Females - Asian
Median resident age - Females - Hispanic or Latino
Median resident age - Females - American Indian and Alaska Native
Median resident age - Females - Multirace
Median resident age - Females - Other Race
Commute - mean travel time to work (minutes)
Travel time to work - Less than 5 minutes (%)
Travel time to work - Less than 5 minutes (% change since 2000)
Travel time to work - 5 to 9 minutes (%)
Travel time to work - 5 to 9 minutes (% change since 2000)
Travel time to work - 10 to 19 minutes (%)
Travel time to work - 10 to 19 minutes (% change since 2000)
Travel time to work - 20 to 29 minutes (%)
Travel time to work - 20 to 29 minutes (% change since 2000)
Travel time to work - 30 to 39 minutes (%)
Travel time to work - 30 to 39 minutes (% change since 2000)
Travel time to work - 40 to 59 minutes (%)
Travel time to work - 40 to 59 minutes (% change since 2000)
Travel time to work - 60 to 89 minutes (%)
Travel time to work - 60 to 89 minutes (% change since 2000)
Travel time to work - 90 or more minutes (%)
Travel time to work - 90 or more minutes (% change since 2000)
Marital status - Never married (%)
Marital status - Now married (%)
Marital status - Separated (%)
Marital status - Widowed (%)
Marital status - Divorced (%)
Median family income ($)
Median family income (% change since 2000)
Median non-family income ($)
Median non-family income (% change since 2000)
Median per capita income ($)
Median per capita income (% change since 2000)
Median family income ($) - White
Median family income ($) - Black or African American
Median family income ($) - Asian
Median family income ($) - Hispanic or Latino
Median family income ($) - American Indian and Alaska Native
Median family income ($) - Multirace
Median family income ($) - Other Race
Median year house/condo built
Median year apartment built
Year house built - Built 2005 or later (%)
Year house built - Built 2000 to 2004 (%)
Year house built - Built 1990 to 1999 (%)
Year house built - Built 1980 to 1989 (%)
Year house built - Built 1970 to 1979 (%)
Year house built - Built 1960 to 1969 (%)
Year house built - Built 1950 to 1959 (%)
Year house built - Built 1940 to 1949 (%)
Year house built - Built 1939 or earlier (%)
Average household size
Household density (households per square mile)
Average household size - White
Average household size - Black or African American
Average household size - Asian
Average household size - Hispanic or Latino
Average household size - American Indian and Alaska Native
Average household size - Multirace
Average household size - Other Race
Occupied housing units (%)
Vacant housing units (%)
Owner occupied housing units (%)
Renter occupied housing units (%)
Vacancy status - For rent (%)
Vacancy status - For sale only (%)
Vacancy status - Rented or sold, not occupied (%)
Vacancy status - For seasonal, recreational, or occasional use (%)
Vacancy status - For migrant workers (%)
Vacancy status - Other vacant (%)
Residents with income below the poverty level (%)
Residents with income below 50% of the poverty level (%)
Children below poverty level (%)
Poor families by family type - Married-couple family (%)
Poor families by family type - Male, no wife present (%)
Poor families by family type - Female, no husband present (%)
Poverty status for native-born residents (%)
Poverty status for foreign-born residents (%)
Poverty among high school graduates not in families (%)
Poverty among people who did not graduate high school not in families (%)
Residents with income below the poverty level (%) - White
Residents with income below the poverty level (%) - Black or African American
Residents with income below the poverty level (%) - Asian
Residents with income below the poverty level (%) - Hispanic or Latino
Residents with income below the poverty level (%) - American Indian and Alaska Native
Residents with income below the poverty level (%) - Multirace
Residents with income below the poverty level (%) - Other Race
Air pollution - Air Quality Index (AQI)
Air pollution - CO
Air pollution - NO2
Air pollution - SO2
Air pollution - Ozone
Air pollution - PM10
Air pollution - PM25
Air pollution - Pb
Crime - Murders per 100,000 population
Crime - Rapes per 100,000 population
Crime - Robberies per 100,000 population
Crime - Assaults per 100,000 population
Crime - Burglaries per 100,000 population
Crime - Thefts per 100,000 population
Crime - Auto thefts per 100,000 population
Crime - Arson per 100,000 population
Crime - City-data.com crime index
Crime - Violent crime index
Crime - Property crime index
Crime - Murders per 100,000 population (5 year average)
Crime - Rapes per 100,000 population (5 year average)
Crime - Robberies per 100,000 population (5 year average)
Crime - Assaults per 100,000 population (5 year average)
Crime - Burglaries per 100,000 population (5 year average)
Crime - Thefts per 100,000 population (5 year average)
Crime - Auto thefts per 100,000 population (5 year average)
Crime - Arson per 100,000 population (5 year average)
Crime - City-data.com crime index (5 year average)
Crime - Violent crime index (5 year average)
Crime - Property crime index (5 year average)
1996 Presidential Elections Results (%) - Democratic Party (Clinton)
1996 Presidential Elections Results (%) - Republican Party (Dole)
1996 Presidential Elections Results (%) - Other
2000 Presidential Elections Results (%) - Democratic Party (Gore)
2000 Presidential Elections Results (%) - Republican Party (Bush)
2000 Presidential Elections Results (%) - Other
2004 Presidential Elections Results (%) - Democratic Party (Kerry)
2004 Presidential Elections Results (%) - Republican Party (Bush)
2004 Presidential Elections Results (%) - Other
2008 Presidential Elections Results (%) - Democratic Party (Obama)
2008 Presidential Elections Results (%) - Republican Party (McCain)
2008 Presidential Elections Results (%) - Other
2012 Presidential Elections Results (%) - Democratic Party (Obama)
2012 Presidential Elections Results (%) - Republican Party (Romney)
2012 Presidential Elections Results (%) - Other
2016 Presidential Elections Results (%) - Democratic Party (Clinton)
2016 Presidential Elections Results (%) - Republican Party (Trump)
2016 Presidential Elections Results (%) - Other
2020 Presidential Elections Results (%) - Democratic Party (Biden)
2020 Presidential Elections Results (%) - Republican Party (Trump)
2020 Presidential Elections Results (%) - Other
Ancestries Reported - Arab (%)
Ancestries Reported - Czech (%)
Ancestries Reported - Danish (%)
Ancestries Reported - Dutch (%)
Ancestries Reported - English (%)
Ancestries Reported - French (%)
Ancestries Reported - French Canadian (%)
Ancestries Reported - German (%)
Ancestries Reported - Greek (%)
Ancestries Reported - Hungarian (%)
Ancestries Reported - Irish (%)
Ancestries Reported - Italian (%)
Ancestries Reported - Lithuanian (%)
Ancestries Reported - Norwegian (%)
Ancestries Reported - Polish (%)
Ancestries Reported - Portuguese (%)
Ancestries Reported - Russian (%)
Ancestries Reported - Scotch-Irish (%)
Ancestries Reported - Scottish (%)
Ancestries Reported - Slovak (%)
Ancestries Reported - Subsaharan African (%)
Ancestries Reported - Swedish (%)
Ancestries Reported - Swiss (%)
Ancestries Reported - Ukrainian (%)
Ancestries Reported - United States (%)
Ancestries Reported - Welsh (%)
Ancestries Reported - West Indian (%)
Ancestries Reported - Other (%)
Educational Attainment - No schooling completed (%)
Educational Attainment - Less than high school (%)
Educational Attainment - High school or equivalent (%)
Educational Attainment - Less than 1 year of college (%)
Educational Attainment - 1 or more years of college (%)
Educational Attainment - Associate degree (%)
Educational Attainment - Bachelor's degree (%)
Educational Attainment - Master's degree (%)
Educational Attainment - Professional school degree (%)
Educational Attainment - Doctorate degree (%)
School Enrollment - Nursery, preschool (%)
School Enrollment - Kindergarten (%)
School Enrollment - Grade 1 to 4 (%)
School Enrollment - Grade 5 to 8 (%)
School Enrollment - Grade 9 to 12 (%)
School Enrollment - College undergrad (%)
School Enrollment - Graduate or professional (%)
School Enrollment - Not enrolled in school (%)
School enrollment - Public schools (%)
School enrollment - Private schools (%)
School enrollment - Not enrolled (%)
Median number of rooms in houses and condos
Median number of rooms in apartments
Housing units lacking complete plumbing facilities (%)
Housing units lacking complete kitchen facilities (%)
Density of houses
Urban houses (%)
Rural houses (%)
Households with people 60 years and over (%)
Households with people 65 years and over (%)
Households with people 75 years and over (%)
Households with one or more nonrelatives (%)
Households with no nonrelatives (%)
Population in households (%)
Family households (%)
Nonfamily households (%)
Population in families (%)
Family households with own children (%)
Median number of bedrooms in owner occupied houses
Mean number of bedrooms in owner occupied houses
Median number of bedrooms in renter occupied houses
Mean number of bedrooms in renter occupied houses
Median number of vehichles in owner occupied houses
Mean number of vehichles in owner occupied houses
Median number of vehichles in renter occupied houses
Mean number of vehichles in renter occupied houses
Mortgage status - with mortgage (%)
Mortgage status - with second mortgage (%)
Mortgage status - with home equity loan (%)
Mortgage status - with both second mortgage and home equity loan (%)
Mortgage status - without a mortgage (%)
Average family size
Average family size - White
Average family size - Black or African American
Average family size - Asian
Average family size - Hispanic or Latino
Average family size - American Indian and Alaska Native
Average family size - Multirace
Average family size - Other Race
Geographical mobility - Same house 1 year ago (%)
Geographical mobility - Moved within same county (%)
Geographical mobility - Moved from different county within same state (%)
Geographical mobility - Moved from different state (%)
Geographical mobility - Moved from abroad (%)
Place of birth - Born in state of residence (%)
Place of birth - Born in other state (%)
Place of birth - Native, outside of US (%)
Place of birth - Foreign born (%)
Housing units in structures - 1, detached (%)
Housing units in structures - 1, attached (%)
Housing units in structures - 2 (%)
Housing units in structures - 3 or 4 (%)
Housing units in structures - 5 to 9 (%)
Housing units in structures - 10 to 19 (%)
Housing units in structures - 20 to 49 (%)
Housing units in structures - 50 or more (%)
Housing units in structures - Mobile home (%)
Housing units in structures - Boat, RV, van, etc. (%)
House/condo owner moved in on average (years ago)
Renter moved in on average (years ago)
Year householder moved into unit - Moved in 1999 to March 2000 (%)
Year householder moved into unit - Moved in 1995 to 1998 (%)
Year householder moved into unit - Moved in 1990 to 1994 (%)
Year householder moved into unit - Moved in 1980 to 1989 (%)
Year householder moved into unit - Moved in 1970 to 1979 (%)
Year householder moved into unit - Moved in 1969 or earlier (%)
Means of transportation to work - Drove car alone (%)
Means of transportation to work - Carpooled (%)
Means of transportation to work - Public transportation (%)
Means of transportation to work - Bus or trolley bus (%)
Means of transportation to work - Streetcar or trolley car (%)
Means of transportation to work - Subway or elevated (%)
Means of transportation to work - Railroad (%)
Means of transportation to work - Ferryboat (%)
Means of transportation to work - Taxicab (%)
Means of transportation to work - Motorcycle (%)
Means of transportation to work - Bicycle (%)
Means of transportation to work - Walked (%)
Means of transportation to work - Other means (%)
Working at home (%)
Industry diversity
Most Common Industries - Agriculture, forestry, fishing and hunting, and mining (%)
Most Common Industries - Agriculture, forestry, fishing and hunting (%)
Most Common Industries - Mining, quarrying, and oil and gas extraction (%)
Most Common Industries - Construction (%)
Most Common Industries - Manufacturing (%)
Most Common Industries - Wholesale trade (%)
Most Common Industries - Retail trade (%)
Most Common Industries - Transportation and warehousing, and utilities (%)
Most Common Industries - Transportation and warehousing (%)
Most Common Industries - Utilities (%)
Most Common Industries - Information (%)
Most Common Industries - Finance and insurance, and real estate and rental and leasing (%)
Most Common Industries - Finance and insurance (%)
Most Common Industries - Real estate and rental and leasing (%)
Most Common Industries - Professional, scientific, and management, and administrative and waste management services (%)
Most Common Industries - Professional, scientific, and technical services (%)
Most Common Industries - Management of companies and enterprises (%)
Most Common Industries - Administrative and support and waste management services (%)
Most Common Industries - Educational services, and health care and social assistance (%)
Most Common Industries - Educational services (%)
Most Common Industries - Health care and social assistance (%)
Most Common Industries - Arts, entertainment, and recreation, and accommodation and food services (%)
Most Common Industries - Arts, entertainment, and recreation (%)
Most Common Industries - Accommodation and food services (%)
Most Common Industries - Other services, except public administration (%)
Most Common Industries - Public administration (%)
Occupation diversity
Most Common Occupations - Management, business, science, and arts occupations (%)
Most Common Occupations - Management, business, and financial occupations (%)
Most Common Occupations - Management occupations (%)
Most Common Occupations - Business and financial operations occupations (%)
Most Common Occupations - Computer, engineering, and science occupations (%)
Most Common Occupations - Computer and mathematical occupations (%)
Most Common Occupations - Architecture and engineering occupations (%)
Most Common Occupations - Life, physical, and social science occupations (%)
Most Common Occupations - Education, legal, community service, arts, and media occupations (%)
Most Common Occupations - Community and social service occupations (%)
Most Common Occupations - Legal occupations (%)
Most Common Occupations - Education, training, and library occupations (%)
Most Common Occupations - Arts, design, entertainment, sports, and media occupations (%)
Most Common Occupations - Healthcare practitioners and technical occupations (%)
Most Common Occupations - Health diagnosing and treating practitioners and other technical occupations (%)
Most Common Occupations - Health technologists and technicians (%)
Most Common Occupations - Service occupations (%)
Most Common Occupations - Healthcare support occupations (%)
Most Common Occupations - Protective service occupations (%)
Most Common Occupations - Fire fighting and prevention, and other protective service workers including supervisors (%)
Most Common Occupations - Law enforcement workers including supervisors (%)
Most Common Occupations - Food preparation and serving related occupations (%)
Most Common Occupations - Building and grounds cleaning and maintenance occupations (%)
Most Common Occupations - Personal care and service occupations (%)
Most Common Occupations - Sales and office occupations (%)
Most Common Occupations - Sales and related occupations (%)
Most Common Occupations - Office and administrative support occupations (%)
Most Common Occupations - Natural resources, construction, and maintenance occupations (%)
Most Common Occupations - Farming, fishing, and forestry occupations (%)
Most Common Occupations - Construction and extraction occupations (%)
Most Common Occupations - Installation, maintenance, and repair occupations (%)
Most Common Occupations - Production, transportation, and material moving occupations (%)
Most Common Occupations - Production occupations (%)
Most Common Occupations - Transportation occupations (%)
Most Common Occupations - Material moving occupations (%)
People in Group quarters - Institutionalized population (%)
People in Group quarters - Correctional institutions (%)
People in Group quarters - Federal prisons and detention centers (%)
People in Group quarters - Halfway houses (%)
People in Group quarters - Local jails and other confinement facilities (including police lockups) (%)
People in Group quarters - Military disciplinary barracks (%)
People in Group quarters - State prisons (%)
People in Group quarters - Other types of correctional institutions (%)
People in Group quarters - Nursing homes (%)
People in Group quarters - Hospitals/wards, hospices, and schools for the handicapped (%)
People in Group quarters - Hospitals/wards and hospices for chronically ill (%)
People in Group quarters - Hospices or homes for chronically ill (%)
People in Group quarters - Military hospitals or wards for chronically ill (%)
People in Group quarters - Other hospitals or wards for chronically ill (%)
People in Group quarters - Hospitals or wards for drug/alcohol abuse (%)
People in Group quarters - Mental (Psychiatric) hospitals or wards (%)
People in Group quarters - Schools, hospitals, or wards for the mentally retarded (%)
People in Group quarters - Schools, hospitals, or wards for the physically handicapped (%)
People in Group quarters - Institutions for the deaf (%)
People in Group quarters - Institutions for the blind (%)
People in Group quarters - Orthopedic wards and institutions for the physically handicapped (%)
People in Group quarters - Wards in general hospitals for patients who have no usual home elsewhere (%)
People in Group quarters - Wards in military hospitals for patients who have no usual home elsewhere (%)
People in Group quarters - Juvenile institutions (%)
People in Group quarters - Long-term care (%)
People in Group quarters - Homes for abused, dependent, and neglected children (%)
People in Group quarters - Residential treatment centers for emotionally disturbed children (%)
People in Group quarters - Training schools for juvenile delinquents (%)
People in Group quarters - Short-term care, detention or diagnostic centers for delinquent children (%)
People in Group quarters - Type of juvenile institution unknown (%)
People in Group quarters - Noninstitutionalized population (%)
People in Group quarters - College dormitories (includes college quarters off campus) (%)
People in Group quarters - Military quarters (%)
People in Group quarters - On base (%)
People in Group quarters - Barracks, unaccompanied personnel housing (UPH), (Enlisted/Officer), ;and similar group living quarters for military personnel (%)
People in Group quarters - Transient quarters for temporary residents (%)
People in Group quarters - Military ships (%)
People in Group quarters - Group homes (%)
People in Group quarters - Homes or halfway houses for drug/alcohol abuse (%)
People in Group quarters - Homes for the mentally ill (%)
People in Group quarters - Homes for the mentally retarded (%)
People in Group quarters - Homes for the physically handicapped (%)
People in Group quarters - Other group homes (%)
People in Group quarters - Religious group quarters (%)
People in Group quarters - Dormitories (%)
People in Group quarters - Agriculture workers' dormitories on farms (%)
People in Group quarters - Job Corps and vocational training facilities (%)
People in Group quarters - Other workers' dormitories (%)
People in Group quarters - Crews of maritime vessels (%)
People in Group quarters - Other nonhousehold living situations (%)
People in Group quarters - Other noninstitutional group quarters (%)
Residents speaking English at home (%)
Residents speaking English at home - Born in the United States (%)
Residents speaking English at home - Native, born elsewhere (%)
Residents speaking English at home - Foreign born (%)
Residents speaking Spanish at home (%)
Residents speaking Spanish at home - Born in the United States (%)
Residents speaking Spanish at home - Native, born elsewhere (%)
Residents speaking Spanish at home - Foreign born (%)
Residents speaking other language at home (%)
Residents speaking other language at home - Born in the United States (%)
Residents speaking other language at home - Native, born elsewhere (%)
Residents speaking other language at home - Foreign born (%)
Class of Workers - Employee of private company (%)
Class of Workers - Self-employed in own incorporated business (%)
Class of Workers - Private not-for-profit wage and salary workers (%)
Class of Workers - Local government workers (%)
Class of Workers - State government workers (%)
Class of Workers - Federal government workers (%)
Class of Workers - Self-employed workers in own not incorporated business and Unpaid family workers (%)
House heating fuel used in houses and condos - Utility gas (%)
House heating fuel used in houses and condos - Bottled, tank, or LP gas (%)
House heating fuel used in houses and condos - Electricity (%)
House heating fuel used in houses and condos - Fuel oil, kerosene, etc. (%)
House heating fuel used in houses and condos - Coal or coke (%)
House heating fuel used in houses and condos - Wood (%)
House heating fuel used in houses and condos - Solar energy (%)
House heating fuel used in houses and condos - Other fuel (%)
House heating fuel used in houses and condos - No fuel used (%)
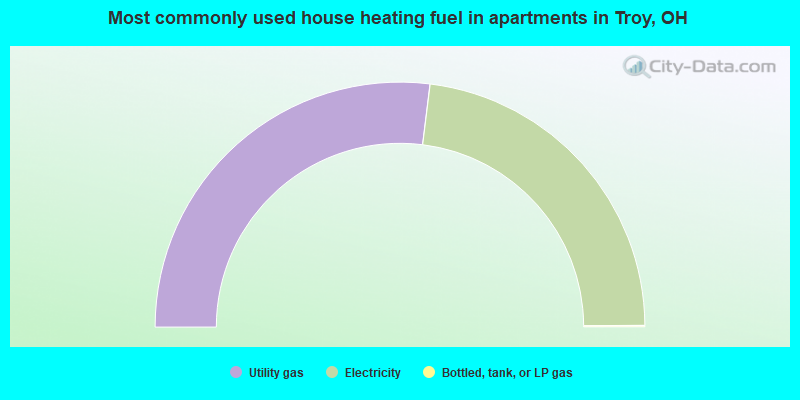
House heating fuel used in apartments - Utility gas (%)
House heating fuel used in apartments - Bottled, tank, or LP gas (%)
House heating fuel used in apartments - Electricity (%)
House heating fuel used in apartments - Fuel oil, kerosene, etc. (%)
House heating fuel used in apartments - Coal or coke (%)
House heating fuel used in apartments - Wood (%)
House heating fuel used in apartments - Solar energy (%)
House heating fuel used in apartments - Other fuel (%)
House heating fuel used in apartments - No fuel used (%)
Armed forces status - In Armed Forces (%)
Armed forces status - Civilian (%)
Armed forces status - Civilian - Veteran (%)
Armed forces status - Civilian - Nonveteran (%)
Fatal accidents locations in years 2005-2021
Fatal accidents locations in 2005
Fatal accidents locations in 2006
Fatal accidents locations in 2007
Fatal accidents locations in 2008
Fatal accidents locations in 2009
Fatal accidents locations in 2010
Fatal accidents locations in 2011
Fatal accidents locations in 2012
Fatal accidents locations in 2013
Fatal accidents locations in 2014
Fatal accidents locations in 2015
Fatal accidents locations in 2016
Fatal accidents locations in 2017
Fatal accidents locations in 2018
Fatal accidents locations in 2019
Fatal accidents locations in 2020
Fatal accidents locations in 2021
Alcohol use - People drinking some alcohol every month (%)
Alcohol use - People not drinking at all (%)
Alcohol use - Average days/month drinking alcohol
Alcohol use - Average drinks/week
Alcohol use - Average days/year people drink much
Audiometry - Average condition of hearing (%)
Audiometry - People that can hear a whisper from across a quiet room (%)
Audiometry - People that can hear normal voice from across a quiet room (%)
Audiometry - Ears ringing, roaring, buzzing (%)
Audiometry - Had a job exposure to loud noise (%)
Audiometry - Had off-work exposure to loud noise (%)
Blood Pressure & Cholesterol - Has high blood pressure (%)
Blood Pressure & Cholesterol - Checking blood pressure at home (%)
Blood Pressure & Cholesterol - Frequently checking blood cholesterol (%)
Blood Pressure & Cholesterol - Has high cholesterol level (%)
Consumer Behavior - Money monthly spent on food at supermarket/grocery store
Consumer Behavior - Money monthly spent on food at other stores
Consumer Behavior - Money monthly spent on eating out
Consumer Behavior - Money monthly spent on carryout/delivered foods
Consumer Behavior - Income spent on food at supermarket/grocery store (%)
Consumer Behavior - Income spent on food at other stores (%)
Consumer Behavior - Income spent on eating out (%)
Consumer Behavior - Income spent on carryout/delivered foods (%)
Current Health Status - General health condition (%)
Current Health Status - Blood donors (%)
Current Health Status - Has blood ever tested for HIV virus (%)
Current Health Status - Left-handed people (%)
Dermatology - People using sunscreen (%)
Diabetes - Diabetics (%)
Diabetes - Had a blood test for high blood sugar (%)
Diabetes - People taking insulin (%)
Diet Behavior & Nutrition - Diet health (%)
Diet Behavior & Nutrition - Milk product consumption (# of products/month)
Diet Behavior & Nutrition - Meals not home prepared (#/week)
Diet Behavior & Nutrition - Meals from fast food or pizza place (#/week)
Diet Behavior & Nutrition - Ready-to-eat foods (#/month)
Diet Behavior & Nutrition - Frozen meals/pizza (#/month)
Drug Use - People that ever used marijuana or hashish (%)
Drug Use - Ever used hard drugs (%)
Drug Use - Ever used any form of cocaine (%)
Drug Use - Ever used heroin (%)
Drug Use - Ever used methamphetamine (%)
Health Insurance - People covered by health insurance (%)
Kidney Conditions-Urology - Avg. # of times urinating at night
Medical Conditions - People with asthma (%)
Medical Conditions - People with anemia (%)
Medical Conditions - People with psoriasis (%)
Medical Conditions - People with overweight (%)
Medical Conditions - Elderly people having difficulties in thinking or remembering (%)
Medical Conditions - People who ever received blood transfusion (%)
Medical Conditions - People having trouble seeing even with glass/contacts (%)
Medical Conditions - People with arthritis (%)
Medical Conditions - People with gout (%)
Medical Conditions - People with congestive heart failure (%)
Medical Conditions - People with coronary heart disease (%)
Medical Conditions - People with angina pectoris (%)
Medical Conditions - People who ever had heart attack (%)
Medical Conditions - People who ever had stroke (%)
Medical Conditions - People with emphysema (%)
Medical Conditions - People with thyroid problem (%)
Medical Conditions - People with chronic bronchitis (%)
Medical Conditions - People with any liver condition (%)
Medical Conditions - People who ever had cancer or malignancy (%)
Mental Health - People who have little interest in doing things (%)
Mental Health - People feeling down, depressed, or hopeless (%)
Mental Health - People who have trouble sleeping or sleeping too much (%)
Mental Health - People feeling tired or having little energy (%)
Mental Health - People with poor appetite or overeating (%)
Mental Health - People feeling bad about themself (%)
Mental Health - People who have trouble concentrating on things (%)
Mental Health - People moving or speaking slowly or too fast (%)
Mental Health - People having thoughts they would be better off dead (%)
Oral Health - Average years since last visit a dentist
Oral Health - People embarrassed because of mouth (%)
Oral Health - People with gum disease (%)
Oral Health - General health of teeth and gums (%)
Oral Health - Average days a week using dental floss/device
Oral Health - Average days a week using mouthwash for dental problem
Oral Health - Average number of teeth
Pesticide Use - Households using pesticides to control insects (%)
Pesticide Use - Households using pesticides to kill weeds (%)
Physical Activity - People doing vigorous-intensity work activities (%)
Physical Activity - People doing moderate-intensity work activities (%)
Physical Activity - People walking or bicycling (%)
Physical Activity - People doing vigorous-intensity recreational activities (%)
Physical Activity - People doing moderate-intensity recreational activities (%)
Physical Activity - Average hours a day doing sedentary activities
Physical Activity - Average hours a day watching TV or videos
Physical Activity - Average hours a day using computer
Physical Functioning - People having limitations keeping them from working (%)
Physical Functioning - People limited in amount of work they can do (%)
Physical Functioning - People that need special equipment to walk (%)
Physical Functioning - People experiencing confusion/memory problems (%)
Physical Functioning - People requiring special healthcare equipment (%)
Prescription Medications - Average number of prescription medicines taking
Preventive Aspirin Use - Adults 40+ taking low-dose aspirin (%)
Reproductive Health - Vaginal deliveries (%)
Reproductive Health - Cesarean deliveries (%)
Reproductive Health - Deliveries resulted in a live birth (%)
Reproductive Health - Pregnancies resulted in a delivery (%)
Reproductive Health - Women breastfeeding newborns (%)
Reproductive Health - Women that had a hysterectomy (%)
Reproductive Health - Women that had both ovaries removed (%)
Reproductive Health - Women that have ever taken birth control pills (%)
Reproductive Health - Women taking birth control pills (%)
Reproductive Health - Women that have ever used Depo-Provera or injectables (%)
Reproductive Health - Women that have ever used female hormones (%)
Sexual Behavior - People 18+ that ever had sex (vaginal, anal, or oral) (%)
Sexual Behavior - Males 18+ that ever had vaginal sex with a woman (%)
Sexual Behavior - Males 18+ that ever performed oral sex on a woman (%)
Sexual Behavior - Males 18+ that ever had anal sex with a woman (%)
Sexual Behavior - Males 18+ that ever had any sex with a man (%)
Sexual Behavior - Females 18+ that ever had vaginal sex with a man (%)
Sexual Behavior - Females 18+ that ever performed oral sex on a man (%)
Sexual Behavior - Females 18+ that ever had anal sex with a man (%)
Sexual Behavior - Females 18+ that ever had any kind of sex with a woman (%)
Sexual Behavior - Average age people first had sex
Sexual Behavior - Average number of female sex partners in lifetime (males 18+)
Sexual Behavior - Average number of female vaginal sex partners in lifetime (males 18+)
Sexual Behavior - Average age people first performed oral sex on a woman (18+)
Sexual Behavior - Average number of woman performed oral sex on in lifetime (18+)
Sexual Behavior - Average number of male sex partners in lifetime (males 18+)
Sexual Behavior - Average number of male anal sex partners in lifetime (males 18+)
Sexual Behavior - Average age people first performed oral sex on a man (18+)
Sexual Behavior - Average number of male oral sex partners in lifetime (18+)
Sexual Behavior - People using protection when performing oral sex (%)
Sexual Behavior - Average number of times people have vaginal or anal sex a year
Sexual Behavior - People having sex without condom (%)
Sexual Behavior - Average number of male sex partners in lifetime (females 18+)
Sexual Behavior - Average number of male vaginal sex partners in lifetime (females 18+)
Sexual Behavior - Average number of female sex partners in lifetime (females 18+)
Sexual Behavior - Circumcised males 18+ (%)
Sleep Disorders - Average hours sleeping at night
Sleep Disorders - People that has trouble sleeping (%)
Smoking-Cigarette Use - People smoking cigarettes (%)
Taste & Smell - People 40+ having problems with smell (%)
Taste & Smell - People 40+ having problems with taste (%)
Taste & Smell - People 40+ that ever had wisdom teeth removed (%)
Taste & Smell - People 40+ that ever had tonsils teeth removed (%)
Taste & Smell - People 40+ that ever had a loss of consciousness because of a head injury (%)
Taste & Smell - People 40+ that ever had a broken nose or other serious injury to face or skull (%)
Taste & Smell - People 40+ that ever had two or more sinus infections (%)
Weight - Average height (inches)
Weight - Average weight (pounds)
Weight - Average BMI
Weight - People that are obese (%)
Weight - People that ever were obese (%)
Weight - People trying to lose weight (%)
According to our research of Ohio and other state lists, there were 48 registered sex offenders living in Troy, Ohio as of May 05, 2024 . The ratio of all residents to sex offenders in Troy is 536 to 1.The ratio of registered sex offenders to all residents in this city is near the state average.
Officers per 1,000 residents here:
1.59Ohio average:
2.24
Latest news from Troy, OH collected exclusively by city-data.com from local newspapers, TV, and radio stations
Ancestries: German (23.2%), American (13.9%), English (12.1%), Irish (7.3%), European (2.9%), French (1.4%).
Current Local Time:
Land area: 9.70 square miles.
Population density: 2,750 people per square mile (average).
1,556 residents are foreign born (3.7% Asia , 0.8% Latin America ).
Median real estate property taxes paid for housing units with mortgages in 2022: $1,579 (0.8%)Median real estate property taxes paid for housing units with no mortgage in 2022: $1,323 (0.8%)
Nearest city with pop. 50,000+: Dayton, OH
Nearest city with pop. 200,000+: Cincinnati, OH
Nearest city with pop. 1,000,000+: Chicago, IL
Nearest cities:
Latitude: 40.04 N, Longitude: 84.21 W
Daytime population change due to commuting: +3,804 (+14.2%)Workers who live and work in this city: 6,382 (47.2%)
Single-family new house construction building permits:
2000: 3 buildings , average cost: $131,5001999: 102 buildings , average cost: $173,9001998: 106 buildings , average cost: $128,8001997: 99 buildings , average cost: $127,500Unemployment in December 2023:
Population change in the 1990s: +2,437 (+12.5%).
Most common occupations in Troy, OH (%)
Both Males Females
Other production occupations, including supervisors (6.4%)
Metal workers and plastic workers (5.4%)
Other management occupations, except farmers and farm managers (4.5%)
Other office and administrative support workers, including supervisors (4.4%)
Assemblers and fabricators (3.8%)
Laborers and material movers, hand (3.6%)
Material recording, scheduling, dispatching, and distributing workers (3.3%)
Metal workers and plastic workers (9.1%)
Other production occupations, including supervisors (8.3%)
Other management occupations, except farmers and farm managers (6.0%)
Engineers (5.4%)
Laborers and material movers, hand (4.5%)
Driver/sales workers and truck drivers (4.4%)
Material recording, scheduling, dispatching, and distributing workers (3.9%)
Other office and administrative support workers, including supervisors (7.4%)
Secretaries and administrative assistants (4.6%)
Registered nurses (4.5%)
Other production occupations, including supervisors (4.4%)
Assemblers and fabricators (4.2%)
Preschool, kindergarten, elementary, and middle school teachers (4.2%)
Information and record clerks, except customer service representatives (3.6%)
Tornado activity:
Troy-area historical tornado activity is slightly above Ohio state average. It is 61% greater than the overall U.S. average.
On 4/3/1974, a category F5 (max. wind speeds 261-318 mph) tornado 29.7 miles away from the Troy city center killed 36 people and injured 1150 people and caused between $50,000,000 and $500,000,000 in damages.
On 4/11/1965, a category F4 (max. wind speeds 207-260 mph) tornado 23.2 miles away from the city center killed 3 people and injured 50 people and caused between $500,000 and $5,000,000 in damages.
Earthquake activity:
Troy-area historical earthquake activity is significantly above Ohio state average. It is 20% greater than the overall U.S. average. On 7/27/1980 at 18:52:21, a magnitude 5.2 (5.1 MB, 4.7 MS, 5.0 UK, 5.2 UK, Class: Moderate, Intensity: VI - VII) earthquake occurred 127.8 miles away from Troy center On 7/12/1986 at 08:19:37, a magnitude 4.5 (4.5 MB, Class: Light, Intensity: IV - V) earthquake occurred 35.3 miles away from the city center On 4/18/2008 at 09:36:59, a magnitude 5.4 (5.1 MB, 4.8 MS, 5.4 MW, 5.2 MW) earthquake occurred 225.6 miles away from Troy center On 9/25/1998 at 19:52:52, a magnitude 5.2 (4.8 MB, 4.3 MS, 5.2 LG, 4.5 MW, Depth: 3.1 mi) earthquake occurred 223.4 miles away from Troy center On 4/18/2008 at 09:36:59, a magnitude 5.2 (5.2 MW, Depth: 8.9 mi) earthquake occurred 225.6 miles away from Troy center On 1/31/1986 at 16:46:43, a magnitude 5.0 (5.0 MB) earthquake occurred 192.6 miles away from Troy center Magnitude types: regional Lg-wave magnitude (LG), body-wave magnitude (MB), surface-wave magnitude (MS), moment magnitude (MW) Natural disasters: The number of natural disasters in Miami County (10) is smaller than the US average (15).Major Disasters (Presidential) Declared: 4Emergencies Declared: 4Storms: 4, Floods: 3, Winds: 3, Mudslides: 2, Snowstorms: 2, Blizzard: 1, Hurricane: 1, Landslide: 1, Snow: 1, Tornado: 1, Tropical Depression: 1, Winter Storm: 1, Other: 1 (Note: some incidents may be assigned to more than one category). Main business address for: PEOPLES OHIO FINANCIAL CORP SAVINGS INSTITUTION, FEDERALLY CHARTERED ).
Hospitals and medical centers in Troy: HOSPICE OF MIAMI COUNTY INC (1100 WAYNE STREET, PO BOX 502) UPPER VALLEY MEDICAL CENTER (Voluntary non-profit - Private, 3130 NORTH COUNTY ROAD 25A) DETTMER HOSPITAL KOESTER (3130 N DIXIE HHWY)
KOESTER PAVILION (3232 NORTH COUNTY ROAD 25A)
MIAMI COUNTY HEALTH CARE CENTER (3232 N COUNTY RD 25A)
STOUDER SUBACUTE UNIT *CLOSED* (920 SUMMIT AVENUE)
TROY CARE AND REHABILITATION CENTER (512 CRESCENT DRIVE)
VILLA CONV CTR (512 CRESCENT DR)
UVMC DIALYSIS SERVICES (3130 NORTH COUNTY RD. 25 A)
AMERICAN NURSING CARE INC (860 ARTHUR ROAD)
Colleges/Universities in Troy: Hobart Institute of Welding Technology Full-time enrollment: 402; Location: 400 Trade Square East; Private, not-for-profit; Website: www.welding.org)
Miami-Jacobs Career College-Troy Full-time enrollment: 316; Location: 865 W Market St; Private, for-profit; Website: www.miamijacobs.edu)
Colleges/universities with over 2000 students nearest to Troy:
Edison State Community College (about 9 miles; Piqua, OH ; Full-time enrollment: 2,049)
Wright State University-Main Campus (about 20 miles; Dayton, OH ; FT enrollment: 14,482)
Sinclair Community College (about 20 miles; Dayton, OH ; FT enrollment: 13,779)
University of Dayton (about 22 miles; Dayton, OH ; FT enrollment: 10,392)
Clark State Community College (about 24 miles; Springfield, OH ; FT enrollment: 3,689)
Fortis College-Centerville (about 28 miles; Centerville, OH ; FT enrollment: 4,527)
Central State University (about 29 miles; Wilberforce, OH ; FT enrollment: 2,094)
Public high school in Troy:
Private high school in Troy: TROY CHRISTIAN HIGH SCHOOL Students: 327, Location: 700 S DORSET RD, Grades: 7-12)
Public elementary/middle schools in Troy: TROY JUNIOR HIGH SCHOOL Students: 693, Location: 556 ADAMS ST, Grades: 6-8)CONCORD ELEMENTARY SCHOOL Students: 552, Location: 3145 STATE ROUTE 718, Grades: KG-5)COOKSON ELEMENTARY SCHOOL Students: 368, Location: 921 MYSTIC LN, Grades: KG-5)VAN CLEVE ELEMENTARY SCHOOL Students: 327, Location: 617 E MAIN ST, Grades: 6)HEYWOOD ELEMENTARY SCHOOL Students: 324, Location: 260 S RIDGE AVE, Grades: KG-6)HOOK ELEMENTARY SCHOOL Students: 301, Location: 729 TRADE SQ W, Grades: KG-5)KYLE ELEMENTARY SCHOOL Students: 230, Location: 501 S PLUM ST, Grades: KG-5)FOREST ELEMENTARY SCHOOL Location: 413 E CANAL ST, Grades: KG-5)
Private elementary/middle schools in Troy: TROY CHRISTIAN ELEMENTARY Students: 246, Location: 1586 MCKAIG RD, Grades: KG-6)
ST PATRICK SCHOOL Students: 174, Location: 420 E WATER ST, Grades: PK-6)
See full list of schools located in Troy Library in Troy: TROY-MIAMI COUNTY PUBLIC LIBRARY Operating income: $1,643,654; Location: 419 W. MAIN ST.; 233,313 books ; 9,206 audio materials ; 15,384 video materials ; 266 state licensed databases ; 4 other licensed databases ; 238 print serial subscriptions )
Notable locations in Troy: (A) , Troy Wastewater Treatment Plant (B) , Troy Water Treatment Plant (C) , Troy Fire Department Station 3 (D) , Troy Fire Department Station 2 (E) , Troy-Hayner Cultural Center (F) , Troy Fire Department Station 1 (G) , Miami County Courthouse (H) , Troy City Hall (I) , Hobart Arena (J) , Troy-Miami County Public Library (K) , Gerhart Greenhouses (L) . Display/hide their locations on the map
Shopping Centers: (1) , Sherwood Shopping Center (2) , Troy Towne Center Shopping Center (3) . Display/hide their locations on the map
Main business address in Troy: (A) . Display/hide its location on the map
Churches in Troy include: (A) , Troy Church of Christ in Christian Union (B) , Full Gospel Community Church of God (C) , Grace Brethren Church (D) , First Wesleyan Church (E) , Troy Gospel Tabernacle (F) , Saint Johns United Church of Christ (G) , First Church of the Nazarene (H) , Saint Patrick Catholic Church (I) . Display/hide their locations on the map
Cemeteries: (1) , Riverside Cemetery (2) . Display/hide their locations on the map
Reservoir: (A) . Display/hide its location on the map
Parks in Troy include: (1) , Brukner Park (2) , Treasure Island Park (3) , Troy Public Square (4) , Hobart Circle Historic District (5) , Hobart Urban Nature Preserve (6) . Display/hide their locations on the map
Tourist attractions:
Hotels:
Birthplace of: Cris Carter - College football player, Gordon Bell (American football) - Football player, Randy Walker (American football coach) - Football coach, Barton Kyle Yount - Army general, Bertram Whittier Wells - Botanist, William H. Wallace - Politician, Bob Ferguson (American football) - Football player, Corky Valentine - Baseball player, John Meeker - College basketball player (Cincinnati Bearcats), Matt Terwilliger - College basketball player (Ohio State Buckeyes).
Miami County has a predicted average indoor radon screening level greater than 4 pCi/L (pico curies per liter) - Highest Potential Drinking water stations with addresses in Troy and their reported violations in the past:
THE DOLPHIN SWIM CLUB OF TROY INC (Population served: 200, Groundwater):
Past health violations:
MCL, Monthly (TCR) - Between APR-2011 and JUN-2011, Contaminant: Coliform. Follow-up actions: St Violation/Reminder Notice (MAY-26-2011), St Public Notif requested (MAY-26-2011), St Compliance achieved (FEB-09-2012)
Past monitoring violations:
7 routine major monitoring violations
One minor monitoring violation
Address: 2618 Lefever Rd Population served: 50, Groundwater):
Past monitoring violations:
3 routine major monitoring violations
One regular monitoring violation
Population served: 40, Groundwater):
Past monitoring violations:
One routine major monitoring violation
Drinking water stations with addresses in Troy that have no violations reported:
BETHEL TOWNSHIP WATER SYSTEM PWS (Address: 201 WEST MAIN STREET Population served: 303, Primary Water Source Type: Purch groundwater)
STILLWATER PRAIRIE RESERVE PWS (Population served: 250, Primary Water Source Type: Groundwater)
WACO MUSEUM PWS (Population served: 25, Primary Water Source Type: Groundwater)
Average household size: This city:
2.4 peopleOhio:
2.4 people
Percentage of family households: This city:
63.7%Whole state:
65.0%
Percentage of households with unmarried partners: This city:
7.5%Whole state:
6.8%
Likely homosexual households (counted as self-reported same-sex unmarried-partner households)
Lesbian couples: 0.4% of all households Gay men: 0.3% of all households
People in group quarters in Troy in 2010:
163 people in nursing facilities/skilled-nursing facilities
124 people in other noninstitutional facilities
100 people in local jails and other municipal confinement facilities
24 people in group homes intended for adults
9 people in emergency and transitional shelters (with sleeping facilities) for people experiencing homelessness
People in group quarters in Troy in 2000:
265 people in local jails and other confinement facilities (including police lockups)
256 people in nursing homes
31 people in other noninstitutional group quarters
19 people in homes for the mentally retarded
10 people in homes for the mentally ill
6 people in halfway houses
Banks with most branches in Troy (2011 data):
U.S. Bank National Association: South Market Branch, Sherwood Branch, Troy Main Branch. Info updated 2012/01/30: Bank assets: $330,470.8 mil, Deposits: $236,091.5 mil, headquarters in Cincinnati, OH, positive income , 3121 total offices , Holding Company: U.S. Bancorp
Fifth Third Bank: Troy Town Banking Center Branch, Troy Route #55 Bank Mart, Troy South Banking Center Branch. Info updated 2009/10/05: Bank assets: $114,540.4 mil, Deposits: $89,689.1 mil, headquarters in Cincinnati, OH, positive income , Commercial Lending Specialization, 1378 total offices , Holding Company: Fifth Third Bancorp
MainSource Bank: Mainsource Bank - Ohio Branch, Northside Branch, 1590 West Main Street Branch. Info updated 2009/12/09: Bank assets: $2,729.1 mil, Deposits: $2,167.0 mil, headquarters in Greensburg, IN, positive income , 86 total offices , Holding Company: Mainsource Financial Group, Inc.
The Park National Bank: 2203 1314 W Main Street Branch at 1314 W Main Street, branch established on 1884/01/01; 2205 Troy Wal-Mart Branch at 1801 W. Main St., branch established on 2004/05/17. Info updated 2008/09/29: Bank assets: $6,281.7 mil, Deposits: $4,611.6 mil, headquarters in Newark, OH, positive income , Commercial Lending Specialization, 123 total offices , Holding Company: Park National Corporation
Minster Bank: Troy Banking Center Branch at 1280 Experiment Farm Rd, branch established on 2006/06/30. Info updated 2006/11/03: Bank assets: $328.0 mil, Deposits: $280.4 mil, headquarters in Minster, OH, positive income , Commercial Lending Specialization, 7 total offices , Holding Company: Minster Financial Corp.
JPMorgan Chase Bank, National Association: Troy Branch at 1011 West Main Street, branch established on 1982/12/03. Info updated 2011/11/10: Bank assets: $1,811,678.0 mil, Deposits: $1,190,738.0 mil, headquarters in Columbus, OH, positive income , International Specialization, 5577 total offices , Holding Company: Jpmorgan Chase & Co.
PNC Bank, National Association: Troy Branch at 10 South Dorset Road, branch established on 1887/01/01. Info updated 2012/03/20: Bank assets: $263,309.6 mil, Deposits: $197,343.0 mil, headquarters in Wilmington, DE, positive income , Commercial Lending Specialization, 3085 total offices , Holding Company: Pnc Financial Services Group, Inc., The
Union Savings Bank: Weston Rd Branch at 14 S Weston Rd, branch established on 2009/01/16. Info updated 2012/01/04: Bank assets: $2,218.6 mil, Deposits: $1,997.4 mil, headquarters in Cincinnati, OH, positive income , Mortgage Lending Specialization, 25 total offices
Mutual Federal Savings Bank, A FSB: Troy Branch at 1867 West Main Street, branch established on 2004/11/12. Info updated 2011/07/21: Bank assets: $116.0 mil, Deposits: $102.2 mil, headquarters in Sidney, OH, negative income in the last year , Commercial Lending Specialization, 4 total offices , Holding Company: First Mutual Of Richmond, Inc.
For population 15 years and over in Troy:
Never married: 29.9%Now married: 52.6%Separated: 1.6%Widowed: 6.3%Divorced: 9.7% For population 25 years and over in Troy:
High school or higher: 92.1%Bachelor's degree or higher: 30.8%Graduate or professional degree: 10.9%Unemployed: 3.3%Mean travel time to work (commute): 18.8 minutes
Education Gini index (Inequality in education) Here:
10.1Ohio average:
11.0
Religion statistics for Troy, OH (based on Miami County data)
Religion Adherents Congregations Mainline Protestant 15,247 44 Evangelical Protestant 11,232 75 Catholic 10,860 7 Other 556 3 Black Protestant 264 3 None 64,347 -
Source: Clifford Grammich, Kirk Hadaway, Richard Houseal, Dale E.Jones, Alexei Krindatch, Richie Stanley and Richard H.Taylor. 2012. 2010 U.S.Religion Census: Religious Congregations & Membership Study. Association of Statisticians of American Religious Bodies. Jones, Dale E., et al. 2002. Congregations and Membership in the United States 2000. Nashville, TN: Glenmary Research Center. Graphs represent county-level data
Food Environment Statistics: Number of grocery stores : 11Miami County :
1.09 / 10,000 pop.Ohio :
1.89 / 10,000 pop.
Number of supercenters and club stores : 1Miami County :
0.10 / 10,000 pop.Ohio :
0.13 / 10,000 pop.
Number of convenience stores (no gas) : 6Miami County :
0.59 / 10,000 pop.Ohio :
1.25 / 10,000 pop.
Number of convenience stores (with gas) : 33This county :
3.27 / 10,000 pop.Ohio :
2.93 / 10,000 pop.
Number of full-service restaurants : 53Miami County :
5.26 / 10,000 pop.State :
6.25 / 10,000 pop.
Low-income preschool obesity rate : Health and Nutrition: Healthy diet rate : This city:
50.6%Ohio:
50.4%
Average overall health of teeth and gums : People feeling badly about themselves : People not drinking alcohol at all : Average hours sleeping at night : General health condition : Average condition of hearing : This city:
79.0%State:
79.1%
More about Health and Nutrition of Troy, OH Residents
Local government employment and payroll (March 2022)
Function
Full-time employees
Monthly full-time payroll
Average yearly full-time wage
Part-time employees
Monthly part-time payroll
Firefighters
45 $290,034 $77,342 0 $0 Police Protection - Officers
39 $289,480 $89,071 0 $0 Parks and Recreation
24 $125,229 $62,615 15 $4,413 Other Government Administration
23 $74,432 $38,834 1 $692 Financial Administration
19 $90,667 $57,263 0 $0 Streets and Highways
18 $116,075 $77,383 1 $1,116 Water Supply
13 $77,665 $71,691 0 $0 Sewerage
12 $71,793 $71,793 0 $0 Police - Other
3 $11,681 $46,724 0 $0 Other and Unallocable
3 $15,713 $62,852 0 $0 Housing and Community Development (Local)
2 $15,307 $91,842 0 $0 Solid Waste Management
2 $11,356 $68,136 0 $0 Judicial and Legal
2 $8,920 $53,520 0 $0 Fire - Other
1 $8,239 $98,868 0 $0
Totals for Government
206 $1,206,589 $70,287 17 $6,221
Troy government finances - Expenditure in 2021 (per resident):
Construction - General - Other: $7,035,000 ($263.69)
Water Utilities: $1,304,000 ($48.88)Sewerage: $1,085,000 ($40.67)Current Operations - Police Protection: $6,226,000 ($233.37)
Local Fire Protection: $5,747,000 ($215.41)Financial Administration: $5,111,000 ($191.57)Sewerage: $3,849,000 ($144.27)Water Utilities: $3,640,000 ($136.44)Parks and Recreation: $3,110,000 ($116.57)Regular Highways: $2,792,000 ($104.65)General - Other: $1,532,000 ($57.42)Solid Waste Management: $1,297,000 ($48.62)Central Staff Services: $1,055,000 ($39.54)Housing and Community Development: $810,000 ($30.36)Miscellaneous Commercial Activities - Other: $527,000 ($19.75)Judicial and Legal Services: $240,000 ($9.00)General Public Buildings: $144,000 ($5.40)Natural Resources - Other: $144,000 ($5.40)Parking Facilities: $90,000 ($3.37)General - Interest on Debt: $488,000 ($18.29)
Intergovernmental to State - Sewerage: $98,000 ($3.67)
Other Capital Outlay - General - Other: $509,000 ($19.08)
Parks and Recreation: $281,000 ($10.53)Regular Highways: $276,000 ($10.35)Police Protection: $25,000 ($0.94)Financial Administration: $9,000 ($0.34)Total Salaries and Wages: $5,610,000 ($210.28)
Water Utilities - Interest on Debt: $170,000 ($6.37)
Troy government finances - Revenue in 2021 (per resident):
Charges - Sewerage: $6,449,000 ($241.73)
Other: $4,712,000 ($176.62)Parks and Recreation: $935,000 ($35.05)Miscellaneous Commercial Activities: $257,000 ($9.63)Regular Highways: $5,000 ($0.19)Parking Facilities: $4,000 ($0.15)Miscellaneous - Special Assessments: $3,110,000 ($116.57)
General Revenue - Other: $2,450,000 ($91.83)Interest Earnings: $1,139,000 ($42.69)Fines and Forfeits: $1,000 ($0.04)Revenue - Water Utilities: $6,141,000 ($230.18)
State Intergovernmental - Other: $4,886,000 ($183.14)
General Local Government Support: $2,909,000 ($109.04)Highways: $1,680,000 ($62.97)Tax - Individual Income: $20,482,000 ($767.72)
Property: $1,970,000 ($73.84)Other: $105,000 ($3.94)Other License: $88,000 ($3.30)
Troy government finances - Debt in 2021 (per resident):
Long Term Debt - Beginning Outstanding - Unspecified Public Purpose: $17,807,000 ($667.45)
Outstanding Unspecified Public Purpose: $16,157,000 ($605.61)Retired Unspecified Public Purpose: $14,695,000 ($550.81)Issue, Unspecified Public Purpose: $13,045,000 ($488.96)Beginning Outstanding - Public Debt for Private Purpose: $1,330,000 ($49.85)Outstanding Nonguaranteed - Industrial Revenue: $1,295,000 ($48.54)Retired Nonguaranteed - Public Debt for Private Purpose: $35,000 ($1.31)
Troy government finances - Cash and Securities in 2021 (per resident):
Bond Funds - Cash and Securities: $7,230,000 ($271.00)
Other Funds - Cash and Securities: $92,386,000 ($3462.87)
Sinking Funds - Cash and Securities: $1,923,000 ($72.08)
Businesses in Troy, OH
Name Count Name Count
AT&T 1 Marriott 2 Advance Auto Parts 1 MasterBrand Cabinets 1 Applebee's 1 McDonald's 1 Arby's 1 Meijer 1 AutoZone 1 New Balance 1 Avenue 1 Nike 2 Buffalo Wild Wings 1 Outback 1 Burger King 1 Outback Steakhouse 1 CVS 1 Panera Bread 1 Chevrolet 1 Papa John's Pizza 1 Chipotle 1 Penske 1 Circle K 2 Pizza Hut 1 Cold Stone Creamery 1 RadioShack 1 Cricket Wireless 1 Ruby Tuesday 1 Curves 1 SONIC Drive-In 1 Domino's Pizza 1 Sprint Nextel 1 Fashion Bug 1 Staples 1 FedEx 5 Starbucks 1 Ford 1 Steak 'n Shake 1 GNC 1 Subway 3 GameStop 1 Super 8 1 Goodwill 1 T-Mobile 2 H&R Block 1 Taco Bell 1 Hilton 1 Tim Hortons 1 Holiday Inn 1 True Value 1 KFC 1 U-Haul 3 Kincaid 1 UPS 11 Kohl's 1 Waffle House 1 Kroger 1 Walgreens 1 La-Z-Boy 1 Walmart 1 Lane Furniture 1 Wendy's 2 Little Caesars Pizza 1 YMCA 1 Lowe's 1
Strongest AM radio stations in Troy:
WLW (700 AM; 50 kW; CINCINNATI, OH; Owner: JACOR BROADCASTING CORPORATION)
WTVN (610 AM; 50 kW; COLUMBUS, OH; Owner: CITICASTERS LICENSES, L.P.)
WONE (980 AM; 5 kW; DAYTON, OH; Owner: CITICASTERS LICENSES, L.P.)
WSAI (1530 AM; 50 kW; CINCINNATI, OH; Owner: JACOR BROADCASTING CORPORATION)
WRFD (880 AM; daytime; 23 kW; COLUMBUS-WORTHINGTON, OH; Owner: SALEM MEDIA OF OHIO, INC.)
WHIO (1290 AM; 5 kW; DAYTON, OH; Owner: CXR HOLDINGS, INC.)
WING (1410 AM; 5 kW; DAYTON, OH)
WOWO (1190 AM; 50 kW; FORT WAYNE, IN; Owner: PATHFINDER COMMUNICATIONS CORPORATION)
WIBC (1070 AM; 50 kW; INDIANAPOLIS, IN; Owner: EMMIS RADIO LICENSE CORPORATION)
WHAS (840 AM; 50 kW; LOUISVILLE, KY; Owner: CLEAR CHANNEL BROADCASTING LICENSES, INC.)
WGNZ (1110 AM; daytime; 2 kW; FAIRBORN, OH; Owner: L&D BROADCASTORS INC.)
WPTW (1570 AM; 0 kW; PIQUA, OH; Owner: FRONTIER BROADCASTING, LLC #2)
WJR (760 AM; 50 kW; DETROIT, MI; Owner: ABC, INC.)
Strongest FM radio stations in Troy:
WOKL (96.9 FM; TROY, OH; Owner: EDUCATIONAL MEDIA FOUNDATION)
WDKF (94.5 FM; ENGLEWOOD, OH; Owner: CITICASTERS LICENSES, L.P.)
WHKO (99.1 FM; DAYTON, OH; Owner: CXR HOLDINGS, INC.)
WDPT (95.7 FM; PIQUA, OH; Owner: CXR HOLDINGS, INC.)
WGTZ (92.9 FM; EATON, OH; Owner: BLUE CHIP BROADCASTING LICENSES, LTD)
WLQT (99.9 FM; KETTERING, OH; Owner: CITICASTERS LICENSES, L.P.)
WMMX (107.7 FM; DAYTON, OH; Owner: CITICASTERS LICENSES, L.P.)
WTUE (104.7 FM; DAYTON, OH; Owner: CITICASTERS LICENSES, L.P.)
WDHT (102.9 FM; SPRINGFIELD, OH; Owner: BLUE CHIP BROADCASTING LICENSES, LTD)
WRNB (92.1 FM; WEST CARROLLTON, OH; Owner: RADIO ONE OF DAYTON LICENSES, LLC)
WEEC (100.7 FM; SPRINGFIELD, OH; Owner: WORLD EVENGELISTIC ENTERPRISE CORP.)
WXEG (103.9 FM; BEAVERCREEK, OH; Owner: CITICASTERS LICENSES, L.P.)
WRVT (88.7 FM; RUTLAND, VT; Owner: VERMONT PUBLIC RADIO)
WQRP (89.5 FM; DAYTON, OH; Owner: WQRP FAMILY RADIO, INC.)
WIMT (102.1 FM; LIMA, OH; Owner: JACOR BROADCASTING CORPORATION)
WDPG (89.9 FM; GREENVILLE, OH; Owner: DAYTON PUBLIC RADIO, INC.)
WKSW (101.7 FM; URBANA, OH; Owner: BLUE CHIP BROADCASTING LICENSES, LTD)
WFCJ (93.7 FM; MIAMISBURG, OH; Owner: MIAMI VALLEY CHRISTIAN BROADCASTING ASSOCIATION)
WMLX (103.3 FM; ST. MARYS, OH; Owner: JACOR BROADCASTING CORPORATION)
WDJO (106.5 FM; GREENVILLE, OH; Owner: CITICASTERS LICENSES, L.P.)
TV broadcast stations around Troy:
WHIO-TV (Channel 7; DAYTON, OH; Owner: WHIO-TV HOLDINGS, INC.)
WDTN (Channel 2; DAYTON, OH; Owner: WDTN BROADCASTING, LLC)
WBDT (Channel 26; SPRINGFIELD, OH; Owner: ACME TV LICENSES OF OHIO, LLC)
WKEF (Channel 22; DAYTON, OH; Owner: WKEF LICENSEE L.P.)
WRGT-TV (Channel 45; DAYTON, OH; Owner: WRGT LICENSEE, LLC)
WPTD (Channel 16; DAYTON, OH; Owner: GREATER DAYTON PUBLIC TV, INC.)
W61DE (Channel 61; CINCINNATI, OH; Owner: TRINITY BROADCASTING NETWORK)
W47BC (Channel 47; SPRINGFIELD, OH; Owner: TRINITY BROADCASTING NETWORK)
WLMO-LP (Channel 65; LIMA, OH; Owner: METRO VIDEO PRODUCTIONS, INC.)
WRCX-LP (Channel 51; DAYTON, OH; Owner: ROSS COMMUNICATIONS, LTD.)
National Bridge Inventory (NBI) Statistics 77 Number of bridges741ft / 226m Total length $313,419,000 Total costs1,211,365 Total average daily traffic121,505 Total average daily truck traffic
New bridges - historical statistics
1 Before 1900 1 1930-1939 1 1940-1949 15 1950-1959 12 1960-1969 11 1970-1979 6 1980-1989 6 1990-1999 19 2000-2009 3 2010-2019 2 2020-2022
See full National Bridge Inventory statistics for Troy, OH
Home Mortgage Disclosure Act Aggregated Statistics For Year 2009(Based on 4 partial tracts) A) FHA, FSA/RHS & VA B) Conventional C) Refinancings D) Home Improvement Loans F) Non-occupant Loans on Number Average Value Number Average Value Number Average Value Number Average Value Number Average Value
LOANS ORIGINATED 35 $123,770 26 $130,665 148 $143,516 4 $66,468 9 $111,879 APPLICATIONS APPROVED, NOT ACCEPTED 2 $99,895 1 $184,600 16 $134,047 0 $0 0 $0 APPLICATIONS DENIED 4 $161,610 3 $136,767 55 $124,787 4 $68,105 5 $61,900 APPLICATIONS WITHDRAWN 4 $120,308 2 $192,525 21 $147,600 0 $0 1 $90,870 FILES CLOSED FOR INCOMPLETENESS 1 $82,910 0 $0 2 $179,175 0 $0 0 $0
Aggregated Statistics For Year 2008(Based on 4 partial tracts) A) FHA, FSA/RHS & VA B) Conventional C) Refinancings D) Home Improvement Loans F) Non-occupant Loans on Number Average Value Number Average Value Number Average Value Number Average Value Number Average Value
LOANS ORIGINATED 25 $113,595 43 $133,593 68 $340,557 7 $48,463 14 $1,124,450 APPLICATIONS APPROVED, NOT ACCEPTED 1 $120,840 2 $133,460 7 $108,939 2 $62,160 1 $68,930 APPLICATIONS DENIED 4 $152,030 3 $91,097 44 $103,352 8 $38,039 4 $91,460 APPLICATIONS WITHDRAWN 2 $117,110 4 $90,852 16 $127,572 1 $62,190 0 $0 FILES CLOSED FOR INCOMPLETENESS 0 $0 1 $57,430 3 $173,880 0 $0 0 $0
Aggregated Statistics For Year 2007(Based on 4 partial tracts) A) FHA, FSA/RHS & VA B) Conventional C) Refinancings D) Home Improvement Loans F) Non-occupant Loans on Number Average Value Number Average Value Number Average Value Number Average Value Number Average Value
LOANS ORIGINATED 10 $149,455 85 $114,388 60 $108,980 13 $42,617 16 $89,833 APPLICATIONS APPROVED, NOT ACCEPTED 0 $0 5 $126,208 15 $100,646 4 $31,292 1 $136,900 APPLICATIONS DENIED 1 $129,990 12 $91,551 52 $104,359 12 $36,382 4 $83,405 APPLICATIONS WITHDRAWN 2 $113,395 7 $119,317 25 $106,175 2 $50,525 2 $117,045 FILES CLOSED FOR INCOMPLETENESS 0 $0 2 $88,880 5 $166,312 0 $0 0 $0
Aggregated Statistics For Year 2006(Based on 4 partial tracts) A) FHA, FSA/RHS & VA B) Conventional C) Refinancings D) Home Improvement Loans E) Loans on Dwellings For 5+ Families F) Non-occupant Loans on G) Loans On Manufactured Number Average Value Number Average Value Number Average Value Number Average Value Number Average Value Number Average Value Number Average Value
LOANS ORIGINATED 11 $123,488 106 $113,120 84 $108,829 8 $41,070 1 $2,023,220 22 $101,216 0 $0 APPLICATIONS APPROVED, NOT ACCEPTED 1 $107,560 9 $132,614 22 $106,533 2 $70,775 0 $0 4 $185,832 0 $0 APPLICATIONS DENIED 0 $0 17 $94,735 62 $102,405 12 $41,747 0 $0 6 $134,000 1 $15,780 APPLICATIONS WITHDRAWN 1 $98,970 12 $101,738 28 $106,725 4 $47,760 0 $0 3 $80,440 0 $0 FILES CLOSED FOR INCOMPLETENESS 0 $0 3 $69,413 12 $122,634 1 $57,360 0 $0 1 $97,500 0 $0
Aggregated Statistics For Year 2005(Based on 4 partial tracts) A) FHA, FSA/RHS & VA B) Conventional C) Refinancings D) Home Improvement Loans F) Non-occupant Loans on G) Loans On Manufactured Number Average Value Number Average Value Number Average Value Number Average Value Number Average Value Number Average Value
LOANS ORIGINATED 12 $119,105 114 $120,584 98 $111,075 12 $39,322 26 $138,360 0 $0 APPLICATIONS APPROVED, NOT ACCEPTED 1 $78,420 7 $135,144 20 $103,766 2 $46,645 1 $110,140 0 $0 APPLICATIONS DENIED 1 $150,050 15 $83,814 78 $112,223 10 $46,152 3 $72,653 2 $40,985 APPLICATIONS WITHDRAWN 1 $87,060 10 $108,788 46 $123,292 5 $101,088 4 $97,772 0 $0 FILES CLOSED FOR INCOMPLETENESS 0 $0 2 $96,235 8 $149,088 1 $39,300 1 $151,850 0 $0
Aggregated Statistics For Year 2004(Based on 4 partial tracts) A) FHA, FSA/RHS & VA B) Conventional C) Refinancings D) Home Improvement Loans E) Loans on Dwellings For 5+ Families F) Non-occupant Loans on G) Loans On Manufactured Number Average Value Number Average Value Number Average Value Number Average Value Number Average Value Number Average Value Number Average Value
LOANS ORIGINATED 12 $111,647 106 $119,819 130 $117,738 12 $41,287 1 $449,960 30 $92,003 0 $0 APPLICATIONS APPROVED, NOT ACCEPTED 0 $0 12 $91,257 26 $98,815 2 $90,100 0 $0 4 $99,925 0 $0 APPLICATIONS DENIED 4 $100,848 11 $106,625 72 $101,334 16 $44,247 0 $0 8 $77,586 1 $42,680 APPLICATIONS WITHDRAWN 1 $106,480 11 $108,256 47 $106,919 3 $53,453 0 $0 3 $111,680 0 $0 FILES CLOSED FOR INCOMPLETENESS 1 $45,370 3 $142,930 9 $111,239 1 $67,070 0 $0 1 $113,140 0 $0
Aggregated Statistics For Year 2003(Based on 4 partial tracts) A) FHA, FSA/RHS & VA B) Conventional C) Refinancings D) Home Improvement Loans F) Non-occupant Loans on Number Average Value Number Average Value Number Average Value Number Average Value Number Average Value
LOANS ORIGINATED 18 $111,532 86 $126,953 294 $117,322 8 $35,474 26 $104,043 APPLICATIONS APPROVED, NOT ACCEPTED 1 $83,530 10 $106,758 34 $109,299 1 $26,230 2 $112,925 APPLICATIONS DENIED 2 $97,015 11 $95,190 83 $97,620 7 $24,953 5 $110,584 APPLICATIONS WITHDRAWN 2 $96,235 7 $131,663 50 $109,853 2 $35,070 3 $129,843 FILES CLOSED FOR INCOMPLETENESS 1 $97,350 4 $113,482 11 $102,044 0 $0 0 $0
Aggregated Statistics For Year 2002(Based on 4 partial tracts) A) FHA, FSA/RHS & VA B) Conventional C) Refinancings D) Home Improvement Loans F) Non-occupant Loans on Number Average Value Number Average Value Number Average Value Number Average Value Number Average Value
LOANS ORIGINATED 17 $116,911 74 $118,960 219 $117,795 9 $13,933 25 $136,319 APPLICATIONS APPROVED, NOT ACCEPTED 1 $116,980 9 $127,746 28 $113,850 2 $14,160 3 $145,963 APPLICATIONS DENIED 2 $101,290 9 $83,990 72 $94,278 5 $23,940 2 $121,210 APPLICATIONS WITHDRAWN 1 $121,960 5 $101,902 45 $105,397 1 $26,500 1 $123,440 FILES CLOSED FOR INCOMPLETENESS 1 $120,700 2 $83,620 10 $103,037 0 $0 1 $118,230
Aggregated Statistics For Year 2001(Based on 4 partial tracts) A) FHA, FSA/RHS & VA B) Conventional C) Refinancings D) Home Improvement Loans F) Non-occupant Loans on Number Average Value Number Average Value Number Average Value Number Average Value Number Average Value
LOANS ORIGINATED 23 $95,018 76 $111,902 189 $111,155 13 $18,542 29 $114,437 APPLICATIONS APPROVED, NOT ACCEPTED 2 $68,615 8 $85,256 30 $88,479 4 $21,808 2 $76,670 APPLICATIONS DENIED 1 $62,330 10 $72,154 70 $93,085 17 $15,054 4 $62,598 APPLICATIONS WITHDRAWN 0 $0 7 $88,244 44 $95,304 3 $28,843 2 $107,095 FILES CLOSED FOR INCOMPLETENESS 0 $0 2 $108,360 7 $122,784 1 $6,740 1 $68,250
Aggregated Statistics For Year 2000(Based on 4 partial tracts) A) FHA, FSA/RHS & VA B) Conventional C) Refinancings D) Home Improvement Loans F) Non-occupant Loans on Number Average Value Number Average Value Number Average Value Number Average Value Number Average Value
LOANS ORIGINATED 21 $95,301 76 $109,105 57 $77,846 21 $17,302 13 $84,568 APPLICATIONS APPROVED, NOT ACCEPTED 3 $95,303 5 $85,178 20 $75,005 10 $10,346 1 $65,220 APPLICATIONS DENIED 2 $94,300 9 $80,662 47 $76,117 17 $11,294 3 $63,120 APPLICATIONS WITHDRAWN 0 $0 6 $94,918 21 $77,180 2 $27,590 1 $34,780 FILES CLOSED FOR INCOMPLETENESS 0 $0 1 $84,470 5 $93,410 0 $0 0 $0
Aggregated Statistics For Year 1999(Based on 4 partial tracts) A) FHA, FSA/RHS & VA B) Conventional C) Refinancings D) Home Improvement Loans F) Non-occupant Loans on Number Average Value Number Average Value Number Average Value Number Average Value Number Average Value
LOANS ORIGINATED 21 $93,100 60 $114,566 109 $92,466 22 $15,446 22 $103,099 APPLICATIONS APPROVED, NOT ACCEPTED 1 $159,210 5 $74,288 31 $76,348 8 $13,050 2 $65,100 APPLICATIONS DENIED 2 $78,190 9 $77,584 55 $81,633 16 $15,643 3 $67,977 APPLICATIONS WITHDRAWN 1 $49,430 7 $95,160 29 $86,471 3 $43,723 2 $56,755 FILES CLOSED FOR INCOMPLETENESS 1 $53,770 2 $68,370 5 $96,456 0 $0 1 $53,210
Detailed HMDA statistics for the following Tracts:
3650.00
, 3652.00 , 3653.01 , 3653.02
Private Mortgage Insurance Companies Aggregated Statistics For Year 2009(Based on 4 partial tracts) A) Conventional B) Refinancings Number Average Value Number Average Value
LOANS ORIGINATED 6 $131,720 4 $166,520 APPLICATIONS APPROVED, NOT ACCEPTED 1 $184,870 2 $208,855 APPLICATIONS DENIED 1 $196,590 1 $207,840 APPLICATIONS WITHDRAWN 0 $0 1 $81,060 FILES CLOSED FOR INCOMPLETENESS 0 $0 0 $0
Aggregated Statistics For Year 2008(Based on 4 partial tracts) A) Conventional B) Refinancings Number Average Value Number Average Value
LOANS ORIGINATED 13 $144,623 3 $146,443 APPLICATIONS APPROVED, NOT ACCEPTED 3 $114,113 2 $219,785 APPLICATIONS DENIED 1 $251,390 0 $0 APPLICATIONS WITHDRAWN 0 $0 0 $0 FILES CLOSED FOR INCOMPLETENESS 0 $0 0 $0
Aggregated Statistics For Year 2007(Based on 4 partial tracts) A) Conventional B) Refinancings C) Non-occupant Loans on Number Average Value Number Average Value Number Average Value
LOANS ORIGINATED 21 $107,604 6 $166,898 2 $64,295 APPLICATIONS APPROVED, NOT ACCEPTED 3 $102,457 2 $151,480 1 $110,220 APPLICATIONS DENIED 0 $0 0 $0 0 $0 APPLICATIONS WITHDRAWN 2 $147,115 0 $0 0 $0 FILES CLOSED FOR INCOMPLETENESS 0 $0 0 $0 0 $0
Aggregated Statistics For Year 2006(Based on 4 partial tracts) A) Conventional B) Refinancings C) Non-occupant Loans on Number Average Value Number Average Value Number Average Value
LOANS ORIGINATED 20 $120,688 6 $128,910 3 $54,100 APPLICATIONS APPROVED, NOT ACCEPTED 4 $129,902 2 $98,820 1 $39,840 APPLICATIONS DENIED 0 $0 0 $0 0 $0 APPLICATIONS WITHDRAWN 1 $88,030 0 $0 0 $0 FILES CLOSED FOR INCOMPLETENESS 0 $0 0 $0 0 $0
Aggregated Statistics For Year 2005(Based on 4 partial tracts) A) Conventional B) Refinancings C) Non-occupant Loans on Number Average Value Number Average Value Number Average Value
LOANS ORIGINATED 14 $115,778 8 $144,246 2 $58,635 APPLICATIONS APPROVED, NOT ACCEPTED 2 $96,340 3 $169,393 0 $0 APPLICATIONS DENIED 0 $0 0 $0 0 $0 APPLICATIONS WITHDRAWN 0 $0 1 $96,520 0 $0 FILES CLOSED FOR INCOMPLETENESS 0 $0 0 $0 0 $0
Aggregated Statistics For Year 2004(Based on 4 partial tracts) A) Conventional B) Refinancings C) Non-occupant Loans on Number Average Value Number Average Value Number Average Value
LOANS ORIGINATED 17 $125,193 7 $124,157 5 $88,704 APPLICATIONS APPROVED, NOT ACCEPTED 2 $88,955 4 $121,288 0 $0 APPLICATIONS DENIED 0 $0 0 $0 0 $0 APPLICATIONS WITHDRAWN 2 $131,040 1 $111,160 0 $0 FILES CLOSED FOR INCOMPLETENESS 1 $57,310 0 $0 0 $0
Aggregated Statistics For Year 2003(Based on 4 partial tracts) A) Conventional B) Refinancings C) Non-occupant Loans on Number Average Value Number Average Value Number Average Value
LOANS ORIGINATED 18 $127,131 25 $124,153 2 $120,520 APPLICATIONS APPROVED, NOT ACCEPTED 3 $121,257 8 $145,340 1 $42,380 APPLICATIONS DENIED 0 $0 0 $0 0 $0 APPLICATIONS WITHDRAWN 2 $118,480 1 $136,480 0 $0 FILES CLOSED FOR INCOMPLETENESS 0 $0 0 $0 0 $0
Aggregated Statistics For Year 2002(Based on 4 partial tracts) A) Conventional B) Refinancings C) Non-occupant Loans on Number Average Value Number Average Value Number Average Value
LOANS ORIGINATED 14 $119,731 22 $127,219 1 $148,290 APPLICATIONS APPROVED, NOT ACCEPTED 3 $148,910 4 $117,225 0 $0 APPLICATIONS DENIED 0 $0 0 $0 0 $0 APPLICATIONS WITHDRAWN 1 $74,030 0 $0 0 $0 FILES CLOSED FOR INCOMPLETENESS 0 $0 0 $0 0 $0
Aggregated Statistics For Year 2001(Based on 4 partial tracts) A) Conventional B) Refinancings C) Non-occupant Loans on Number Average Value Number Average Value Number Average Value
LOANS ORIGINATED 16 $117,564 18 $128,746 1 $104,740 APPLICATIONS APPROVED, NOT ACCEPTED 3 $102,067 5 $128,010 1 $43,650 APPLICATIONS DENIED 0 $0 2 $96,820 0 $0 APPLICATIONS WITHDRAWN 1 $55,100 1 $92,830 0 $0 FILES CLOSED FOR INCOMPLETENESS 0 $0 0 $0 0 $0
Aggregated Statistics For Year 2000(Based on 4 partial tracts) A) Conventional B) Refinancings C) Non-occupant Loans on Number Average Value Number Average Value Number Average Value
LOANS ORIGINATED 18 $104,203 4 $97,662 1 $74,050 APPLICATIONS APPROVED, NOT ACCEPTED 1 $124,830 1 $99,600 0 $0 APPLICATIONS DENIED 1 $62,540 0 $0 0 $0 APPLICATIONS WITHDRAWN 0 $0 0 $0 0 $0 FILES CLOSED FOR INCOMPLETENESS 0 $0 0 $0 0 $0
Aggregated Statistics For Year 1999(Based on 4 partial tracts) A) Conventional B) Refinancings C) Non-occupant Loans on Number Average Value Number Average Value Number Average Value
LOANS ORIGINATED 19 $128,898 8 $104,875 0 $0 APPLICATIONS APPROVED, NOT ACCEPTED 1 $120,150 2 $108,555 0 $0 APPLICATIONS DENIED 1 $78,080 0 $0 1 $78,080 APPLICATIONS WITHDRAWN 0 $0 0 $0 0 $0 FILES CLOSED FOR INCOMPLETENESS 0 $0 0 $0 0 $0
Detailed PMIC statistics for the following Tracts:
3650.00
, 3652.00 , 3653.01 , 3653.02 Fire-safe hotels and motels in Troy, Ohio:
Comfort Suites, 1800 Towne Park Dr, Troy, Ohio 45373 Phone: (937) 339-2525, Fax: (937) 339-2828
Hampton Inn, 45 Troy Town Dr, Troy, Ohio 45373 Phone: (937) 339-7801, Fax: (937) 335-7979
America's Best Inn - Troy, 30 Troy Town Rd, Troy, Ohio 45373 Phone: (937) 339-1515
All 3 fire-safe hotels and motels in Troy, Ohio
Most common first names in Troy, OH among deceased individuals Name Count Lived (average)
Mary 588 79.9 years William 394 73.3 years Robert 392 71.7 years Charles 384 73.1 years John 382 74.2 years James 338 72.0 years Helen 250 79.7 years Ruth 230 79.8 years George 214 75.2 years Margaret 196 81.3 years
Most common last names in Troy, OH among deceased individuals Last name Count Lived (average)
Smith 166 75.2 years Davis 162 77.0 years Brown 152 76.6 years Miller 150 79.2 years Williams 104 79.0 years Johnson 90 77.1 years Jones 80 77.6 years Baker 78 73.1 years Wright 70 73.6 years Lewis 64 72.0 years
Troy compared to Ohio state average:
Unemployed percentage significantly below state average. Black race population percentage significantly below state average.
#73 on the list of "Top 101 cities with largest percentage of males in industries: manufacturing (population 5,000+)"
#56 on the list of "Top 101 counties with the lowest percentage of residents relocating to foreign countries in 2011"
Top Patent Applicants
Gregory J. Holland (227)
James R. Larkins (67)
Eric D. Cahill (40)
Bernard J. Vogel (28)
Hao Huang (25)
Kevin Rehfus (21)
Eric Daniel Cahill (16)
Gregory Holland (14)
Eric L. Jensen (14)
Eric Cahill (11)
Total of 743 patent applications in 2008-2024.


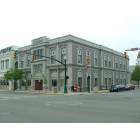
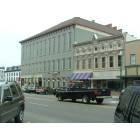
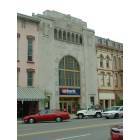

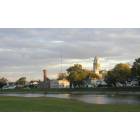
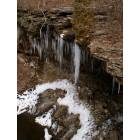
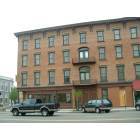
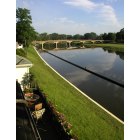


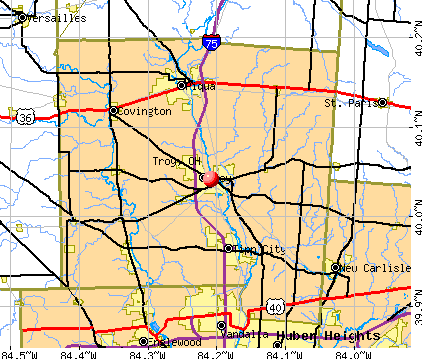


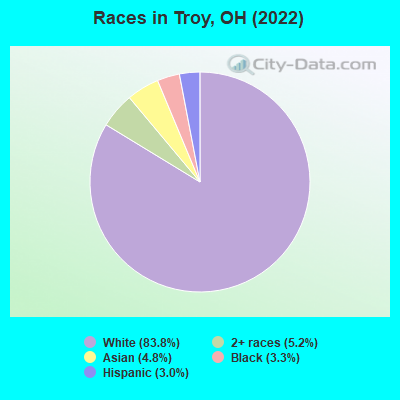
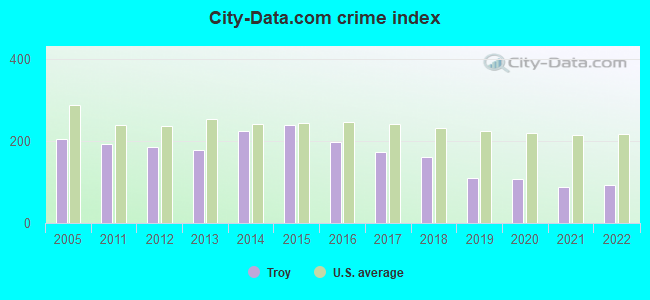
 Recent articles from our blog. Our writers, many of them Ph.D. graduates or candidates, create easy-to-read articles on a wide variety of topics.


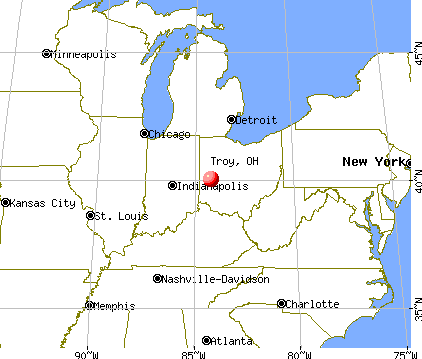
 (19.3 miles
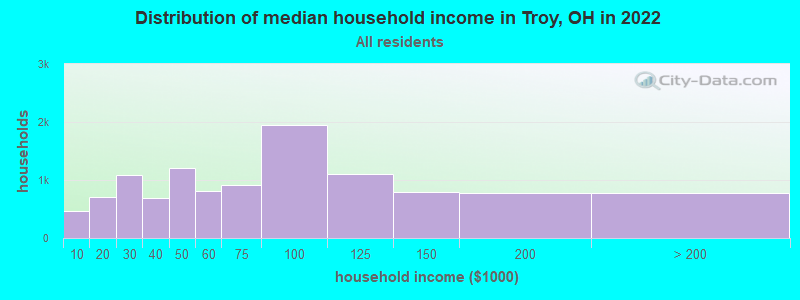
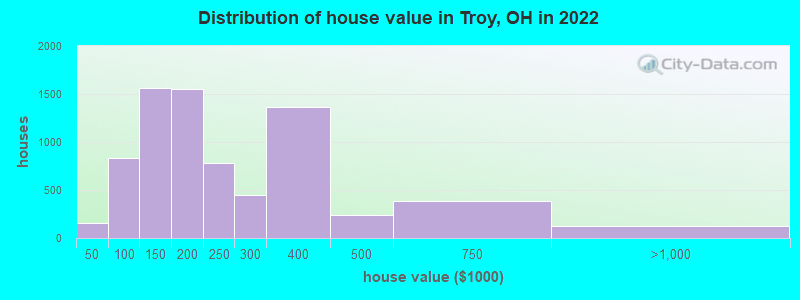
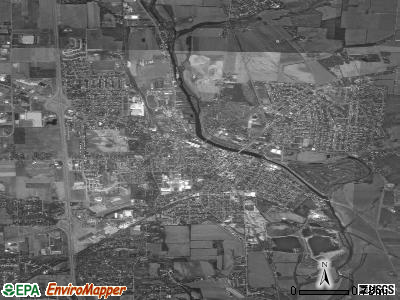
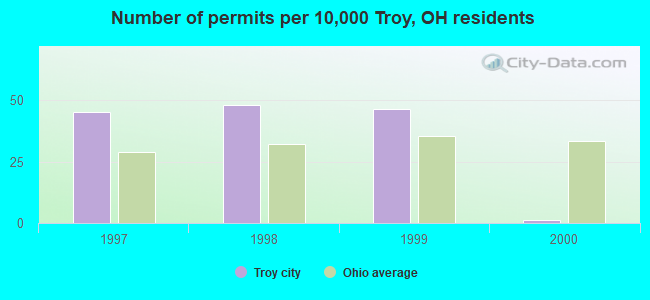
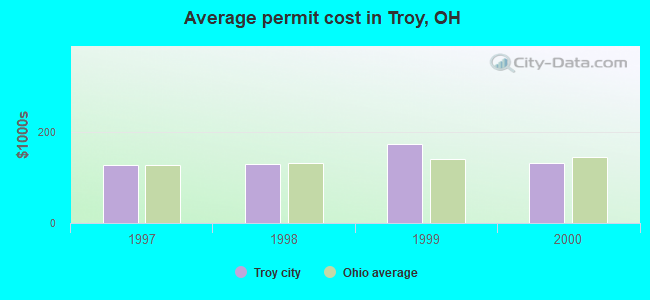
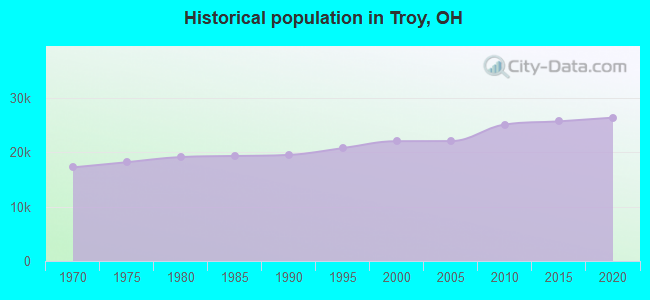
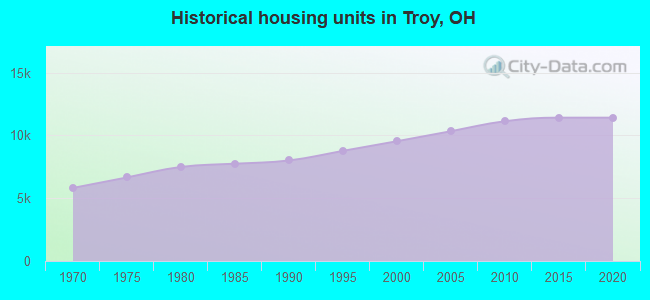
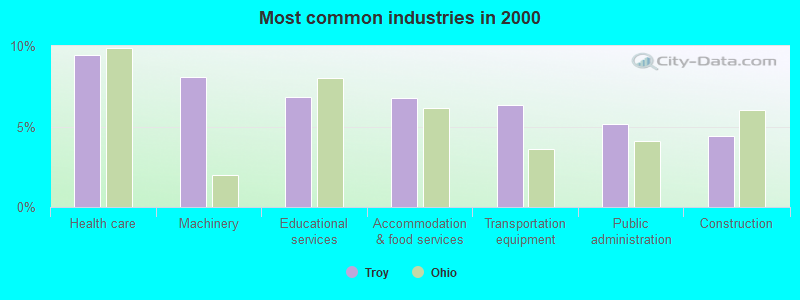
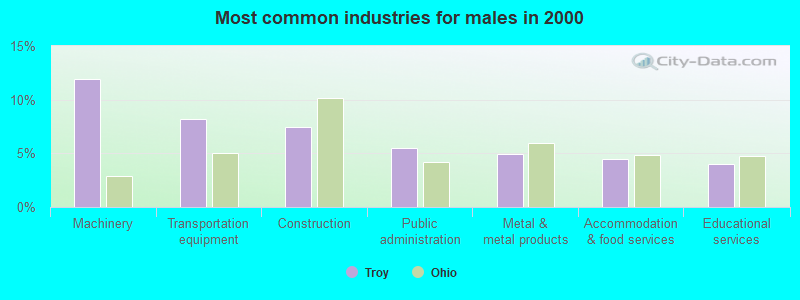
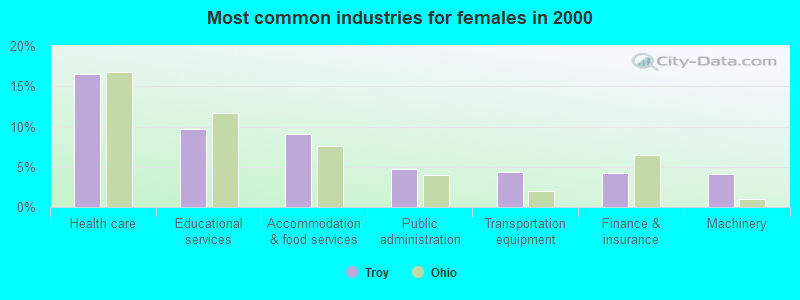
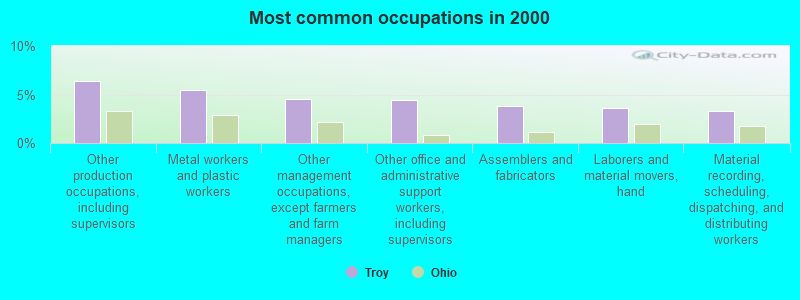
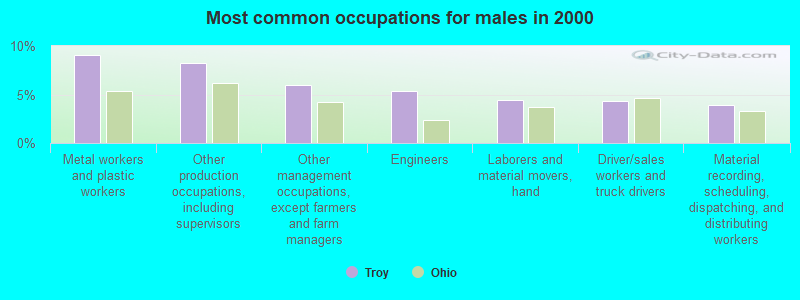
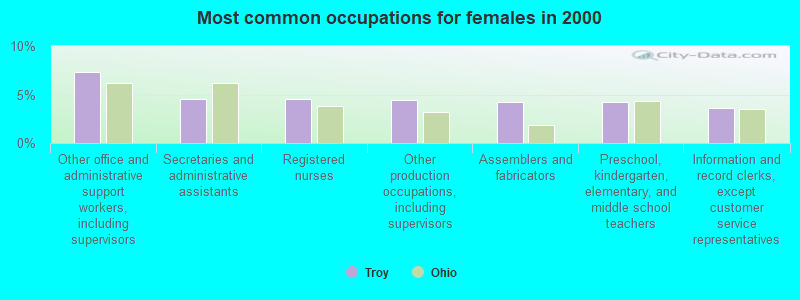
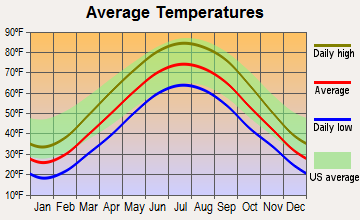
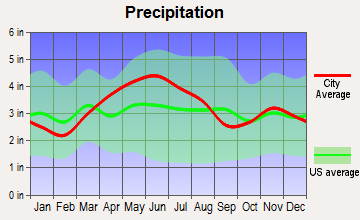
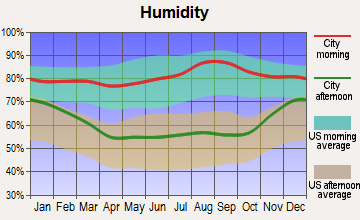
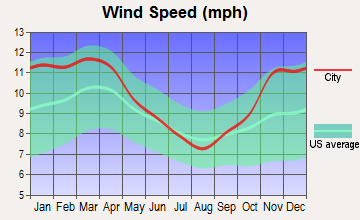
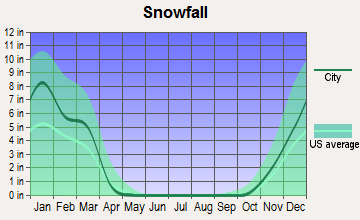
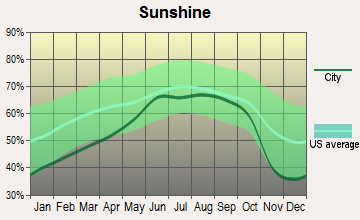
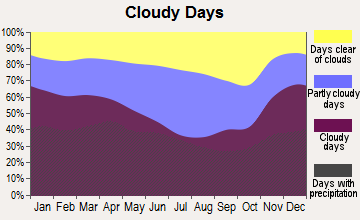
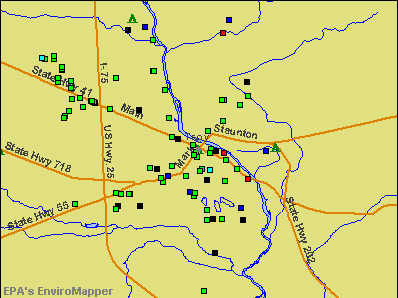

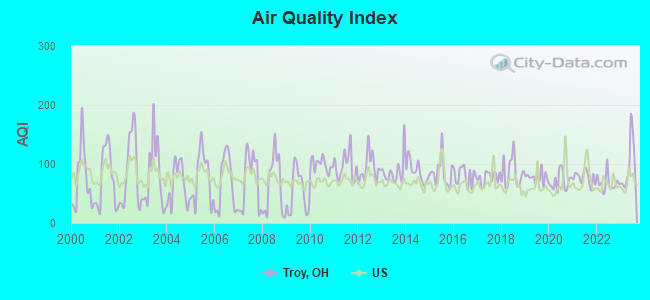
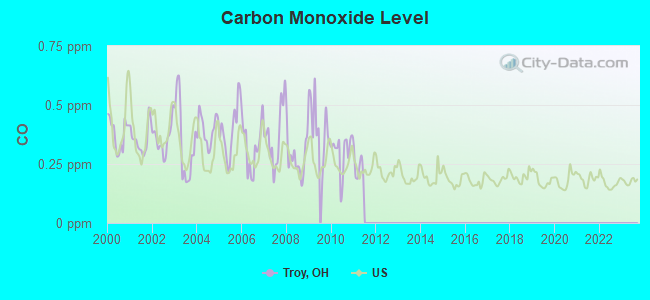
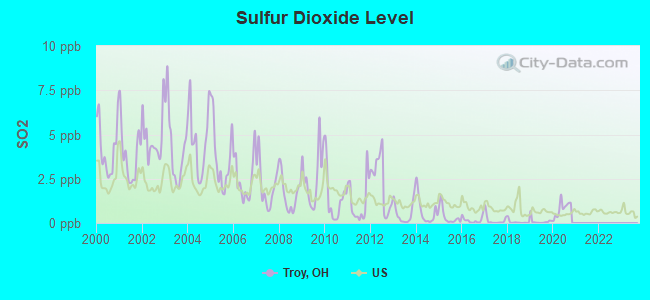
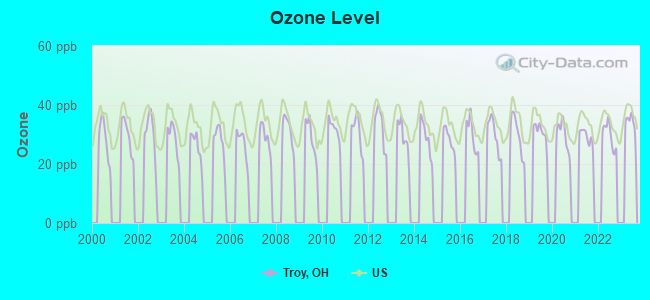
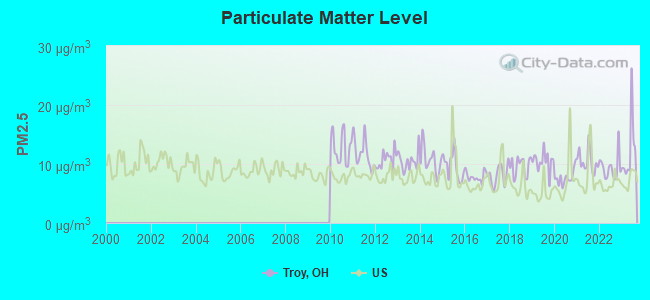

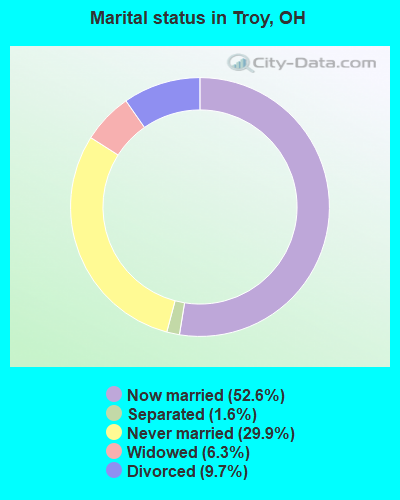
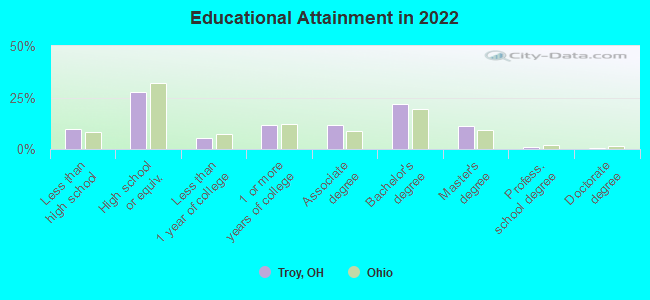
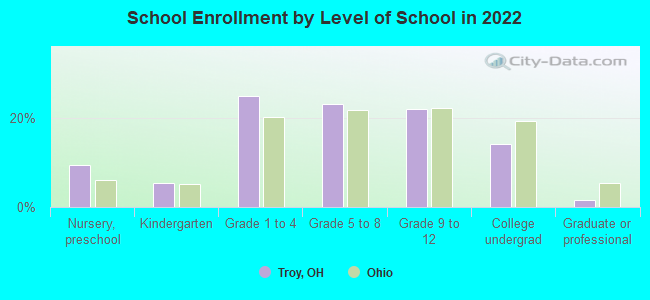
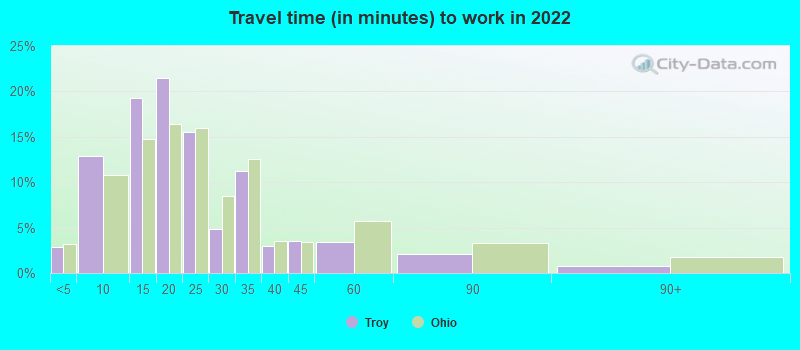
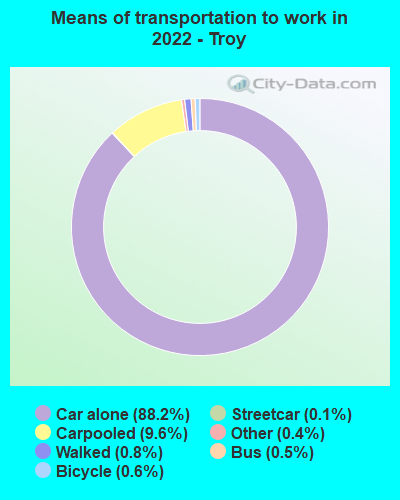
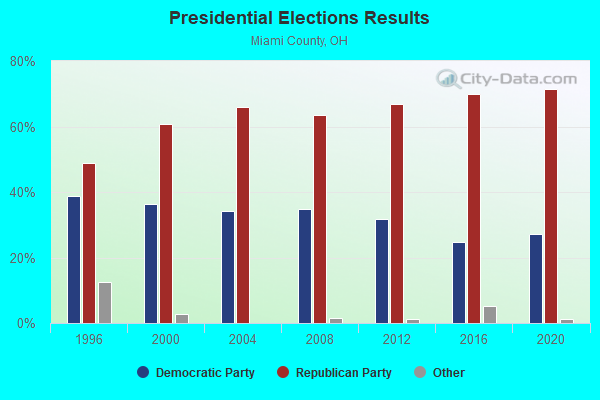
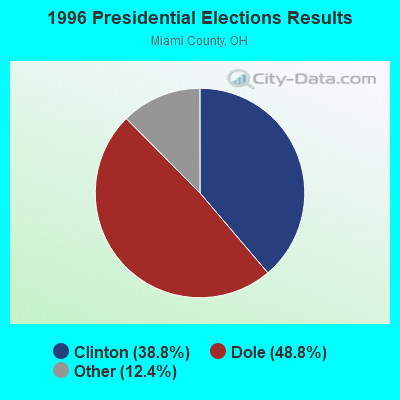
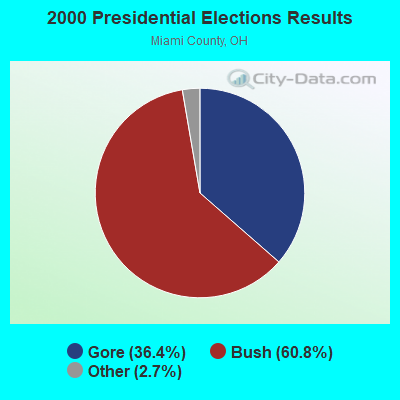
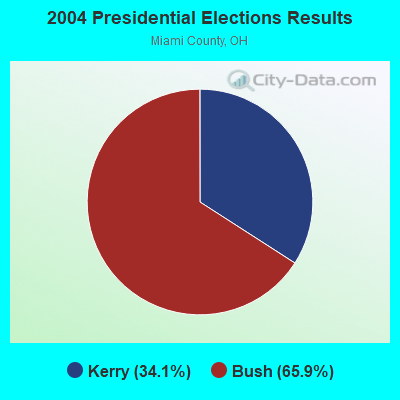
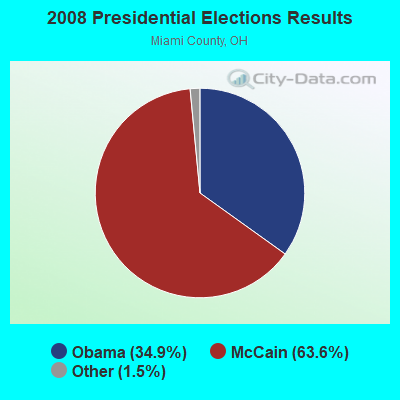
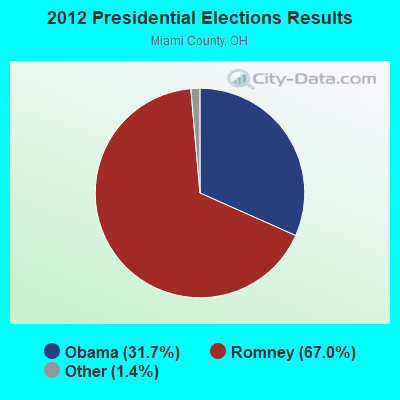
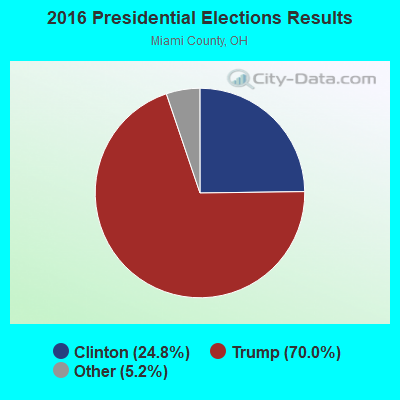

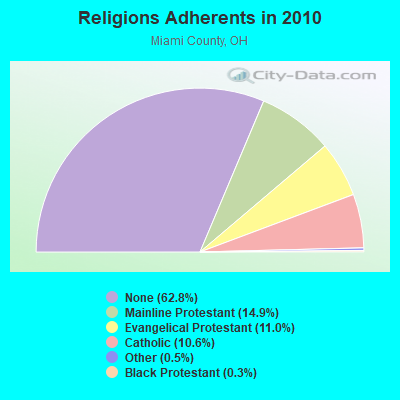
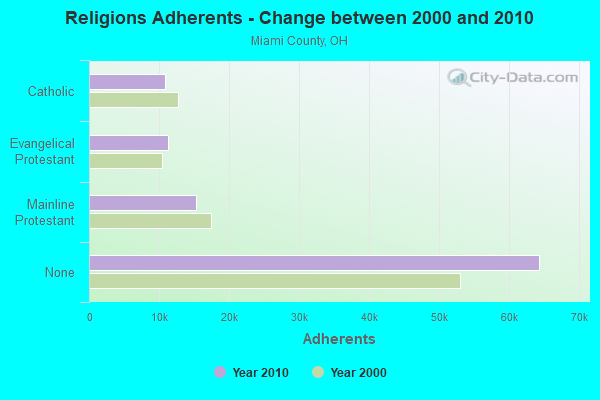

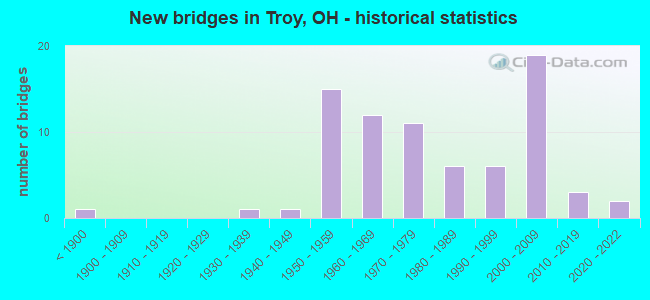
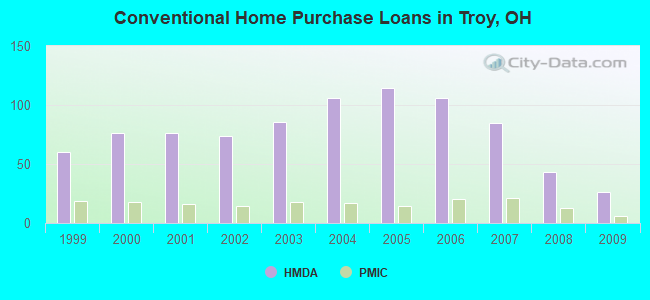
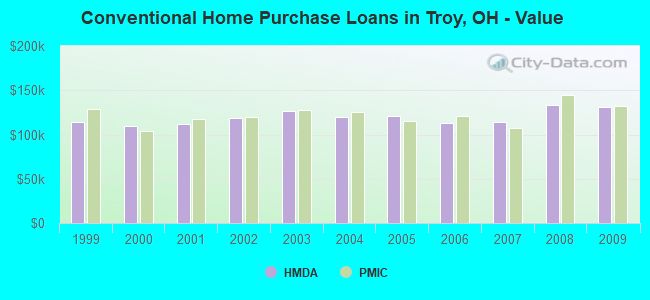
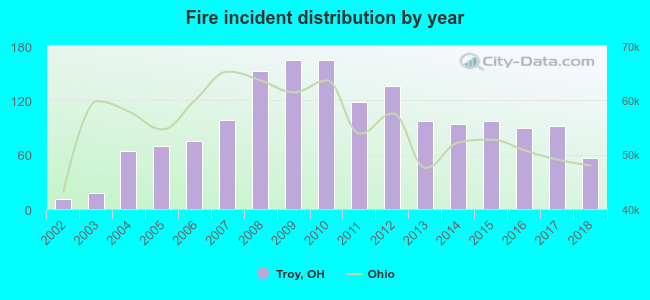 Based on the data from the years 2002 - 2018 the average number of fires per year is 94. The highest number of reported fire incidents - 165 took place in 2009, and the least - 11 in 2002. The data has an increasing trend.
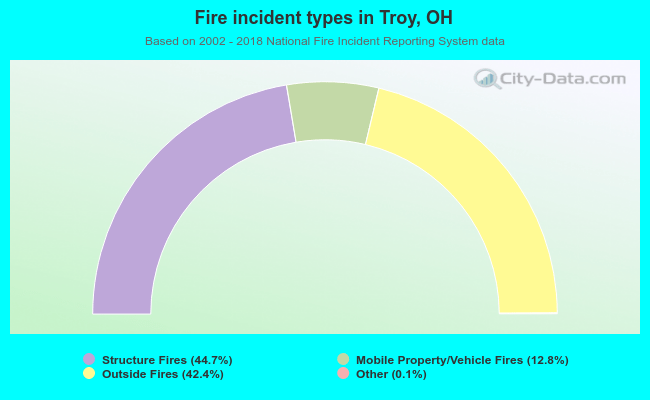 When looking into fire subcategories, the most incidents belonged to: Structure Fires (44.7%), and Outside Fires (42.4%).