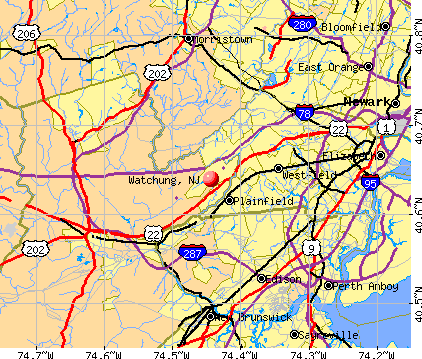
Watchung, New Jersey
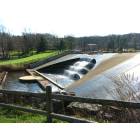
Watchung: The waterfalls at Watchung Circle.

Watchung: Bird Found in the Stream in Middle of Watchung Circle
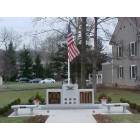
Watchung: Watchung Memorial Center of Watchung Circle
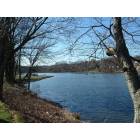
Watchung: A shot of Watchung Lake at an angle few view it at.
- add
your


Submit your own pictures of this borough and show them to the world
- OSM Map
- General Map
- Google Map
- MSN Map
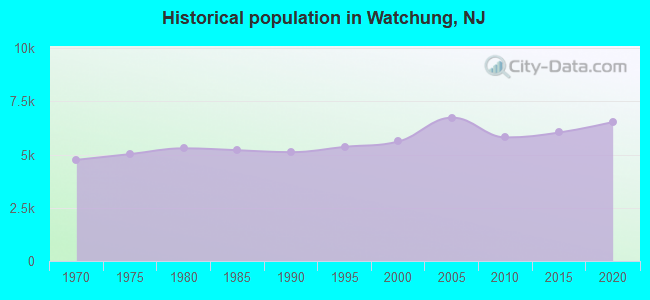
Population change since 2000: +14.5%
 |
| Males: 3,068 | |
| Females: 3,360 |
| Median resident age: | 46.0 years |
| New Jersey median age: | 40.4 years |
Zip codes: 07060.
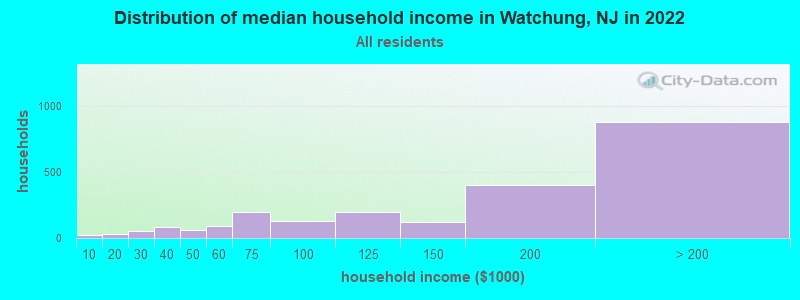
| Watchung: | $161,385 |
| NJ: | $96,346 |
Estimated per capita income in 2022: $73,297 (it was $58,653 in 2000)
Watchung borough income, earnings, and wages data
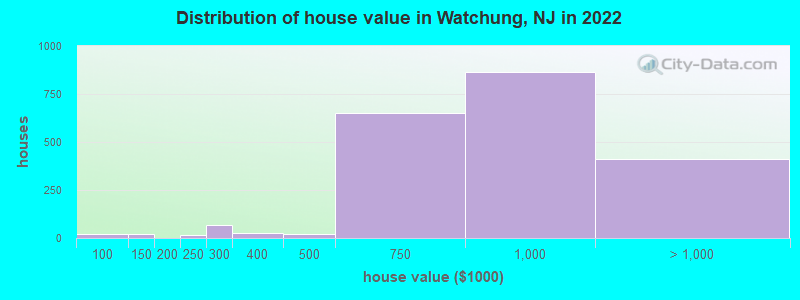
Estimated median house or condo value in 2022: $804,865 (it was $436,100 in 2000)
| Watchung: | $804,865 |
| NJ: | $428,900 |
Mean prices in 2022: all housing units: over $1,000,000; detached houses: over $1,000,000
Median gross rent in 2022: $2,329.
(2.1% for White Non-Hispanic residents, 60.0% for Black residents)
Detailed information about poverty and poor residents in Watchung, NJ

Compare current foreclosures near Watchung, NJ:
| Photo | Address | Area | Beds / Baths | Price | Details |
|---|---|---|---|---|---|

|
#1
Scott Dr
Watchung, NJ 07069
|
2,726 sq. feet
|
- baths - beds |
show details | |

|
#2
Johnston Dr
Watchung, NJ 07069
|
- sq. feet
|
- baths - beds |
show details | |

|
#3
Bonnie Burn Rd
Watchung, NJ 07069
|
- sq. feet
|
- baths - beds |
show details | |

|
#4
Tuttle Rd
Watchung, NJ 07069
|
2,023 sq. feet
|
- baths - beds |
show details | |

|
#5
Stirling Rd
Watchung, NJ 07069
|
- sq. feet
|
- baths - beds |
show details | |

|
#6
Nottingham Dr
Watchung, NJ 07069
|
5,378 sq. feet
|
- baths - beds |
show details | |

|
#7
Valley Rd
Watchung, NJ 07069
|
1,878 sq. feet
|
- baths - beds |
show details | |

|
#8
Hill Hollow Rd
Watchung, NJ 07069
|
2,832 sq. feet
|
- baths - beds |
show details | |

|
#9
Parlin Ln
Watchung, NJ 07069
|
3,458 sq. feet
|
- baths - beds |
show details | |

|
#10
Johnston Dr
Watchung, NJ 07069
|
5,512 sq. feet
|
- baths - beds |
show details |
| Photo | Address | Area | Beds / Baths | Price | Details |
|---|---|---|---|---|---|

|
#11
Stirling Rd
Watchung, NJ 07069
|
1,951 sq. feet
|
- baths - beds |
show details | |

|
#12
Washington Dr
Watchung, NJ 07069
|
3,265 sq. feet
|
- baths - beds |
show details | |

|
#13
Hyde Cir
Watchung, NJ 07069
|
- sq. feet
|
- baths - beds |
show details | |

|
#14
Crystal Ridge Dr
Watchung, NJ 07069
|
- sq. feet
|
- baths - beds |
show details | |

|
#15
Russell St # G
Staten Island, NY 10308
|
642 sq. feet
|
1 baths 1 beds |
$185,000
|
show details |

|
#16
Hazelhurst St
New Brunswick, NJ 08901
|
465 sq. feet
|
1 baths 1 beds |
$325,000
|
show details |

|
#17
Bloomfield Ave
Caldwell, NJ 07006
|
1,216 sq. feet
|
2 baths 2 beds |
$400,000
|
show details |

|
#18
Huntington Rd
Union, NJ 07083
|
1,532 sq. feet
|
2 baths 3 beds |
$539,900
|
show details |

|
#19
S Orange Ave
Newark, NJ 07103
|
989 sq. feet
|
1 baths 2 beds |
$289,900
|
show details |

|
#20
S Beverwyck Rd
Parsippany, NJ 07054
|
895 sq. feet
|
1 baths 3 beds |
$306,800
|
show details |
| Photo | Address | Area | Beds / Baths | Price | Details |
|---|---|---|---|---|---|

|
#21
Catherine St
South Amboy, NJ 08879
|
2,266 sq. feet
|
3 baths 4 beds |
$351,900
|
show details |

|
#22
Ashland Ave
East Orange, NJ 07017
|
2,254 sq. feet
|
1 baths 5 beds |
$272,000
|
show details |

|
#23
Ricky Dr
Basking Ridge, NJ 07920
|
1,853 sq. feet
|
2 baths 3 beds |
$509,600
|
show details |

|
#24
Applegate Ave
Elizabeth, NJ 07202
|
808 sq. feet
|
1 baths 2 beds |
$355,000
|
show details |

|
#25
Claire Dr
Warren, NJ 07059
|
3,001 sq. feet
|
2 baths 3 beds |
$806,000
|
show details |

|
#26
Old Somerset Rd
Watchung, NJ 07069
|
- sq. feet
|
- baths - beds |
show details | |

|
#27
Glen Eagle Dr
Watchung, NJ 07069
|
- sq. feet
|
- baths - beds |
show details | |

|
#28
Gentian Ln
Watchung, NJ 07069
|
- sq. feet
|
- baths - beds |
show details | |

|
#29
Glannon Rd
Livingston, NJ 07039
|
- sq. feet
|
1 baths 3 beds |
$535,600
|
show details |

|
#30
Station Ave
Staten Island, NY 10309
|
- sq. feet
|
1 baths 3 beds |
$679,900
|
show details |
| Photo | Address | Area | Beds / Baths | Price | Details |
|---|---|---|---|---|---|

|
#31
E Woodbridge Ave
Avenel, NJ 07001
|
- sq. feet
|
3 baths 4 beds |
$452,400
|
show details |

|
#32
Cook Ave
Middlesex, NJ 08846
|
- sq. feet
|
1 baths 3 beds |
$244,900
|
show details |

|
#33
Willow Rd W
Staten Island, NY 10314
|
- sq. feet
|
1 baths 3 beds |
$491,400
|
show details |

|
#34
S 8th Ave
Highland Park, NJ 08904
|
- sq. feet
|
2 baths 4 beds |
$379,900
|
show details |

|
#35
N 19th St
East Orange, NJ 07017
|
- sq. feet
|
3 baths 6 beds |
$399,900
|
show details |

|
#36
Blue Ridge Cir
Plainfield, NJ 07060
|
3,100 sq. feet
|
2 baths 4 beds |
show details | |

|
#37
Bloomingdale Ave
Cranford, NJ 07016
|
1,800 sq. feet
|
2 baths 4 beds |
show details | |

|
#38
S Main St
Milltown, NJ 08850
|
1,374 sq. feet
|
2 baths 3 beds |
show details | |

|
#39
Wick Dr
Fords, NJ 08863
|
1,723 sq. feet
|
3 baths 3 beds |
show details | |

|
#40
Schley St
Newark, NJ 07112
|
1,290 sq. feet
|
1 baths 3 beds |
show details |
| Photo | Address | Area | Beds / Baths | Price | Details |
|---|---|---|---|---|---|

|
#41
Rigimar Ct
Staten Island, NY 10309
|
2,600 sq. feet
|
3 baths 5 beds |
show details | |

|
#42
Mildred Ave
Linden, NJ 07036
|
783 sq. feet
|
2 baths 4 beds |
show details | |

|
#43
Lehigh Ave
Newark, NJ 07112
|
2,582 sq. feet
|
1 baths 3 beds |
show details | |

|
#44
Waverly Dr W
Edison, NJ 08817
|
1,947 sq. feet
|
2 baths 4 beds |
show details | |

|
#45
10th St
Bayonne, NJ 07002
|
1,850 sq. feet
|
3 baths 6 beds |
show details | |

|
#46
Kerrigan Blvd
Newark, NJ 07106
|
1,322 sq. feet
|
1 baths 3 beds |
show details | |

|
#47
1st St
Dunellen, NJ 08812
|
1,245 sq. feet
|
1 baths 3 beds |
show details | |

|
#48
Olive St
Bloomfield, NJ 07003
|
1,826 sq. feet
|
2 baths 5 beds |
show details | |

|
#49
Roosevelt St
Roselle Park, NJ 07204
|
1,796 sq. feet
|
2 baths 4 beds |
show details | |

|
Check over 1 million property listings on Foreclosure.com!
|
browse all offers | |||


- 4,58271.0%White alone
- 92414.3%Asian alone
- 4957.7%Hispanic
- 3765.8%Two or more races
- 150.2%Black alone
- 160.2%Other race alone
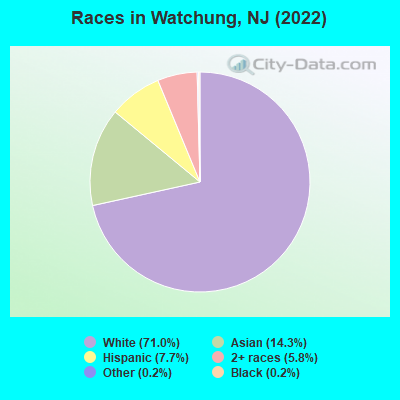
Races in Watchung detailed stats: ancestries, foreign born residents, place of birth
Type |
2009 |
2010 |
2011 |
2012 |
2013 |
2014 |
2015 |
2016 |
2017 |
2018 |
2019 |
2020 |
2021 |
2022 |
|---|---|---|---|---|---|---|---|---|---|---|---|---|---|---|
| Murders (per 100,000) | 0 (0.0) | 0 (0.0) | 0 (0.0) | 0 (0.0) | 0 (0.0) | 0 (0.0) | 0 (0.0) | 0 (0.0) | 0 (0.0) | 0 (0.0) | 0 (0.0) | 0 (0.0) | 0 (0.0) | 0 (0.0) |
| Rapes (per 100,000) | 0 (0.0) | 1 (17.2) | 0 (0.0) | 0 (0.0) | 0 (0.0) | 0 (0.0) | 1 (17.0) | 0 (0.0) | 1 (16.6) | 0 (0.0) | 0 (0.0) | 0 (0.0) | 0 (0.0) | 0 (0.0) |
| Robberies (per 100,000) | 2 (29.8) | 2 (34.5) | 2 (34.4) | 2 (34.1) | 5 (85.6) | 4 (68.1) | 3 (51.1) | 1 (16.9) | 0 (0.0) | 1 (16.8) | 0 (0.0) | 0 (0.0) | 1 (15.9) | 0 (0.0) |
| Assaults (per 100,000) | 1 (14.9) | 1 (17.2) | 3 (51.5) | 0 (0.0) | 1 (17.1) | 4 (68.1) | 3 (51.1) | 0 (0.0) | 0 (0.0) | 0 (0.0) | 1 (16.5) | 0 (0.0) | 1 (15.9) | 4 (61.8) |
| Burglaries (per 100,000) | 13 (193.5) | 21 (362.0) | 26 (446.7) | 21 (358.5) | 13 (222.5) | 17 (289.2) | 5 (85.1) | 12 (202.5) | 26 (432.6) | 17 (286.2) | 13 (214.7) | 11 (182.8) | 11 (175.2) | 22 (340.1) |
| Thefts (per 100,000) | 327 (4,866) | 309 (5,327) | 356 (6,117) | 306 (5,225) | 358 (6,126) | 322 (5,478) | 352 (5,991) | 392 (6,616) | 334 (5,557) | 374 (6,297) | 301 (4,972) | 257 (4,271) | 247 (3,933) | 253 (3,912) |
| Auto thefts (per 100,000) | 2 (29.8) | 3 (51.7) | 7 (120.3) | 10 (170.7) | 3 (51.3) | 4 (68.1) | 6 (102.1) | 7 (118.1) | 6 (99.8) | 4 (67.4) | 6 (99.1) | 3 (49.9) | 18 (286.6) | 14 (216.5) |
| Arson (per 100,000) | 0 (0.0) | 0 (0.0) | 0 (0.0) | 0 (0.0) | 0 (0.0) | 0 (0.0) | 1 (17.0) | 0 (0.0) | 0 (0.0) | 0 (0.0) | 0 (0.0) | 0 (0.0) | 0 (0.0) | 0 (0.0) |
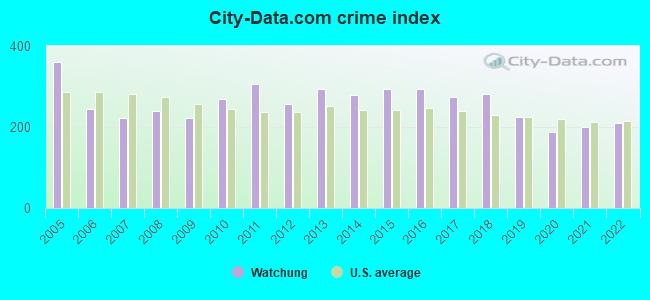
| City-Data.com crime index | 222.5 | 270.1 | 306.2 | 258.0 | 293.8 | 278.8 | 292.9 | 293.3 | 273.9 | 282.4 | 225.1 | 187.6 | 200.5 | 210.0 |
The City-Data.com crime index weighs serious crimes and violent crimes more heavily. Higher means more crime, U.S. average is 246.1. It adjusts for the number of visitors and daily workers commuting into cities.
Crime rate in Watchung detailed stats: murders, rapes, robberies, assaults, burglaries, thefts, arson
Full-time law enforcement employees in 2021, including police officers: 35 (29 officers - 27 male; 2 female).
| Officers per 1,000 residents here: | 4.62 |
| New Jersey average: | 5.53 |
 Recent articles from our blog. Our writers, many of them Ph.D. graduates or candidates, create easy-to-read articles on a wide variety of topics.


 | Need Recommendation - Watchung NJ Buying a House (0 replies) |
| Would you rather commute to NYC for work or another town in NJ? (55 replies) |
| Living near Weldon Quarry in Watchung and well water (11 replies) |
| Montclair - Watchung Station/Edgemont Park Area? (4 replies) |
| Watchung Sears Park n Ride is Closing (7 replies) |
| Moving to NJ from Arizona. Need tips (29 replies) |
Latest news from Watchung, NJ collected exclusively by city-data.com from local newspapers, TV, and radio stations
Ancestries: Italian (17.8%), Irish (10.0%), Polish (9.5%), Portuguese (6.6%), Russian (3.8%), Eastern European (3.7%).
Current Local Time: EST time zone
Incorporated in 1926
Elevation: 181 feet
Land area: 6.02 square miles.
Population density: 1,068 people per square mile (low).
1,325 residents are foreign born (6.9% Asia, 6.7% Latin America, 5.4% Europe).
| This borough: | 20.5% |
| New Jersey: | 23.2% |
Median real estate property taxes paid for housing units with mortgages in 2022: $9,833 (1.1%)
Median real estate property taxes paid for housing units with no mortgage in 2022: $9,838 (1.3%)
Nearest city with pop. 50,000+: Edison, NJ  (7.8 miles , pop. 97,687).
Nearest city with pop. 200,000+: Newark, NJ (15.1 miles , pop. 273,546).
Nearest city with pop. 1,000,000+: Brooklyn, NY (25.8 miles , pop. 2,465,326).
Nearest cities:
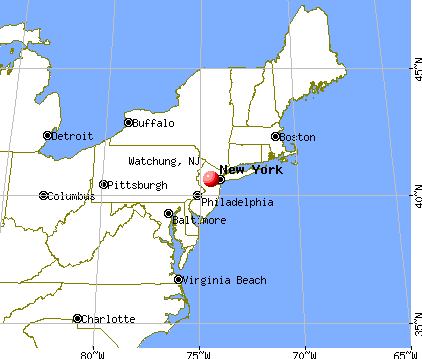
), ), )Latitude: 40.64 N, Longitude: 74.44 W
Daytime population change due to commuting: +2,781 (+43.1%)
Workers who live and work in this borough: 1,298 (39.6%)
Area code commonly used in this area: 908

Watchung, New Jersey accommodation & food services, waste management - Economy and Business Data
| Here: | 3.8% |
| New Jersey: | 4.5% |
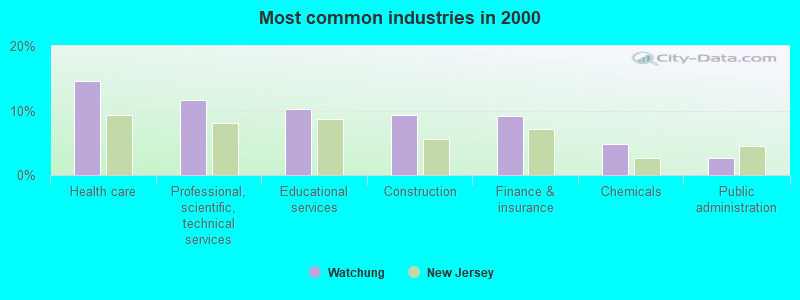
- Health care (14.5%)
- Professional, scientific, technical services (11.6%)
- Educational services (10.2%)
- Construction (9.3%)
- Finance & insurance (9.1%)
- Chemicals (4.8%)
- Public administration (2.7%)
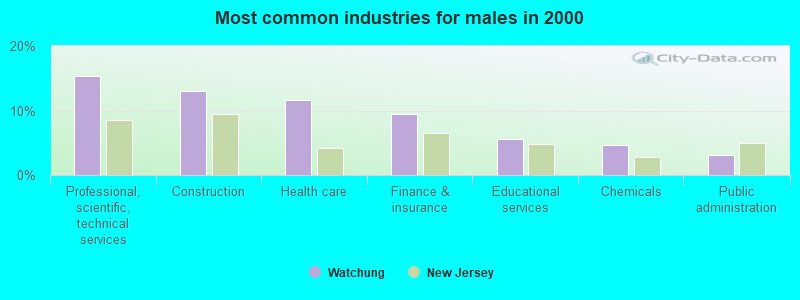
- Professional, scientific, technical services (15.4%)
- Construction (13.0%)
- Health care (11.7%)
- Finance & insurance (9.4%)
- Educational services (5.6%)
- Chemicals (4.6%)
- Public administration (3.1%)
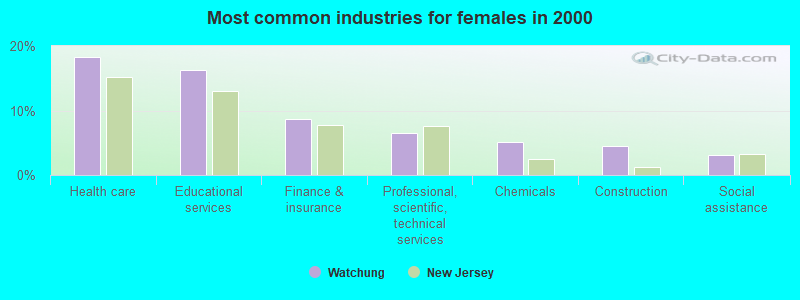
- Health care (18.4%)
- Educational services (16.3%)
- Finance & insurance (8.7%)
- Professional, scientific, technical services (6.5%)
- Chemicals (5.1%)
- Construction (4.5%)
- Social assistance (3.1%)
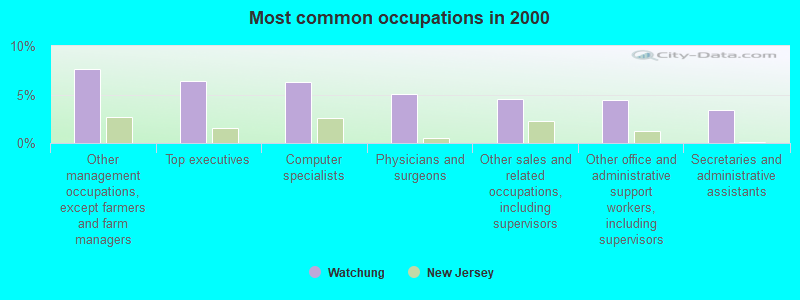
- Other management occupations, except farmers and farm managers (7.6%)
- Top executives (6.3%)
- Computer specialists (6.3%)
- Physicians and surgeons (5.0%)
- Other sales and related occupations, including supervisors (4.5%)
- Other office and administrative support workers, including supervisors (4.4%)
- Secretaries and administrative assistants (3.4%)
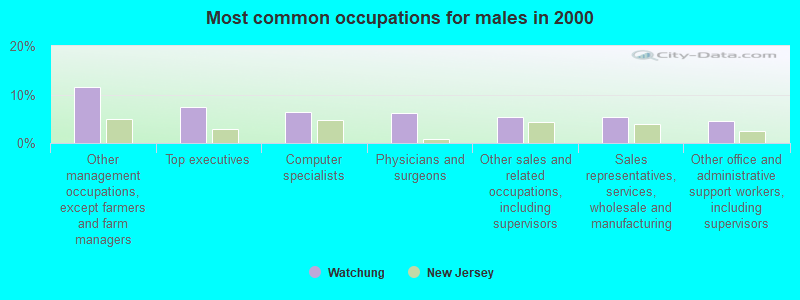
- Other management occupations, except farmers and farm managers (11.6%)
- Top executives (7.3%)
- Computer specialists (6.3%)
- Physicians and surgeons (6.2%)
- Other sales and related occupations, including supervisors (5.4%)
- Sales representatives, services, wholesale and manufacturing (5.4%)
- Other office and administrative support workers, including supervisors (4.4%)

- Secretaries and administrative assistants (6.8%)
- Computer specialists (6.3%)
- Preschool, kindergarten, elementary, and middle school teachers (5.9%)
- Top executives (5.0%)
- Registered nurses (5.0%)
- Other office and administrative support workers, including supervisors (4.3%)
- Counselors, social workers, and other community and social service specialists (4.1%)
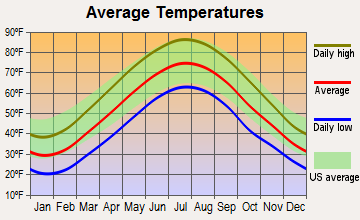
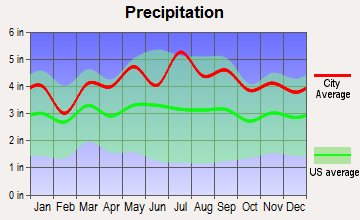
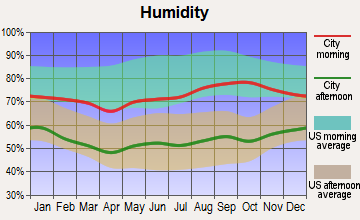
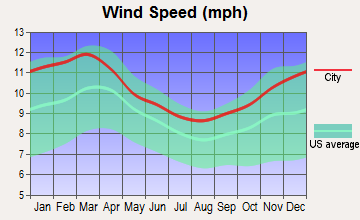
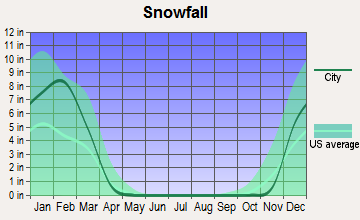
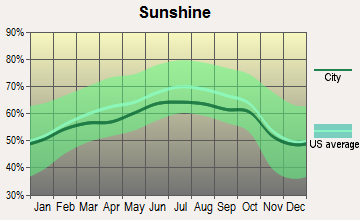
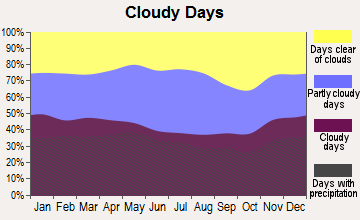
Average climate in Watchung, New Jersey
Based on data reported by over 4,000 weather stations
|
|


(lower is better)
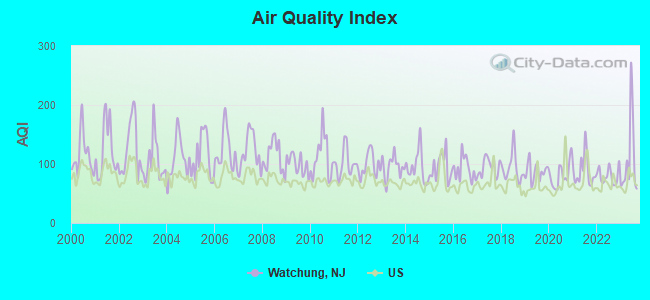
Air Quality Index (AQI) level in 2023 was 107. This is significantly worse than average.
| City: | 107 |
| U.S.: | 73 |
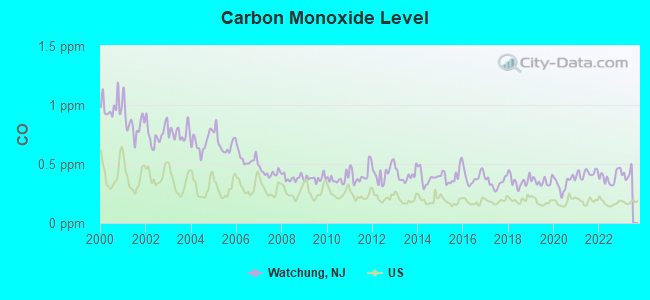
Carbon Monoxide (CO) [ppm] level in 2022 was 0.386. This is significantly worse than average. Closest monitor was 9.9 miles away from the city center.
| City: | 0.386 |
| U.S.: | 0.251 |
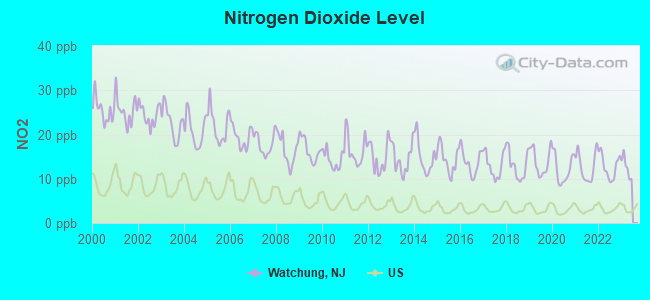
Nitrogen Dioxide (NO2) [ppb] level in 2022 was 12.8. This is significantly worse than average. Closest monitor was 2.6 miles away from the city center.
| City: | 12.8 |
| U.S.: | 5.1 |
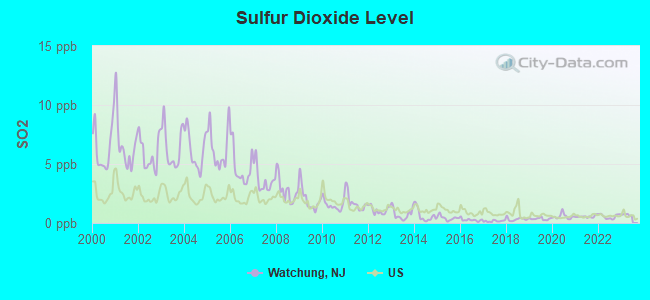
Sulfur Dioxide (SO2) [ppb] level in 2022 was 0.553. This is significantly better than average. Closest monitor was 2.6 miles away from the city center.
| City: | 0.553 |
| U.S.: | 1.515 |
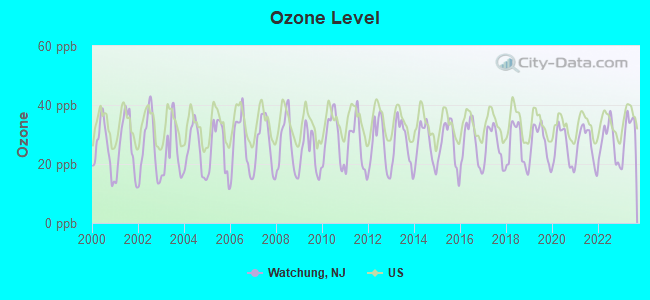
Ozone [ppb] level in 2023 was 31.1. This is about average. Closest monitor was 2.6 miles away from the city center.
| City: | 31.1 |
| U.S.: | 33.3 |
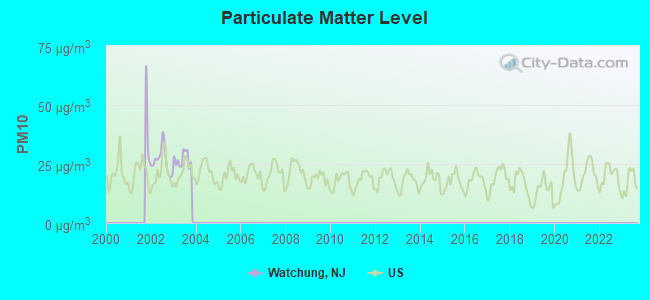
Particulate Matter (PM10) [µg/m3] level in 2003 was 26.9. This is worse than average. Closest monitor was 13.5 miles away from the city center.
| City: | 26.9 |
| U.S.: | 19.2 |
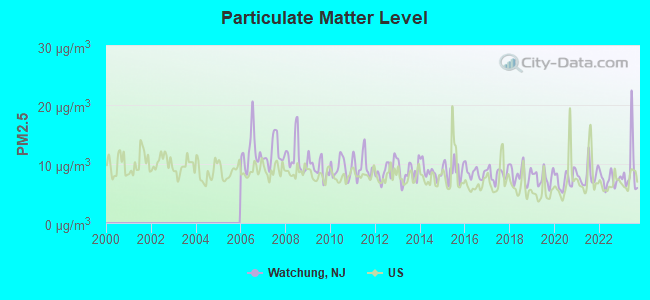
Particulate Matter (PM2.5) [µg/m3] level in 2023 was 9.11. This is about average. Closest monitor was 9.1 miles away from the city center.
| City: | 9.11 |
| U.S.: | 8.11 |
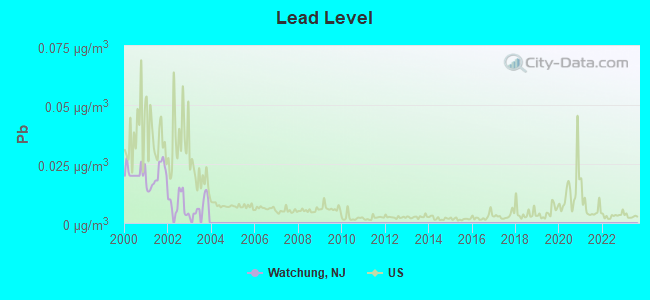
Lead (Pb) [µg/m3] level in 2003 was 0.00543. This is significantly better than average. Closest monitor was 9.9 miles away from the city center.
| City: | 0.00543 |
| U.S.: | 0.00931 |
Tornado activity:
Watchung-area historical tornado activity is near New Jersey state average. It is 28% smaller than the overall U.S. average.
On 5/28/1973, a category F3 (max. wind speeds 158-206 mph) tornado 11.5 miles away from the Watchung borough center caused between $50,000 and $500,000 in damages.
On 10/18/1990, a category F3 tornado 20.4 miles away from the borough center injured 8 people and caused between $500,000 and $5,000,000 in damages.
Earthquake activity:
Watchung-area historical earthquake activity is significantly above New Jersey state average. It is 68% smaller than the overall U.S. average.On 8/23/2011 at 17:51:04, a magnitude 5.8 (5.8 MW, Depth: 3.7 mi, Class: Moderate, Intensity: VI - VII) earthquake occurred 265.7 miles away from the city center
On 1/16/1994 at 01:49:16, a magnitude 4.6 (4.6 MB, 4.6 LG, Depth: 3.1 mi, Class: Light, Intensity: IV - V) earthquake occurred 86.5 miles away from the city center
On 10/7/1983 at 10:18:46, a magnitude 5.3 (5.1 MB, 5.3 LG, 5.1 ML) earthquake occurred 229.3 miles away from the city center
On 4/20/2002 at 10:50:47, a magnitude 5.3 (5.3 ML, Depth: 3.0 mi) earthquake occurred 270.6 miles away from the city center
On 4/20/2002 at 10:50:47, a magnitude 5.2 (5.2 MB, 4.2 MS, 5.2 MW, 5.0 MW) earthquake occurred 268.7 miles away from Watchung center
On 1/16/1994 at 00:42:43, a magnitude 4.2 (4.2 MB, 4.0 LG, Depth: 3.1 mi) earthquake occurred 85.0 miles away from the city center
Magnitude types: regional Lg-wave magnitude (LG), body-wave magnitude (MB), local magnitude (ML), surface-wave magnitude (MS), moment magnitude (MW)
Natural disasters:
The number of natural disasters in Somerset County (27) is a lot greater than the US average (15).Major Disasters (Presidential) Declared: 17
Emergencies Declared: 9
Causes of natural disasters: Floods: 7, Hurricanes: 7, Storms: 6, Heavy Rains: 4, Snowstorms: 4, Winter Storms: 3, Blizzards: 2, Water Shortages: 2, Tornado: 1, Wind: 1, Other: 3 (Note: some incidents may be assigned to more than one category).

Hospitals and medical centers in Watchung:
Other hospitals and medical centers near Watchung:
- ARISTACARE AT NORWOOD TERRACE (Nursing Home, about 2 miles away; PLAINFIELD, NJ)
- VILLA MARIA (Nursing Home, about 2 miles away; NORTH PLAINFIELD, NJ)
- RUNNELLS SPECIALIZED HOSPITAL (Nursing Home, about 3 miles away; BERKELEY HEIGHTS, NJ)
- GREENBROOK MANOR CARE AND REHABILITATION CENTER (Nursing Home, about 3 miles away; GREEN BROOK, NJ)
- ABBOTT MANOR CONVALESCENT CENTER (Nursing Home, about 3 miles away; PLAINFIELD, NJ)
- BERKELEY HEIGHTS NURSING AND REHABILITATION CENTER (Nursing Home, about 3 miles away; BERKELEY HEIGHTS, NJ)
- DVA PLAINFIELD DIALYSIS CENTER (Dialysis Facility, about 3 miles away; PLAINFIELD, NJ)
Amtrak stations near Watchung:
- 8 miles: METROPARK (ISELIN, 100 MIDDLESEX-ESSEX TPK.) . Services: ticket office, fully wheelchair accessible, enclosed waiting area, public restrooms, public payphones, paid short-term parking, call for car rental service, taxi stand, public transit connection.
- 10 miles: NEW BRUNSWICK (FRENCH & ALBANY STS.) . Services: ticket office, fully wheelchair accessible, enclosed waiting area, public restrooms, public payphones, snack bar, ATM, free short-term parking, free long-term parking, call for car rental service, taxi stand, public transit connection.
- 14 miles: NEWARK INTERNATIONAL AIRPORT (NEWARK, ) . Services: ticket office, enclosed waiting area, public restrooms, public payphones.
Colleges/universities with over 2000 students nearest to Watchung:
- Union County College (about 7 miles; Cranford, NJ; Full-time enrollment: 9,148)
- Drew University (about 9 miles; Madison, NJ; FT enrollment: 2,272)
- Rutgers University-New Brunswick (about 10 miles; New Brunswick, NJ; FT enrollment: 39,388)
- Fairleigh Dickinson University-College at Florham (about 10 miles; Madison, NJ; FT enrollment: 2,690)
- Middlesex County College (about 11 miles; Edison, NJ; FT enrollment: 9,849)
- Kean University (about 12 miles; Union, NJ; FT enrollment: 12,648)
- Seton Hall University (about 13 miles; South Orange, NJ; FT enrollment: 7,742)
Public elementary/middle schools in Watchung:
- BAYBERRY SCHOOL (Students: 381, Location: BAYBERRY LANE, Grades: PK-4)
- VALLEY VIEW SCHOOL (Students: 301, Location: 50 VALLEY VIEW ROAD, Grades: 5-8)
Points of interest:
Notable locations in Watchung: Twin Brooks Golf Course (A), Camp Elsinore (B), Camp Endeavor (C), Watchung Rescue Squad (D), Watchung Volunteer Fire Department (E). Display/hide their locations on the map
Shopping Center: Blue Star Shopping Center (1). Display/hide its location on the map
Churches in Watchung include: Saint Mary's Roman Catholic Church (A), Wilson Memorial Union Church (B). Display/hide their locations on the map
Cemetery: North Plainfield Burying Ground (1). Display/hide its location on the map
Lakes and reservoirs: Best Lake (A), Watchung Lake (B). Display/hide their locations on the map
Birthplace of: Laura Prepon - Actress, Harold Norman Moldenke - Botanist.
| This borough: | 2.7 people |
| New Jersey: | 2.7 people |
| This borough: | 76.3% |
| Whole state: | 69.3% |
| This borough: | 4.1% |
| Whole state: | 5.9% |
Likely homosexual households (counted as self-reported same-sex unmarried-partner households)
- Lesbian couples: 0.7% of all households
- Gay men: 0.4% of all households
People in group quarters in Watchung in 2010:
- 69 people in nursing facilities/skilled-nursing facilities
- 45 people in other noninstitutional facilities
- 4 people in group homes intended for adults
58 people in religious group quarters in 2000
Banks with branches in Watchung (2011 data):
- JPMorgan Chase Bank, National Association: Watchung Branch at 1605 Us Hwy 22, branch established on 2008/05/08; Watching Circle Banking Center at 60 Stirling Road, branch established on 2011/10/26. Info updated 2011/11/10: Bank assets: $1,811,678.0 mil, Deposits: $1,190,738.0 mil, headquarters in Columbus, OH, positive income, International Specialization, 5577 total offices, Holding Company: Jpmorgan Chase & Co.
- PNC Bank, National Association: Watchung @ Stop & Shop Branch at 1511 Route 22 West, Suite 6, branch established on 2004/05/04. Info updated 2012/03/20: Bank assets: $263,309.6 mil, Deposits: $197,343.0 mil, headquarters in Wilmington, DE, positive income, Commercial Lending Specialization, 3085 total offices, Holding Company: Pnc Financial Services Group, Inc., The
For population 15 years and over in Watchung:
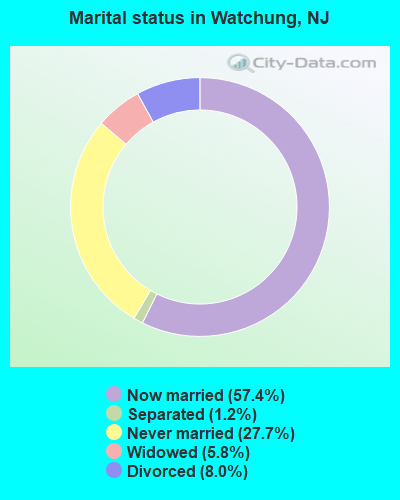
- Never married: 27.7%
- Now married: 57.4%
- Separated: 1.2%
- Widowed: 5.8%
- Divorced: 8.0%
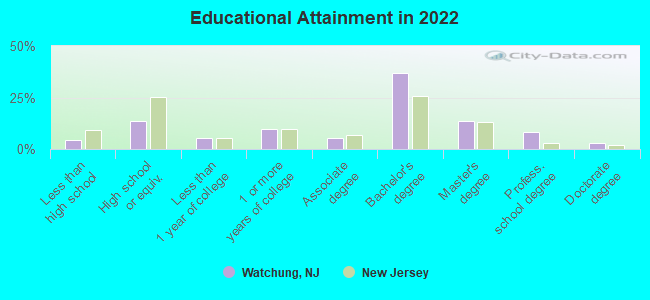
For population 25 years and over in Watchung:
- High school or higher: 95.6%
- Bachelor's degree or higher: 60.3%
- Graduate or professional degree: 25.0%
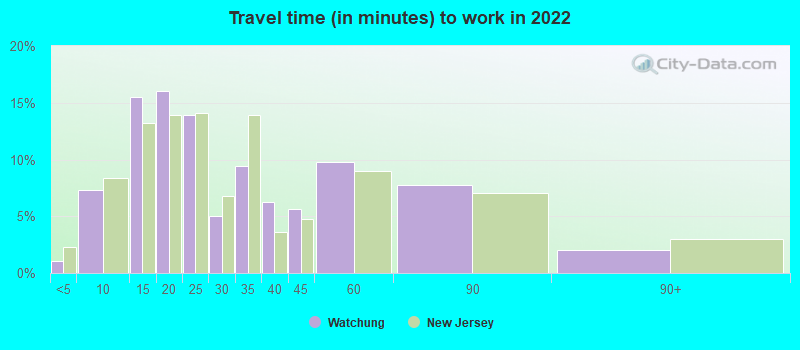
- Unemployed: 3.7%
- Mean travel time to work (commute): 20.9 minutes
| Here: | 9.6 |
| New Jersey average: | 12.8 |
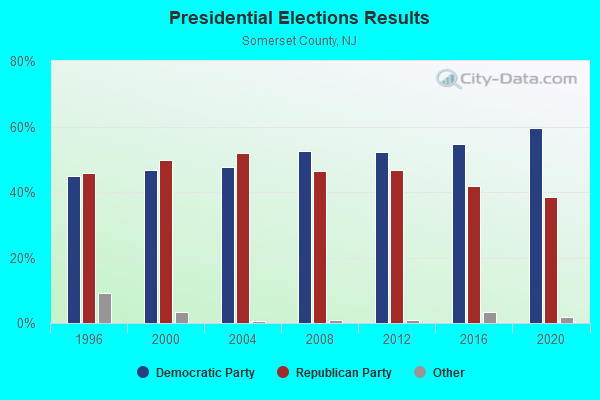
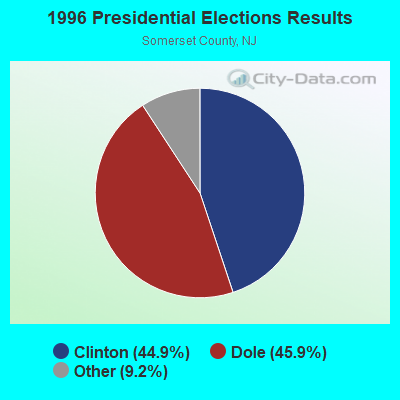
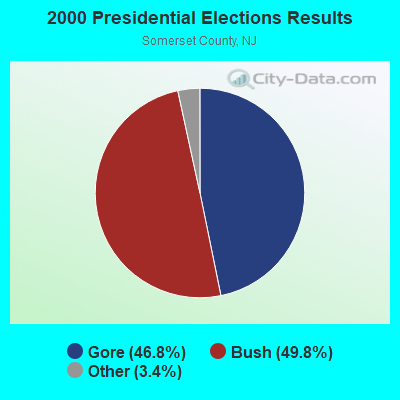
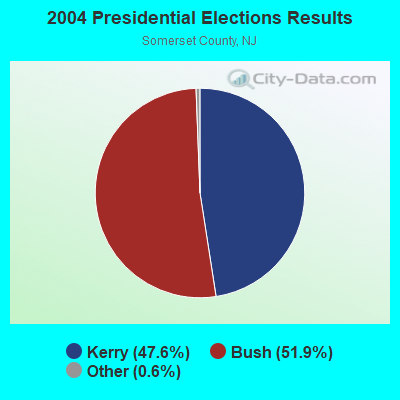
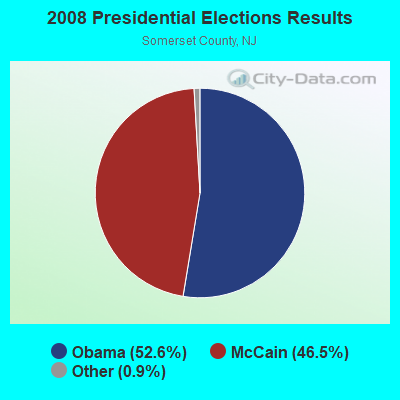
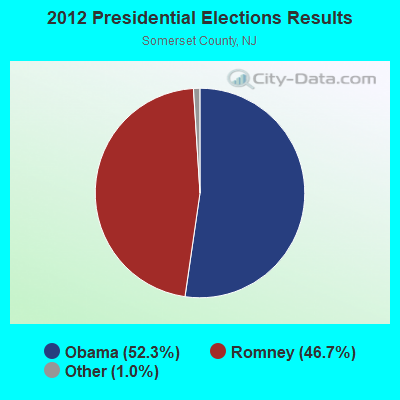
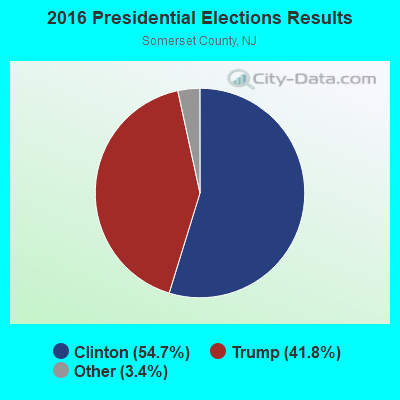
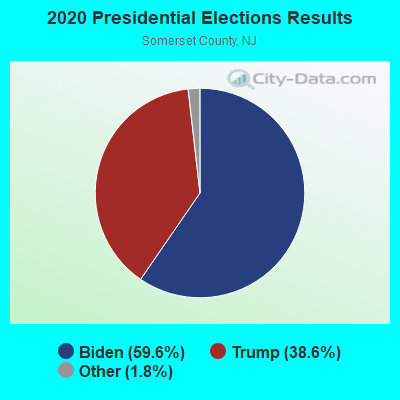
Graphs represent county-level data. Detailed 2008 Election Results
Religion statistics for Watchung, NJ (based on Somerset County data)
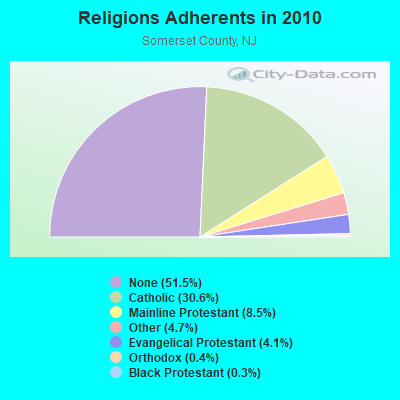
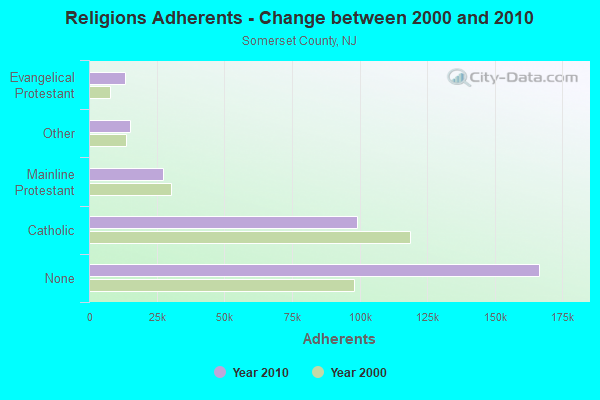
| Religion | Adherents | Congregations |
|---|---|---|
| Catholic | 98,951 | 29 |
| Mainline Protestant | 27,472 | 68 |
| Other | 15,078 | 33 |
| Evangelical Protestant | 13,158 | 53 |
| Orthodox | 1,200 | 6 |
| Black Protestant | 1,076 | 7 |
| None | 166,509 | - |
Food Environment Statistics:
| Somerset County: | 2.14 / 10,000 pop. |
| New Jersey: | 2.90 / 10,000 pop. |
| Somerset County: | 0.09 / 10,000 pop. |
| New Jersey: | 0.06 / 10,000 pop. |
| This county: | 1.65 / 10,000 pop. |
| New Jersey: | 1.76 / 10,000 pop. |
| Somerset County: | 0.56 / 10,000 pop. |
| New Jersey: | 0.81 / 10,000 pop. |
| Somerset County: | 7.96 / 10,000 pop. |
| New Jersey: | 7.15 / 10,000 pop. |
| Here: | 6.7% |
| New Jersey: | 8.3% |
| Somerset County: | 20.4% |
| New Jersey: | 23.3% |
| Somerset County: | 24.0% |
| New Jersey: | 18.0% |
Health and Nutrition:
| This city: | 57.1% |
| New Jersey: | 50.6% |
| This city: | 55.9% |
| State: | 48.5% |
| Watchung: | 27.8 |
| New Jersey: | 28.5 |
| Watchung: | 17.5% |
| State: | 20.0% |
| Watchung: | 9.5% |
| New Jersey: | 11.1% |
| Watchung: | 7.0 |
| New Jersey: | 6.8 |
| Watchung: | 34.1% |
| New Jersey: | 33.6% |
| This city: | 62.2% |
| New Jersey: | 56.9% |
| Here: | 80.1% |
| New Jersey: | 80.0% |
More about Health and Nutrition of Watchung, NJ Residents
| Local government employment and payroll (March 2022) | |||||
| Function | Full-time employees | Monthly full-time payroll | Average yearly full-time wage | Part-time employees | Monthly part-time payroll |
|---|---|---|---|---|---|
| Police Protection - Officers | 31 | $288,396 | $111,637 | 0 | $0 |
| Police - Other | 7 | $35,782 | $61,341 | 0 | $0 |
| Streets and Highways | 6 | $33,846 | $67,692 | 0 | $0 |
| Financial Administration | 3 | $19,658 | $78,632 | 2 | $8,664 |
| Other Government Administration | 3 | $18,424 | $73,696 | 9 | $10,574 |
| Housing and Community Development (Local) | 0 | $0 | 3 | $7,128 | |
| Judicial and Legal | 0 | $0 | 1 | $3,699 | |
| Other and Unallocable | 0 | $0 | 1 | $2,528 | |
| Totals for Government | 50 | $396,106 | $95,065 | 16 | $32,593 |
Watchung government finances - Expenditure in 2017 (per resident):
- Construction - Regular Highways: $400,000 ($62.23)
Police Protection: $100,000 ($15.56)
- Current Operations - General - Other: $115,284,000 ($17934.66)
Police Protection: $3,783,000 ($588.52)
Regular Highways: $609,000 ($94.74)
Central Staff Services: $598,000 ($93.03)
General Public Buildings: $472,000 ($73.43)
Judicial and Legal Services: $298,000 ($46.36)
Protective Inspection and Regulation - Other: $194,000 ($30.18)
Financial Administration: $190,000 ($29.56)
Health - Other: $117,000 ($18.20)
Sewerage: $112,000 ($17.42)
Local Fire Protection: $103,000 ($16.02)
Parks and Recreation: $29,000 ($4.51)
Libraries: $26,000 ($4.04)
Natural Resources - Other: $1,000 ($0.16)
- General - Interest on Debt: $874,000 ($135.97)
- Intergovernmental to Local - Other - Judicial and Legal Services: $67,000 ($10.42)
Other - Public Welfare - Other: $2,000 ($0.31)
- Total Salaries and Wages: $4,796,000 ($746.11)
Watchung government finances - Revenue in 2017 (per resident):
- Charges - Sewerage: $1,237,000 ($192.44)
Parks and Recreation: $4,000 ($0.62)
- Miscellaneous - General Revenue - Other: $1,479,000 ($230.09)
Special Assessments: $232,000 ($36.09)
Fines and Forfeits: $204,000 ($31.74)
Rents: $101,000 ($15.71)
Interest Earnings: $0 ($0.00)
- State Intergovernmental - Highways: $200,000 ($31.11)
Public Welfare: $60,000 ($9.33)
- Tax - Property: $9,913,000 ($1542.16)
Watchung government finances - Debt in 2017 (per resident):
- Long Term Debt - Beginning Outstanding - Unspecified Public Purpose: $21,842,000 ($3397.95)
Outstanding Unspecified Public Purpose: $21,626,000 ($3364.34)
Retired Unspecified Public Purpose: $1,261,000 ($196.17)
Issue, Unspecified Public Purpose: $1,046,000 ($162.73)
| Businesses in Watchung, NJ | ||||
| Name | Count | Name | Count | |
|---|---|---|---|---|
| AT&T | 1 | New Balance | 1 | |
| Arby's | 1 | Nike | 6 | |
| Avenue | 1 | Old Country Buffet | 1 | |
| Baja Fresh Mexican Grill | 1 | Old Navy | 1 | |
| Baskin-Robbins | 1 | Panera Bread | 1 | |
| Bed Bath & Beyond | 1 | PetSmart | 1 | |
| Buffalo Wild Wings | 1 | Pier 1 Imports | 1 | |
| DressBarn | 1 | Quiznos | 1 | |
| Dressbarn | 1 | RadioShack | 1 | |
| Dunkin Donuts | 1 | Raymour & Flanigan | 1 | |
| Famous Footwear | 1 | Sears | 2 | |
| FedEx | 4 | Staples | 1 | |
| Foot Locker | 1 | Stop & Shop | 1 | |
| Ford | 1 | Subway | 2 | |
| GNC | 1 | T-Mobile | 3 | |
| GameStop | 2 | T.G.I. Driday's | 1 | |
| H&R Block | 1 | T.J.Maxx | 1 | |
| Home Depot | 1 | Target | 1 | |
| Kohl's | 1 | Toys"R"Us | 1 | |
| La-Z-Boy | 1 | UPS | 3 | |
| Lane Furniture | 1 | Verizon Wireless | 2 | |
| LensCrafters | 1 | Walmart | 1 | |
| Marshalls | 1 | Wendy's | 1 | |
Strongest AM radio stations in Watchung:
- WMCA (570 AM; 50 kW; NEW YORK, NY; Owner: SALEM MEDIA OF NEW YORK, LLC)
- WOR (710 AM; 50 kW; NEW YORK, NY; Owner: BUCKLEY BROADCASTING CORPORATION)
- WINS (1010 AM; 50 kW; NEW YORK, NY; Owner: INFINITY BROADCASTING OPERATIONS, INC.)
- WABC (770 AM; 50 kW; NEW YORK, NY; Owner: WABC-AM RADIO, INC.)
- WEPN (1050 AM; 50 kW; NEW YORK, NY; Owner: NEW YORK AM RADIO, LLC)
- WBBR (1130 AM; 50 kW; NEW YORK, NY; Owner: BLOOMBERG COMMUNICATIONS INC.)
- WADO (1280 AM; 50 kW; NEW YORK, NY; Owner: WADO-AM LICENSE CORP.)
- WSNR (620 AM; 20 kW; JERSEY CITY, NJ)
- WJDM (1530 AM; 10 kW; ELIZABETH, NJ; Owner: RADIO UNICA OF NEW YORK LICENSE CORP)
- WLIB (1190 AM; 30 kW; NEW YORK, NY; Owner: ICBC BROADCAST HOLDINGS-NY, INC.)
- WFAN (660 AM; 50 kW; NEW YORK, NY; Owner: INFINITY BROADCASTING OPERATIONS, INC.)
- WQEW (1560 AM; 50 kW; NEW YORK, NY; Owner: THE NEW YORK TIMES ELECTRONIC MEDIA COMPANY)
- WCBS (880 AM; 50 kW; NEW YORK, NY; Owner: INFINITY BROADCASTING OPERATIONS, INC.)
Strongest FM radio stations in Watchung:
- WAWZ (99.1 FM; ZAREPHATH, NJ; Owner: PILLAR OF FIRE)
- WRKS (98.7 FM; NEW YORK, NY; Owner: EMMIS RADIO LICENSE CORP OF NEW YORK)
- WNEW (102.7 FM; NEW YORK, NY; Owner: INFINITY BROADCASTING OPERATIONS, INC.)
- WNYC-FM (93.9 FM; NEW YORK, NY; Owner: WNYC RADIO)
- WPAT-FM (93.1 FM; PATERSON, NJ; Owner: WPAT LICENSING, INC.)
- WMGQ (98.3 FM; NEW BRUNSWICK, NJ; Owner: THE SENTINEL PUBLISHING CO.)
- WQCD (101.9 FM; NEW YORK, NY; Owner: EMMIS RADIO LICENSE CORPORATION)
- WKTU (103.5 FM; LAKE SUCCESS, NY; Owner: AMFM RADIO LICENSES, LLC)
- WCAA (105.9 FM; NEWARK, NJ; Owner: WADO-AM LICENSE CORP. ("WADO"))
- WBAI (99.5 FM; NEW YORK, NY; Owner: PACIFICA FOUNDATION, INC.)
- WBLS (107.5 FM; NEW YORK, NY; Owner: ICBC BROADCAST HOLDINGS-NY, INC.)
- WLTW (106.7 FM; NEW YORK, NY; Owner: AMFM NEW YORK LICENSES, LLC)
- WQXR-FM (96.3 FM; NEW YORK, NY; Owner: THE NEW YORK TIMES ELECTRONIC MEDIA COMPANY)
- WSKQ-FM (97.9 FM; NEW YORK, NY; Owner: WSKQ LICENSING, INC.)
- WXRK (92.3 FM; NEW YORK, NY; Owner: INFINITY BROADCASTING OPERATIONS, INC.)
- WAXQ (104.3 FM; NEW YORK, NY; Owner: AMFM NEW YORK LICENSES, LLC)
- WHTZ (100.3 FM; NEWARK, NJ; Owner: AMFM RADIO LICENSES, L.L.C.)
- WWPR-FM (105.1 FM; NEW YORK, NY; Owner: AMFM RADIO LICENSES, L.L.C.)
- WQHT (97.1 FM; NEW YORK, NY; Owner: EMMIS LICENSE CORPORATION OF NEW YORK)
- WCBS-FM (101.1 FM; NEW YORK, NY; Owner: INFINITY BROADCASTING OPERATIONS, INC.)
TV broadcast stations around Watchung:
- WNJB (Channel 58; NEW BRUNSWICK, NJ; Owner: NEW JERSEY PUBLIC BROADCASTING AUTHORITY)
- WLBX-LP (Channel 22; CRANFORD, NJ; Owner: RENARD COMMUNICATIONS CORP.)
- WCBS-TV (Channel 2; NEW YORK, NY; Owner: CBS BROADCASTING INC.)
- WPXO-LP (Channel 34; EAST ORANGE, NJ; Owner: PAXSON COMMUNICATIONS LPTV, INC.)
- WNYW (Channel 5; NEW YORK, NY; Owner: FOX TELEVISION STATIONS, INC.)
- WABC-TV (Channel 7; NEW YORK, NY; Owner: AMERICAN BROADCASTING COMPANIES, INC)
- WPIX (Channel 11; NEW YORK, NY; Owner: WPIX, INC.)
- WWOR-TV (Channel 9; SECAUCUS, NJ; Owner: FOX TELEVISION STATIONS, INC.)
- WPXN-TV (Channel 31; NEW YORK, NY; Owner: PAXSON COMMUNICATIONS LICENSE COMPANY, LLC)
- WNBC (Channel 4; NEW YORK, NY; Owner: NATIONAL BROADCASTING COMPANY, INC.)
- WNET (Channel 13; NEWARK, NJ; Owner: EDUCATIONAL BROADCASTING CORPORATION)
- WXTV (Channel 41; PATERSON, NJ; Owner: WXTV LICENSE PARTNERSHIP, G.P.)
- WNJU (Channel 47; LINDEN, NJ; Owner: WNJU LICENSE CORPORATION)
- WFUT (Channel 68; NEWARK, NJ; Owner: UNIVISION NEW YORK LLC)
- WNYE-TV (Channel 25; NEW YORK, NY; Owner: NEW YORK CITY BOARD OF EDUCATION)
- WXNY-LP (Channel 32; NEW YORK, NY; Owner: ISLAND BROADCASTING COMPANY)
- W54CZ (Channel 54; MORRISTOWN, NJ; Owner: WLNY-TV, INC.)
- WKOB-LP (Channel 53; NEW YORK, NY; Owner: WKOB COMMUNICATIONS, INC.)
- WEBR-CA (Channel 17; MANHATTAN, NY; Owner: K LICENSEE INC.)
- WRNN-LP (Channel 57; NYACK, NY; Owner: LP NYACK LIMITED PARTNERSHIP)
- W36AS (Channel 36; NEW BRUNSWICK, NJ; Owner: DEEPAK VISWANATH)
- W60AI (Channel 60; NEW YORK, NY; Owner: VENTANA TELEVISION, INC.)
- WNJT (Channel 52; TRENTON, NJ; Owner: NEW JERSEY PUBLIC BROADCASTING AUTHORITY)
- WNXY-LP (Channel 26; NEW YORK, NY; Owner: ISLAND BROADCASTING COMPANY)
- WMBC-TV (Channel 63; NEWTON, NJ; Owner: MOUNTAIN BROADCASTING CORPORATION)
- National Bridge Inventory (NBI) Statistics
- 37Number of bridges
- 325ft / 99.3mTotal length
- $12,188,000Total costs
- 1,106,603Total average daily traffic
- 86,417Total average daily truck traffic
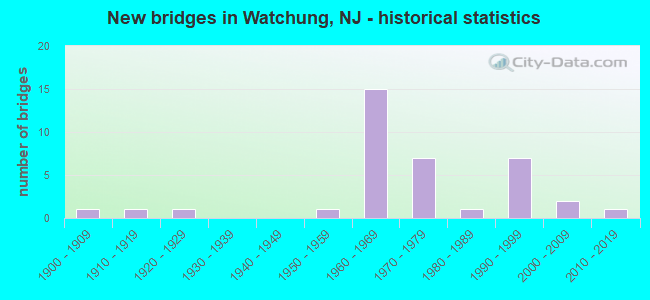
- New bridges - historical statistics
- 11900-1909
- 11910-1919
- 11920-1929
- 11950-1959
- 151960-1969
- 71970-1979
- 11980-1989
- 71990-1999
- 22000-2009
- 12010-2019
FCC Registered Broadcast Land Mobile Towers:
13 (See the full list of FCC Registered Broadcast Land Mobile Towers in Watchung, NJ)FCC Registered Microwave Towers:
3- Johnston Dr., 421 Johnston Drive (Lat: 40.635944 Lon: -74.438222), Type: Nntann, Structure height: 53.3 m, Overall height: 56 m, Call Sign: WQAN966,
Assigned Frequencies: 10875.0 MHz, 10875.0 MHz, 10875.0 MHz, 10875.0 MHz, 10875.0 MHz, 10875.0 MHz, 10875.0 MHz, 10875.0 MHz, 10875.0 MHz, 10875.0 MHz, 10875.0 MHz, Grant Date: 04/30/2014, Expiration Date: 07/12/2024, Certifier: James R Barsuglia, Registrant: New Jersey State Police, West Trenton, NJ 08628, Phone: (609) 358-1433, Fax: (609) 883-8061, Email:
- Johnston Drive, 400 Johnston Dr (Lat: 40.636194 Lon: -74.438361), Type: Ltower, Structure height: 45.7 m, Overall height: 53.4 m, Call Sign: WQRA485,
Assigned Frequencies: 10995.0 MHz, 10795.0 MHz, 10995.0 MHz, 10795.0 MHz, 10995.0 MHz, 10795.0 MHz, 10995.0 MHz, 10795.0 MHz, 10995.0 MHz, 10795.0 MHz... (+12 more), Grant Date: 03/08/2023, Expiration Date: 04/04/2033, Certifier: Rubin Walker, Registrant: Ess, Inc., 141 River Road #6, Nutley, NJ 07007, Phone: (856) 764-3809, Email:
- Watchung, 160 Oakwood Road East (Lat: 40.652667 Lon: -74.416194), Type: Upole, Structure height: 42.7 m, Call Sign: WREB509,
Assigned Frequencies: 11187.5 MHz, Grant Date: 09/11/2019, Expiration Date: 09/11/2029, Certifier: Jeffrey H Katz, Registrant: Pseg Services Corporation, 103 E. Beaver Dam Rd, Tafton, PA 18464, Phone: (201) 788-9111, Email:
FCC Registered Amateur Radio Licenses:
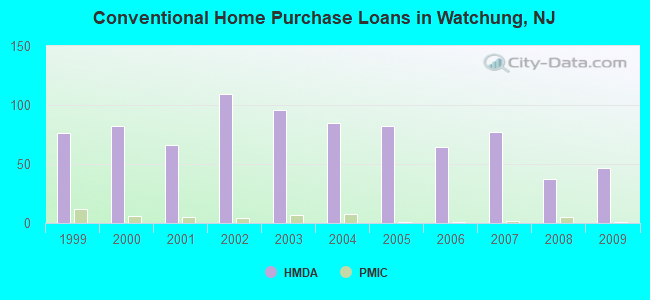
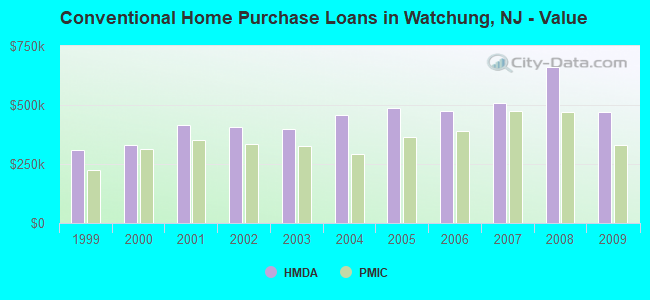
28 (See the full list of FCC Registered Amateur Radio Licenses in Watchung)| Home Mortgage Disclosure Act Aggregated Statistics For Year 2009 (Based on 1 full tract) | ||||||||||||
| A) FHA, FSA/RHS & VA Home Purchase Loans | B) Conventional Home Purchase Loans | C) Refinancings | D) Home Improvement Loans | E) Loans on Dwellings For 5+ Families | F) Non-occupant Loans on < 5 Family Dwellings (A B C & D) | |||||||
|---|---|---|---|---|---|---|---|---|---|---|---|---|
| Number | Average Value | Number | Average Value | Number | Average Value | Number | Average Value | Number | Average Value | Number | Average Value | |
| LOANS ORIGINATED | 4 | $471,750 | 47 | $471,277 | 173 | $424,225 | 14 | $180,857 | 1 | $995,000 | 6 | $468,833 |
| APPLICATIONS APPROVED, NOT ACCEPTED | 1 | $366,000 | 12 | $557,250 | 15 | $361,067 | 0 | $0 | 0 | $0 | 1 | $395,000 |
| APPLICATIONS DENIED | 3 | $513,333 | 15 | $510,333 | 45 | $402,867 | 4 | $248,000 | 0 | $0 | 2 | $199,000 |
| APPLICATIONS WITHDRAWN | 0 | $0 | 4 | $377,000 | 31 | $446,613 | 1 | $900,000 | 0 | $0 | 0 | $0 |
| FILES CLOSED FOR INCOMPLETENESS | 0 | $0 | 4 | $457,000 | 7 | $615,571 | 0 | $0 | 0 | $0 | 0 | $0 |
Detailed HMDA statistics for the following Tracts: 0523.00
| Private Mortgage Insurance Companies Aggregated Statistics For Year 2009 (Based on 1 full tract) | ||
| A) Conventional Home Purchase Loans | ||
|---|---|---|
| Number | Average Value | |
| LOANS ORIGINATED | 1 | $332,000 |
| APPLICATIONS APPROVED, NOT ACCEPTED | 1 | $470,000 |
| APPLICATIONS DENIED | 2 | $366,500 |
| APPLICATIONS WITHDRAWN | 0 | $0 |
| FILES CLOSED FOR INCOMPLETENESS | 0 | $0 |
Detailed PMIC statistics for the following Tracts: 0523.00
2004 - 2018 National Fire Incident Reporting System (NFIRS) incidents
- Fire incident types reported to NFIRS in Watchung, NJ
- 12738.6%Outside Fires
- 11434.7%Structure Fires
- 8124.6%Mobile Property/Vehicle Fires
- 72.1%Other
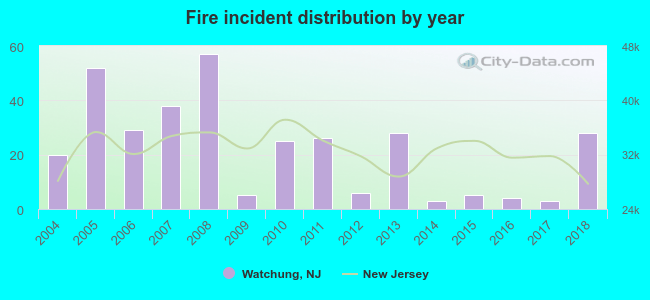 Based on the data from the years 2004 - 2018 the average number of fires per year is 22. The highest number of fire incidents - 57 took place in 2008, and the least - 3 in 2014. The data has a growing trend.
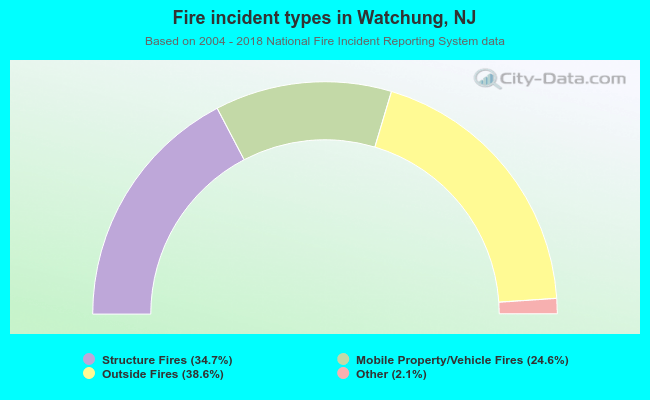 When looking into fire subcategories, the most incidents belonged to: Outside Fires (38.6%), and Structure Fires (34.7%).
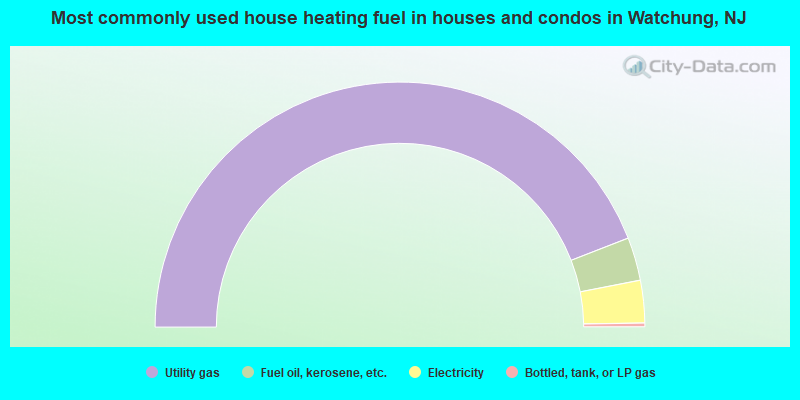
- 88.2%Utility gas
- 5.7%Fuel oil, kerosene, etc.
- 5.6%Electricity
- 0.5%Bottled, tank, or LP gas
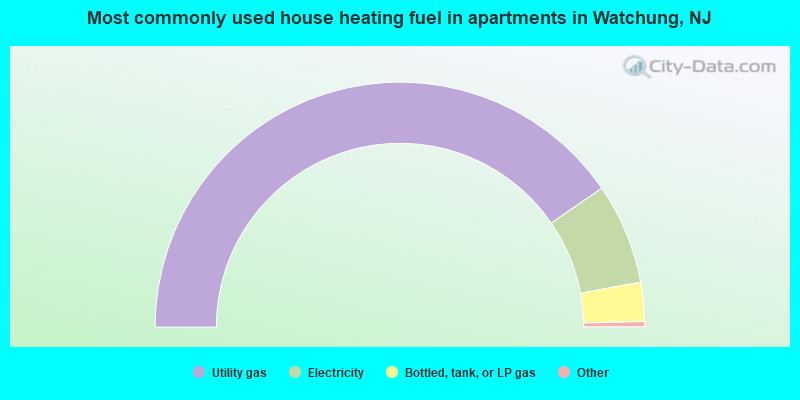
- 81.4%Utility gas
- 13.4%Electricity
- 5.2%Bottled, tank, or LP gas
Watchung compared to New Jersey state average:
- Median household income above state average.
- Median house value above state average.
- Unemployed percentage significantly below state average.
- Black race population percentage significantly below state average.
- Hispanic race population percentage below state average.
- Median age above state average.
- Renting percentage below state average.
- Length of stay since moving in above state average.
- Number of rooms per house above state average.
- Percentage of population with a bachelor's degree or higher above state average.
Watchung on our top lists:
- #12 on the list of "Top 101 cities with the lowest number of assaults per 100,000 residents (population 5,000+)"
- #15 on the list of "Top 101 cities with the highest number of police officers per 1000 residents (population 5,000+)"
- #15 on the list of "Top 101 cities with the lowest percentage of single-parent households, population 5,000+"
- #40 on the list of "Top 101 cities with the smallest percentage of divorced people (15+ years)(population 5,000+)"
- #42 on the list of "Top 101 cities with the most residents born in Egypt (population 500+)"
- #57 on the list of "Top 101 cities with the most residents born in Syria (population 500+)"
- #58 on the list of "Top 101 cities with the most residents born in Europe (population 500+)"
- #61 on the list of "Top 101 cities with the largest percentage of people in religious group quarters (population 1,000+)"
- #67 on the list of "Top 101 cities with the most residents born in Portugal (population 500+)"
- #79 on the list of "Top 101 cities with the most residents born in Northern Africa (population 500+)"
- #81 on the list of "Top 101 cities with largest percentage of males in industries: management of companies and enterprises (population 5,000+)"
- #84 on the list of "Top 101 cities with largest percentage of males in occupations: health diagnosing and treating practitioners and other technical occupations (population 5,000+)"
- #97 on the list of "Top 101 cities with the most residents born in Southern Europe (population 500+)"
- #98 on the list of "Top 101 cities with the most residents born in Poland (population 500+)"
- #99 on the list of "Top 101 cities with largest percentage of females in industries: wholesale trade (population 5,000+)"
- #12 on the list of "Top 101 counties with the highest percentage of residents that visited a dentist within the past year"
- #16 on the list of "Top 101 counties with the best general health status score of residents (1-5), 3 years of data"
- #16 on the list of "Top 101 counties with the largest decrease in the number of births per 1000 residents 2000-2006 to 2007-2013 (pop 50,000+)"
- #27 on the list of "Top 101 counties with the lowest percentage of residents that keep firearms around their homes"
- #34 on the list of "Top 101 counties with the largest number of children under 18 without health insurance coverage in 2000 (pop. 50,000+)"

|
|
Total of 295 patent applications in 2008-2024.