Anaheim, known for its amusement parks like Disneyland, and Glendale, boasting a thriving arts scene, are two dynamic Californian cities offering an exceptional living and visiting experience. This comprehensive comparison explores the pros and cons of either location, covering key areas including safety, weather, cost of living, education, employment, infrastructure, property, taxation, culture, sports, geography, and health care.
Distance between
Anaheim, CA and
Glendale, CA : 31.0 miles
Anaheim's population is larger by 80%. Its population has grown by 17,926 people (5.5%) since 2000. The population of Glendale has decreased by 2,607 people (1.3%) during that time.
Anaheim and Glendale both prioritize resident safety. However, Glendale generally has a lower crime rate than Anaheim, making it safer overall. Though Anaheim continually works on improved public safety measures, its higher tourist draw due to destinations like Disneyland can correlate with more crime. Visitors and residents in either city should always practice basic safety precautions, familiarizing themselves with local law enforcement resources.
City-data.com crime index counts serious crimes and violent crime more heavily. It adjusts for the number of visitors and daily workers commuting into cities. (higher means more crime, U.S. average = 301.1)
City-data.com crime index counts serious crimes and violent crime more heavily. It adjusts for the number of visitors and daily workers commuting into cities. (higher means more crime, U.S. average = 301.1)
Sex Offenders
According to our data, there are 366 registered sex offenders living in Anaheim and 70 registered sex offenders living in . The ratio of residents to sex offenders in Anaheim is 959 to 1; the ratio in Glendale is 2,869 to 1. The number of registered sex offenders compared to the number of residents is much larger in Anaheim than that in Glendale.
Cost of Living
The cost of living is high in both Anaheim and Glendale, reflecting their Californian location. Housing is the biggest factor contributing to this - both cities see property costs well above the national average. Glendale generally costs slightly more than Anaheim due to its greater proximity to Los Angeles.
Income Tax
California's progressive income tax system applies to both Anaheim and Glendale. Although the rate ranges from 1% to 13.3% based on income, it's uniform across all cities in the state, potentially impacting overall cost of living.
Property Tax
Both Anaheim and Glendale conform to California's standard 1% property tax cap. However, additional levies may increase this overall rate, affecting home ownership costs.
Sales Tax
California's sales tax applies equally to both cities. However, the local additions can vary, typically hovering around 9.5%. It's pertinent for both visitors and residents to be aware of these sales tax rates due to their impact on purchasing decisions.
Income
Type
Anaheim
Glendale
Estimated median household income
$81,747
$79,633
Estimated per capita income
$32,827
$41,791
Cost of living index (U.S. average is 100)
88.5
148.1
If you make $50,000 in Anaheim, you will have to make $83,672 in Glendale to maintain the same standard of living.
Geographical Conditions
Both cities offer Southern Californian landscapes - Anaheim with its flat terrain plus coastal proximity, and Glendale marked by hilly landscapes mitigating the LA basin. Their settings offer both natural beauty and recreational opportunities.
Both cities offer solid education systems with highly ranked public and private schools. Glendale Unified School District is often recognized for its high standards, while Anaheim City School District also earns commendations. For higher education, Glendale Community College and Anaheim's local colleges offer a variety of programs.
For work opportunities, both cities present promising prospects. Anaheim's economy revolves around tourism, retail, and manufacturing while Glendale boasts a diversified economy that includes tech, finance, and entertainment sectors. Both locations have expanding job markets and competitive wages.
Biggest Employers
Not surprisingly, Disneyland Resort is Anaheim's largest employer. In contrast, Glendale's largest employers include Glendale Unified School District, Glendale Adventist Medical Center, and DreamWorks Animation.
There were 85 building permits issued in Anaheim in 2012 (44 more than in 2011) compared to 134 building permits issued in Glendale in 2012 (123 more than in 2011).
In Anaheim (Orange County), 45.8% voted for Democrats and 52.0% for Republicans in 2012 Presidential Election. In Glendale (Los Angeles County), 69.7% voted for Democrats and 27.8% for Republicans.
Elections
Type
Democrats
Republicans
Other
Year
Anaheim
Glendale
Anaheim
Glendale
Anaheim
Glendale
2020
53.6%
71.0%
44.6%
26.9%
1.8%
2.1%
2016
50.9%
72.0%
42.4%
22.5%
6.7%
5.5%
2012
45.8%
69.7%
52.0%
27.8%
2.3%
2.4%
2008
47.8%
69.2%
50.3%
28.8%
1.9%
1.9%
2004
39.3%
63.3%
60.2%
35.7%
0.5%
1.0%
2000
40.4%
63.6%
55.9%
32.4%
3.7%
4.0%
1996
37.9%
59.3%
51.7%
31.0%
10.5%
9.7%
Breakdown of population affiliated with a religious congregation
Type
Adherents
Congregations
Religion
Anaheim
Glendale
Anaheim
Glendale
CATHOLIC CHURCH
26.5%
36.1%
4.4%
4.7%
SOUTHERN BAPTIST CONVENTION
2.3%
1.0%
8.8%
9.0%
MUSLIM ESTIMATE
0.8%
0.7%
1.3%
1.0%
LUTHERAN CHURCH
0.6%
0.2%
2.0%
1.6%
EPISCOPAL CHURCH
0.4%
0.4%
1.4%
1.4%
EVANGELICAL LUTHERAN CHURCH IN AMERICA
0.4%
0.2%
2.3%
1.9%
SEVENTH DAY ADVENTIST CHURCH
0.4%
0.5%
1.3%
2.4%
REFORMED CHURCH IN AMERICA
0.3%
0.1%
0.2%
0.2%
AMERICAN BAPTIST CHURCHES IN THE USA
0.2%
0.5%
1.7%
3.1%
Weather
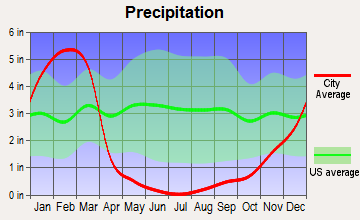
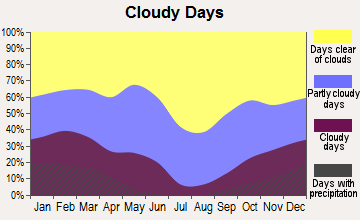
Both cities enjoy typical Southern Californian weather, characterized by warm, dry summers and mild, wet winters. Anaheim is slightly warmer over the year, while Glendale sees a bit more rainfall. Both climates are typically comfortable and promote a variety of outdoor activities year-round.
Weather and climate
Type
Anaheim
Glendale
Temperature - Average
64.9°F
65.2°F
Humidity - Average morning or afternoon humidity
69.6%
61.3%
Humidity - Differences between morning and afternoon humidity
25.9%
16.4%
Humidity - Maximum monthly morning or afternoon humidity
77.9%
65.6%
Humidity - Minimum monthly morning or afternoon humidity
52%
49.2%
Precipitation - Yearly average
12 in
22.2 in
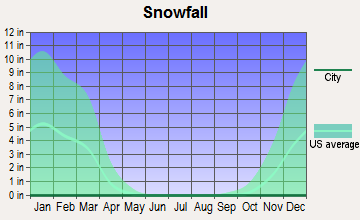
Snowfall - Yearly average
0 in
0 in
Clouds - Number of days clear of clouds
26.6%
29.4%
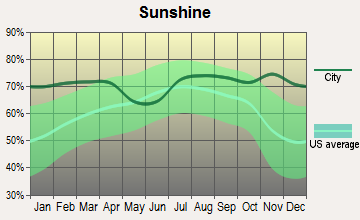
Sunshine amount - Average
78.4%
78.4%
Sunshine amount - Differences during a year
22%
22%
Sunshine amount - Maximum monthly
84.9%
85%
Sunshine amount - Minimum monthly
63%
63%
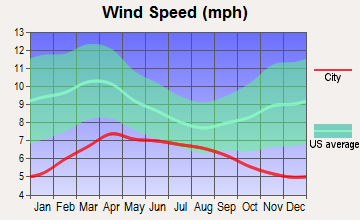
Wind speed - Average
5.7 mph
2.2 mph
Average climate in Anaheim, California
Average climate in Glendale, California
Air pollution
Type
AQI
CO
NO2
OZONE
PB
PM10
PM25
SO2
Year
Anaheim
Glendale
Anaheim
Glendale
Anaheim
Glendale
Anaheim
Glendale
Anaheim
Glendale
Anaheim
Glendale
Anaheim
Glendale
Anaheim
Glendale
2018
139
138
0.36
0.38
13.7
13.2
26.8
27.2
0.007
0.008
27.5
28.1
12.1
15.3
0.7
0.4
2017
145
145
0.50
0.40
14.8
14.0
26.7
28.3
0.007
0.007
26.7
31.8
13.5
15.5
0.6
0.4
2016
132
131
0.57
0.37
14.5
13.9
26.3
27.3
0.007
0.007
24.1
30.3
12.9
14.7
0.3
0.3
2015
142
138
0.45
0.38
14.7
14.1
26.0
27.7
0.007
0.006
25.0
29.5
14.8
16.3
0.3
0.2
2014
138
144
0.40
0.41
15.0
16.3
26.7
27.6
0.008
0.006
26.7
30.9
16.2
18.4
0.5
0.3
2013
138
140
0.47
0.45
14.8
18.9
25.3
27.0
0.005
0.007
28.3
25.4
13.9
17.2
0.5
0.3
2012
142
148
0.46
0.46
14.5
19.4
25.0
25.5
0.005
0.007
27.0
24.4
14.7
17.8
0.2
0.5
2011
138
144
0.42
0.48
15.9
20.4
26.7
23.2
0.007
0.009
27.4
25.8
16.0
18.7
0.8
0.4
2010
130
133
0.44
0.48
16.7
21.6
25.8
23.3
0.009
0.012
23.5
24.1
14.9
17.0
0.6
0.7
2009
151
154
0.41
0.48
18.0
24.5
26.0
24.0
0.010
0.011
24.4
40.6
15.4
19.3
1.1
0.5
2008
156
154
0.38
0.51
20.3
25.8
26.7
23.4
0.010
0.014
30.2
37.5
18.9
18.2
1.1
0.8
2007
135
130
0.38
0.55
19.5
26.2
26.2
22.3
0.012
0.016
N/A
N/A
N/A
N/A
0.8
1.1
2006
128
134
0.43
0.62
19.1
25.5
26.3
22.2
0.008
0.009
N/A
N/A
N/A
N/A
1.3
0.9
2005
128
134
0.45
0.69
20.7
26.7
31.3
20.8
0.013
0.015
N/A
N/A
N/A
N/A
1.3
1.8
2004
134
142
0.53
0.77
19.9
29.7
37.1
24.4
0.015
0.019
N/A
N/A
N/A
N/A
1.6
2.4
2003
143
147
0.69
0.96
23.7
32.4
23.8
23.0
0.025
0.027
N/A
N/A
N/A
N/A
1.1
1.4
2002
134
154
0.77
1.03
24.1
36.0
21.8
21.5
0.019
0.022
N/A
N/A
N/A
N/A
2.1
2.1
2001
143
143
0.94
1.09
28.4
36.9
24.5
18.9
0.035
0.028
N/A
N/A
N/A
N/A
1.7
1.3
2000
152
151
0.80
1.20
29.4
36.8
23.0
19.4
0.030
0.025
N/A
N/A
N/A
N/A
1.9
0.8
Natural disasters
Type
Anaheim
Glendale
Tornado activity compared to U.S. average
19.3%
16.5%
Earthquake activity compared to U.S. average
7,039.7%
7,228.9%
Natural disasters compared to U.S. average
32%
57%
Transportation
Both cities have comprehensive public transit systems, including bus networks and commuter rail services. While Anaheim leverages its tourism to offer extensive transport options, Glendale's links to the wider LA County transport network are also efficient.
Transport
Type
Anaheim
Glendale
Amtrak stations
1
1
Amtrak stations nearby
3
3
FAA registered aircraft
136
76
FAA registered aircraft manufacturers and dealers
3
3
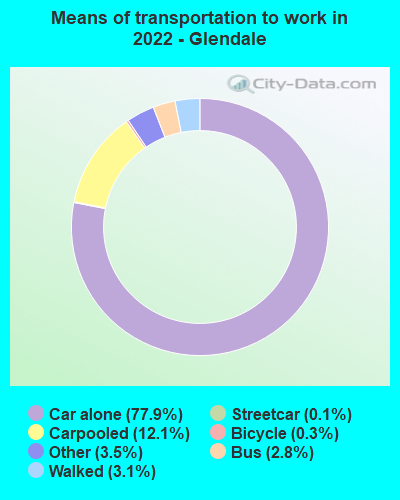
Means of transportation to work
Type
Anaheim
Glendale
Bicycle
1%
0.5%
Bus
0.9%
2.6%
Carpooled
10.8%
9.5%
Car alone
83.4%
81.7%
Motorcycle
0.2%
0.1%
Railroad
0.2%
0.2%
Subway
0.3%
0.1%
Walked
1.6%
3.4%
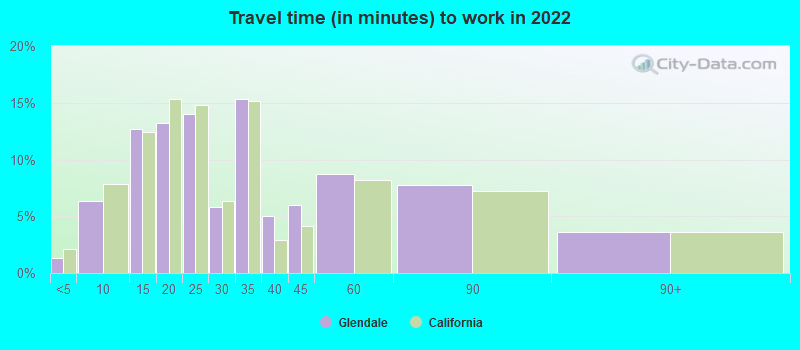
Average travel time to work
Type
Anaheim
Glendale
Average
30.8 min
29.8 min
Other means
28.1 min
28 min
Public transportation
47.8 min
45 min
Private vehicle occupancy
Type
Anaheim
Glendale
Average
1.2
1.1
Drove alone
85.3%
94.8%
In 2 person carpool
11.2%
4%
In 3 person carpool
1.8%
0.5%
In 4 person carpool
0.8%
0.3%
In 5-6 person carpool
0.9%
0.4%
How many people usually rode to work in the car, truck or van.
Real Estate
Both cities have strong real estate markets, with prices often exceeding national averages. While property prices can be high, both locations offer a variety of housing options, from historic homes to modern apartments.
Neighborhoods
Anaheim's neighborhoods, from the resort district to downtown, offer residential diversity. Glendale's areas, like Adams Square and Verdugo Viejo, retain historic charm while adapting to modern needs. Each city's neighborhoods cater to varied lifestyles, from urban to suburban.
Houses and residents
Type
Anaheim
Glendale
Houses
110,319
76,220
Average household size (people)
3.4
2.6
Median year apartment built
1975
1971
Median year house/condo built
1970
1955
Length of stay in the house since moving in
14.8 years
15.8 years
Houses occupied
105,608 (95.7%)
70,831 (92.9%)
Houses occupied by owners
51,684 (48.9%)
25,211 (35.6%)
Houses occupied by renters
53,924 (51.1%)
45,620 (64.4%)
Median rent asked for vacant for-rent units
$2,111
$1,925
Median monthly housing costs
$1,910
$2,004
Median price asked for vacant for-sale houses and condos
$1,256,069
$886,794
Estimated median house or condo value
$688,400
$995,700
Median numbers of rooms
4.7
4.5
Median number of rooms in apartments
3.6
4
Median number of rooms in houses and condos
6.1
6
Median house price - detached houses
$859,592
Over $1,000,000
Median house price - in 2-unit structures
$742,035
$692,572
Median house price - in 3-to-4-unit structures
$546,946
Over $1,000,000
Median house price - in 5 or more unit structures
$553,561
$790,093
Median house price - Townhouses or other attached units
$619,623
$720,498
Median house price - All housing units
$782,600
Over $1,000,000
Median house age
48
55
Renting percentage
51.5%
61.9%
Housing density (houses/condos per square mile)
2,254.1
2,487.2
House value disparities
20.2%
20.5%
Household income disparities
43.6%
46.1%
Median household income for houses/condes with a mortgage
$125,169
$145,822
Median household income for apartments without a mortgage
$86,779
$86,918
Housing units without a mortgage
374 (1%)
313 (1.8%)
Housing units with both a second mortgage and home equity loan
2,222 (6%)
1,058 (6%)
Housing units with a mortgage
36,875 (99%)
17,459 (98.2%)
Housing units with a home equity loan
0 (0%)
128 (0.7%)
Housing units with a second mortgage
2,794 (7.5%)
1,688 (9.5%)
House/condo owner moved in on average (years ago)
14
16
House/condo renter moved in on average (years ago)
4
4
Housing units lacking complete kitchen facilities
4.5%
4.6%
Housing units lacking complete plumbing facilities
0.1%
1%
Housing units in structures
Housing units in structures
Anaheim
Glendale
One, detached
42.7%
33.7%
One, attached
8.3%
3.3%
Two
2.3%
2.0%
3 or 4
7.6%
6.5%
5 to 9
6.8%
14.9%
10 to 19
5.5%
12.4%
20 to 49
6.8%
16.1%
50 or more
17.2%
10.6%
Mobile homes
2.6%
0.4%
Boats, RVs, vans, etc.
0.1%
0.0%
Median real estate property taxes paid for housing units
Self-employed workers in own not incorporated business
11,077
8,104
State government workers
5,046
2,498
Unpaid family workers
65
49
Industries and Occupations
In Anaheim, industries tied to tourism and manufacturing are prominent. In Glendale, the entertainment, tech, and financial sectors lead. Both cities harbor opportunities for professionals across numerous fields with varied occupational demands.
Anaheim and Glendale host top-notch health care facilities, including renowned hospitals and specialized medical centers. Their health care structures prioritize accessibility and quality, ensuring residents and visitors receive optimal medical attention when necessary.
Health (county statistics)
Type
Anaheim
Glendale
General health status score of residents in this county from 1 (poor) to 5 (excellent)
Both cities are constantly investing in infrastructure improvement to accommodate growth. From roads to public facilities, Anaheim and Glendale provide functional and well-maintained infrastructures, making daily living and mobility relatively hassle-free.
HMDA - Conventional home purchase loans - Applications denied
Year
Anaheim
Glendale
1999
914
441
2000
679
398
2001
632
285
2002
735
311
2003
1,047
435
2004
1,456
532
2005
1,965
745
2006
1,999
924
2007
1,230
695
2008
599
348
2009
378
151
Culture and Food
Anaheim's cultural scene revolves around its amusement parks and associated entertainment, while its food scene is diverse due to its tourism. Glendale offers a vibrant arts scene and gastronomic diversity partly fueled by its large Armenian community.
Sports Teams
Anaheim is home to sports teams like the Ducks (NHL) and Angels (MLB). Glendale doesn't host any pro sports teams but gives easy access to LA's teams, including Lakers (NBA) and Dodgers (MLB).


 Anaheim, CA
 Glendale, CA