When comparing Austin, Texas and Chandler, Arizona, many factors come into play such as crime rates, weather, living costs, and more. This comprehensive comparison will delve into every aspect of each city, giving you an insight into the lifestyle and opportunities awaiting you in each place. With a keen focus on the needs of both prospective residents and tourists, we will cover everything from taxes to sports teams, geographical conditions, and healthcare.
Distance between
Austin, TX and
Chandler, AZ : 853.6 miles
Austin's population is larger by 245%. Its population has grown by 307,615 people (46.9%) since 2000. The population of Chandler has grown by 102,877 people (58.3%) during that time.
When it comes to safety, both Austin and Chandler provide residents and tourists with a sense of security. However, Chandler tends to have a lower crime rate compared to Austin, making it a safer city overall. Despite this, it's important to note that Austin is a larger city than Chandler and, like any metropolitan area, has diverse neighborhoods with varying safety levels.
City-data.com crime index counts serious crimes and violent crime more heavily. It adjusts for the number of visitors and daily workers commuting into cities. (higher means more crime, U.S. average = 301.1)
City-data.com crime index counts serious crimes and violent crime more heavily. It adjusts for the number of visitors and daily workers commuting into cities. (higher means more crime, U.S. average = 301.1)
Sex Offenders
According to our data, there are 1,411 registered sex offenders living in Austin and 99 registered sex offenders living in . The ratio of residents to sex offenders in Austin is 672 to 1; the ratio in Chandler is 2,500 to 1. The number of registered sex offenders compared to the number of residents is much larger in Austin than that in Chandler.
Cost of Living
Austin is often more expensive to live in than Chandler. Housing tends to be higher in Austin, and while both cities have cost of living indexes above the national average, Austin's is significantly higher. This is an important factor for those considering relocation or a long-term stay.
Income Tax
Austin's appeal often comes from Texas having no state income tax, which can be a great advantage for high earners. Chandler residents, though, pay Arizona's state income tax, which is relatively low compared to other states.
Property Tax
In terms of property tax, Chandler fares better as the rate in Arizona is significantly lower than in Texas. Therefore, long-term homeowners might find Chandler to be more cost-effective in this respect.
Sales Tax
Texas does not have a state income tax, therefore, Austin residents and businesses only have to deal with sales taxes which are moderately high. Chandler, in Arizona, has a somewhat lower sales tax rate but also has a state income tax.
Income
Type
Austin
Chandler
Estimated median household income
$79,542
$94,613
Estimated per capita income
$53,937
$46,965
Cost of living index (U.S. average is 100)
96.4
101.2
If you make $50,000 in Austin, you will have to make $52,490 in Chandler to maintain the same standard of living.
Geographical Conditions
Austin lies in Central Texas and features a range of landscapes from hills and lakes to sprawling woodland, offering plenty of outdoor activities. Chandler, situated in the East Valley section of the Phoenix Metropolitan Area, boasts desert scenery and a close proximity to the scenic Salt River.
Both Austin and Chandler are home to exemplary education systems. Austin is known for its higher education, with the University of Texas being a key landmark, whereas Chandler boasts a highly rated K-12 school system.
Austin's economy, driven by sectors like technology and government, is larger and more diverse than Chandler's. However, Chandler, being a suburb of Phoenix, presents ample job opportunities within commuting distance. Overall, both cities have strong economies, with Austin boasting a slightly higher median household income.
Biggest Employers
The biggest employers in Austin include the State of Texas, the University of Texas, and Dell. In Chandler, the top employers are Intel, the Chandler Unified School District, and Wells Fargo.
There were 4,180 building permits issued in Austin in 2012 (2467 more than in 2011) compared to 670 building permits issued in Chandler in 2012 (5 more than in 2011).
In Austin (Travis County), 60.2% voted for Democrats and 36.2% for Republicans in 2012 Presidential Election. In Chandler (Maricopa County), 43.6% voted for Democrats and 54.3% for Republicans.
Elections
Type
Democrats
Republicans
Other
Year
Austin
Chandler
Austin
Chandler
Austin
Chandler
2020
71.7%
50.2%
26.5%
48.0%
1.8%
1.8%
2016
65.8%
44.9%
27.2%
47.7%
7.0%
7.5%
2012
60.2%
43.6%
36.2%
54.3%
3.6%
2.1%
2008
63.8%
44.0%
34.4%
54.5%
1.8%
1.5%
2004
56.1%
42.4%
42.1%
57.0%
1.8%
0.6%
2000
41.7%
43.0%
47.0%
53.4%
11.3%
3.6%
1996
52.4%
44.5%
40.0%
47.2%
7.7%
8.2%
Breakdown of population affiliated with a religious congregation
Type
Adherents
Congregations
Religion
Austin
Chandler
Austin
Chandler
CATHOLIC CHURCH
17.3%
13.6%
4.5%
4.3%
SOUTHERN BAPTIST CONVENTION
8.0%
1.9%
22.8%
6.5%
EPISCOPAL CHURCH
1.4%
0.3%
2.8%
1.3%
MUSLIM ESTIMATE
1.2%
0.2%
0.7%
1.0%
EVANGELICAL LUTHERAN CHURCH IN AMERICA
1.0%
0.8%
2.5%
2.0%
LUTHERAN CHURCH
0.9%
0.5%
2.1%
1.5%
SEVENTH DAY ADVENTIST CHURCH
0.2%
0.4%
1.0%
2.0%
VINEYARD USA
0.0%
0.3%
0.3%
0.6%
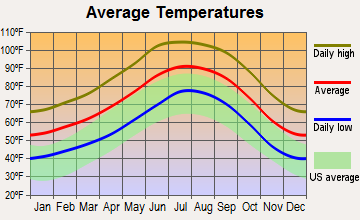
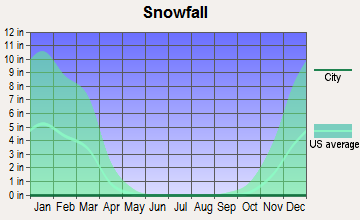
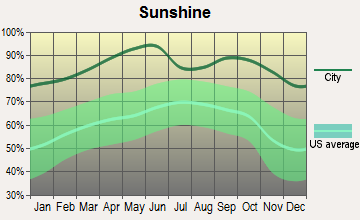
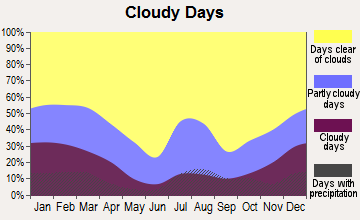
Weather
The weather in Austin and Chandler differs significantly. Austin experiences a more humid subtropical climate, with hot summers and mild winters. Conversely, Chandler's climate is hot desert, with scorching summers and mild to cool winters. The potential for extreme heat during the summer months in both cities should be a consideration for both prospective residents and tourists.
Weather and climate
Type
Austin
Chandler
Temperature - Average
68.5°F
71.8°F
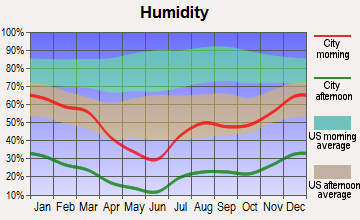
Humidity - Average morning or afternoon humidity
75.2%
37.5%
Humidity - Differences between morning and afternoon humidity
40%
48%
Humidity - Maximum monthly morning or afternoon humidity
89%
60%
Humidity - Minimum monthly morning or afternoon humidity
49%
12%
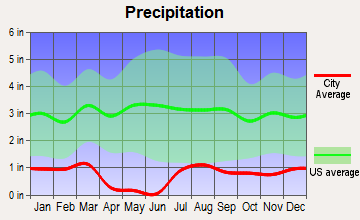
Precipitation - Yearly average
33.7 in
9.1 in
Snowfall - Yearly average
1.4 in
0 in
Clouds - Number of days clear of clouds
19.3%
35.3%
Sunshine amount - Average
63.3%
92.8%
Sunshine amount - Differences during a year
22%
16%
Sunshine amount - Maximum monthly
72%
95%
Sunshine amount - Minimum monthly
50%
79%
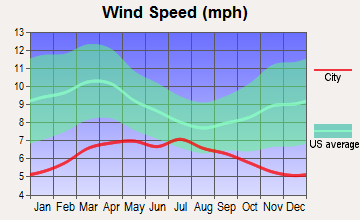
Wind speed - Average
7.2 mph
6.6 mph
Average climate in Austin, Texas
Average climate in Chandler, Arizona
Air pollution
Type
AQI
CO
NO2
OZONE
PM10
PM25
SO2
Year
Austin
Chandler
Austin
Chandler
Austin
Chandler
Austin
Chandler
Chandler
Austin
Chandler
Austin
Chandler
2018
76
206
N/A
0.29
4.9
15.2
26.7
30.6
35.5
N/A
8.7
7.7
0.2
0.6
2017
76
132
N/A
0.36
4.6
15.9
29.7
31.2
34.0
N/A
8.3
7.8
0.3
1.4
2016
71
125
N/A
0.34
4.2
15.8
29.5
30.2
30.2
N/A
8.2
7.1
0.2
0.4
2015
78
173
N/A
0.39
4.4
17.8
28.9
29.2
24.2
N/A
8.6
7.3
0.3
0.9
2014
74
231
N/A
0.44
5.2
19.9
28.3
27.8
29.8
N/A
8.7
8.6
0.5
1.1
2013
78
148
0.09
0.32
5.5
20.1
29.5
29.8
28.9
N/A
8.6
7.5
0.5
0.9
2012
86
165
0.13
0.36
5.5
21.5
30.1
29.3
36.8
N/A
8.6
8.8
N/A
1.3
2011
83
205
0.11
0.32
2.6
19.1
33.0
30.1
40.4
N/A
9.1
9.5
N/A
0.9
2010
77
100
0.05
0.42
3.2
17.4
29.4
29.8
23.8
N/A
8.8
8.3
N/A
1.2
2009
76
109
0.05
0.40
2.6
17.6
29.7
29.8
36.1
N/A
9.0
N/A
N/A
1.1
2008
81
107
0.12
0.36
3.2
18.6
30.7
29.6
40.2
N/A
9.7
N/A
N/A
1.3
2007
82
135
0.12
0.38
3.1
20.6
27.1
28.5
50.2
N/A
9.8
N/A
N/A
1.9
2006
89
138
0.14
0.46
3.8
23.1
31.3
29.5
56.3
N/A
10.0
N/A
0.2
1.9
2005
92
109
0.15
0.56
4.4
23.6
29.0
26.6
48.7
N/A
10.7
N/A
0.2
1.8
2004
74
97
0.16
0.56
3.3
23.3
26.8
25.9
33.7
N/A
N/A
N/A
N/A
1.4
2003
85
100
0.26
0.58
4.2
24.6
28.9
27.3
42.6
N/A
N/A
N/A
0.1
1.4
2002
83
111
0.33
0.66
3.9
25.5
27.2
27.1
41.8
N/A
N/A
N/A
N/A
1.6
2001
83
105
0.31
0.68
4.2
24.3
25.5
26.3
37.8
N/A
N/A
N/A
N/A
1.5
2000
86
117
0.28
0.69
4.7
29.6
27.8
26.8
45.6
N/A
N/A
N/A
N/A
1.7
Natural disasters
Type
Austin
Chandler
Tornado activity compared to U.S. average
137.9%
18.5%
Earthquake activity compared to U.S. average
80.4%
2,391%
Natural disasters compared to U.S. average
29%
16%
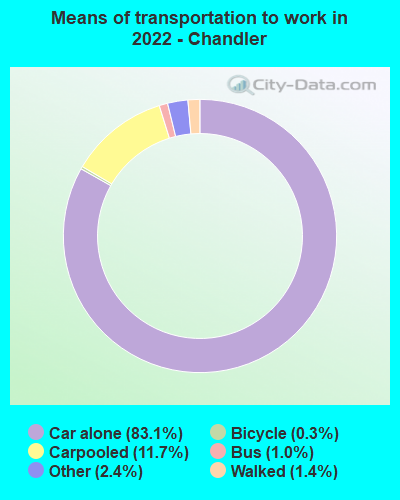
Transportation
Austin has a more developed public transit system due to its larger population and tourism industry. It includes buses, a metro rail, and bike-sharing programs. Chandler, being a suburb, relies mostly on car travel, but it is also served by the regional Valley Metro bus service.
Transport
Type
Austin
Chandler
Amtrak stations
1
0
Amtrak stations nearby
1
2
FAA registered aircraft
911
438
FAA registered aircraft manufacturers and dealers
21
5
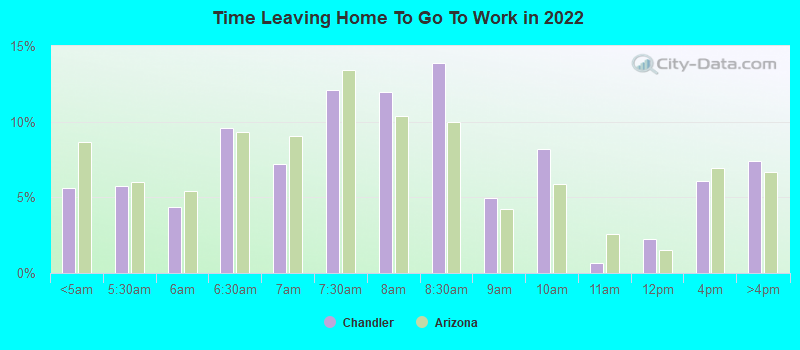
Means of transportation to work
Type
Austin
Chandler
Bicycle
0.8%
0.4%
Bus
1.5%
0.3%
Carpooled
7.9%
10.6%
Car alone
85.9%
84.8%
Motorcycle
0.3%
0.5%
Taxicab
0.1%
0%
Walked
2%
2.2%
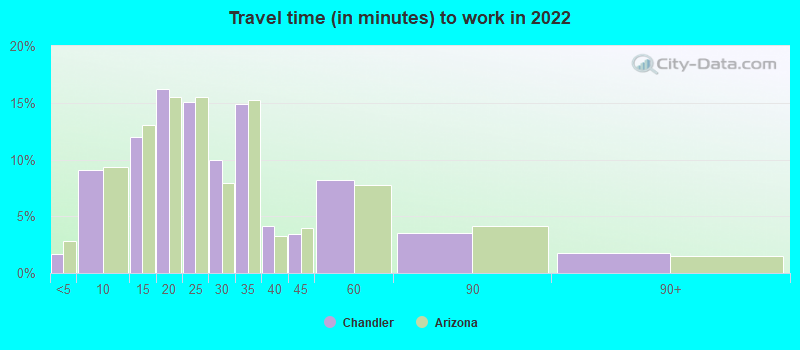
Average travel time to work
Type
Austin
Chandler
Average
29.9 min
25.7 min
Other means
22.7 min
26.3 min
Public transportation
37.9 min
50.1 min
Private vehicle occupancy
Type
Austin
Chandler
Average
1.1
1.2
Drove alone
91.2%
89.3%
In 2 person carpool
6.3%
8%
In 3 person carpool
1.7%
1%
In 4 person carpool
0.6%
0.7%
In 5-6 person carpool
0.1%
0.9%
In 7+ person carpool
0.2%
0.1%
How many people usually rode to work in the car, truck or van.
Real Estate
Real estate prices in Austin are typically higher than in Chandler due to the rapid growth and high demand. Despite this, both cities offer a variety of real estate options to fit different preferences and budgets.
Neighborhoods
Both Austin and Chandler boast a range of neighborhoods to suit any lifestyle. Austin's neighborhoods are diverse and vibrant, ranging from historic communities to artsy districts. Chandler's neighborhoods include family-friendly suburbs and luxurious gated communities.
Houses and residents
Type
Austin
Chandler
Houses
469,156
112,136
Average household size (people)
2.4
2.7
Median year apartment built
1997
1997
Median year house/condo built
1988
1997
Length of stay in the house since moving in
12.1 years
10.6 years
Houses occupied
449,399 (95.8%)
107,668 (96%)
Houses occupied by owners
196,458 (43.7%)
71,036 (66%)
Houses occupied by renters
252,941 (56.3%)
36,632 (34%)
Median rent asked for vacant for-rent units
$1,286
$2,338
Median monthly housing costs
$1,521
$1,573
Median price asked for vacant for-sale houses and condos
$549,769
$461,127
Estimated median house or condo value
$482,900
$435,100
Median numbers of rooms
4.4
5.5
Median number of rooms in apartments
3.4
4.2
Median number of rooms in houses and condos
6
6.3
Median house price - detached houses
$595,996
$493,497
Median house price - in 2-unit structures
$393,984
$583,625
Median house price - in 3-to-4-unit structures
$262,826
$260,715
Median house price - in 5 or more unit structures
$576,111
$287,805
Median house price - mobile homes
$56,102
$81,606
Median house price - Townhouses or other attached units
$459,657
$316,438
Median house price - All housing units
$571,154
$471,395
Median house age
28
24
Renting percentage
54.9%
33.7%
Housing density (houses/condos per square mile)
1,865.3
1,937.2
House value disparities
28.4%
22.8%
Household income disparities
44.8%
38.9%
Median household income for houses/condes with a mortgage
$141,177
$122,158
Median household income for apartments without a mortgage
$86,430
$78,975
Housing units without a mortgage
1,799 (1.3%)
907 (1.6%)
Housing units with both a second mortgage and home equity loan
6,421 (4.8%)
3,763 (6.8%)
Housing units with a mortgage
132,628 (98.7%)
54,712 (98.4%)
Housing units with a home equity loan
206 (0.2%)
0 (0%)
Housing units with a second mortgage
8,515 (6.3%)
4,390 (7.9%)
House/condo owner moved in on average (years ago)
9
8
House/condo renter moved in on average (years ago)
1
1
Housing units lacking complete kitchen facilities
0.9%
1.1%
Housing units lacking complete plumbing facilities
0.6%
0.4%
Housing units in structures
Housing units in structures
Austin
Chandler
One, detached
43.1%
68.7%
One, attached
5.2%
5.5%
Two
2.4%
1.2%
3 or 4
4.1%
4.5%
5 to 9
7.2%
4.7%
10 to 19
11.0%
4.8%
20 to 49
8.9%
1.8%
50 or more
17.2%
7.5%
Mobile homes
1.0%
1.3%
Median real estate property taxes paid for housing units
Self-employed workers in own not incorporated business
38,777
8,781
State government workers
46,229
4,501
Unpaid family workers
102
180
Industries and Occupations
Austin is known as a tech hub, home to many startups and established companies alike, hence a lot of job opportunities in technology. Chandler is more focused on manufacturing and retail trade, being home to companies like Intel and Walmart.
Both Austin and Chandler have high-quality healthcare facilities. Austin is home to standout medical institutions like the Seton Family of Hospitals and St. David's HealthCare. In Chandler, the Chandler Regional Medical Center and Banner Health provide excellent care.
Health (county statistics)
Type
Austin
Chandler
General health status score of residents in this county from 1 (poor) to 5 (excellent)
Austin's infrastructure is generally more developed due to its larger population and status as the state capital. The city boasts impressive cityscapes, a solid waste management system, and reliable utility services. Chandler, while smaller, still offers a well-maintained infrastructure, particularly in terms of road networks and community amenities.
Infrastructure
Type
Austin
Chandler
Hospitals
65
2
TV stations
20
20
Bank branches located here
264
59
Bank institutions located here
43
20
Main business address for public companies
44
1
Drinking water stations with no reported violations in the past
46
1
Drinking water stations with reported violations in the past
HMDA - Conventional home purchase loans - Applications denied
Year
Austin
Chandler
1999
4,733
879
2000
2,950
790
2001
2,038
513
2002
1,772
487
2003
2,213
854
2004
2,458
1,296
2005
3,121
1,916
2006
3,367
1,705
2007
2,560
949
2008
1,747
374
2009
1,067
249
Culture and Food
Both Austin and Chandler celebrate a rich culture and offer an exciting food scene. Austin, known as the 'Live Music Capital of the World,' offers a flourishing food and arts scene with many festivals. Chandler, on the other hand, has a Southwestern charm flavored with a variety of international cuisines.
Sports Teams
Austin plays host to a number of sports teams and is known for its passionate supporting culture. Fans can enjoy everything from college football to professional soccer. In Chandler, sports enthusiasts can benefit from proximity to Phoenix, home to multiple major league sports teams.


 Austin, TX
 Chandler, AZ