Austin, Texas and Glendale, Arizona, are two dynamic cities each boasting a unique blend of cultural, economic, and geographical features. The lively city of Austin is renowned for its vibrant music scene and strong tech industry, while Glendale, known for its sports amenities and beautiful outdoor attractions, offers a more laid-back desert lifestyle. Each city presents its pros and cons when it comes to crime and safety, weather, cost of living, and myriad other aspects, which we will delve into here, offering a comprehensive comparison for those considering a move or a visit to either city.
Distance between
Austin, TX and
Glendale, AZ : 876.3 miles
Austin's population is larger by 286%. Its population has grown by 307,615 people (46.9%) since 2000. The population of Glendale has grown by 30,818 people (14.1%) during that time.
Austin's crime rate is slightly higher than the national average, with property crimes being the most prevalent. The city places heavy emphasis on community policing to maintain a safe environment. On the other hand, Glendale has a lower crime rate compared to other US cities of similar size, but still, it's higher than most communities in Arizona, with property crimes again being most common. Both cities have numerous safe neighborhoods making them suitable for both residents and tourists.
City-data.com crime index counts serious crimes and violent crime more heavily. It adjusts for the number of visitors and daily workers commuting into cities. (higher means more crime, U.S. average = 301.1)
City-data.com crime index counts serious crimes and violent crime more heavily. It adjusts for the number of visitors and daily workers commuting into cities. (higher means more crime, U.S. average = 301.1)
Sex Offenders
According to our data, there are 1,411 registered sex offenders living in Austin and 373 registered sex offenders living in . The ratio of residents to sex offenders in Austin is 672 to 1; the ratio in Glendale is 659 to 1. The number of registered sex offenders compared to the number of residents in Austin is near to than in Glendale.
Cost of Living
Austin's cost of living is considerably higher than the national average, particularly due to high housing costs. Despite this, it remains less expensive than other major tech hubs like San Francisco or Seattle. On the other hand, Glendale is relatively more affordable, with the cost of living just slightly above the national average, mainly driven by housing and transportation costs.
Income Tax
Texas residents enjoy one of the biggest fiscal perks in the country: no state income tax. However, the cost of living and property taxes in Austin are among the highest in the state. Meanwhile, Arizona residents do pay state income tax, with rates that range from 2.59% to 4.50% depending on income.
Property Tax
Property taxes in Texas are quite high, with Austin having some of the highest in the state. On the other hand, Arizona's property taxes are considerably lower, with Glendale having rates close to the state average.
Sales Tax
Texas does not have a state sales tax, but Austin has a local sales tax of 8.25%. Arizona does have a state sales tax, and together with Glendale's local sales tax, this figure rises to 9.2%, one of the highest in the country.
Income
Type
Austin
Glendale
Estimated median household income
$79,542
$62,910
Estimated per capita income
$53,937
$28,898
Cost of living index (U.S. average is 100)
96.4
100.6
If you make $50,000 in Austin, you will have to make $52,178 in Glendale to maintain the same standard of living.
Geographical Conditions
Austin, set in Texas's hill country, enjoys a lush, green environment with lakes and parks, offering plenty of outdoor activities. Conversely, Glendale is set in an arid desert environment, but it’s surrounded by mountain ranges, allowing for hiking, biking, and other outdoor pursuits.
Both Austin and Glendale boast strong public school systems. Austin is also home to the University of Texas, one of the nation's largest public universities, providing high-quality education and contributing to a vibrant student life in the city. In Glendale, higher education opportunities are available at Arizona State University's West Campus and Glendale Community College.
Austin's economy is one of the fastest growing in the country, anchored by the tech industry. Its job market benefits from a wave of high-tech companies, startups, and entrepreneurs. Glendale's economy, by contrast, is diverse, with significant sectors in manufacturing, healthcare, retail, and education. Both cities have lower unemployment rates compared to the national average.
Biggest Employers
In Austin, the largest employers include the State of Texas, the University of Texas, Dell Technologies, and the City of Austin. In Glendale, top employers encompass Banner Health System, Walmart, and the City of Glendale. Both cities also see steady tourism, another significant source of employment.
There were 4,180 building permits issued in Austin in 2012 (2467 more than in 2011) compared to 713 building permits issued in Glendale in 2012 (572 more than in 2011).
In Austin (Travis County), 60.2% voted for Democrats and 36.2% for Republicans in 2012 Presidential Election. In Glendale (Maricopa County), 43.6% voted for Democrats and 54.3% for Republicans.
Elections
Type
Democrats
Republicans
Other
Year
Austin
Glendale
Austin
Glendale
Austin
Glendale
2020
71.7%
50.2%
26.5%
48.0%
1.8%
1.8%
2016
65.8%
44.9%
27.2%
47.7%
7.0%
7.5%
2012
60.2%
43.6%
36.2%
54.3%
3.6%
2.1%
2008
63.8%
44.0%
34.4%
54.5%
1.8%
1.5%
2004
56.1%
42.4%
42.1%
57.0%
1.8%
0.6%
2000
41.7%
43.0%
47.0%
53.4%
11.3%
3.6%
1996
52.4%
44.5%
40.0%
47.2%
7.7%
8.2%
Breakdown of population affiliated with a religious congregation
Type
Adherents
Congregations
Religion
Austin
Glendale
Austin
Glendale
CATHOLIC CHURCH
17.3%
13.6%
4.5%
4.3%
SOUTHERN BAPTIST CONVENTION
8.0%
1.9%
22.8%
6.5%
EPISCOPAL CHURCH
1.4%
0.3%
2.8%
1.3%
MUSLIM ESTIMATE
1.2%
0.2%
0.7%
1.0%
EVANGELICAL LUTHERAN CHURCH IN AMERICA
1.0%
0.8%
2.5%
2.0%
LUTHERAN CHURCH
0.9%
0.5%
2.1%
1.5%
SEVENTH DAY ADVENTIST CHURCH
0.2%
0.4%
1.0%
2.0%
VINEYARD USA
0.0%
0.3%
0.3%
0.6%
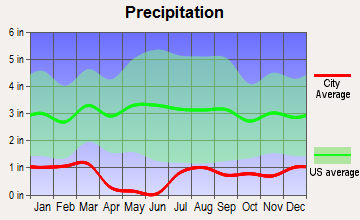
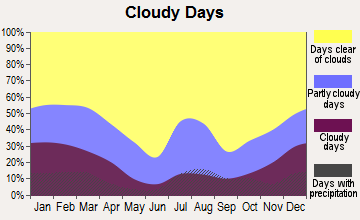
Weather
Austin's climate is characterized by humid summers and mild winters, with temperatures ranging from 60 to 95 degrees Fahrenheit throughout the year. Conversely, Glendale experiences an arid climate, with very hot summers and mild-to-warm winters. Expect temperatures to often exceed 100 degrees in the summer months. For those sensitive to heat, Austin may offer a more comfortable climate throughout the year.
Weather and climate
Type
Austin
Glendale
Temperature - Average
68.5°F
72.6°F
Humidity - Average morning or afternoon humidity
75.2%
37.5%
Humidity - Differences between morning and afternoon humidity
40%
48%
Humidity - Maximum monthly morning or afternoon humidity
89%
60%
Humidity - Minimum monthly morning or afternoon humidity
49%
12%
Precipitation - Yearly average
33.7 in
9 in
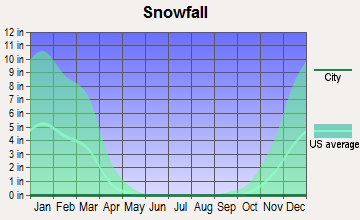
Snowfall - Yearly average
1.4 in
0 in
Clouds - Number of days clear of clouds
19.3%
35.3%
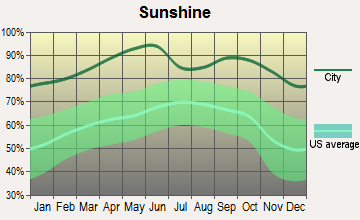
Sunshine amount - Average
63.3%
92.8%
Sunshine amount - Differences during a year
22%
16%
Sunshine amount - Maximum monthly
72%
95%
Sunshine amount - Minimum monthly
50%
79%
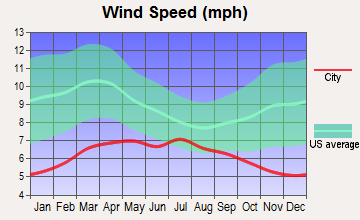
Wind speed - Average
7.2 mph
6.6 mph
Average climate in Austin, Texas
Average climate in Glendale, Arizona
Air pollution
Type
AQI
CO
NO2
OZONE
PM10
PM25
SO2
Year
Austin
Glendale
Austin
Glendale
Austin
Glendale
Austin
Glendale
Glendale
Austin
Glendale
Austin
Glendale
2018
76
155
N/A
0.38
4.9
15.3
26.7
29.7
24.1
N/A
8.7
7.4
0.2
0.6
2017
76
117
N/A
0.40
4.6
16.0
29.7
28.8
22.7
N/A
8.3
6.8
0.3
1.4
2016
71
114
N/A
0.39
4.2
15.6
29.5
29.7
22.5
N/A
8.2
6.8
0.2
0.4
2015
78
101
N/A
0.38
4.4
17.0
28.9
28.5
18.9
N/A
8.6
7.0
0.3
0.9
2014
74
116
N/A
0.38
5.2
19.0
28.3
29.5
28.0
N/A
8.7
7.8
0.5
1.1
2013
78
127
0.09
0.39
5.5
19.3
29.5
30.4
28.2
N/A
8.6
7.6
0.5
0.9
2012
86
125
0.13
0.33
5.5
20.6
30.1
29.7
34.7
N/A
8.6
8.8
N/A
1.3
2011
83
162
0.11
0.36
2.6
19.2
33.0
29.8
32.8
N/A
9.1
9.2
N/A
0.9
2010
77
100
0.05
0.38
3.2
18.9
29.4
28.2
23.3
N/A
8.8
8.3
N/A
1.0
2009
76
101
0.05
0.35
2.6
19.0
29.7
27.1
34.1
N/A
9.0
N/A
N/A
1.6
2008
81
106
0.12
0.41
3.2
20.3
30.7
27.6
37.8
N/A
9.7
N/A
N/A
2.1
2007
82
127
0.12
0.41
3.1
22.3
27.1
25.9
46.1
N/A
9.8
N/A
N/A
2.3
2006
89
127
0.14
0.46
3.8
24.4
31.3
26.8
49.1
N/A
10.0
N/A
0.2
2.2
2005
92
106
0.15
0.59
4.4
24.9
29.0
24.4
40.6
N/A
10.7
N/A
0.2
2.4
2004
74
96
0.16
0.61
3.3
24.6
26.8
23.7
31.3
N/A
N/A
N/A
N/A
1.4
2003
85
99
0.26
0.67
4.2
25.8
28.9
24.2
42.6
N/A
N/A
N/A
0.1
1.4
2002
83
106
0.33
0.78
3.9
27.3
27.2
25.0
41.8
N/A
N/A
N/A
N/A
1.6
2001
83
104
0.31
0.80
4.2
27.0
25.5
24.1
37.8
N/A
N/A
N/A
N/A
1.5
2000
86
118
0.28
0.85
4.7
29.3
27.8
23.9
45.6
N/A
N/A
N/A
N/A
1.7
Natural disasters
Type
Austin
Glendale
Tornado activity compared to U.S. average
137.9%
17.5%
Earthquake activity compared to U.S. average
80.4%
2,698.7%
Natural disasters compared to U.S. average
29%
16%
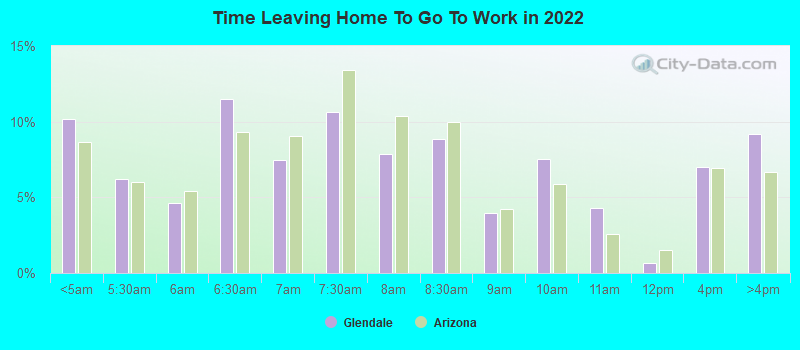
Transportation
Both Austin and Glendale heavily rely on car-based commuting. Austin's rush hours can be congested, but the city is striving to improve public transit via Capital Metro and an expanding bicycle infrastructure. In Glendale, a high-density of freeways and arterial roads intersperse the city, making it relatively easy to navigate by car. Public transportation is available via Valley Metro, though it's less frequently used.
Transport
Type
Austin
Glendale
Amtrak stations
1
0
Amtrak stations nearby
1
3
FAA registered aircraft
911
212
FAA registered aircraft manufacturers and dealers
21
4
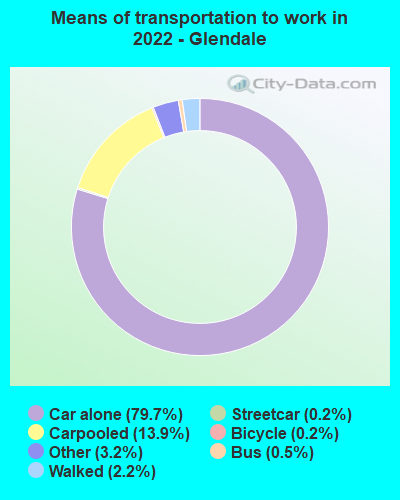
Means of transportation to work
Type
Austin
Glendale
Bicycle
0.8%
0.5%
Bus
1.5%
0.7%
Carpooled
7.9%
10.6%
Car alone
85.9%
82.1%
Motorcycle
0.3%
0.4%
Railroad
0%
0.4%
Taxicab
0.1%
0.1%
Walked
2%
2.1%
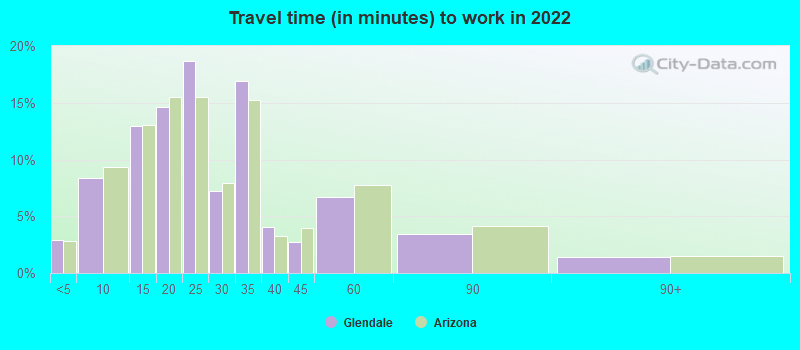
Average travel time to work
Type
Austin
Glendale
Average
29.9 min
25.2 min
Other means
22.7 min
28.8 min
Public transportation
37.9 min
51.2 min
Private vehicle occupancy
Type
Austin
Glendale
Average
1.1
1.2
Drove alone
91.2%
87%
In 2 person carpool
6.3%
9.1%
In 3 person carpool
1.7%
1.9%
In 4 person carpool
0.6%
1.5%
In 5-6 person carpool
0.1%
0.4%
In 7+ person carpool
0.2%
0%
How many people usually rode to work in the car, truck or van.
Real Estate
Austin's robust economy and population growth have driven an increase in property values and rental prices in recent years. The median home value in Austin is significantly higher than the national average. In Glendale, house prices are affordable compared to other cities in the Phoenix metro area, although they have been experiencing a positive trend.
Neighborhoods
Austin's neighborhoods range from vibrant, walkable areas like Downtown and South Congress perfect for professionals and tourists, to more family-friendly, residential areas like Circle C Ranch. Glendale features charming, historic neighborhoods like Catlin Court alongside newer, growing areas like Arrowhead Ranch, offering a blend of family-friendly and career-focused communities.
Houses and residents
Type
Austin
Glendale
Houses
469,156
95,584
Average household size (people)
2.4
2.8
Median year apartment built
1997
1985
Median year house/condo built
1988
1985
Length of stay in the house since moving in
12.1 years
11.9 years
Houses occupied
449,399 (95.8%)
90,604 (94.8%)
Houses occupied by owners
196,458 (43.7%)
52,463 (57.9%)
Houses occupied by renters
252,941 (56.3%)
38,141 (42.1%)
Median rent asked for vacant for-rent units
$1,286
$1,437
Median monthly housing costs
$1,521
$1,164
Median price asked for vacant for-sale houses and condos
$549,769
$439,560
Estimated median house or condo value
$482,900
$325,400
Median numbers of rooms
4.4
5.4
Median number of rooms in apartments
3.4
4.2
Median number of rooms in houses and condos
6
6.2
Median house price - detached houses
$595,996
$375,185
Median house price - in 2-unit structures
$393,984
$398,444
Median house price - in 3-to-4-unit structures
$262,826
$141,298
Median house price - in 5 or more unit structures
$576,111
$181,007
Median house price - mobile homes
$56,102
$76,848
Median house price - Townhouses or other attached units
$459,657
$198,617
Median house price - All housing units
$571,154
$343,063
Median house age
28
36
Renting percentage
54.9%
41.4%
Housing density (houses/condos per square mile)
1,865.3
1,716.5
House value disparities
28.4%
26.6%
Household income disparities
44.8%
43%
Median household income for houses/condes with a mortgage
$141,177
$93,755
Median household income for apartments without a mortgage
$86,430
$63,125
Housing units without a mortgage
1,799 (1.3%)
971 (2.7%)
Housing units with both a second mortgage and home equity loan
6,421 (4.8%)
1,564 (4.3%)
Housing units with a mortgage
132,628 (98.7%)
35,213 (97.3%)
Housing units with a home equity loan
206 (0.2%)
294 (0.8%)
Housing units with a second mortgage
8,515 (6.3%)
2,964 (8.2%)
House/condo owner moved in on average (years ago)
9
10
House/condo renter moved in on average (years ago)
1
1
Housing units lacking complete kitchen facilities
0.9%
1.4%
Housing units lacking complete plumbing facilities
0.6%
1.3%
Housing units in structures
Housing units in structures
Austin
Glendale
One, detached
43.1%
61.3%
One, attached
5.2%
5.4%
Two
2.4%
1.0%
3 or 4
4.1%
4.5%
5 to 9
7.2%
5.7%
10 to 19
11.0%
6.2%
20 to 49
8.9%
3.6%
50 or more
17.2%
7.5%
Mobile homes
1.0%
4.7%
Boats, RVs, vans, etc.
0.0%
0.1%
Median real estate property taxes paid for housing units
Self-employed workers in own not incorporated business
38,777
6,484
State government workers
46,229
4,087
Unpaid family workers
102
557
Industries and Occupations
In Austin, the dominant industries are high-tech, education, entertainment, and government. Major occupations include software development, management, marketing, and education. Glendale's diverse economy encompasses healthcare, manufacturing, retail, and education with occupations spanning from nursing and teaching to retail and management.
Austin provides excellent healthcare services with well-ranked hospitals like the St David's Medical Center. Glendale also offers highly-ranked healthcare facilities, such as the Banner Thunderbird Medical Center, providing comprehensive services to its residents.
Health (county statistics)
Type
Austin
Glendale
General health status score of residents in this county from 1 (poor) to 5 (excellent)
Austin is well known for its robust infrastructure, including Austin-Bergstrom International Airport and an extensive road network. Glendale's infrastructure, though smaller, is equally efficient, including Phoenix Sky Harbor International Airport, located just a few miles away. Both cities have traditionally focused on road-based transportation but are now putting an emphasis on enhancing their public transit systems.
Infrastructure
Type
Austin
Glendale
Hospitals
65
6
TV stations
20
16
Arenas or stadiums
2
2
Bank branches located here
264
54
Bank institutions located here
43
13
Main business address for public companies
44
1
Drinking water stations with no reported violations in the past
46
1
Drinking water stations with reported violations in the past
HMDA - Conventional home purchase loans - Applications denied
Year
Austin
Glendale
1999
4,733
1,225
2000
2,950
1,072
2001
2,038
758
2002
1,772
575
2003
2,213
944
2004
2,458
1,514
2005
3,121
2,408
2006
3,367
2,586
2007
2,560
1,238
2008
1,747
371
2009
1,067
229
Culture and Food
Austin boasts a vibrant music scene, ranking as a top live music city in the world. It's also renowned for its food truck culture, BBQ, and Tex-Mex cuisine. Glendale offers a more relaxed pace, with a mix of cultural festivals, historic downtown, and an eclectic mix of food options from Mexican cuisine to farm-to-table experiences.
Sports Teams
Sports enthusiasts will find something to cheer for in Austin, home to the Texas Longhorns college football team. However, Glendale is truly a sports destination, hosting the NFL's Arizona Cardinals, NHL's Arizona Coyotes, and Spring Training for Major League Baseball's Los Angeles Dodgers and Chicago White Sox.


 Austin, TX
 Glendale, AZ