Comparing Austin, Texas, and Glendale, California reveals two diverse and vibrant cities each with its characteristics and charm. While Austin carries the flag of Texas' creative spirit and entrepreneurial buzz, Glendale enjoys a unique blend of suburban comfort and urban sophistication next to the global metropolis of Los Angeles. Both cities offer a mix of economic opportunities, cultural experiences, and lifestyle choices, attracting both individuals looking to relocate and tourists looking for a memorable visit.
Distance between
Austin, TX and
Glendale, CA : 1,225.4 miles
Austin's population is larger by 401%. Its population has grown by 307,615 people (46.9%) since 2000. The population of Glendale has decreased by 2,607 people (1.3%) during that time.
When it comes to crime and safety, both Austin and Glendale offer a relatively safe environment compared to other cities in the US. However, Glendale is known for having a lower crime rate compared to Austin and the national average. For tourists and newcomers, both cities provide safe areas to stay and visit, but like all urban areas, it's important to stay aware of their surroundings.
City-data.com crime index counts serious crimes and violent crime more heavily. It adjusts for the number of visitors and daily workers commuting into cities. (higher means more crime, U.S. average = 301.1)
City-data.com crime index counts serious crimes and violent crime more heavily. It adjusts for the number of visitors and daily workers commuting into cities. (higher means more crime, U.S. average = 301.1)
Sex Offenders
According to our data, there are 1,411 registered sex offenders living in Austin and 70 registered sex offenders living in . The ratio of residents to sex offenders in Austin is 672 to 1; the ratio in Glendale is 2,869 to 1. The number of registered sex offenders compared to the number of residents is much larger in Austin than that in Glendale.
Cost of Living
The cost of living in Glendale is significantly higher than Austin. Housing costs make the biggest difference. In Austin, the housing market is more affordable, and the cost of goods and services is generally lower. Those considering relocating will find their money goes further in Austin, Texas.
Income Tax
Living in Austin, Texas, means benefiting from zero state income tax. However, California residents, including those living in Glendale, have to pay a relatively high state income tax. This financial difference is a significant consideration for those thinking of moving.
Property Tax
Texas, including Austin, has a high property tax rate compared to the national average. In contrast, California enforces a capped property tax rate regardless of the home's value, but the overall tax bill in Glendale might still be high due to the higher property values.
Sales Tax
Austin, as part of Texas, has no state income tax but does have a higher sales tax. California, on the other hand, enforces a state income tax, while Glendale implements a local sales tax, which could factor into the cost of living.
Income
Type
Austin
Glendale
Estimated median household income
$79,542
$79,633
Estimated per capita income
$53,937
$41,791
Cost of living index (U.S. average is 100)
96.4
148.1
If you make $50,000 in Austin, you will have to make $76,815 in Glendale to maintain the same standard of living.
Geographical Conditions
Austin is located in Central Texas and is characterized by its hill country, rivers, and lakes. Glendale, on the other hand, is nestled in the Verdugo Mountains, allowing for beautiful views and hiking trails.
Austin boasts the University of Texas, one of the largest universities in the US, offering excellent higher education opportunities. Glendale is part of Los Angeles County and is in close proximity to renowned universities like UCLA and USC. For K-12 education, both cities have high-performing public and private schools.
Both Austin and Glendale offer robust job markets. Austin is well known for its tech industry, with many Silicon Valley companies having a significant presence there. Glendale, being in proximity to Los Angeles, has diverse opportunities in the entertainment industry, healthcare, and retail.
Biggest Employers
In Austin, the University of Texas is the biggest employer, followed closely by the state of Texas, Dell Computers, and IBM. Glendale's biggest employers include DreamWorks Animation, Glendale Adventist Medical Center, and the City of Glendale.
There were 4,180 building permits issued in Austin in 2012 (2467 more than in 2011) compared to 134 building permits issued in Glendale in 2012 (123 more than in 2011).
In Austin (Travis County), 60.2% voted for Democrats and 36.2% for Republicans in 2012 Presidential Election. In Glendale (Los Angeles County), 69.7% voted for Democrats and 27.8% for Republicans.
Elections
Type
Democrats
Republicans
Other
Year
Austin
Glendale
Austin
Glendale
Austin
Glendale
2020
71.7%
71.0%
26.5%
26.9%
1.8%
2.1%
2016
65.8%
72.0%
27.2%
22.5%
7.0%
5.5%
2012
60.2%
69.7%
36.2%
27.8%
3.6%
2.4%
2008
63.8%
69.2%
34.4%
28.8%
1.8%
1.9%
2004
56.1%
63.3%
42.1%
35.7%
1.8%
1.0%
2000
41.7%
63.6%
47.0%
32.4%
11.3%
4.0%
1996
52.4%
59.3%
40.0%
31.0%
7.7%
9.7%
Breakdown of population affiliated with a religious congregation
Type
Adherents
Congregations
Religion
Austin
Glendale
Austin
Glendale
CATHOLIC CHURCH
17.3%
36.1%
4.5%
4.7%
SOUTHERN BAPTIST CONVENTION
8.0%
1.0%
22.8%
9.0%
EPISCOPAL CHURCH
1.4%
0.4%
2.8%
1.4%
MUSLIM ESTIMATE
1.2%
0.7%
0.7%
1.0%
EVANGELICAL LUTHERAN CHURCH IN AMERICA
1.0%
0.2%
2.5%
1.9%
LUTHERAN CHURCH
0.9%
0.2%
2.1%
1.6%
SEVENTH DAY ADVENTIST CHURCH
0.2%
0.5%
1.0%
2.4%
AMERICAN BAPTIST CHURCHES IN THE USA
0.1%
0.5%
0.1%
3.1%
Weather
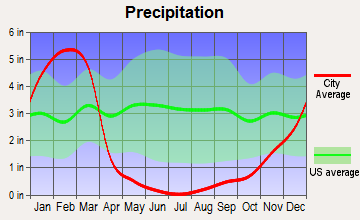
The weather in Austin is characterized by hot, humid summers, and mild winters, attracting those who enjoy warmer climates. On the other hand, Glendale experiences a Mediterranean climate with hot summers and mild, wet winters, providing a balance for those who like a bit of seasonal variation. Both cities receive more sunny days than the US average.
Weather and climate
Type
Austin
Glendale
Temperature - Average
68.5°F
65.2°F
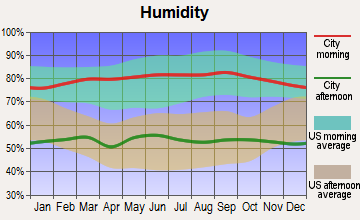
Humidity - Average morning or afternoon humidity
75.2%
61.3%
Humidity - Differences between morning and afternoon humidity
40%
16.4%
Humidity - Maximum monthly morning or afternoon humidity
89%
65.6%
Humidity - Minimum monthly morning or afternoon humidity
49%
49.2%
Precipitation - Yearly average
33.7 in
22.2 in
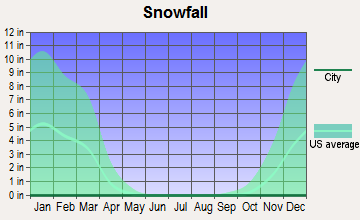
Snowfall - Yearly average
1.4 in
0 in
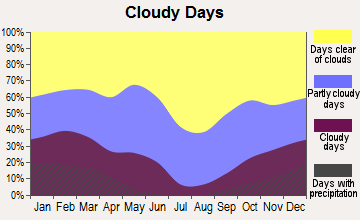
Clouds - Number of days clear of clouds
19.3%
29.4%
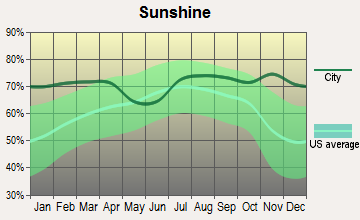
Sunshine amount - Average
63.3%
78.4%
Sunshine amount - Differences during a year
22%
22%
Sunshine amount - Maximum monthly
72%
85%
Sunshine amount - Minimum monthly
50%
63%
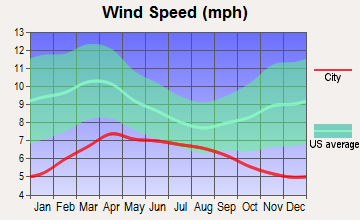
Wind speed - Average
7.2 mph
2.2 mph
Average climate in Austin, Texas
Average climate in Glendale, California
Air pollution
Type
AQI
CO
NO2
OZONE
PB
PM10
PM25
SO2
Year
Austin
Glendale
Austin
Glendale
Austin
Glendale
Austin
Glendale
Glendale
Glendale
Austin
Glendale
Austin
Glendale
2018
76
138
N/A
0.38
4.9
13.2
26.7
27.2
0.008
N/A
28.1
N/A
8.7
15.3
0.2
0.4
2017
76
145
N/A
0.40
4.6
14.0
29.7
28.3
0.007
N/A
31.8
N/A
8.3
15.5
0.3
0.4
2016
71
131
N/A
0.37
4.2
13.9
29.5
27.3
0.007
N/A
30.3
N/A
8.2
14.7
0.2
0.3
2015
78
138
N/A
0.38
4.4
14.1
28.9
27.7
0.006
N/A
29.5
N/A
8.6
16.3
0.3
0.2
2014
74
144
N/A
0.41
5.2
16.3
28.3
27.6
0.006
N/A
30.9
N/A
8.7
18.4
0.5
0.3
2013
78
140
0.09
0.45
5.5
18.9
29.5
27.0
0.007
N/A
25.4
N/A
8.6
17.2
0.5
0.3
2012
86
148
0.13
0.46
5.5
19.4
30.1
25.5
0.007
N/A
24.4
N/A
8.6
17.8
N/A
0.5
2011
83
144
0.11
0.48
2.6
20.4
33.0
23.2
0.009
N/A
25.8
N/A
9.1
18.7
N/A
0.4
2010
77
133
0.05
0.48
3.2
21.6
29.4
23.3
0.012
N/A
24.1
N/A
8.8
17.0
N/A
0.7
2009
76
154
0.05
0.48
2.6
24.5
29.7
24.0
0.011
N/A
40.6
N/A
9.0
19.3
N/A
0.5
2008
81
154
0.12
0.51
3.2
25.8
30.7
23.4
0.014
N/A
37.5
N/A
9.7
18.2
N/A
0.8
2007
82
130
0.12
0.55
3.1
26.2
27.1
22.3
0.016
N/A
N/A
N/A
9.8
N/A
N/A
1.1
2006
89
134
0.14
0.62
3.8
25.5
31.3
22.2
0.009
N/A
N/A
N/A
10.0
N/A
0.2
0.9
2005
92
134
0.15
0.69
4.4
26.7
29.0
20.8
0.015
N/A
N/A
N/A
10.7
N/A
0.2
1.8
2004
74
142
0.16
0.77
3.3
29.7
26.8
24.4
0.019
N/A
N/A
N/A
N/A
N/A
N/A
2.4
2003
85
147
0.26
0.96
4.2
32.4
28.9
23.0
0.027
N/A
N/A
N/A
N/A
N/A
0.1
1.4
2002
83
154
0.33
1.03
3.9
36.0
27.2
21.5
0.022
N/A
N/A
N/A
N/A
N/A
N/A
2.1
2001
83
143
0.31
1.09
4.2
36.9
25.5
18.9
0.028
N/A
N/A
N/A
N/A
N/A
N/A
1.3
2000
86
151
0.28
1.20
4.7
36.8
27.8
19.4
0.025
N/A
N/A
N/A
N/A
N/A
N/A
0.8
Natural disasters
Type
Austin
Glendale
Tornado activity compared to U.S. average
137.9%
16.5%
Earthquake activity compared to U.S. average
80.4%
7,228.9%
Natural disasters compared to U.S. average
29%
57%
Transportation
Austin's transportation system includes a rising public transit system and plentiful bike lanes. Glendale, part of the LA metropolitan area, boasts impressive connectivity through Metrolink trains and Metro buses. Traffic congestion can be an issue in both cities.
Transport
Type
Austin
Glendale
Amtrak stations
1
1
Amtrak stations nearby
1
3
FAA registered aircraft
911
76
FAA registered aircraft manufacturers and dealers
21
3
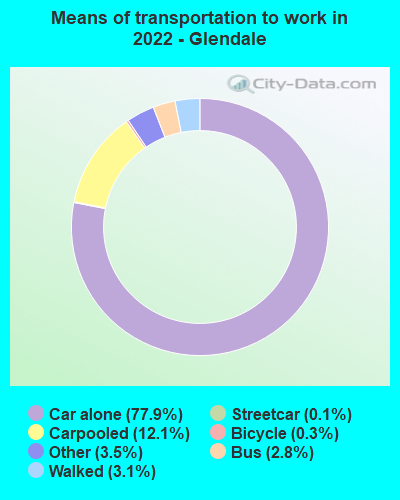
Means of transportation to work
Type
Austin
Glendale
Bicycle
0.8%
0.5%
Bus
1.5%
2.6%
Carpooled
7.9%
9.5%
Car alone
85.9%
81.7%
Motorcycle
0.3%
0.1%
Railroad
0%
0.2%
Taxicab
0.1%
0.1%
Walked
2%
3.4%
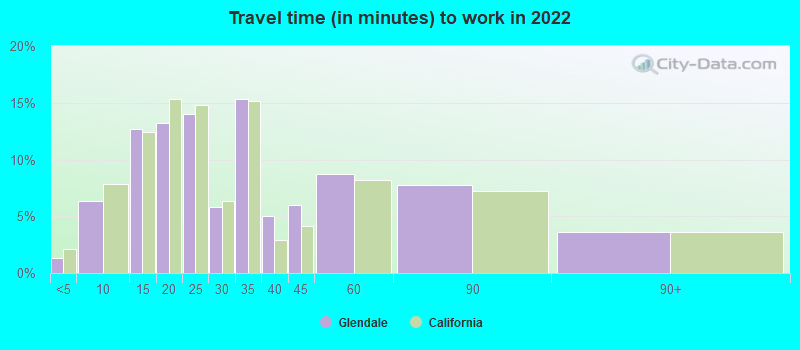
Average travel time to work
Type
Austin
Glendale
Average
29.9 min
29.8 min
Other means
22.7 min
28 min
Public transportation
37.9 min
45 min
Private vehicle occupancy
Type
Austin
Glendale
Average
1.1
1.1
Drove alone
91.2%
94.8%
In 2 person carpool
6.3%
4%
In 3 person carpool
1.7%
0.5%
In 4 person carpool
0.6%
0.3%
In 5-6 person carpool
0.1%
0.4%
In 7+ person carpool
0.2%
0%
How many people usually rode to work in the car, truck or van.
Real Estate
In terms of real estate, prices in Glendale are significantly higher due to its location within the Los Angeles area. Austin, while still competitive, is generally more affordable, subsequently attracting more real estate investments.
Neighborhoods
Both Austin and Glendale are known for their unique neighborhood scenes. Austin's Eastside is famous for its eclectic mix of art and music scenes, while Glendale's downtown offers a mix of shopping, dining, and entertainment options.
Houses and residents
Type
Austin
Glendale
Houses
469,156
76,220
Average household size (people)
2.4
2.6
Median year apartment built
1997
1971
Median year house/condo built
1988
1955
Length of stay in the house since moving in
12.1 years
15.8 years
Houses occupied
449,399 (95.8%)
70,831 (92.9%)
Houses occupied by owners
196,458 (43.7%)
25,211 (35.6%)
Houses occupied by renters
252,941 (56.3%)
45,620 (64.4%)
Median rent asked for vacant for-rent units
$1,286
$1,925
Median monthly housing costs
$1,521
$2,004
Median price asked for vacant for-sale houses and condos
$549,769
$886,794
Estimated median house or condo value
$482,900
$995,700
Median numbers of rooms
4.4
4.5
Median number of rooms in apartments
3.4
4
Median number of rooms in houses and condos
6
6
Median house price - detached houses
$595,996
Over $1,000,000
Median house price - in 2-unit structures
$393,984
$692,572
Median house price - in 3-to-4-unit structures
$262,826
Over $1,000,000
Median house price - in 5 or more unit structures
$576,111
$790,093
Median house price - Townhouses or other attached units
$459,657
$720,498
Median house price - All housing units
$571,154
Over $1,000,000
Median house age
28
55
Renting percentage
54.9%
61.9%
Housing density (houses/condos per square mile)
1,865.3
2,487.2
House value disparities
28.4%
20.5%
Household income disparities
44.8%
46.1%
Median household income for houses/condes with a mortgage
$141,177
$145,822
Median household income for apartments without a mortgage
$86,430
$86,918
Housing units without a mortgage
1,799 (1.3%)
313 (1.8%)
Housing units with both a second mortgage and home equity loan
6,421 (4.8%)
1,058 (6%)
Housing units with a mortgage
132,628 (98.7%)
17,459 (98.2%)
Housing units with a home equity loan
206 (0.2%)
128 (0.7%)
Housing units with a second mortgage
8,515 (6.3%)
1,688 (9.5%)
House/condo owner moved in on average (years ago)
9
16
House/condo renter moved in on average (years ago)
1
4
Housing units lacking complete kitchen facilities
0.9%
4.6%
Housing units lacking complete plumbing facilities
0.6%
1%
Housing units in structures
Housing units in structures
Austin
Glendale
One, detached
43.1%
33.7%
One, attached
5.2%
3.3%
Two
2.4%
2.0%
3 or 4
4.1%
6.5%
5 to 9
7.2%
14.9%
10 to 19
11.0%
12.4%
20 to 49
8.9%
16.1%
50 or more
17.2%
10.6%
Mobile homes
1.0%
0.4%
Median real estate property taxes paid for housing units
Self-employed workers in own not incorporated business
38,777
8,104
State government workers
46,229
2,498
Unpaid family workers
102
49
Industries and Occupations
The primary industries in Austin are technology, education, and healthcare. In Glendale, the entertainment industry takes center stage, followed by healthcare and retail. Both cities have diverse job opportunities for various occupations.
Both Austin and Glendale have excellent healthcare systems. Austin has some of Texas' best hospitals like the St David's Medical Center, while Glendale's notable healthcare institutions include the Adventist Health Glendale.
Health (county statistics)
Type
Austin
Glendale
General health status score of residents in this county from 1 (poor) to 5 (excellent)
Austin offers modern infrastructure with an emphasis on sustainability. It's also famous for its well-arranged biking lanes and trails. Glendale's location in Los Angeles County means access to the vast Los Angeles infrastructure, including LAX, one of the busiest airports in the world.
HMDA - Conventional home purchase loans - Applications denied
Year
Austin
Glendale
1999
4,733
441
2000
2,950
398
2001
2,038
285
2002
1,772
311
2003
2,213
435
2004
2,458
532
2005
3,121
745
2006
3,367
924
2007
2,560
695
2008
1,747
348
2009
1,067
151
Culture and Food
Austin is renowned for its music scene, being dubbed "The Live Music Capital of the World." Meanwhile, Glendale has a strong Armenian influence, offering a unique food culture. Both cities offer a range of cultural and gastronomical experiences.
Sports Teams
Austin is home to Austin FC in the MLS, but also enjoys proximity to the sports teams of Dallas and Houston. Glendale residents get to enjoy the myriad sports teams of Los Angeles including Lakers (NBA), Dodgers (MLB), and Rams (NFL).


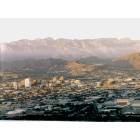

 Austin, TX
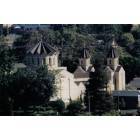
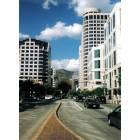
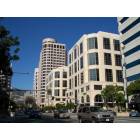
 Glendale, CA