When comparing Austin, TX with Huntington Beach, CA, various factors like crime and safety, weather, cost of living, and more need to be considered. They're both cities of opportunity and growth with unique culture, weather patterns, and economic landscapes. Austin's tech boom contrasts with Huntington's surf culture, leading to two very distinct lifestyles. There’s plenty of information to explore about these two cities, so let’s dive into the details.
Distance between
Austin, TX and
Huntington Beach, CA : 1,207.5 miles
Austin's population is larger by 390%. Its population has grown by 307,615 people (46.9%) since 2000. The population of Huntington Beach has grown by 7,058 people (3.7%) during that time.
Both Austin and Huntington Beach are relatively safe cities, though crime rates do vary slightly. Austin, being a larger city, has a higher crime rate, though many locals report feeling safe, with police presence and neighborhood watch groups noticeable. Huntington Beach, a smaller coastal city, has a lower crime rate, with proactive policing playing a significant role. Despite these statistics, it's important to remember that safety can vary by neighborhood in both cities.
City-data.com crime index counts serious crimes and violent crime more heavily. It adjusts for the number of visitors and daily workers commuting into cities. (higher means more crime, U.S. average = 301.1)
City-data.com crime index counts serious crimes and violent crime more heavily. It adjusts for the number of visitors and daily workers commuting into cities. (higher means more crime, U.S. average = 301.1)
Sex Offenders
According to our data, there are 1,407 registered sex offenders living in Austin and 123 registered sex offenders living in . The ratio of residents to sex offenders in Austin is 674 to 1; the ratio in Huntington Beach is 1,631 to 1. The number of registered sex offenders compared to the number of residents is larger in Austin than in Huntington Beach.
Cost of Living
Living in Austin is generally less expensive when compared to Huntington Beach. Items like groceries, housing, utilities, and transportation tend to be more affordable in Austin, making it a more budget-friendly city. Meanwhile, Huntington Beach, located in the expensive state of California, has a significantly higher cost of living, especially in regards to housing and taxes.
Income Tax
Residents of Austin enjoy a notable financial advantage as Texas does not impose a state income tax. On the other side, California residents, including those in Huntington Beach, are subject to one of the highest state income tax rates in the U.S, which can go up to 13.3% depending on income.
Property Tax
While there's no state property tax in Texas, local governments and school districts in Austin do levy property taxes, averaging around 1.83%. Huntington Beach residents face a lower property tax rate, with the average in Orange County being about 0.72%.
Sales Tax
Texas doesn’t levy any state sales tax which benefits Austin, but the city does impose a tax, summing up to around 8.25%. In comparison, Huntington Beach residents and visitors face California's state sales tax rate of 7.25%, plus a local tax which brings the total to approximately 7.75%.
Income
Type
Austin
Huntington Beach
Estimated median household income
$79,542
$107,808
Estimated per capita income
$53,937
$56,934
Cost of living index (U.S. average is 100)
96.4
89.5
If you make $50,000 in Huntington Beach, you will have to make $53,855 in Austin to maintain the same standard of living.
Geographical Conditions
Austin is situated in Central Texas and features hilly terrain with several rivers and lakes. In contrast, Huntington Beach is a coastal city with beautiful sandy beaches and a generally flat landscape.
Both Austin and Huntington Beach are known for their strong commitment to education. Austin is home to the University of Texas, one of the largest universities in the U.S, and boasts high rankings for its public and charter schools. Huntington Beach also has great schools, particularly in the Huntington Beach City School District and Huntington Beach Union High School District. Education options are plentiful in both cities, making them appealing for families.
Austin's economy is booming, especially in the tech industry, earning it the nickname "Silicon Hills". Major corporations like Apple, Google, and IBM have offices here, providing plenty of job opportunities. Huntington Beach's economy leans more towards tourism, retail, and healthcare, with companies like Quiksilver and Boeing being major employers.
Biggest Employers
In Austin, the biggest employer is the state government, particularly the University of Texas. Followed by major tech corporations like Dell, IBM, and Indeed. On the other hand, Huntington Beach's largest employers include the City of Huntington Beach, Boeing, Quiksilver, and Huntington Beach Hospital.
There were 4,180 building permits issued in Austin in 2012 (2467 more than in 2011) compared to 100 building permits issued in Huntington Beach in 2012 (76 more than in 2011).
In Austin (Travis County), 60.2% voted for Democrats and 36.2% for Republicans in 2012 Presidential Election. In Huntington Beach (Orange County), 45.8% voted for Democrats and 52.0% for Republicans.
Elections
Type
Democrats
Republicans
Other
Year
Austin
Huntington Beach
Austin
Huntington Beach
Austin
Huntington Beach
2020
71.7%
53.6%
26.5%
44.6%
1.8%
1.8%
2016
65.8%
50.9%
27.2%
42.4%
7.0%
6.7%
2012
60.2%
45.8%
36.2%
52.0%
3.6%
2.3%
2008
63.8%
47.8%
34.4%
50.3%
1.8%
1.9%
2004
56.1%
39.3%
42.1%
60.2%
1.8%
0.5%
2000
41.7%
40.4%
47.0%
55.9%
11.3%
3.7%
1996
52.4%
37.9%
40.0%
51.7%
7.7%
10.5%
Breakdown of population affiliated with a religious congregation
Type
Adherents
Congregations
Religion
Austin
Huntington Beach
Austin
Huntington Beach
CATHOLIC CHURCH
17.3%
26.5%
4.5%
4.4%
SOUTHERN BAPTIST CONVENTION
8.0%
2.3%
22.8%
8.8%
EPISCOPAL CHURCH
1.4%
0.4%
2.8%
1.4%
MUSLIM ESTIMATE
1.2%
0.8%
0.7%
1.3%
EVANGELICAL LUTHERAN CHURCH IN AMERICA
1.0%
0.4%
2.5%
2.3%
LUTHERAN CHURCH
0.9%
0.6%
2.1%
2.0%
SEVENTH DAY ADVENTIST CHURCH
0.2%
0.4%
1.0%
1.3%
REFORMED CHURCH IN AMERICA
0.0%
0.3%
0.0%
0.2%
Weather
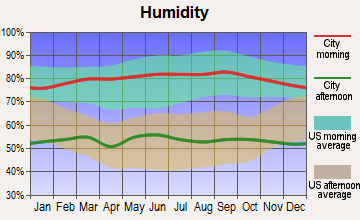
There's a stark contrast in the weather between these two cities. Austin experiences a humid subtropical climate with hot summers and mild winters. Huntington Beach, located on the west coast, enjoys a Mediterranean climate with mild, wet winters and warm, dry summers. It's important for potential relocators and tourists alike to consider these factors as they can greatly impact daily life and travel plans.
Weather and climate
Type
Austin
Huntington Beach
Temperature - Average
68.5°F
64.3°F
Humidity - Average morning or afternoon humidity
75.2%
70.1%
Humidity - Differences between morning and afternoon humidity
40%
26.7%
Humidity - Maximum monthly morning or afternoon humidity
89%
78.7%
Humidity - Minimum monthly morning or afternoon humidity
49%
52%
Precipitation - Yearly average
33.7 in
12.9 in
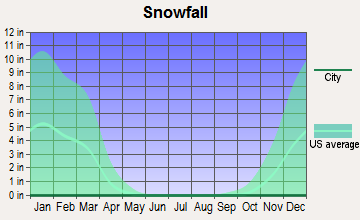
Snowfall - Yearly average
1.4 in
0 in
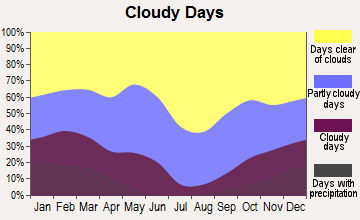
Clouds - Number of days clear of clouds
19.3%
26.5%
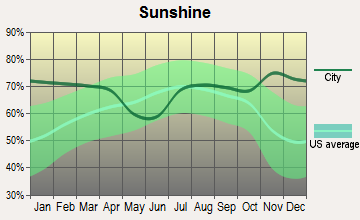
Sunshine amount - Average
63.3%
78.4%
Sunshine amount - Differences during a year
22%
21.9%
Sunshine amount - Maximum monthly
72%
84.8%
Sunshine amount - Minimum monthly
50%
62.9%
Wind speed - Average
7.2 mph
6 mph
Average climate in Austin, Texas
Average climate in Huntington Beach, California
Air pollution
Type
AQI
CO
NO2
OZONE
PB
PM10
PM25
SO2
Year
Austin
Huntington Beach
Austin
Huntington Beach
Austin
Huntington Beach
Austin
Huntington Beach
Huntington Beach
Huntington Beach
Austin
Huntington Beach
Austin
Huntington Beach
2018
76
119
N/A
0.35
4.9
14.5
26.7
26.2
N/A
N/A
27.5
N/A
8.7
12.7
0.2
0.7
2017
76
116
N/A
0.33
4.6
13.6
29.7
29.3
N/A
N/A
26.7
N/A
8.3
13.9
0.3
0.5
2016
71
102
N/A
0.31
4.2
11.8
29.5
29.9
N/A
N/A
24.1
N/A
8.2
12.4
0.2
0.2
2015
78
106
N/A
0.30
4.4
12.8
28.9
30.4
N/A
N/A
25.0
N/A
8.6
14.4
0.3
0.2
2014
74
110
N/A
0.27
5.2
12.4
28.3
29.0
N/A
N/A
26.7
N/A
8.7
15.4
0.5
0.4
2013
78
107
0.09
0.32
5.5
13.4
29.5
28.2
0.003
N/A
29.7
N/A
8.6
14.2
0.5
0.3
2012
86
103
0.13
0.27
5.5
12.1
30.1
27.1
0.004
N/A
28.3
N/A
8.6
14.3
N/A
0.1
2011
83
109
0.11
0.30
2.6
14.2
33.0
27.3
0.006
N/A
27.7
N/A
9.1
15.8
N/A
0.7
2010
77
102
0.05
0.31
3.2
13.6
29.4
26.5
0.011
N/A
23.6
N/A
8.8
13.9
N/A
0.6
2009
76
118
0.05
0.33
2.6
14.9
29.7
28.1
0.009
N/A
24.3
N/A
9.0
14.4
N/A
1.1
2008
81
124
0.12
0.38
3.2
15.7
30.7
28.7
0.010
N/A
29.3
N/A
9.7
21.6
N/A
1.1
2007
82
100
0.12
0.35
3.1
15.6
27.1
27.4
0.012
N/A
N/A
N/A
9.8
N/A
N/A
0.8
2006
89
114
0.14
0.39
3.8
16.6
31.3
26.6
0.007
N/A
N/A
N/A
10.0
N/A
0.2
1.3
2005
92
95
0.15
0.37
4.4
16.8
29.0
28.2
0.012
N/A
N/A
N/A
10.7
N/A
0.2
1.3
2004
74
119
0.16
0.49
3.3
18.5
26.8
30.6
0.014
N/A
N/A
N/A
N/A
N/A
N/A
1.6
2003
85
122
0.26
0.63
4.2
21.1
28.9
30.0
0.030
N/A
N/A
N/A
N/A
N/A
0.1
1.1
2002
83
106
0.33
0.63
3.9
21.2
27.2
26.3
0.018
N/A
N/A
N/A
N/A
N/A
N/A
1.7
2001
83
116
0.31
0.71
4.2
21.0
25.5
26.0
0.033
N/A
N/A
N/A
N/A
N/A
N/A
1.5
2000
86
125
0.28
0.80
4.7
23.3
27.8
24.6
0.027
N/A
N/A
N/A
N/A
N/A
N/A
1.9
Natural disasters
Type
Austin
Huntington Beach
Tornado activity compared to U.S. average
137.9%
18.5%
Earthquake activity compared to U.S. average
80.4%
6,818%
Natural disasters compared to U.S. average
29%
32%
Transportation
Austin offers numerous public transit options including buses, rail services, bike-sharing programs, and ride-hailing services. Commuting can be impacted by traffic during peak hours. In Huntington Beach, public transit options are more limited, with many residents preferring cars for their daily commute.
Transport
Type
Austin
Huntington Beach
Amtrak stations
1
0
Amtrak stations nearby
1
3
FAA registered aircraft
911
156
FAA registered aircraft manufacturers and dealers
21
6
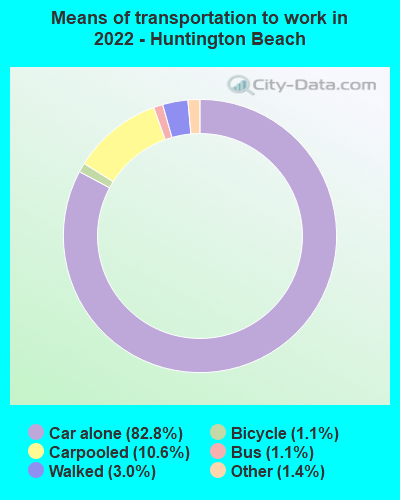
Means of transportation to work
Type
Austin
Huntington Beach
Bicycle
0.8%
0.4%
Bus
1.5%
1.1%
Carpooled
7.9%
9.8%
Car alone
85.9%
85.3%
Motorcycle
0.3%
0.2%
Taxicab
0.1%
0%
Walked
2%
2%
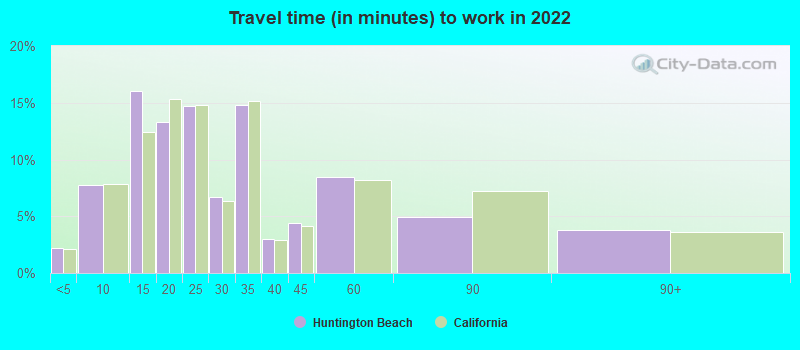
Average travel time to work
Type
Austin
Huntington Beach
Average
29.9 min
25.6 min
Other means
22.7 min
30.1 min
Public transportation
37.9 min
42.2 min
Private vehicle occupancy
Type
Austin
Huntington Beach
Average
1.1
1.1
Drove alone
91.2%
92.2%
In 2 person carpool
6.3%
6.3%
In 3 person carpool
1.7%
1%
In 4 person carpool
0.6%
0.5%
In 7+ person carpool
0.2%
0%
How many people usually rode to work in the car, truck or van.
Real Estate
Austin's real estate market is one of the hottest in the country, with housing prices rapidly rising due to demand. Huntington Beach also has a competitive real estate market, but the prices are significantly higher due to its coastal location and California's generally pricey market.
Neighborhoods
Austin neighborhoods such as Zilker, Hyde Park, and Barton Hills are popular for their eclectic mix of food, music, and outdoor activities. In Huntington Beach, neighborhoods like Seacliff and Downtown are popular for their proximity to the beach, shopping, and surf culture.
Houses and residents
Type
Austin
Huntington Beach
Houses
469,156
83,658
Average household size (people)
2.4
2.6
Median year apartment built
1997
1976
Median year house/condo built
1988
1971
Length of stay in the house since moving in
12.1 years
16.6 years
Houses occupied
449,399 (95.8%)
79,930 (95.5%)
Houses occupied by owners
196,458 (43.7%)
45,454 (56.9%)
Houses occupied by renters
252,941 (56.3%)
34,476 (43.1%)
Median rent asked for vacant for-rent units
$1,286
$2,370
Median monthly housing costs
$1,521
$2,132
Median price asked for vacant for-sale houses and condos
$549,769
$672,773
Estimated median house or condo value
$482,900
$937,200
Median numbers of rooms
4.4
5.3
Median number of rooms in apartments
3.4
4.1
Median number of rooms in houses and condos
6
6.2
Median house price - detached houses
$595,996
Over $1,000,000
Median house price - in 2-unit structures
$393,984
Over $1,000,000
Median house price - in 3-to-4-unit structures
$262,826
$728,022
Median house price - in 5 or more unit structures
$576,111
$577,548
Median house price - mobile homes
$56,102
$94,814
Median house price - Townhouses or other attached units
$459,657
$754,302
Median house price - All housing units
$571,154
$992,600
Median house age
28
48
Renting percentage
54.9%
39.5%
Housing density (houses/condos per square mile)
1,865.3
3,169.8
House value disparities
28.4%
21.8%
Household income disparities
44.8%
40.7%
Median household income for houses/condes with a mortgage
$141,177
$154,344
Median household income for apartments without a mortgage
$86,430
$104,573
Housing units without a mortgage
1,799 (1.3%)
644 (2.2%)
Housing units with both a second mortgage and home equity loan
6,421 (4.8%)
2,305 (8%)
Housing units with a mortgage
132,628 (98.7%)
28,306 (97.8%)
Housing units with a home equity loan
206 (0.2%)
132 (0.5%)
Housing units with a second mortgage
8,515 (6.3%)
2,690 (9.3%)
House/condo owner moved in on average (years ago)
9
17
House/condo renter moved in on average (years ago)
1
3
Housing units lacking complete kitchen facilities
0.9%
0.6%
Housing units in structures
Housing units in structures
Austin
Huntington Beach
One, detached
43.1%
50.0%
One, attached
5.2%
10.5%
Two
2.4%
1.0%
3 or 4
4.1%
13.6%
5 to 9
7.2%
4.7%
10 to 19
11.0%
5.0%
20 to 49
8.9%
2.9%
50 or more
17.2%
9.2%
Mobile homes
1.0%
3.2%
Median real estate property taxes paid for housing units
Self-employed workers in own not incorporated business
38,777
7,644
State government workers
46,229
2,609
Unpaid family workers
102
245
Industries and Occupations
Austin has a diverse economic landscape with numerous industries including technology, pharmaceuticals, biotechnology, music, film, and more. In Huntington Beach, the economy is largely influenced by sectors such as tourism, aerospace, technology, and surfwear.
Both cities have high-quality healthcare facilities. In Austin, Seton Medical Center and St. David’s Hospital are top-rated. Huntington Beach hosts the well-regarded Huntington Beach Hospital among other quality healthcare providers.
Health (county statistics)
Type
Austin
Huntington Beach
General health status score of residents in this county from 1 (poor) to 5 (excellent)
Austin's infrastructure is highly developed, catering to its fast-growing population with an efficient public transit system, an international airport, and well-maintained roads. Huntington Beach also has solid infrastructure, though with less public transit options, relying more on car-oriented transport due to its spread-out layout.
Infrastructure
Type
Austin
Huntington Beach
Hospitals
65
2
TV stations
20
2
Bank branches located here
264
46
Bank institutions located here
43
19
Main business address for public companies
44
3
Drinking water stations with no reported violations in the past
46
0
Drinking water stations with reported violations in the past
HMDA - Conventional home purchase loans - Applications denied
Year
Austin
Huntington Beach
1999
4,733
756
2000
2,950
771
2001
2,038
544
2002
1,772
493
2003
2,213
703
2004
2,458
738
2005
3,121
952
2006
3,367
715
2007
2,560
604
2008
1,747
375
2009
1,067
232
Culture and Food
Austin is known for its lively music scene, diverse cultural festivals, and delicious Tex-Mex and barbecue cuisine. Huntington Beach offers a beach town feel with a laid-back surf culture, seafood eateries, and local cultural events by the beach throughout the year.
Sports Teams
Austin is home to the University of Texas Longhorns and recently welcomed Austin FC to the Major League Soccer. Huntington Beach doesn’t house any major league sports teams, but Los Angeles' teams like the Dodgers (MLB), Lakers (NBA), and Rams (NFL) are within an hour's drive.


 Austin, TX
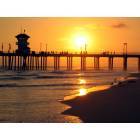
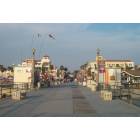
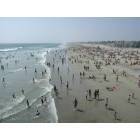
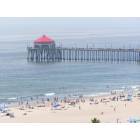
 Huntington Beach, CA