Austin, TX vs Riverside, CA - Advanced U.S. city comparison tool

Austin, TX vs Riverside, CA

Austin and Riverside, although belonging to different states, both offer unique attractions to both residents and tourists alike. Each city has its peculiarities, strengths, and areas that could be improved. The comparison of these two regions involves various aspects, including safety, weather, economy, education, real estate, and cultural factors.
 
 
Distance between Austin, TX and Riverside, CA : 1,175.0 miles

Austin's population is larger by 204%. Its population has grown by 307,615 people (46.9%) since 2000. The population of Riverside has grown by 62,095 people (24.3%) during that time.

Population
Type Austin Riverside
Population 964,177 317,261
Female / male percentage 49.1% / 50.9%
49.1%
50.9%
50.9% / 49.1%
50.9%
49.1%
Racial makeup - percentage
Ethnicity AustinRiverside
White Non-Hispanic 48.0% 25.3%
Hispanic 32.0% 55.9%
Asian 8.4% 8.5%
Black 7.2% 6.6%
Two or more 4.0% 2.9%
American Indian 0.1% 0.1%
Pacific Islander 0.0% 0.5%
Racial makeup - absolute values
Ethnicity AustinRiverside
White Non-Hispanic 462,327 80,131
Hispanic 308,048 177,393
Asian 80,604 26,833
Black 69,861 20,964
Two or more 38,106 9,201
American Indian 971 271
Pacific Islander 214 1,531

Crime and Safety

Austin, TX, consistently ranks as one of the safest major cities in America. The city's crime rates are lower than the national average, with property crimes being more common than violent crimes. On the other hand, Riverside, CA, has higher crime rates in comparison to Austin, with the crime rate being above the national average. The most frequent crimes in Riverside are property offenses, similar to Austin.

Crime by year per 100,000 residents
Type City-data.com crime indexRobberies per 100,000Murders per 100,000Rapes per 100,000Assaults per 100,000Burglaries per 100,000Theft per 100,000Auto theft per 100,000Arson per 100,000
Year AustinRiversideAustinRiversideAustinRiversideAustinRiversideAustinRiversideAustinRiversideAustinRiversideAustinRiversideAustinRiverside
2020 316.8 295.7 110.1 117.8 4.4 6.0 47.8 45.5 304.7 276.6 477.3 490.2 2,747.3 1,930.8 406.6 563.7 13.4 28.7
2019 307.7 296.8 102.6 142.8 3.3 5.1 58.3 41.7 246.5 316.3 440.6 390.7 2,969.3 2,099.6 307.8 447.4 10.4 22.5
2018 304.1 312.3 104.9 164.0 3.3 4.2 80.9 45.3 193.1 295.8 467.4 444.1 2,729.6 2,087.8 260.8 557.4 5.8 22.1
2017 299.1 314.0 101.5 165.8 2.7 3.7 85.8 50.6 224.9 288.7 450.6 510.0 2,525.0 2,020.9 213.9 527.4 7.8 22.3
2016 312.4 335.5 109.5 179.8 4.1 3.1 78.1 43.3 216.2 302.9 548.8 606.6 2,738.4 2,256.9 221.4 593.4 7.7 17.5
2015 296.7 303.6 99.0 161.0 2.5 3.1 51.9 42.4 219.2 239.6 532.6 505.5 2,990.0 2,211.3 248.3 542.9 9.7 22.0
2014 328.0 291.2 96.6 138.0 3.5 3.8 63.2 44.8 232.9 246.7 634.2 479.3 3,255.0 2,126.8 253.1 481.8 10.5 27.5
2013 329.1 294.8 88.8 156.4 3.0 3.2 25.3 24.7 246.4 236.1 762.4 625.1 3,834.8 2,184.4 252.5 542.9 12.2 23.7
2012 361.2 307.2 117.4 164.9 3.7 5.1 25.1 24.2 262.6 248.8 869.7 716.7 4,071.7 2,262.9 277.9 470.8 14.5 20.7
2011 367.6 281.0 137.0 149.0 3.3 4.2 26.1 18.5 263.4 254.4 872.6 676.5 4,097.7 2,042.0 265.0 414.1 15.7 15.9
2010 416.8 303.4 155.7 165.2 4.8 3.0 33.5 25.7 285.4 282.7 1,106.9 680.6 4,406.3 2,117.3 284.7 480.8 15.4 16.1
2009 444.4 319.1 184.0 222.4 2.9 5.0 34.5 32.7 302.0 251.8 1,138.3 673.6 4,818.7 2,080.6 288.6 443.9 12.5 26.3
2008 435.3 377.5 176.9 242.5 3.1 6.3 36.2 36.4 306.0 356.7 1,139.4 737.5 4,456.6 2,415.0 349.4 541.4 11.5 41.8
2007 467.1 370.9 203.3 229.2 4.2 4.0 45.8 30.4 286.8 368.8 1,120.4 744.0 4,807.5 2,365.8 413.1 616.7 16.2 34.4
2006 434.4 414.3 191.3 278.1 2.8 3.8 44.9 28.4 276.3 377.9 1,052.0 810.4 4,446.5 2,552.5 358.4 828.2 12.4 44.8
2005 361.5 389.9 170.6 232.5 3.8 3.4 45.0 38.9 270.3 398.2 1,051.2 860.5 4,593.7 2,809.9 367.7 954.2 16.6 71.7
2004 370.8 366.5 205.8 197.7 3.8 6.0 44.3 31.6 271.2 388.7 996.6 833.0 4,674.1 2,671.7 385.8 883.9 17.0 75.2
2003 360.0 396.7 183.3 206.8 4.0 8.7 33.1 36.8 241.7 439.2 1,061.1 791.8 4,727.8 2,922.4 406.1 937.9 20.5 83.4

City-data.com crime index counts serious crimes and violent crime more heavily. It adjusts for the number of visitors and daily workers commuting into cities. (higher means more crime, U.S. average = 301.1)


Crime per year
Type City-data.com crime indexRobberiesMurdersRapesAssaultsBurglariesTheftAuto theftArson
Year AustinRiversideAustinRiversideAustinRiversideAustinRiversideAustinRiversideAustinRiversideAustinRiversideAustinRiversideAustinRiverside
2019 307.7 296.8 1,012 476 33 17 575 139 2,431 1,054 4,345 1,302 29,279 6,997 3,035 1,491 103 75
2018 304.1 312.3 1,021 543 32 14 787 150 1,880 979 4,549 1,470 26,568 6,911 2,538 1,845 56 73
2017 299.1 314.0 987 544 26 12 834 166 2,186 947 4,380 1,673 24,542 6,629 2,079 1,730 76 73
2016 312.4 335.5 1,048 586 39 10 747 141 2,069 987 5,252 1,977 26,204 7,355 2,119 1,934 74 57
2015 296.7 303.6 929 520 23 10 487 137 2,058 774 5,000 1,633 28,068 7,144 2,331 1,754 91 71
2014 328.0 291.2 873 441 32 12 571 143 2,105 788 5,733 1,531 29,423 6,794 2,288 1,539 95 88
2013 329.1 294.8 763 495 26 10 217 78 2,117 747 6,550 1,978 32,948 6,912 2,169 1,718 105 75
2012 361.2 307.2 978 517 31 16 209 76 2,187 780 7,244 2,247 33,913 7,095 2,315 1,476 121 65
2011 367.6 281.0 1,106 458 27 13 211 57 2,126 782 7,042 2,080 33,069 6,278 2,139 1,273 127 49
2010 416.8 303.4 1,231 502 38 9 265 78 2,256 859 8,749 2,068 34,827 6,434 2,250 1,461 122 49
2009 444.4 319.1 1,415 667 22 15 265 98 2,322 755 8,753 2,020 37,054 6,239 2,219 1,331 96 79
2008 435.3 377.5 1,333 726 23 19 273 109 2,306 1,068 8,586 2,208 33,582 7,230 2,633 1,621 87 125
2007 467.1 370.9 1,457 686 30 12 328 91 2,056 1,104 8,031 2,227 34,461 7,081 2,961 1,846 116 103
2006 434.4 414.3 1,358 814 20 11 319 83 1,961 1,106 7,467 2,372 31,562 7,471 2,544 2,424 88 131
2005 361.5 389.9 1,182 675 26 10 312 113 1,873 1,156 7,285 2,498 31,835 8,157 2,548 2,770 115 208
2004 370.8 366.5 1,406 563 26 17 303 90 1,853 1,107 6,810 2,372 31,938 7,608 2,636 2,517 116 214
2003 360.0 396.7 1,251 573 27 24 226 102 1,649 1,217 7,240 2,194 32,259 8,098 2,771 2,599 140 231

City-data.com crime index counts serious crimes and violent crime more heavily. It adjusts for the number of visitors and daily workers commuting into cities. (higher means more crime, U.S. average = 301.1)

Sex Offenders

According to our data, there are 1,411 registered sex offenders living in Austin and 616 registered sex offenders living in .
The ratio of residents to sex offenders in Austin is 672 to 1; the ratio in Riverside is 527 to 1.
The number of registered sex offenders compared to the number of residents is a smaller in Austin than in Riverside.

Cost of Living

Austin has a relatively higher cost of living compared to other cities in Texas but is still lower compared to Riverside. Housing, in particular, is more expensive in Riverside than Austin. In terms of food, healthcare, and transportation, both cities have relatively comparable costs.

Income Tax

Texas, including Austin, does not have a state income tax, a huge advantage for residents. However, California residents, including those from Riverside, do pay a state income tax, with rates ranging from 1% to 13.3%, depending on income brackets.

Property Tax

Average property tax rates in Austin are about 1.83%, which is relatively high. Conversely, Riverside residents face a lower property tax rate averaging at 1.07%.

Sales Tax

The sales tax in Austin is 8.25%, with no additional city sales tax. In Riverside, the total sales tax rate is 7.75%, with a 1.75% city sales tax. This difference in sales tax might have an impact on daily shopping and can add up over time.
Income
Type Austin Riverside
Estimated median household income $79,542 $76,558
Estimated per capita income $53,937 $29,013
Cost of living index (U.S. average is 100) 96.4 83

If you make $50,000 in Riverside, you will have to make $58,072 in Austin to maintain the same standard of living.

Geographical Conditions

Austin is located in South Central Texas and is characterized by abundant green spaces, hills, and being home to part of the Colorado River. Riverside, located in Southern California, is known for its rolling hills, natural parks, and proximity to the picturesque Pacific coast.
Geographical information
Type Austin Riverside
Land area 251.5 sq. miles 78.1 sq. miles
Population density 3,833.4 people per sq. mile 4,062.3 people per sq. mile
Relative area comparison
Austin, TX Riverside, CA
First ancestry reported - percentage
Ancestry AustinRiverside
German 4.7% 2.0%
English 4.4% 2.0%
Irish 3.3% 1.7%
Italian 1.3% 1.3%
Scottish 1.0% 0.4%
Scotch-Irish 0.8% 0.2%
French 0.7% 0.4%
Polish 0.7% 0.3%
Czech 0.4% 0.1%
Norwegian 0.4% 0.3%
Russian 0.4% 0.1%
Swedish 0.4% 0.2%
Dutch 0.3% 0.4%
Greek 0.3% 0.1%
Ukrainian 0.2% 0.1%
Arab 0.1% 0.2%
Population origin - absolute values
Ancestry AustinRiverside
German 23,339 4,160
English 21,730 4,100
Irish 16,704 3,453
Italian 6,324 2,585
Scottish 5,082 850
Scotch-Irish 4,002 476
Polish 3,685 570
French 3,488 740
Czech 2,119 157
Norwegian 2,052 563
Swedish 2,050 311
Russian 2,007 246
Dutch 1,343 796
Greek 1,317 263
Ukrainian 999 108
Welsh 926 86
French Canadian 922 258
Hungarian 837 235
Swiss 590 35
Danish 574 184
Foreign born residents - absolute values
Type Count
Region AustinRiverside
All 181,296 73,897
Africa 8,476 1,840
Asia 61,021 17,983
Europe 14,661 2,179
Latin America 91,669 49,583
North America 3,055 445
Oceania 863 245
Foreign born residents - percentage
Type Percentage
Region AustinRiverside
All 18.6% 23.0%
Africa 0.9% 0.6%
Asia 6.3% 5.6%
Europe 1.5% 0.7%
Latin America 9.4% 15.4%
North America 0.3% 0.1%

Education

Austin is home to many prestigious educational institutions, including the University of Texas at Austin, providing high-quality education. Similarly, Riverside houses the University of California, Riverside, and numerous community colleges. There is an emphasis on education in both cities making them an excellent place for families.
School enrollment
Type Austin Riverside
Nursery, preschool 11,123 (5%) 3,395 (3.6%)
Kindergarten 9,376 (4.2%) 3,101 (3.3%)
Grade 1 to 4 41,790 (18.9%) 14,349 (15.2%)
Grade 5 to 8 37,907 (17.1%) 16,802 (17.8%)
Grade 9 to 12 41,993 (19%) 16,534 (17.5%)
College undergrad 55,830 (25.2%) 33,782 (35.9%)
Graduate or professional 23,263 (10.5%) 6,251 (6.6%)
Students in private schools - absolute values
Type Count
Grade AustinRiverside
Grades 1 to 8 (elementary and middle school) 9,143 1,734
Grades 9 to 12 (high school) 2,975 719
Undergraduate colleges 8,830 7,935
Students in private schools - percentage
Type Percentage
Grade AustinRiverside
Grades 1 to 8 (elementary and middle school) 11.5% 5.6%
Grades 9 to 12 (high school) 7.1% 4.3%
Undergraduate colleges 15.8% 23.5%
Educational attainment
Type Austin Riverside
Less than high school 7.2% 16%
High school or equiv. 14.4% 30.2%
Less than 1 year of college 4.1% 6.9%
1 or more years of college 8.6% 15.7%
Associate degree 5.8% 7.8%
Bachelor's degree 37.9% 13.8%
Master's degree 15.7% 6.7%
Profess. school degree 3.6% 1.2%
Doctorate degree 2.6% 1.7%
Education level (25-year-olds and older)
Type Austin Riverside
Bachelor's degree or higher 59.9% 23.4%
Graduate or professional degree 21.9% 9.6%
High school or higher 92.8% 84%

Work and Economy

Austin has a robust job market, with tech and creative industries thriving. Conversely, Riverside has a diverse economy with healthcare, education, and retail trade as the city’s major industries. Unemployment rates in both cities are relatively similar, slightly below the national average.

Biggest Employers

The biggest employers in Austin include the tech giants Apple, Dell, and IBM, as well as the State of Texas and the University of Texas at Austin. In Riverside, top employers include the county of Riverside, University of California, Riverside, and Kaiser Permanente.
Employment and residency - absolute values
Kind AustinRiverside
Work and live in this city 307,600 48,375
Work and live in this county 520,570 110,489
Workers who work outside the city they live in 348,962 206,791
Workers who work outside the county they live in 44,693 40,637
Working at home 219,183 17,473
Not working at home 346,080 133,653
Daytime population change due to commuting 127,328 11,643
Employment and residency - percentage
Kind AustinRiverside
Work and live in this city 87.1% 46.4%
Work and live in this county 92.1% 73.1%
Workers who work outside the city they live in 12.9% 53.6%
Workers who work outside the county they live in 7.9% 26.9%
Working at home 38.8% 11.6%
Not working at home 61.2% 88.4%
Daytime population change due to commuting 19.4% 4.6%
Geographical mobility: all
Type all
Mobility AustinRiverside
Same house 1 year ago 78.4% 88.7%
Moved from abroad 1.4% 0.5%
Moved within same county 11.2% 5.4%
Moved from different state 4.2% 0.7%
Moved within same state 4.8% 4.7%
Geographical mobility: Asian
Type Asian
Mobility AustinRiverside
Same house 1 year ago 76.0% 83.0%
Moved from abroad 1.8% 4.0%
Moved within same county 8.8% 3.4%
Moved from different state 8.3% 1.3%
Moved within same state 5.2% 8.2%
Geographical mobility: Black
Type Black
Mobility AustinRiverside
Same house 1 year ago 72.8% 88.6%
Moved from abroad 0.9% 0%
Moved within same county 16.1% 4.1%
Moved from different state 4.3% 2.3%
Moved within same state 5.8% 5.0%
Geographical mobility: White
Type White
Mobility AustinRiverside
Same house 1 year ago 78.5% 90.4%
Moved from abroad 1.9% 0.5%
Moved within same county 9.6% 4.1%
Moved from different state 5.1% 0.9%
Moved within same state 4.9% 4.1%
Building permits
Type Average valueCount
City AustinRiversideAustinRiverside
1997 $113,500 $152,000 2,380 421
1998 $116,000 $164,000 3,521 630
1999 $124,400 $177,800 3,302 749
2000 $141,200 $186,000 3,361 1,017
2001 $136,600 $205,700 2,119 1,237
2002 $133,400 $196,500 2,431 1,113
2003 $120,000 $201,800 3,117 689
2004 $120,600 $242,500 3,533 847
2005 $127,600 $231,200 4,569 1,441
2006 $135,100 $237,000 4,340 848
2007 $165,100 $259,600 3,155 342
2008 $139,500 $328,500 1,928 69
2009 $139,900 $275,400 1,951 56
2010 $162,200 $260,600 1,664 107
2011 $151,000 $193,300 1,713 43
2012 $146,400 $257,000 2,539 190
2013 $184,600 $258,700 2,573 70
2014 $209,800 $266,200 2,800 230
2015 $211,200 $242,300 2,846 222
2016 $202,400 $221,300 3,705 219
2017 $208,300 $252,900 4,440 208
2018 $208,400 $248,000 4,433 171
2019 $218,000 $211,100 4,568 170
2020 $201,000 $196,500 4,113 180
2021 $167,300 $267,400 4,180 293

There were 4,180 building permits issued in Austin in 2012 (2467 more than in 2011) compared to 293 building permits issued in Riverside in 2012 (250 more than in 2011).

In Austin (Travis County), 60.2% voted for Democrats and 36.2% for Republicans in 2012 Presidential Election. In Riverside (Riverside County), 49.6% voted for Democrats and 48.0% for Republicans.

Elections
Type DemocratsRepublicansOther
Year AustinRiversideAustinRiversideAustinRiverside
2020 71.7% 53.0% 26.5% 45.0% 1.8% 2.0%
2016 65.8% 49.7% 27.2% 44.4% 7.0% 5.9%
2012 60.2% 49.6% 36.2% 48.0% 3.6% 2.4%
2008 63.8% 50.4% 34.4% 48.1% 1.8% 1.5%
2004 56.1% 41.3% 42.1% 58.2% 1.8% 0.6%
2000 41.7% 45.0% 47.0% 51.6% 11.3% 3.4%
1996 52.4% 43.0% 40.0% 45.6% 7.7% 11.3%
Breakdown of population affiliated with a religious congregation
Type AdherentsCongregations
Religion AustinRiversideAustinRiverside
CATHOLIC CHURCH 17.3% 27.5% 4.5% 4.5%
SOUTHERN BAPTIST CONVENTION 8.0% 1.2% 22.8% 11.2%
EPISCOPAL CHURCH 1.4% 0.2% 2.8% 1.4%
MUSLIM ESTIMATE 1.2% 0.5% 0.7% 0.7%
EVANGELICAL LUTHERAN CHURCH IN AMERICA 1.0% 0.3% 2.5% 1.5%
LUTHERAN CHURCH 0.9% 0.3% 2.1% 1.8%
SEVENTH DAY ADVENTIST CHURCH 0.2% 0.9% 1.0% 3.4%

Weather

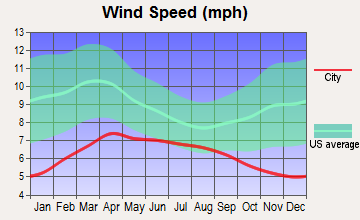
Weather-wise, Austin has a more humid climate with hot summers and mild winters, perfect for people who love warm weather. Riverside, on the other hand, has a semi-arid Mediterranean climate with hot, dry summers and cool, moist winters. Both cities are sunny for the majority of the year which makes them great for outdoor activities.
Weather and climate
Type Austin Riverside
Temperature - Average 68.5°F 66°F
Humidity - Average morning or afternoon humidity 75.2% 66.7%
Humidity - Differences between morning and afternoon humidity 40% 21.4%
Humidity - Maximum monthly morning or afternoon humidity 89% 73.5%
Humidity - Minimum monthly morning or afternoon humidity 49% 52.1%
Precipitation - Yearly average 33.7 in 10.3 in
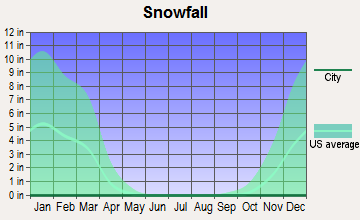
Snowfall - Yearly average 1.4 in 0 in
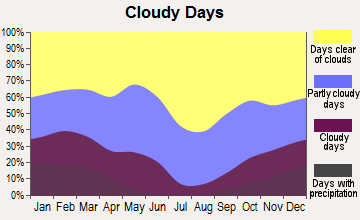
Clouds - Number of days clear of clouds 19.3% 27.3%
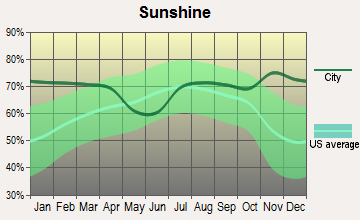
Sunshine amount - Average 63.3% 78.2%
Sunshine amount - Differences during a year 22% 21.5%
Sunshine amount - Maximum monthly 72% 84.2%
Sunshine amount - Minimum monthly 50% 62.6%
Wind speed - Average 7.2 mph 4.5 mph

Average climate in Austin, Texas

Chicago, Illinois average temperatures Chicago, Illinois average precipitation Chicago, Illinois humidity Chicago, Illinois wind speed Chicago, Illinois snowfall Chicago, Illinois sunshine Chicago, Illinois clear and cloudy days
 

Average climate in Riverside, California

Chicago, Illinois average temperatures Chicago, Illinois average precipitation Chicago, Illinois humidity Chicago, Illinois wind speed Chicago, Illinois snowfall Chicago, Illinois sunshine Chicago, Illinois clear and cloudy days
 

Air pollution
Type AQICONO2OZONEPBPM10PM25SO2
Year AustinRiversideAustinRiversideAustinRiversideAustinRiversideRiverside Riverside AustinRiversideAustinRiverside
2018 76 153 N/A 0.35 4.9 14.4 26.7 29.8 0.006 N/A 44.6 N/A 8.7 13.6 0.2 0.4
2017 76 151 N/A 0.34 4.6 14.7 29.7 31.5 0.004 N/A 48.4 N/A 8.3 14.8 0.3 0.3
2016 71 140 N/A 0.33 4.2 14.8 29.5 30.9 0.006 N/A 44.4 N/A 8.2 14.5 0.2 0.2
2015 78 147 N/A 0.33 4.4 14.5 28.9 30.8 0.004 N/A 43.6 N/A 8.6 15.4 0.3 0.3
2014 74 147 N/A 0.37 5.2 15.9 28.3 30.7 0.006 N/A 34.1 N/A 8.7 16.5 0.5 0.3
2013 78 147 0.09 0.38 5.5 16.4 29.5 29.2 0.006 N/A 33.2 N/A 8.6 16.4 0.5 0.2
2012 86 148 0.13 0.35 5.5 16.4 30.1 30.2 0.007 N/A 32.3 N/A 8.6 16.0 N/A 0.3
2011 83 150 0.11 0.37 2.6 16.3 33.0 32.0 0.006 N/A 33.1 N/A 9.1 15.2 N/A 0.3
2010 77 144 0.05 0.42 3.2 17.8 29.4 30.9 0.008 N/A 31.9 N/A 8.8 15.5 N/A 1.3
2009 76 151 0.05 0.37 2.6 20.0 29.7 29.0 0.009 N/A 38.0 N/A 9.0 19.6 N/A 1.5
2008 81 157 0.12 0.41 3.2 20.5 30.7 30.0 0.010 N/A 43.6 N/A 9.7 16.3 N/A 0.9
2007 82 135 0.12 0.65 3.1 20.8 27.1 28.3 0.011 N/A N/A N/A 9.8 N/A N/A 1.6
2006 89 129 0.14 0.58 3.8 21.0 31.3 28.0 0.005 N/A N/A N/A 10.0 N/A 0.2 1.4
2005 92 134 0.15 0.53 4.4 22.8 29.0 27.3 0.012 N/A N/A N/A 10.7 N/A 0.2 3.3
2004 74 142 0.16 0.72 3.3 18.5 26.8 29.5 0.013 N/A N/A N/A N/A N/A N/A 3.1
2003 85 144 0.26 0.75 4.2 22.7 28.9 28.5 0.013 N/A N/A N/A N/A N/A 0.1 2.0
2002 83 142 0.33 0.82 3.9 24.9 27.2 28.5 0.015 N/A N/A N/A N/A N/A N/A 0.2
2001 83 145 0.31 0.79 4.2 25.7 25.5 26.1 0.025 N/A N/A N/A N/A N/A N/A 0.9
2000 86 157 0.28 0.82 4.7 24.2 27.8 25.0 0.031 N/A N/A N/A N/A N/A N/A 1.2
Natural disasters
Type Austin Riverside
Tornado activity compared to U.S. average 137.9% 17.4%
Earthquake activity compared to U.S. average 80.4% 7,322.6%
Natural disasters compared to U.S. average 29% 46%

Transportation

In terms of transportation, Austin's Capital Metro provides bus and train services throughout the city. Austin also has bike and car-sharing programs. Riverside, on the other hand, relies heavily on cars for commuting, but also has the Riverside Transit Agency for bus services and Metrolink train service to Los Angeles and San Diego Counties.
Transport
Type Austin Riverside
Amtrak stations 1 1
Amtrak stations nearby 1 3
FAA registered aircraft 911 307
FAA registered aircraft manufacturers and dealers 21 15
Means of transportation to work
Type Austin Riverside
Bicycle 0.8% 0.5%
Bus 1.5% 0.9%
Carpooled 7.9% 9%
Car alone 85.9% 85.7%
Motorcycle 0.3% 0.3%
Railroad 0% 0.4%
Taxicab 0.1% 0%
Walked 2% 2.3%
Means of transportation to work
Average travel time to work
Type Austin Riverside
Average 29.9 min 31.3 min
Other means 22.7 min 28.7 min
Public transportation 37.9 min 45.3 min
Travel time to work
Time leaving to work
Travel time to work
Time leaving to work
Private vehicle occupancy
Type Austin Riverside
Average 1.1 1.1
Drove alone 91.2% 89.1%
In 2 person carpool 6.3% 8.4%
In 3 person carpool 1.7% 2%
In 4 person carpool 0.6% 0.2%
In 5-6 person carpool 0.1% 0.2%
In 7+ person carpool 0.2% 0.1%

How many people usually rode to work in the car, truck or van.

Real Estate

Real estate in Austin is relatively expensive compared to other Texan cities but still cheaper than in Riverside. The housing market in Riverside is considerably more costly, leading to higher rental and property acquisition costs.

Neighborhoods

The capital of Texas has a variety of exciting neighborhoods including Downtown Austin, South Austin, and Hyde Park, each with its unique charm and reputation. Riverside similarly offers diverse neighborhoods like Downtown Riverside, Canyon Crest, and La Sierra. Both cities offer urban, suburban, and even rural living options.
Houses and residents
Type Austin Riverside
Houses 469,156 94,246
Average household size (people) 2.4 3.2
Median year apartment built 1997 1982
Median year house/condo built 1988 1974
Length of stay in the house since moving in 12.1 years 14.2 years
Houses occupied 449,399 (95.8%) 91,110 (96.7%)
Houses occupied by owners 196,458 (43.7%) 51,211 (56.2%)
Houses occupied by renters 252,941 (56.3%) 39,899 (43.8%)
Median rent asked for vacant for-rent units $1,286 $1,277
Median monthly housing costs $1,521 $1,680
Median price asked for vacant for-sale houses and condos $549,769 $414,585
Estimated median house or condo value $482,900 $483,300
Median numbers of rooms 4.4 5.2
Median number of rooms in apartments 3.4 3.9
Median number of rooms in houses and condos 6 6.1
Median house price - detached houses $595,996 $548,362
Median house price - in 2-unit structures $393,984 $525,372
Median house price - in 3-to-4-unit structures $262,826 $450,463
Median house price - in 5 or more unit structures $576,111 $408,213
Median house price - mobile homes $56,102 $81,780
Median house price - Townhouses or other attached units $459,657 $442,670
Median house price - All housing units $571,154 $529,360
Median house age 28 44
Renting percentage 54.9% 44.3%
Housing density (houses/condos per square mile) 1,865.3 1,206.8
House value disparities 28.4% 21%
Household income disparities 44.8% 40.5%
Median household income for houses/condes with a mortgage $141,177 $104,161
Median household income for apartments without a mortgage $86,430 $71,925
Housing units without a mortgage 1,799 (1.3%) 393 (1%)
Housing units with both a second mortgage and home equity loan 6,421 (4.8%) 1,312 (3.3%)
Housing units with a mortgage 132,628 (98.7%) 39,744 (99%)
Housing units with a home equity loan 206 (0.2%) 123 (0.3%)
Housing units with a second mortgage 8,515 (6.3%) 2,112 (5.3%)
House/condo owner moved in on average (years ago) 9 13
House/condo renter moved in on average (years ago) 1 3
Housing units lacking complete kitchen facilities 0.9% 2.5%
Housing units lacking complete plumbing facilities 0.6% 0.4%
Housing units in structures
Housing units in structures AustinRiverside
One, detached 43.1% 63.1%
One, attached 5.2% 5.6%
Two 2.4% 1.1%
3 or 4 4.1% 3.7%
5 to 9 7.2% 6.8%
10 to 19 11.0% 7.0%
20 to 49 8.9% 4.6%
50 or more 17.2% 6.4%
Mobile homes 1.0% 1.8%
Median real estate property taxes paid for housing units
Type Austin Riverside
With mortgages $7,313 (1.5%) $3,530 (0.7%)
With no mortgages $6,435 (1.4%) $2,330 (0.5%)
Marital status
Type Austin Riverside
Divorced 10.6% 8.4%
Never married 42.3% 44.1%
Now married 43.2% 41.9%
Separated 1.2% 1.9%
Widowed 2.6% 3.7%
Class of workers - percentage
Class of Workers AustinRiverside
Employee of private company 67.8% 69.3%
State government workers 8.1% 5.4%
Private not-for-profit wage and salary workers 6.9% 6.6%
Self-employed workers in own not incorporated business 6.8% 5.3%
Local government workers 4.9% 9.4%
Self-employed in own incorporated business 3.8% 2.9%
Federal government workers 1.6% 1.1%
Unpaid family workers 0.0% 0.1%
Class of workers - absolute values
Class of Workers AustinRiverside
Employee of private company 386,954 107,406
Federal government workers 9,304 1,699
Local government workers 28,036 14,564
Private not-for-profit wage and salary workers 39,279 10,183
Self-employed in own incorporated business 21,754 4,467
Self-employed workers in own not incorporated business 38,777 8,164
State government workers 46,229 8,293
Unpaid family workers 102 199

Industries and Occupations

Tech, education, and healthcare dominate Austin's industry landscape. Tech giants like Dell and IBM have regional offices in the city. In Riverside, the healthcare sector is the city's largest employer, along with the university and county education institutions.
Most common male industries
Industry AustinRiverside
Professional, scientific, and technical services 21.6% 3.0%
Manufacturing 10.9% 10.0%
Construction 9.0% 19.2%
Retail trade 8.7% 11.7%
Accommodation and food services 6.5% 3.7%
Educational services 6.3% 8.8%
Finance and insurance 4.8% 1.3%
Public administration 4.8% 4.2%
Transportation and warehousing 4.5% 12.4%
Information 4.2% 2.6%
Health care and social assistance 4.0% 5.4%
Other services, except public administration 3.3% 5.6%
Administrative and support and waste management services 2.8% 4.9%
Real estate and rental and leasing 2.7% 1.4%
Wholesale trade 2.2% 2.3%
Arts, entertainment, and recreation 2.1% 1.7%
Utilities 0.7% 0.8%
Mining, quarrying, and oil and gas extraction 0.4% 0.2%
Management of companies and enterprises 0.3% 0.0%
Agriculture, forestry, fishing and hunting 0.1% 0.7%
Most common female industries
Industry AustinRiverside
Professional, scientific, and technical services 16.8% 3.0%
Health care and social assistance 14.7% 20.1%
Educational services 13.8% 16.1%
Retail trade 9.1% 13.1%
Public administration 6.8% 4.9%
Accommodation and food services 6.4% 8.8%
Other services, except public administration 6.3% 4.6%
Manufacturing 4.7% 7.0%
Finance and insurance 4.5% 3.2%
Administrative and support and waste management services 4.0% 2.3%
Real estate and rental and leasing 3.0% 1.8%
Information 2.5% 1.3%
Transportation and warehousing 2.2% 6.7%
Arts, entertainment, and recreation 2.0% 1.7%
Wholesale trade 1.2% 2.1%
Construction 1.2% 2.2%
Utilities 0.5% 0.5%
Management of companies and enterprises 0.2% 0.1%
Agriculture, forestry, fishing and hunting 0.1% 0.5%
Most common male occupations
Occupation AustinRiverside
Management occupations 15.7% 7.1%
Computer and mathematical occupations 12.2% 3.3%
Sales and related occupations 9.8% 8.0%
Business and financial operations occupations 8.2% 1.9%
Architecture and engineering occupations 7.7% 2.0%
Construction and extraction occupations 6.7% 15.1%
Food preparation and serving related occupations 4.9% 4.1%
Office and administrative support occupations 4.8% 6.3%
Arts, design, entertainment, sports, and media occupations 3.9% 2.1%
Transportation occupations 3.7% 6.8%
Educational instruction, and library occupations 3.5% 4.9%
Production occupations 3.0% 8.3%
Installation, maintenance, and repair occupations 2.4% 6.1%
Health diagnosing and treating practitioners and other technical occupations 2.0% 1.2%
Life, physical, and social science occupations 1.9% 0.8%
Material moving occupations 1.9% 8.8%
Legal occupations 1.8% 0.1%
Building and grounds cleaning and maintenance occupations 1.5% 3.5%
Health technologists and technicians 1.1% 0.7%
Firefighting and prevention, and other protective service workers including supervisors 0.8% 3.3%
Most common female occupations
Occupation AustinRiverside
Management occupations 14.4% 7.1%
Office and administrative support occupations 12.0% 22.8%
Business and financial operations occupations 12.0% 4.1%
Sales and related occupations 9.3% 9.2%
Educational instruction, and library occupations 9.2% 9.6%
Health diagnosing and treating practitioners and other technical occupations 5.6% 5.1%
Computer and mathematical occupations 5.1% 0.7%
Food preparation and serving related occupations 5.1% 6.2%
Personal care and service occupations 4.3% 2.6%
Arts, design, entertainment, sports, and media occupations 3.6% 1.9%
Building and grounds cleaning and maintenance occupations 2.9% 3.1%
Healthcare support occupations 2.5% 6.2%
Community and social service occupations 2.3% 3.5%
Legal occupations 2.1% 1.0%
Health technologists and technicians 1.9% 2.3%
Production occupations 1.6% 4.7%
Architecture and engineering occupations 1.6% 0.4%
Life, physical, and social science occupations 1.5% 1.2%
Material moving occupations 1.4% 6.0%
Food environment data per 10,000 residents
Food environment statistics AustinRiverside
Number of convenience stores (no gas) 3.1 1.5
Number of convenience stores (with gas) 1.5 0.4
Number of full-service restaurants 8.0 5.5
Number of grocery stores 1.4 1.6
Food environment - absolute values
Food environment statistics AustinRiverside
Number of convenience stores (no gas) 301 311
Number of convenience stores (with gas) 141 91
Number of full-service restaurants 772 1,125
Number of grocery stores 133 330
Number of supercenters and club stores 8 11
Obesity and diabetes
Food environment statistics rate AustinRiverside
Adult diabetes rate 6.7% 7.7%
Adult obesity rate 21.7% 24.5%
Low-income preschool obesity rate 15.3% 15.2%

Health Care

Both Austin and Riverside are served by many excellent healthcare facilities. Austin's prominent healthcare providers include Ascension Seton and St. David's HealthCare. Riverside has Riverside Community Hospital, Kaiser Permanente Riverside Medical Center among others, each providing top-notch healthcare services.
Health (county statistics)
Type Austin Riverside
General health status score of residents in this county from 1 (poor) to 5 (excellent) 3.6 3.4
Average weight of females (lbs) 159.2 lbs 161.6 lbs
Average weight of males (lbs) 194.2 lbs 193.1 lbs
Residents visited a dentist within the past year 68% 63.8%
Residents exercised in the past month 77.3% 70.4%
Adult residents drank alcohol in the past 30 days 60.5% 50%
Residents smoked 100+ cigarettes in their lives 37.3% 38.7%

Fatal vehicle accidents per 100,000 residents
Type Total count per 100,000Drunk per 100,000Fatal count per 100,000Pedestrian count per 100,000Person count per 100,000Vehicle count per 100,000
Year AustinRiversideAustinRiversideAustinRiversideAustinRiversideAustinRiversideAustinRiverside
2021 11.1 11.0 0.0 0.0 12.0 11.0 5.3 4.7 23.5 20.5 17.6 15.1
2020 9.4 11.4 2.2 3.8 10.5 12.1 4.2 2.9 19.9 22.9 14.4 17.5
2019 9.5 10.3 1.2 2.1 9.7 10.3 4.0 3.9 19.7 26.4 14.3 17.6
2018 8.0 7.0 1.4 3.0 8.2 8.2 3.5 1.2 15.8 16.4 12.9 12.2
2017 8.2 7.4 2.0 3.4 8.7 8.0 2.9 2.5 15.4 15.6 12.5 9.8
2016 8.8 7.7 1.2 3.1 8.9 8.7 3.5 1.2 17.8 18.9 13.0 13.9
2015 10.4 8.4 3.1 2.8 11.3 9.1 3.8 1.6 24.0 19.1 17.6 13.4
2014 5.9 9.7 1.8 2.8 6.4 10.0 1.4 4.1 14.7 24.7 9.5 15.3
2013 8.0 9.2 2.5 5.4 8.4 10.1 2.8 2.2 18.6 22.4 12.0 17.4
2012 9.3 5.7 2.5 2.2 9.6 6.1 3.8 2.6 20.8 13.7 13.6 10.5
2011 6.3 6.8 1.3 3.5 7.1 7.4 3.0 1.9 15.0 14.8 8.9 8.7
2010 6.6 6.9 3.7 1.6 6.8 6.9 1.5 1.6 14.6 13.5 10.6 8.6
2009 8.1 9.7 2.5 4.0 8.4 9.7 2.0 1.7 20.6 25.2 13.4 15.1
2008 7.2 8.2 3.4 4.8 7.3 9.2 2.1 3.4 16.2 21.1 11.2 17.1
2007 7.7 10.3 2.7 5.9 7.9 11.0 3.5 1.7 21.9 29.3 12.9 16.2
2006 7.9 11.8 3.6 5.2 9.3 12.5 2.3 2.8 23.0 31.2 12.9 18.7
2005 8.0 10.9 2.8 6.3 8.8 13.3 2.7 2.8 23.0 34.3 13.0 18.6
2004 10.2 10.2 4.5 3.2 10.5 10.5 2.0 3.5 28.0 29.8 16.2 14.7
2003 7.6 11.1 2.9 6.4 7.7 11.8 1.2 2.5 21.8 33.7 13.0 17.5
2002 9.6 14.3 5.7 7.0 10.1 16.1 1.9 2.2 24.4 43.3 14.8 22.7
2001 10.5 10.5 3.4 3.4 10.8 12.4 3.1 2.3 30.3 31.9 16.5 15.0
2000 9.4 9.8 2.1 2.4 10.7 9.8 1.8 2.7 26.5 27.4 16.0 14.1
1999 9.4 11.3 2.7 4.1 9.7 12.4 3.6 4.9 35.6 30.1 19.1 18.8
1998 9.4 13.1 2.1 5.0 10.6 16.2 2.9 3.5 36.9 34.3 24.1 20.8
1997 10.6 11.4 3.9 3.9 11.3 12.2 3.0 2.4 29.6 37.7 17.8 17.7
1996 9.1 9.9 2.8 4.4 10.0 11.9 2.8 2.8 25.1 24.6 14.4 14.7
1995 10.6 14.0 2.9 2.8 12.1 14.8 2.9 6.4 31.5 40.8 19.3 20.8
1994 8.1 16.1 2.8 4.8 9.0 19.8 2.2 4.4 21.5 47.6 12.9 23.4
1993 8.4 8.2 3.0 1.6 8.6 8.6 2.2 2.0 26.4 19.7 14.4 11.5
1992 10.2 8.3 3.3 0.8 11.3 8.3 3.6 2.1 28.0 28.7 15.5 14.6
1991 8.2 13.2 3.5 4.3 8.8 14.9 3.5 2.1 22.6 45.5 13.4 22.1
1990 6.8 15.1 3.8 6.9 7.6 18.2 0.0 0.0 21.7 50.2 12.3 27.3
1989 11.5 18.1 5.6 8.1 13.3 19.9 0.0 0.0 32.0 55.7 17.3 28.5
1988 8.2 17.2 4.0 7.0 8.4 18.1 0.0 0.0 22.7 50.6 13.9 26.9
1987 10.3 17.6 4.8 9.1 10.9 18.6 0.0 0.0 23.5 50.5 14.7 28.1
1986 15.1 14.2 6.4 5.9 16.7 16.7 0.0 0.0 38.4 30.4 23.7 19.1
1985 13.1 14.1 3.0 6.5 13.9 16.6 0.0 0.0 35.8 43.3 21.5 19.6
1984 15.5 17.1 4.2 10.4 17.7 19.7 0.0 0.0 39.6 36.8 23.1 21.8
1983 9.7 11.7 2.8 6.9 10.5 11.7 0.0 0.0 25.7 32.0 14.9 18.7
1982 10.5 14.3 4.0 7.7 11.7 17.1 0.0 0.0 24.5 34.1 14.3 20.4
1981 9.5 18.7 2.2 13.6 10.5 21.6 0.0 0.0 25.3 46.5 14.1 26.1
1980 9.5 15.2 2.6 8.2 10.1 18.2 0.0 0.0 21.1 35.2 12.7 23.4
1979 11.5 16.1 2.6 9.0 12.3 16.1 0.0 0.0 29.0 37.0 16.7 27.5
1978 8.2 16.4 1.6 8.5 9.9 18.8 0.0 0.0 20.3 31.6 12.3 21.9
1977 8.0 14.2 1.2 4.3 8.4 17.3 0.0 0.0 20.1 40.3 12.1 21.7
1976 7.0 13.3 0.0 5.1 8.0 13.9 0.0 0.0 17.3 35.4 9.7 18.9
1975 7.0 13.5 0.0 5.2 8.0 14.2 0.0 0.0 17.3 36.1 9.7 19.3

Fatal vehicle accidents
Type Total countDrunkFatal countPedestrian countPerson countVehicle count
Year AustinRiversideAustinRiversideAustinRiversideAustinRiversideAustinRiversideAustinRiverside
1975 35 21 0 8 40 22 0 0 86 56 48 30
1976 35 21 0 8 40 22 0 0 86 56 48 30
1977 40 23 6 7 42 28 0 0 100 65 60 35
1978 41 27 8 14 49 31 0 0 101 52 61 36
1979 57 27 13 15 61 27 0 0 144 62 83 46
1980 47 26 13 14 50 31 0 0 105 60 63 40
1981 47 33 11 24 52 38 0 0 126 82 70 46
1982 52 26 20 14 58 31 0 0 122 62 71 37
1983 48 22 14 13 52 22 0 0 128 60 74 35
1984 77 33 21 20 88 38 0 0 197 71 115 42
1985 65 28 15 13 69 33 0 0 178 86 107 39
1986 75 29 32 12 83 34 0 0 191 62 118 39
1987 51 37 24 19 54 39 0 0 117 106 73 59
1988 41 37 20 15 42 39 0 0 113 109 69 58
1989 57 40 28 18 66 44 0 0 159 123 86 63
1990 34 35 19 16 38 42 0 0 108 116 61 63
1991 42 31 18 10 45 35 18 5 115 107 68 52
1992 53 20 17 2 59 20 19 5 146 69 81 35
1993 45 20 16 4 46 21 12 5 141 48 77 28
1994 44 40 15 12 49 49 12 11 117 118 70 58
1995 59 35 16 7 67 37 16 16 175 102 107 52
1996 51 25 16 11 56 30 16 7 141 62 81 37
1997 60 29 22 10 64 31 17 6 168 96 101 45
1998 54 34 12 13 61 42 17 9 213 89 139 54
1999 55 30 16 11 57 33 21 13 209 80 112 50
2000 62 25 14 6 70 25 12 7 174 70 105 36
2001 72 28 23 9 74 33 21 6 208 85 113 40
2002 66 39 39 19 69 44 13 6 167 118 101 62
2003 52 31 20 18 53 33 8 7 150 94 89 49
2004 71 29 31 9 73 30 14 10 195 85 113 42
2005 57 31 20 18 62 38 19 8 163 98 92 53
2006 58 34 26 15 68 36 17 8 168 90 94 54
2007 58 30 20 17 59 32 26 5 164 85 97 47
2008 55 24 26 14 56 27 16 10 124 62 86 50
2009 64 29 20 12 66 29 16 5 162 75 105 45
2010 52 21 29 5 54 21 12 5 115 41 84 26
2011 52 21 11 11 58 23 25 6 123 46 73 27
2012 78 18 21 7 81 19 32 8 175 43 115 33
2013 71 29 22 17 74 32 25 7 165 71 106 55
2014 54 31 16 9 58 32 13 13 134 79 87 49
2015 96 27 29 9 104 29 35 5 221 61 162 43
2016 83 25 11 10 84 28 33 4 167 61 122 45
2017 78 24 19 11 83 26 28 8 147 51 119 32
2018 77 23 13 10 79 27 34 4 152 54 124 40
2019 93 34 12 7 95 34 39 13 193 87 140 58
2020 91 36 21 12 101 38 40 9 192 72 139 55
2021 107 35 0 0 116 35 51 15 227 65 170 48
Police full-time law enforcement employees
Year AustinRiverside
2021 2,087 520
2020 2,290 522
2019 2,469 512
2018 2,422 522
2017 2,366 496
2016 2,361 503
2015 2,290 515
2014 2,306 520
2013 2,233 520
2012 2,252 520
2011 2,211 511
2010 2,141 512
2009 2,146 537
2008 2,034 554
2007 1,995 576
2006 1,946 565
2005 1,835 541
2004 1,826 549
2003 1,744 522
Police full-time law enforcement employees (per 1,000 residents)
Year AustinRiverside
2021 2.1 1.6
2020 2.3 1.6
2019 2.5 1.5
2018 2.5 1.6
2017 2.4 1.5
2016 2.5 1.5
2015 2.4 1.6
2014 2.6 1.6
2013 2.6 1.6
2012 2.7 1.7
2011 2.7 1.7
2010 2.7 1.7
2009 2.8 1.8
2008 2.7 1.9
2007 2.8 1.9
2006 2.7 1.9
2005 2.6 1.9
2004 2.7 1.9
2003 2.6 1.9
Local government: full-time employees
Job AustinRiverside
Airports 498 6
Financial administration 587 56
Firefighters 1,129 225
Fire - other 152 12
Health 1,142 0
Judicial and legal 261 38
Local libraries 400 53
Natural resources 320 0
Other and unallocable 624 164
Other government administration 524 141
Parks and recreation 1,168 67
Police - other 608 142
Police protection - officers 1,858 364
Sewerage 509 106
Solid waste management 476 53
Streets and highways 814 63
Totals for government 13,367 2,133
Water supply 579 156
Local government: part-time employees
Job AustinRiverside
Airports 8 0
Financial administration 39 4
Fire - other 2 0
Health 69 0
Judicial and legal 16 0
Local libraries 36 9
Natural resources 14 0
Other and unallocable 34 2
Other government administration 24 8
Parks and recreation 709 173
Police - other 18 21
Sewerage 19 0
Solid waste management 13 3
Streets and highways 241 0
Totals for government 1,331 241
Water supply 16 2
Place of birth - Foreign born
Residents AustinRiverside
All residents 18.2% 22.7%
American Indian / Alaska Native residents 7.1% 26.1%
Asian residents 60.4% 53.1%
Black or African American residents 11.6% 13.7%
Native Hawaiian / Pacific Islander residents 4.1% 19.5%
Other race residents 37.4% 34.0%
Two or more races residents 16.8% 17.1%
White residents 7.9% 5.1%
White alone, not Hispanic / Latino residents 5.7% 5.1%
Place of birth - Native, outside of US
Residents AustinRiverside
All residents 2.5% 1.0%
Asian residents 1.8% 3.0%
Black or African American residents 1.3% 0.2%
Native Hawaiian / Pacific Islander residents 3.2% 9.3%
Other race residents 2.3% 0.9%
Two or more races residents 3.8% 1.7%
White residents 2.0% 1.1%
White alone, not Hispanic / Latino residents 1.7% 1.1%
Place of birth - Born in state of residence
Residents AustinRiverside
All residents 47.2% 65.7%
American Indian / Alaska Native residents 56.7% 66.9%
Asian residents 23.0% 38.3%
Black or African American residents 54.4% 64.4%
Native Hawaiian / Pacific Islander residents 33.0% 54.3%
Other race residents 53.4% 62.8%
Two or more races residents 55.7% 75.5%
White residents 47.9% 71.9%
White alone, not Hispanic / Latino residents 48.1% 67.6%
Place of birth - Born in other state
Residents AustinRiverside
All residents 32.1% 10.5%
American Indian / Alaska Native residents 36.2% 7.0%
Asian residents 14.8% 5.6%
Black or African American residents 32.7% 21.8%
Native Hawaiian / Pacific Islander residents 59.6% 16.9%
Other race residents 7.0% 2.3%
Two or more races residents 23.7% 5.7%
White residents 42.3% 22.0%
White alone, not Hispanic / Latino residents 44.6% 26.3%
English speakers (speaking English at home)
Type Austin Riverside
Born in the United States residents 91.1% 88.2%
Foreign born residents 15.7% 8%
Native, born elsewhere residents 58.1% 52.4%
Total residents 69.5% 53.5%
Mechanisms of homicide
Mechanism AustinRiverside
Homicides from 2000 to 2006 223 730
Cut / Pierce 48 88
Firearm 97 489
Suffocation 0 26
Mechanisms of homicide per 1,000,000 residents
Mechanism AustinRiverside
Homicides from 2000 to 2006 36.6 59.0
Cut / Pierce 7.9 7.1
Firearm 15.9 39.5
Suffocation 0 2.1
Mechanisms of suicide per 1,000,000 residents
Mechanism AustinRiverside
Suicides from 2000 to 2006 115.5 96.6
Cut / Pierce 0 2.0
Firearm 54.2 49.5
Poisoning 25.6 14.9
Suffocation 27.4 24.7

Infrastructure

Austin offers a blend of historic and modern architecture, with well-constructed roads and public facilities. In Riverside, one can experience the city's rich history through its preserved architectural landmarks. Both cities are continuously improving their infrastructure to accommodate their growing populations.
Infrastructure
Type Austin Riverside
Hospitals 65 20
TV stations 20 5
Bank branches located here 264 61
Bank institutions located here 43 18
Main business address for public companies 44 2
Drinking water stations with no reported violations in the past 46 2
Drinking water stations with reported violations in the past 95 0

Schools

School facilities
Type Austin Riverside
Private elementary/middle schools 35 10
Private high schools 22 8
Public elementary/middle schools 184 54
Public high schools 54 24
Colleges/Universities 37 10
HMDA - Conventional home purchase loans - Applications denied
Year AustinRiverside
1999 4,733 794
2000 2,950 375
2001 2,038 310
2002 1,772 405
2003 2,213 1,399
2004 2,458 1,892
2005 3,121 2,728
2006 3,367 3,235
2007 2,560 1,568
2008 1,747 544
2009 1,067 285

Culture and Food

Austin is known as the live music capital of the world with its numerous music festivals. The city also has a thriving food scene, with barbecue and Mexican cuisine being iconic. Riverside, on the other hand, is known for its cultural festivals, historic sites, and California-style Mexican cuisine.

Sports Teams

Austin is home to many sports teams including Austin FC in Major League Soccer and the Round Rock Express, a Minor League Baseball team. Meanwhile, Riverside has no major league sports teams but fans can find games at University of California, Riverside, which competes in NCAA Division I sports.