Austin, TX vs Seattle, WA - Advanced U.S. city comparison tool

Austin, TX vs Seattle, WA

Comparing Austin, Texas, and Seattle, Washington, reveals notable differences in terms of climate, cost of living, the economy, as well as distinctive cultural identities of each city. Austin is known for its warm weather, vibrant music scene, and strong tech industry while Seattle offers a maritime climate, iconic landmarks, and a robust tech and aerospace sector. The cost of living is lower in Austin as compared to Seattle, but both cities have strong employment opportunities and excellent educational resources.


Distance between Austin, TX and Seattle, WA : 1,768.4 miles

Austin's population is larger by 31%. Its population has grown by 307,615 people (46.9%) since 2000. The population of Seattle has grown by 170,545 people (30.3%) during that time.

Population
Type Austin Seattle
Population 964,177 733,919
Female / male percentage 49.1% / 50.9%
49.1%
50.9%
49.4% / 50.6%
49.4%
50.6%
Racial makeup - percentage
Ethnicity AustinSeattle
White Non-Hispanic 48.0% 60.1%
Hispanic 32.0% 7.4%
Asian 8.4% 16.7%
Black 7.2% 6.2%
Two or more 4.0% 8.6%
American Indian 0.1% 0.3%
Pacific Islander 0.0% 0.2%
Racial makeup - absolute values
Ethnicity AustinSeattle
White Non-Hispanic 462,327 440,778
Hispanic 308,048 54,534
Asian 80,604 122,339
Black 69,861 45,532
Two or more 38,106 63,209
American Indian 971 2,480
Pacific Islander 214 1,454

Crime and Safety

According to national crime statistics, Seattle has a higher crime rate compared to Austin. This difference does not mean that Austin is entirely crime-free, but in general, both cities are relatively safe for residents and tourists. Seattle and Austin have dedicated law enforcement agencies that work diligently to maintain safety. For peace of mind, prospective residents should consider looking into local areas of the city they plan to move to better understand local crime rates.


Crime by year per 100,000 residents
Type City-data.com crime indexRobberies per 100,000Murders per 100,000Rapes per 100,000Assaults per 100,000Burglaries per 100,000Theft per 100,000Auto theft per 100,000Arson per 100,000
Year AustinSeattleAustinSeattleAustinSeattleAustinSeattleAustinSeattleAustinSeattleAustinSeattleAustinSeattleAustinSeattle
2020 316.8 440.8 110.1 190.7 4.4 6.7 47.8 39.0 304.7 389.9 477.3 1,351.5 2,747.3 2,884.6 406.6 636.5 13.4 27.0
2019 307.7 436.1 102.6 202.7 3.3 3.9 58.3 53.4 246.5 394.7 440.6 1,007.6 2,969.3 3,361.0 307.8 510.4 10.4 14.0
2018 304.1 447.1 104.9 221.6 3.3 3.4 80.9 39.3 193.1 412.4 467.4 1,074.9 2,729.6 3,530.5 260.8 543.9 5.8 14.3
2017 299.1 432.0 101.5 207.5 2.7 3.3 85.8 35.2 224.9 373.6 450.6 1,070.7 2,525.0 3,628.8 213.9 500.7 7.8 20.1
2016 312.4 447.8 109.5 221.2 4.1 2.4 78.1 37.4 216.2 353.1 548.8 1,095.2 2,738.4 3,804.6 221.4 589.5 7.7 14.6
2015 296.7 437.8 99.0 224.1 2.5 3.5 51.9 20.5 219.2 350.2 532.6 1,121.3 2,990.0 3,831.9 248.3 567.5 9.7 13.5
2014 328.0 476.6 96.6 236.2 3.5 3.9 63.2 23.2 232.9 340.4 634.2 1,073.7 3,255.0 4,240.8 253.1 831.2 10.5 11.5
2013 329.1 446.5 88.8 249.2 3.0 2.8 25.3 24.0 246.4 309.0 762.4 1,150.6 3,834.8 3,773.3 252.5 671.0 12.2 14.0
2012 361.2 423.7 117.4 229.1 3.7 4.0 25.1 19.6 262.6 350.6 869.7 1,055.7 4,071.7 3,517.2 277.9 582.7 14.5 12.3
2011 367.6 417.7 137.0 229.4 3.3 3.2 26.1 16.2 263.4 343.9 872.6 1,101.1 4,097.7 3,491.5 265.0 550.0 15.7 13.6
2010 416.8 426.6 155.7 234.8 4.8 3.1 33.5 15.8 285.4 323.8 1,106.9 1,059.5 4,406.3 3,825.5 284.7 567.3 15.4 20.7
2009 444.4 462.8 184.0 297.4 2.9 3.7 34.5 16.9 302.0 322.8 1,138.3 1,113.5 4,818.7 4,164.9 288.6 545.4 12.5 25.9
2008 435.3 440.3 176.9 269.5 3.1 4.8 36.2 21.1 306.0 280.9 1,139.4 1,087.3 4,456.6 3,785.8 349.4 614.5 11.5 13.2
2007 467.1 470.3 203.3 260.1 4.2 4.1 45.8 15.4 286.8 347.1 1,120.4 1,023.0 4,807.5 3,792.7 413.1 988.2 16.2 31.3
2006 434.4 558.6 191.3 285.6 2.8 5.1 44.9 22.1 276.3 398.4 1,052.0 1,285.6 4,446.5 4,090.6 358.4 1,395.6 12.4 40.3
2005 361.5 473.8 170.6 277.4 3.8 4.3 45.0 23.8 270.3 403.8 1,051.2 1,167.3 4,593.7 4,686.9 367.7 1,651.0 16.6 37.5
2004 370.8 466.6 205.8 275.8 3.8 4.2 44.3 25.2 271.2 354.5 996.6 1,343.1 4,674.1 4,482.3 385.8 1,606.9 17.0 42.2
2003 360.0 495.2 183.3 261.8 4.0 5.6 33.1 30.2 241.7 386.8 1,061.1 1,481.2 4,727.8 4,983.2 406.1 1,570.7 20.5 35.6

City-data.com crime index counts serious crimes and violent crime more heavily. It adjusts for the number of visitors and daily workers commuting into cities. (higher means more crime, U.S. average = 301.1)


Crime per year
Type City-data.com crime indexRobberiesMurdersRapesAssaultsBurglariesTheftAuto theftArson
Year AustinSeattleAustinSeattleAustinSeattleAustinSeattleAustinSeattleAustinSeattleAustinSeattleAustinSeattleAustinSeattle
2019 307.7 436.1 1,012 1,548 33 30 575 408 2,431 3,014 4,345 7,695 29,279 25,668 3,035 3,898 103 107
2018 304.1 447.1 1,021 1,646 32 25 787 292 1,880 3,063 4,549 7,984 26,568 26,223 2,538 4,040 56 106
2017 299.1 432.0 987 1,497 26 24 834 254 2,186 2,695 4,380 7,724 24,542 26,177 2,079 3,612 76 145
2016 312.4 447.8 1,048 1,549 39 17 747 262 2,069 2,473 5,252 7,670 26,204 26,644 2,119 4,128 74 102
2015 296.7 437.8 929 1,532 23 24 487 140 2,058 2,394 5,000 7,666 28,068 26,199 2,331 3,880 91 92
2014 328.0 476.6 873 1,567 32 26 571 154 2,105 2,258 5,733 7,123 29,423 28,134 2,288 5,514 95 76
2013 329.1 446.5 763 1,602 26 18 217 154 2,117 1,986 6,550 7,396 32,948 24,255 2,169 4,313 105 90
2012 361.2 423.7 978 1,436 31 25 209 123 2,187 2,198 7,244 6,618 33,913 22,048 2,315 3,653 121 77
2011 367.6 417.7 1,106 1,418 27 20 211 100 2,126 2,126 7,042 6,807 33,069 21,585 2,139 3,400 127 84
2010 416.8 426.6 1,231 1,429 38 19 265 96 2,256 1,971 8,749 6,449 34,827 23,284 2,250 3,453 122 126
2009 444.4 462.8 1,415 1,792 22 22 265 102 2,322 1,945 8,753 6,709 37,054 25,095 2,219 3,286 96 156
2008 435.3 440.3 1,333 1,612 23 29 273 126 2,306 1,680 8,586 6,503 33,582 22,642 2,633 3,675 87 79
2007 467.1 470.3 1,457 1,522 30 24 328 90 2,056 2,031 8,031 5,986 34,461 22,192 2,961 5,782 116 183
2006 434.4 558.6 1,358 1,667 20 30 319 129 1,961 2,326 7,467 7,505 31,562 23,880 2,544 8,147 88 235
2005 361.5 473.8 1,182 1,607 26 25 312 138 1,873 2,339 7,285 6,761 31,835 27,147 2,548 9,563 115 217
2004 370.8 466.6 1,406 1,588 26 24 303 145 1,853 2,041 6,810 7,734 31,938 25,810 2,636 9,253 116 243
2003 360.0 495.2 1,251 1,509 27 32 226 174 1,649 2,229 7,240 8,536 32,259 28,718 2,771 9,052 140 205

City-data.com crime index counts serious crimes and violent crime more heavily. It adjusts for the number of visitors and daily workers commuting into cities. (higher means more crime, U.S. average = 301.1)

Sex Offenders

According to our data, there are 1,411 registered sex offenders living in Austin and 481 registered sex offenders living in .
The ratio of residents to sex offenders in Austin is 672 to 1; the ratio in Seattle is 1,464 to 1.
The number of registered sex offenders compared to the number of residents is larger in Austin than in Seattle.

Cost of Living

Seattle's cost of living is higher than Austin's, with housing being the most significant factor in the cost of living difference. While both cities have experienced a surge in population and demand for housing, the real estate market in Seattle is notoriously expensive. Groceries, healthcare, utilities, and transportation are also typically more expensive in Seattle than in Austin. However, salaries in Seattle are also generally higher, which can balance out the higher cost of living.

Income Tax

Texas does not have a state income tax, which applies to Austin residents. On the other hand, Washington state does not impose state income tax either, benefiting Seattle residents. However, Seattle does have a high corporate tax rate for businesses established there.

Property Tax

Property taxes in Austin are higher on average than those in Seattle. The property tax rates are often used to fund local schools and other community resources. Potential home buyers should consider these tax implications when contemplating a move to either city.

Sales Tax

The total sales tax rate in Seattle is currently 10.1%, whereas in Austin it is 8.25%. These taxes apply to applicable goods and services purchased within each city. The extra revenue helps support transportation, education, and other city services.

Income
Type Austin Seattle
Estimated median household income $79,542 $110,781
Estimated per capita income $53,937 $74,733
Cost of living index (U.S. average is 100) 96.4 118.5

If you make $50,000 in Austin, you will have to make $61,463 in Seattle to maintain the same standard of living.

Geographical Conditions

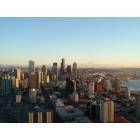
Seattle is surrounded by water, mountains, and evergreen forests, offering breathtaking landscapes and outdoor activities. Austin also features a varied geography with hill country, lakes, and parks, with a heavy emphasis on outdoor life, marked by numerous hiking and biking trails.

Geographical information
Type Austin Seattle
Land area 251.5 sq. miles 83.9 sq. miles
Population density 3,833.4 people per sq. mile 8,750.4 people per sq. mile
Elevation 501 feet 350 feet
Relative area comparison
Austin, TX Seattle, WA
First ancestry reported - percentage
Ancestry AustinSeattle
German 4.7% 5.3%
English 4.4% 4.7%
Irish 3.3% 4.2%
Italian 1.3% 1.9%
Scottish 1.0% 1.2%
Scotch-Irish 0.8% 0.6%
Polish 0.7% 1.2%
French 0.7% 0.6%
Swedish 0.4% 1.2%
Russian 0.4% 0.9%
Czech 0.4% 0.2%
Norwegian 0.4% 1.9%
Greek 0.3% 0.4%
Dutch 0.3% 0.6%
Hungarian 0.2% 0.2%
French Canadian 0.2% 0.4%
Ukrainian 0.2% 0.7%
Danish 0.1% 0.4%
Portuguese 0.1% 0.2%
Swiss 0.1% 0.2%
Population origin - absolute values
Ancestry AustinSeattle
German 23,339 18,099
English 21,730 15,882
Irish 16,704 14,336
Italian 6,324 6,626
Scottish 5,082 3,925
Scotch-Irish 4,002 1,977
Polish 3,685 4,139
French 3,488 2,185
Czech 2,119 776
Norwegian 2,052 6,593
Swedish 2,050 4,054
Russian 2,007 3,019
Dutch 1,343 1,964
Greek 1,317 1,449
Ukrainian 999 2,339
Welsh 926 598
French Canadian 922 1,315
Hungarian 837 697
Swiss 590 738
Danish 574 1,272
Foreign born residents - absolute values
Type Count
Region AustinSeattle
All 181,296 145,454
Africa 8,476 14,939
Asia 61,021 80,093
Europe 14,661 18,794
Latin America 91,669 17,403
North America 3,055 7,618
Oceania 863 1,966
Foreign born residents - percentage
Type Percentage
Region AustinSeattle
All 18.6% 19.9%
Africa 0.9% 2.0%
Asia 6.3% 11.0%
Europe 1.5% 2.6%
Latin America 9.4% 2.4%
North America 0.3% 1.0%
Oceania 0.1% 0.3%

Education

Seattle and Austin both have excellent educational opportunities. The University of Washington in Seattle is highly ranked nationally and boasts strong programs in areas like computer science and engineering. Austin is home to the University of Texas, one of the largest universities in the U.S., with world-renowned business and engineering schools. Public and private schools in both cities are highly rated, making both a good choice for families with children.

School enrollment
Type Austin Seattle
Nursery, preschool 11,123 (5%) 9,461 (6.5%)
Kindergarten 9,376 (4.2%) 6,061 (4.1%)
Grade 1 to 4 41,790 (18.9%) 18,392 (12.5%)
Grade 5 to 8 37,907 (17.1%) 22,843 (15.6%)
Grade 9 to 12 41,993 (19%) 17,647 (12%)
College undergrad 55,830 (25.2%) 50,556 (34.5%)
Graduate or professional 23,263 (10.5%) 21,638 (14.8%)
Students in private schools - absolute values
Type Count
Grade AustinSeattle
Grades 1 to 8 (elementary and middle school) 9,143 11,407
Grades 9 to 12 (high school) 2,975 3,250
Undergraduate colleges 8,830 9,676
Students in private schools - percentage
Type Percentage
Grade AustinSeattle
Grades 1 to 8 (elementary and middle school) 11.5% 27.7%
Grades 9 to 12 (high school) 7.1% 18.4%
Undergraduate colleges 15.8% 19.1%
Educational attainment
Type Austin Seattle
Less than high school 7.2% 4.1%
High school or equiv. 14.4% 10.1%
Less than 1 year of college 4.1% 2.7%
1 or more years of college 8.6% 9.3%
Associate degree 5.8% 5.5%
Bachelor's degree 37.9% 37.9%
Master's degree 15.7% 20.9%
Profess. school degree 3.6% 5.3%
Doctorate degree 2.6% 4.3%
Education level (25-year-olds and older)
Type Austin Seattle
Bachelor's degree or higher 59.9% 68.3%
Graduate or professional degree 21.9% 30.5%
High school or higher 92.8% 95.9%

Work and Economy

The economies of both cities are strong, but they focus on different industries. Austin has a booming tech industry with many start-ups and is known as Silicon Hills. Some of the biggest names in tech, such as Apple, Google, and Dell, have operations in the city. Seattle's economy is also tech-centered with Microsoft and Amazon having their headquarters there. It's also known for its aerospace industry with Boeing.

Biggest Employers

Seattle's biggest employers are Amazon, Microsoft, and the University of Washington. Meanwhile, in Austin, the top employers include Dell, the University of Texas at Austin, and the state government. Both cities present ample job opportunities for potential residents, particularly in the tech sector and education.

Employment and residency - absolute values
Kind AustinSeattle
Work and live in this city 307,600 233,600
Work and live in this county 520,570 424,474
Workers who work outside the city they live in 348,962 329,774
Workers who work outside the county they live in 44,693 14,114
Working at home 219,183 205,297
Not working at home 346,080 233,291
Daytime population change due to commuting 127,328 160,043
Employment and residency - percentage
Kind AustinSeattle
Work and live in this city 87.1% 73.8%
Work and live in this county 92.1% 96.8%
Workers who work outside the city they live in 12.9% 26.2%
Workers who work outside the county they live in 7.9% 3.2%
Working at home 38.8% 46.8%
Not working at home 61.2% 53.2%
Daytime population change due to commuting 19.4% 28.4%
Geographical mobility: all
Type all
Mobility AustinSeattle
Same house 1 year ago 78.4% 76.3%
Moved from abroad 1.4% 1.3%
Moved within same county 11.2% 15.1%
Moved from different state 4.2% 5.1%
Moved within same state 4.8% 2.2%
Geographical mobility: Asian
Type Asian
Mobility AustinSeattle
Same house 1 year ago 76.0% 73.6%
Moved from abroad 1.8% 3.9%
Moved within same county 8.8% 13.9%
Moved from different state 8.3% 6.7%
Moved within same state 5.2% 1.9%
Geographical mobility: Black
Type Black
Mobility AustinSeattle
Same house 1 year ago 72.8% 82.0%
Moved from abroad 0.9% 1.1%
Moved within same county 16.1% 10.2%
Moved from different state 4.3% 3.5%
Moved within same state 5.8% 3.2%
Geographical mobility: White
Type White
Mobility AustinSeattle
Same house 1 year ago 78.5% 75.8%
Moved from abroad 1.9% 0.8%
Moved within same county 9.6% 16.5%
Moved from different state 5.1% 4.7%
Moved within same state 4.9% 2.1%
Building permits
Type Average valueCount
City AustinSeattleAustinSeattle
1997 $113,500 $146,300 2,380 469
1998 $116,000 $135,200 3,521 530
1999 $124,400 $136,900 3,302 480
2000 $141,200 $143,800 3,361 449
2001 $136,600 $152,800 2,119 484
2002 $133,400 $159,100 2,431 886
2003 $120,000 $173,100 3,117 914
2004 $120,600 $172,100 3,533 754
2005 $127,600 $177,100 4,569 533
2006 $135,100 $187,800 4,340 482
2007 $165,100 $197,800 3,155 775
2008 $139,500 $206,700 1,928 595
2009 $139,900 $220,700 1,951 216
2010 $162,200 $221,000 1,664 241
2011 $151,000 $227,200 1,713 316
2012 $146,400 $242,200 2,539 498
2013 $184,600 $249,800 2,573 822
2014 $209,800 $253,100 2,800 898
2015 $211,200 $266,400 2,846 810
2016 $202,400 $271,900 3,705 797
2017 $208,300 $273,900 4,440 593
2018 $208,400 $271,000 4,433 523
2019 $218,000 $274,500 4,568 507
2020 $201,000 $450,800 4,113 247
2021 $167,300 $296,300 4,180 264

There were 4,180 building permits issued in Austin in 2012 (2467 more than in 2011) compared to 264 building permits issued in Seattle in 2012 (52 less than in 2011).

In Austin (Travis County), 60.2% voted for Democrats and 36.2% for Republicans in 2012 Presidential Election. In Seattle (King County), 69.0% voted for Democrats and 28.5% for Republicans.

Elections
Type DemocratsRepublicansOther
Year AustinSeattleAustinSeattleAustinSeattle
2020 71.7% 75.1% 26.5% 22.3% 1.8% 2.6%
2016 65.8% 70.0% 27.2% 21.1% 7.0% 8.9%
2012 60.2% 69.0% 36.2% 28.5% 3.6% 2.5%
2008 63.8% 70.2% 34.4% 28.1% 1.8% 1.7%
2004 56.1% 65.1% 42.1% 33.8% 1.8% 1.1%
2000 41.7% 60.3% 47.0% 34.5% 11.3% 5.2%
1996 52.4% 56.4% 40.0% 31.4% 7.7% 12.2%
Breakdown of population affiliated with a religious congregation
Type AdherentsCongregations
Religion AustinSeattleAustinSeattle
CATHOLIC CHURCH 17.3% 14.4% 4.5% 4.9%
SOUTHERN BAPTIST CONVENTION 8.0% 0.3% 22.8% 3.8%
EPISCOPAL CHURCH 1.4% 0.8% 2.8% 2.4%
MUSLIM ESTIMATE 1.2% 0.6% 0.7% 1.4%
EVANGELICAL LUTHERAN CHURCH IN AMERICA 1.0% 1.3% 2.5% 4.7%
LUTHERAN CHURCH 0.9% 0.5% 2.1% 2.0%
SEVENTH DAY ADVENTIST CHURCH 0.2% 0.6% 1.0% 2.3%
AMERICAN BAPTIST CHURCHES IN THE USA 0.1% 0.6% 0.1% 2.9%

Weather

Austin enjoys a subtropical climate with hot, long summers, and mild winters, making it an enticing destination for those who love sunshine. On the other hand, Seattle is known for its cool, damp climate with frequent drizzle and less sunshine. Seattle's cool climate provides a unique charm and is perfect for those who appreciate cooler temperatures and cloud-covered landscapes. In contrast, Austin's warm climate can give residents the opportunity to indulge in plenty of outdoor activities throughout most of the year.

Weather and climate
Type Austin Seattle
Temperature - Average 68.5°F 52.5°F
Humidity - Average morning or afternoon humidity 75.2% 78.5%
Humidity - Differences between morning and afternoon humidity 40% 38%
Humidity - Maximum monthly morning or afternoon humidity 89% 86%
Humidity - Minimum monthly morning or afternoon humidity 49% 48%
Precipitation - Yearly average 33.7 in 36.6 in
Snowfall - Yearly average 1.4 in 21.4 in
Clouds - Number of days clear of clouds 19.3% 11.6%
Sunshine amount - Average 63.3% 49.4%
Sunshine amount - Differences during a year 22% 44%
Sunshine amount - Maximum monthly 72% 64%
Sunshine amount - Minimum monthly 50% 20%
Wind speed - Average 7.2 mph 8.6 mph

Average climate in Austin, Texas

Chicago, Illinois average temperatures Chicago, Illinois average precipitation Chicago, Illinois humidity Chicago, Illinois wind speed Chicago, Illinois snowfall Chicago, Illinois sunshine Chicago, Illinois clear and cloudy days
 

Average climate in Seattle, Washington

Chicago, Illinois average temperatures Chicago, Illinois average precipitation Chicago, Illinois humidity Chicago, Illinois wind speed Chicago, Illinois snowfall Chicago, Illinois sunshine Chicago, Illinois clear and cloudy days
 

Air pollution
Type AQICONO2OZONEPBPM10PM25SO2
Year AustinSeattleAustinSeattleAustinSeattleAustinSeattleSeattle Seattle AustinSeattleAustinSeattle
2018 76 82 N/A 0.21 4.9 10.6 26.7 20.7 N/A N/A N/A N/A 8.7 8.3 0.2 0.7
2017 76 92 N/A 0.23 4.6 11.1 29.7 21.0 N/A N/A N/A N/A 8.3 8.8 0.3 0.3
2016 71 67 N/A 0.22 4.2 11.9 29.5 20.3 N/A N/A N/A N/A 8.2 6.6 0.2 0.6
2015 78 81 N/A 0.23 4.4 10.8 28.9 19.3 N/A N/A N/A N/A 8.6 8.5 0.3 0.8
2014 74 75 N/A 0.24 5.2 11.5 28.3 19.5 N/A N/A N/A N/A 8.7 7.4 0.5 N/A
2013 78 81 0.09 0.24 5.5 N/A 29.5 17.4 N/A N/A N/A N/A 8.6 9.1 0.5 0.8
2012 86 77 0.13 0.23 5.5 N/A 30.1 19.5 N/A N/A N/A N/A 8.6 7.7 N/A 1.0
2011 83 72 0.11 0.24 2.6 N/A 33.0 18.6 N/A N/A N/A N/A 9.1 7.5 N/A 1.1
2010 77 71 0.05 0.24 3.2 N/A 29.4 18.0 N/A N/A N/A N/A 8.8 6.7 N/A 1.1
2009 76 94 0.05 0.27 2.6 N/A 29.7 17.7 N/A N/A N/A N/A 9.0 8.0 N/A 1.4
2008 81 80 0.12 0.30 3.2 N/A 30.7 17.8 N/A N/A N/A N/A 9.7 6.5 N/A 1.3
2007 82 83 0.12 0.30 3.1 N/A 27.1 18.2 N/A N/A 20.3 N/A 9.8 7.9 N/A 1.5
2006 89 98 0.14 N/A 3.8 N/A 31.3 18.3 N/A N/A 22.6 N/A 10.0 8.7 0.2 N/A
2005 92 101 0.15 0.80 4.4 18.3 29.0 N/A N/A N/A 24.5 N/A 10.7 9.5 0.2 3.5
2004 74 102 0.16 0.81 3.3 17.9 26.8 N/A N/A N/A N/A N/A N/A 10.3 N/A 3.0
2003 85 91 0.26 0.78 4.2 18.5 28.9 N/A N/A N/A N/A N/A N/A 9.9 0.1 2.4
2002 83 87 0.33 0.82 3.9 19.3 27.2 N/A N/A N/A N/A N/A N/A 11.7 N/A 2.7
2001 83 88 0.31 0.90 4.2 20.7 25.5 N/A 0.005 N/A N/A N/A N/A 12.3 N/A 3.7
2000 86 98 0.28 1.06 4.7 20.9 27.8 N/A N/A N/A N/A N/A N/A 13.3 N/A 3.2
Natural disasters
Type Austin Seattle
Tornado activity compared to U.S. average 137.9% 5.5%
Earthquake activity compared to U.S. average 80.4% 1,394.2%
Natural disasters compared to U.S. average 29% 30%

Transportation

Both Austin and Seattle have robust public transportation systems. Seattle's public transit includes buses, light rail, and ferries, while Austin offers bus and metro rail services. Commuting times can be an issue, mostly during peak hours, for both cities. Both cities also promote alternative modes of transportation, like cycling and walking, with designated bike lanes and trails prevalent in each city.

Transport
Type Austin Seattle
Amtrak stations 1 1
Amtrak stations nearby 1 2
FAA registered aircraft 911 1
FAA registered aircraft manufacturers and dealers 21 2
Means of transportation to work
Type Austin Seattle
Bicycle 0.8% 2.1%
Bus 1.5% 8.9%
Carpooled 7.9% 8.7%
Car alone 85.9% 67.8%
Ferryboat 0.1% 0.7%
Motorcycle 0.3% 0.3%
Railroad 0% 1.2%
Streetcar 0% 0.3%
Subway 0% 0.6%
Taxicab 0.1% 0.1%
Walked 2% 8%
Means of transportation to work
Average travel time to work
Type Austin Seattle
Average 29.9 min 35 min
Other means 22.7 min 23.5 min
Public transportation 37.9 min 35.6 min
Travel time to work
Time leaving to work
Travel time to work
Time leaving to work
Private vehicle occupancy
Type Austin Seattle
Average 1.1 1.2
Drove alone 91.2% 89%
In 2 person carpool 6.3% 8.7%
In 3 person carpool 1.7% 0.8%
In 4 person carpool 0.6% 0.2%
In 5-6 person carpool 0.1% 1.1%
In 7+ person carpool 0.2% 0.2%

How many people usually rode to work in the car, truck or van.

Real Estate

Seattle's real estate market is pricey with a high demand for housing, driven by its booming economy and scenic views. Home prices are higher than the national average. Austin's real estate market is also thriving but is relatively less expensive than Seattle. Both cities offer a range of housing options, from downtown condos to suburban homes, but buying a house in Seattle is likely to be more expensive.

Neighborhoods

Both cities boast diverse and vibrant neighborhoods. In Seattle, you can enjoy the urban sophistication of areas like Belltown or the Ballard's cool arts scene. Austin's neighborhoods range from the trendy East Austin to the upscale Westlake. Each city's neighborhoods offer a unique flavor and quality of life, with a wide variety of dining, entertainment, and sightseeing options.

Houses and residents
Type Austin Seattle
Houses 469,156 384,799
Average household size (people) 2.4 2.1
Median year apartment built 1997 1987
Median year house/condo built 1988 1955
Length of stay in the house since moving in 12.1 years 12.4 years
Houses occupied 449,399 (95.8%) 351,650 (91.4%)
Houses occupied by owners 196,458 (43.7%) 161,587 (46%)
Houses occupied by renters 252,941 (56.3%) 190,063 (54%)
Median rent asked for vacant for-rent units $1,286 $2,780
Median monthly housing costs $1,521 $1,984
Median price asked for vacant for-sale houses and condos $549,769 $860,506
Estimated median house or condo value $482,900 $848,100
Median numbers of rooms 4.4 4.1
Median number of rooms in apartments 3.4 3
Median number of rooms in houses and condos 6 6.3
Median house price - detached houses $595,996 Over $1,000,000
Median house price - in 2-unit structures $393,984 $764,579
Median house price - in 3-to-4-unit structures $262,826 $719,049
Median house price - in 5 or more unit structures $576,111 $626,370
Median house price - mobile homes $56,102 $226,727
Median house price - Townhouses or other attached units $459,657 $925,507
Median house price - All housing units $571,154 Over $1,000,000
Median house age 28 47
Renting percentage 54.9% 51.9%
Housing density (houses/condos per square mile) 1,865.3 4,587.9
House value disparities 28.4% 20.6%
Household income disparities 44.8% 42.2%
Median household income for houses/condes with a mortgage $141,177 $189,767
Median household income for apartments without a mortgage $86,430 $112,771
Housing units without a mortgage 1,799 (1.3%) 2,459 (2.1%)
Housing units with both a second mortgage and home equity loan 6,421 (4.8%) 12,354 (10.5%)
Housing units with a mortgage 132,628 (98.7%) 115,481 (97.9%)
Housing units with a home equity loan 206 (0.2%) 240 (0.2%)
Housing units with a second mortgage 8,515 (6.3%) 13,881 (11.8%)
House/condo owner moved in on average (years ago) 9 8
House/condo renter moved in on average (years ago) 1 1
Housing units lacking complete kitchen facilities 0.9% 2.2%
Housing units lacking complete plumbing facilities 0.6% 0.4%
Housing units in structures
Housing units in structures AustinSeattle
One, detached 43.1% 39.6%
One, attached 5.2% 6.0%
Two 2.4% 2.0%
3 or 4 4.1% 3.2%
5 to 9 7.2% 5.7%
10 to 19 11.0% 7.0%
20 to 49 8.9% 11.9%
50 or more 17.2% 24.4%
Mobile homes 1.0% 0.1%
Median real estate property taxes paid for housing units
Type Austin Seattle
With mortgages $7,313 (1.5%) $6,413 (0.8%)
With no mortgages $6,435 (1.4%) $6,748 (0.8%)
Marital status
Type Austin Seattle
Divorced 10.6% 9.7%
Never married 42.3% 44.6%
Now married 43.2% 42%
Separated 1.2% 1%
Widowed 2.6% 2.8%
Class of workers - percentage
Class of Workers AustinSeattle
Employee of private company 67.8% 65.2%
State government workers 8.1% 6.1%
Private not-for-profit wage and salary workers 6.9% 11.6%
Self-employed workers in own not incorporated business 6.8% 5.6%
Local government workers 4.9% 5.6%
Self-employed in own incorporated business 3.8% 3.8%
Federal government workers 1.6% 1.9%
Unpaid family workers 0.0% 0.2%
Class of workers - absolute values
Class of Workers AustinSeattle
Employee of private company 386,954 290,562
Federal government workers 9,304 8,361
Local government workers 28,036 24,803
Private not-for-profit wage and salary workers 39,279 51,539
Self-employed in own incorporated business 21,754 17,053
Self-employed workers in own not incorporated business 38,777 24,994
State government workers 46,229 27,235
Unpaid family workers 102 947

Industries and Occupations

The primary industries in Seattle are tech, aerospace, and healthcare, while the main occupations range from software engineers to aircraft mechanics. On the other hand, Austin's economy is dominated by tech, entertainment, and government, with common occupations being software developers, musicians, and government employees. Both cities are well-suited for professionals in the tech industry.

Most common male industries
Industry AustinSeattle
Professional, scientific, and technical services 21.6% 23.3%
Manufacturing 10.9% 8.0%
Construction 9.0% 6.1%
Retail trade 8.7% 11.7%
Accommodation and food services 6.5% 5.8%
Educational services 6.3% 8.0%
Finance and insurance 4.8% 3.8%
Public administration 4.8% 2.5%
Transportation and warehousing 4.5% 3.7%
Information 4.2% 7.5%
Health care and social assistance 4.0% 6.3%
Other services, except public administration 3.3% 3.2%
Administrative and support and waste management services 2.8% 2.7%
Real estate and rental and leasing 2.7% 3.0%
Wholesale trade 2.2% 1.6%
Arts, entertainment, and recreation 2.1% 1.7%
Utilities 0.7% 0.5%
Mining, quarrying, and oil and gas extraction 0.4% 0.1%
Management of companies and enterprises 0.3% 0.1%
Agriculture, forestry, fishing and hunting 0.1% 0.5%
Most common female industries
Industry AustinSeattle
Professional, scientific, and technical services 16.8% 18.9%
Health care and social assistance 14.7% 17.2%
Educational services 13.8% 13.2%
Retail trade 9.1% 11.1%
Public administration 6.8% 4.1%
Accommodation and food services 6.4% 4.9%
Other services, except public administration 6.3% 6.6%
Manufacturing 4.7% 3.7%
Finance and insurance 4.5% 2.6%
Administrative and support and waste management services 4.0% 2.9%
Real estate and rental and leasing 3.0% 2.8%
Information 2.5% 4.0%
Transportation and warehousing 2.2% 2.6%
Arts, entertainment, and recreation 2.0% 1.8%
Wholesale trade 1.2% 1.4%
Construction 1.2% 1.3%
Utilities 0.5% 0.2%
Management of companies and enterprises 0.2% 0.3%
Agriculture, forestry, fishing and hunting 0.1% 0.4%
Most common male occupations
Occupation AustinSeattle
Management occupations 15.7% 16.0%
Computer and mathematical occupations 12.2% 19.1%
Sales and related occupations 9.8% 6.6%
Business and financial operations occupations 8.2% 9.1%
Architecture and engineering occupations 7.7% 5.4%
Construction and extraction occupations 6.7% 3.8%
Food preparation and serving related occupations 4.9% 4.7%
Office and administrative support occupations 4.8% 4.4%
Arts, design, entertainment, sports, and media occupations 3.9% 3.1%
Transportation occupations 3.7% 2.8%
Educational instruction, and library occupations 3.5% 4.6%
Production occupations 3.0% 2.4%
Installation, maintenance, and repair occupations 2.4% 1.8%
Health diagnosing and treating practitioners and other technical occupations 2.0% 2.8%
Life, physical, and social science occupations 1.9% 3.0%
Material moving occupations 1.9% 1.8%
Legal occupations 1.8% 1.8%
Building and grounds cleaning and maintenance occupations 1.5% 1.5%
Health technologists and technicians 1.1% 0.7%
Community and social service occupations 0.8% 1.4%
Most common female occupations
Occupation AustinSeattle
Management occupations 14.4% 14.1%
Business and financial operations occupations 12.0% 9.7%
Office and administrative support occupations 12.0% 11.7%
Sales and related occupations 9.3% 7.3%
Educational instruction, and library occupations 9.2% 8.8%
Health diagnosing and treating practitioners and other technical occupations 5.6% 8.6%
Computer and mathematical occupations 5.1% 7.9%
Food preparation and serving related occupations 5.1% 3.1%
Personal care and service occupations 4.3% 4.4%
Arts, design, entertainment, sports, and media occupations 3.6% 4.6%
Building and grounds cleaning and maintenance occupations 2.9% 1.0%
Healthcare support occupations 2.5% 2.5%
Community and social service occupations 2.3% 3.1%
Legal occupations 2.1% 2.5%
Health technologists and technicians 1.9% 1.0%
Production occupations 1.6% 1.3%
Architecture and engineering occupations 1.6% 2.1%
Life, physical, and social science occupations 1.5% 3.2%
Material moving occupations 1.4% 1.0%
Transportation occupations 0.8% 1.0%
Food environment data per 10,000 residents
Food environment statistics AustinSeattle
Number of convenience stores (no gas) 3.1 2.2
Number of convenience stores (with gas) 1.5 1.2
Number of full-service restaurants 8.0 11.0
Number of grocery stores 1.4 2.4
Number of supercenters and club stores 0.1 0.2
Food environment - absolute values
Food environment statistics AustinSeattle
Number of convenience stores (no gas) 301 399
Number of convenience stores (with gas) 141 220
Number of full-service restaurants 772 2,027
Number of grocery stores 133 439
Number of supercenters and club stores 8 29
Obesity and diabetes
Food environment statistics rate AustinSeattle
Adult diabetes rate 6.7% 6.7%
Adult obesity rate 21.7% 20.5%
Low-income preschool obesity rate 15.3% 14.6%

Health Care

Both Seattle and Austin offer excellent health care services. Seattle has top-ranked hospitals like the University of Washington Medical Center and Swedish Hospital, while Austin features highly-regarded healthcare facilities such as the Dell Seton Medical Center and St. David's Medical Center. Both cities are home to innovative healthcare companies and initiatives.

Health (county statistics)
Type Austin Seattle
General health status score of residents in this county from 1 (poor) to 5 (excellent) 3.6 3.7
Average weight of females (lbs) 159.2 lbs 160.3 lbs
Average weight of males (lbs) 194.2 lbs 191.3 lbs
Residents visited a dentist within the past year 68% 77.9%
Residents exercised in the past month 77.3% 84.1%
Adult residents drank alcohol in the past 30 days 60.5% 81.8%
Residents smoked 100+ cigarettes in their lives 37.3% 41.7%

Fatal vehicle accidents per 100,000 residents
Type Total count per 100,000Drunk per 100,000Fatal count per 100,000Pedestrian count per 100,000Person count per 100,000Vehicle count per 100,000
Year AustinSeattleAustinSeattleAustinSeattleAustinSeattleAustinSeattleAustinSeattle
2021 11.1 6.1 0.0 0.0 12.0 6.1 5.3 4.1 23.5 8.4 17.6 8.0
2020 9.4 3.3 2.2 1.2 10.5 3.5 4.2 2.0 19.9 6.0 14.4 5.4
2019 9.5 3.1 1.2 0.3 9.7 3.2 4.0 2.5 19.7 4.9 14.3 4.1
2018 8.0 2.6 1.4 0.9 8.2 2.6 3.5 1.2 15.8 3.9 12.9 4.2
2017 8.2 4.1 2.0 1.1 8.7 4.1 2.9 2.2 15.4 6.6 12.5 5.6
2016 8.8 3.8 1.2 2.0 8.9 3.9 3.5 1.8 17.8 6.8 13.0 5.3
2015 10.4 3.2 3.1 1.2 11.3 3.8 3.8 1.2 24.0 18.0 17.6 4.8
2014 5.9 2.5 1.8 1.0 6.4 2.7 1.4 1.0 14.7 4.3 9.5 3.0
2013 8.0 4.4 2.5 1.7 8.4 4.6 2.8 2.3 18.6 8.9 12.0 5.8
2012 9.3 3.9 2.5 0.9 9.6 4.3 3.8 1.6 20.8 8.7 13.6 6.3
2011 6.3 3.1 1.3 1.1 7.1 3.2 3.0 0.8 15.0 6.0 8.9 4.7
2010 6.6 3.9 3.7 2.1 6.8 4.4 1.5 1.6 14.6 8.9 10.6 6.4
2009 8.1 5.0 2.5 1.9 8.4 5.2 2.0 3.1 20.6 13.8 13.4 6.8
2008 7.2 4.0 3.4 1.8 7.3 4.0 2.1 2.3 16.2 8.9 11.2 5.3
2007 7.7 3.4 2.7 1.0 7.9 3.4 3.5 1.5 21.9 7.9 12.9 5.9
2006 7.9 7.0 3.6 2.1 9.3 8.4 2.3 2.1 23.0 17.7 12.9 10.6
2005 8.0 5.9 2.8 2.3 8.8 6.3 2.7 1.6 23.0 15.3 13.0 9.9
2004 10.2 5.9 4.5 2.1 10.5 6.1 2.0 2.6 28.0 14.0 16.2 8.6
2003 7.6 5.8 2.9 2.1 7.7 6.3 1.2 3.5 21.8 16.1 13.0 8.1
2002 9.6 4.4 5.7 1.4 10.1 4.7 1.9 1.7 24.4 11.0 14.8 6.5
2001 10.5 6.0 3.4 2.3 10.8 6.1 3.1 3.5 30.3 14.0 16.5 7.2
2000 9.4 5.0 2.1 2.7 10.7 5.5 1.8 1.2 26.5 13.8 16.0 7.8
1999 9.4 4.7 2.7 1.7 9.7 4.7 3.6 1.9 35.6 12.1 19.1 7.4
1998 9.4 4.3 2.1 1.5 10.6 4.5 2.9 1.1 36.9 11.0 24.1 6.9
1997 10.6 5.6 3.9 1.1 11.3 6.2 3.0 1.9 29.6 18.2 17.8 10.1
1996 9.1 5.8 2.8 2.6 10.0 5.8 2.8 2.6 25.1 15.8 14.4 8.5
1995 10.6 6.8 2.9 3.0 12.1 7.4 2.9 2.1 31.5 18.7 19.3 10.2
1994 8.1 4.7 2.8 1.5 9.0 4.7 2.2 2.5 21.5 10.8 12.9 6.4
1993 8.4 7.2 3.0 3.6 8.6 8.9 2.2 1.9 26.4 20.0 14.4 10.8
1992 10.2 7.7 3.3 3.5 11.3 7.9 3.6 2.5 28.0 17.7 15.5 10.9
1991 8.2 5.4 3.5 2.3 8.8 5.6 3.5 1.5 22.6 16.8 13.4 9.7
1990 6.8 7.4 3.8 3.7 7.6 8.3 0.0 0.0 21.7 18.2 12.3 9.5
1989 11.5 6.2 5.6 2.3 13.3 6.6 0.0 0.0 32.0 17.9 17.3 10.3
1988 8.2 10.4 4.0 4.5 8.4 10.9 0.0 0.0 22.7 26.4 13.9 15.0
1987 10.3 8.8 4.8 5.1 10.9 9.4 0.0 0.0 23.5 21.4 14.7 14.1
1986 15.1 10.1 6.4 3.4 16.7 10.3 0.0 0.0 38.4 26.6 23.7 15.4
1985 13.1 6.9 3.0 3.0 13.9 7.3 0.0 0.0 35.8 20.6 21.5 11.3
1984 15.5 8.6 4.2 3.8 17.7 9.0 0.0 0.0 39.6 20.3 23.1 12.1
1983 9.7 9.8 2.8 3.2 10.5 10.0 0.0 0.0 25.7 25.6 14.9 13.4
1982 10.5 10.2 4.0 5.0 11.7 10.6 0.0 0.0 24.5 23.1 14.3 15.3
1981 9.5 17.5 2.2 9.1 10.5 18.1 0.0 0.0 25.3 44.8 14.1 26.0
1980 9.5 12.4 2.6 7.3 10.1 13.2 0.0 0.0 21.1 32.8 12.7 18.4
1979 11.5 13.3 2.6 5.6 12.3 13.9 0.0 0.0 29.0 32.0 16.7 19.1
1978 8.2 14.2 1.6 7.0 9.9 14.4 0.0 0.0 20.3 35.5 12.3 20.5
1977 8.0 8.7 1.2 4.8 8.4 9.7 0.0 0.0 20.1 20.4 12.1 12.5
1976 7.0 9.4 0.0 1.6 8.0 10.0 0.0 0.0 17.3 23.6 9.7 13.2
1975 7.0 9.4 0.0 1.6 8.0 10.0 0.0 0.0 17.3 23.4 9.7 13.1

Fatal vehicle accidents
Type Total countDrunkFatal countPedestrian countPerson countVehicle count
Year AustinSeattleAustinSeattleAustinSeattleAustinSeattleAustinSeattleAustinSeattle
1975 35 48 0 8 40 51 0 0 86 120 48 67
1976 35 48 0 8 40 51 0 0 86 120 48 67
1977 40 44 6 24 42 49 0 0 100 103 60 63
1978 41 71 8 35 49 72 0 0 101 178 61 103
1979 57 66 13 28 61 69 0 0 144 159 83 95
1980 47 61 13 36 50 65 0 0 105 162 63 91
1981 47 87 11 45 52 90 0 0 126 222 70 129
1982 52 51 20 25 58 53 0 0 122 115 71 76
1983 48 49 14 16 52 50 0 0 128 128 74 67
1984 77 43 21 19 88 45 0 0 197 102 115 61
1985 65 35 15 15 69 37 0 0 178 104 107 57
1986 75 51 32 17 83 52 0 0 191 135 118 78
1987 51 45 24 26 54 48 0 0 117 109 73 72
1988 41 53 20 23 42 56 0 0 113 135 69 77
1989 57 32 28 12 66 34 0 0 159 92 86 53
1990 34 38 19 19 38 43 0 0 108 94 61 49
1991 42 28 18 12 45 29 18 8 115 87 68 50
1992 53 40 17 18 59 41 19 13 146 92 81 57
1993 45 38 16 19 46 47 12 10 141 105 77 57
1994 44 25 15 8 49 25 12 13 117 57 70 34
1995 59 36 16 16 67 39 16 11 175 99 107 54
1996 51 31 16 14 56 31 16 14 141 84 81 45
1997 60 30 22 6 64 33 17 10 168 97 101 54
1998 54 23 12 8 61 24 17 6 213 59 139 37
1999 55 25 16 9 57 25 21 10 209 65 112 40
2000 62 28 14 15 70 31 12 7 174 78 105 44
2001 72 34 23 13 74 35 21 20 208 80 113 41
2002 66 25 39 8 69 27 13 10 167 63 101 37
2003 52 33 20 12 53 36 8 20 150 92 89 46
2004 71 34 31 12 73 35 14 15 195 80 113 49
2005 57 34 20 13 62 36 19 9 163 88 92 57
2006 58 41 26 12 68 49 17 12 168 103 94 62
2007 58 20 20 6 59 20 26 9 164 47 97 35
2008 55 24 26 11 56 24 16 14 124 54 86 32
2009 64 31 20 12 66 32 16 19 162 85 105 42
2010 52 24 29 13 54 27 12 10 115 54 84 39
2011 52 19 11 7 58 20 25 5 123 37 73 29
2012 78 25 21 6 81 27 32 10 175 55 115 40
2013 71 29 22 11 74 30 25 15 165 58 106 38
2014 54 17 16 7 58 18 13 7 134 29 87 20
2015 96 22 29 8 104 26 35 8 221 124 162 33
2016 83 27 11 14 84 28 33 13 167 48 122 38
2017 78 30 19 8 83 30 28 16 147 48 119 41
2018 77 19 13 7 79 19 34 9 152 29 124 31
2019 93 23 12 2 95 24 39 19 193 37 140 31
2020 91 24 21 9 101 26 40 15 192 44 139 40
2021 107 45 0 0 116 45 51 30 227 62 170 59
Police full-time law enforcement employees
Year AustinSeattle
2021 2,087 1,597
2020 2,290 1,900
2019 2,469 1,960
2018 2,422 1,954
2017 2,366 1,963
2016 2,361 1,946
2015 2,290 1,919
2014 2,306 1,889
2013 2,233 1,864
2012 2,252 1,801
2011 2,211 1,804
2010 2,141 1,861
2009 2,146 1,857
2008 2,034 1,825
2007 1,995 1,775
2006 1,946 1,746
2005 1,835 1,762
2004 1,826 1,729
2003 1,744 1,719
Police full-time law enforcement employees (per 1,000 residents)
Year AustinSeattle
2021 2.1 2.0
2020 2.3 2.5
2019 2.5 2.6
2018 2.5 2.6
2017 2.4 2.7
2016 2.5 2.8
2015 2.4 2.8
2014 2.6 2.8
2013 2.6 2.9
2012 2.7 2.9
2011 2.7 2.9
2010 2.7 3.1
2009 2.8 3.1
2008 2.7 3.1
2007 2.8 3.0
2006 2.7 3.0
2005 2.6 3.0
2004 2.7 3.0
2003 2.6 3.0
Local government: full-time employees
Job AustinSeattle
Airports 498 0
Financial administration 587 1,213
Firefighters 1,129 1,006
Fire - other 152 89
Health 1,142 0
Judicial and legal 261 338
Local libraries 400 324
Natural resources 320 0
Other and unallocable 624 384
Other government administration 524 350
Parks and recreation 1,168 932
Police - other 608 480
Police protection - officers 1,858 1,499
Sewerage 509 292
Solid waste management 476 181
Streets and highways 814 830
Totals for government 13,367 10,908
Water supply 579 754
Local government: part-time employees
Job AustinSeattle
Airports 8 0
Financial administration 39 130
Fire - other 2 7
Health 69 0
Judicial and legal 16 48
Local libraries 36 338
Natural resources 14 0
Other and unallocable 34 40
Other government administration 24 74
Parks and recreation 709 932
Police - other 18 17
Sewerage 19 43
Solid waste management 13 24
Streets and highways 241 142
Totals for government 1,331 2,128
Water supply 16 109
Place of birth - Foreign born
Residents AustinSeattle
All residents 18.2% 19.5%
American Indian / Alaska Native residents 7.1% 15.4%
Asian residents 60.4% 64.1%
Black or African American residents 11.6% 26.9%
Native Hawaiian / Pacific Islander residents 4.1% 20.7%
Other race residents 37.4% 44.7%
Two or more races residents 16.8% 10.1%
White residents 7.9% 6.9%
White alone, not Hispanic / Latino residents 5.7% 6.8%
Place of birth - Native, outside of US
Residents AustinSeattle
All residents 2.5% 2.1%
American Indian / Alaska Native residents 0.0% 3.4%
Asian residents 1.8% 2.1%
Black or African American residents 1.3% 2.4%
Native Hawaiian / Pacific Islander residents 3.2% 16.4%
Other race residents 2.3% 1.3%
Two or more races residents 3.8% 3.6%
White residents 2.0% 1.6%
White alone, not Hispanic / Latino residents 1.7% 1.4%
Place of birth - Born in state of residence
Residents AustinSeattle
All residents 47.2% 34.9%
American Indian / Alaska Native residents 56.7% 56.4%
Asian residents 23.0% 17.2%
Black or African American residents 54.4% 35.7%
Native Hawaiian / Pacific Islander residents 33.0% 43.4%
Other race residents 53.4% 27.3%
Two or more races residents 55.7% 48.8%
White residents 47.9% 38.6%
White alone, not Hispanic / Latino residents 48.1% 39.5%
Place of birth - Born in other state
Residents AustinSeattle
All residents 32.1% 43.6%
American Indian / Alaska Native residents 36.2% 24.9%
Asian residents 14.8% 16.6%
Black or African American residents 32.7% 35.0%
Native Hawaiian / Pacific Islander residents 59.6% 19.4%
Other race residents 7.0% 26.7%
Two or more races residents 23.7% 37.5%
White residents 42.3% 52.9%
White alone, not Hispanic / Latino residents 44.6% 52.3%
English speakers (speaking English at home)
Type Austin Seattle
Born in the United States residents 91.1% 93.2%
Foreign born residents 15.7% 23.4%
Native, born elsewhere residents 58.1% 74%
Total residents 69.5% 77.9%
Mechanisms of homicide
Mechanism AustinSeattle
Homicides from 2000 to 2006 223 486
Cut / Pierce 48 77
Firearm 97 276
Suffocation 0 22
Mechanisms of homicide per 1,000,000 residents
Mechanism AustinSeattle
Homicides from 2000 to 2006 36.6 39.0
Cut / Pierce 7.9 6.2
Firearm 15.9 22.2
Suffocation 0 1.8
Mechanisms of suicide per 1,000,000 residents
Mechanism AustinSeattle
Suicides from 2000 to 2006 115.5 112.8
Cut / Pierce 0 3.1
Fall 0 7.3
Firearm 54.2 50.4
Poisoning 25.6 23.9
Suffocation 27.4 24.0

Infrastructure

Austin's infrastructure integrates both modern design and traditional architecture, with a city layout that's relatively easy to navigate. Seattle's infrastructure is also modern but has unique features like its large ferries network. Both cities have international airports and good quality public transportation systems. However, traffic can be significant in both cities during peak hours.

Infrastructure
Type Austin Seattle
Hospitals 65 22
TV stations 20 17
Arenas or stadiums 2 5
Bank branches located here 264 236
Bank institutions located here 43 37
Main business address for public companies 44 54
Drinking water stations with no reported violations in the past 46 3
Drinking water stations with reported violations in the past 95 20

Schools

School facilities
Type Austin Seattle
Private elementary/middle schools 35 51
Private high schools 22 21
Public elementary/middle schools 184 94
Public high schools 54 35
Colleges/Universities 37 24
HMDA - Conventional home purchase loans - Applications denied
Year AustinSeattle
1999 4,733 1,357
2000 2,950 1,148
2001 2,038 890
2002 1,772 840
2003 2,213 1,421
2004 2,458 1,810
2005 3,121 2,341
2006 3,367 2,789
2007 2,560 2,273
2008 1,747 1,113
2009 1,067 748

Culture and Food

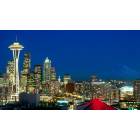
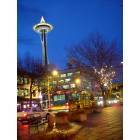
Seattle's culture is rich in art, music, and cuisine, from its famous coffee culture to well-known landmarks like the Space Needle and Pike Place Market. Diverse seafood, a result of its Pacific Northwest location, marks Seattle's culinary scene. Austin, the "Live Music Capital of the World," is famous for its music festivals, including SXSW and Austin City Limits. Its food scene is dominated by barbecue and Tex-Mex cuisine, along with a burgeoning farm-to-table movement.

Sports Teams

Seattle is renowned for its passionate sports culture, with major league teams including the Seattle Seahawks (NFL), Seattle Mariners (MLB), and Seattle Sounders (MLS). The city also recently welcomed the NHL team, the Seattle Kraken. Austin, on the other hand, doesn't have any major league sports teams but does feature a fervent college sports scene, with the University of Texas Longhorn teams.