Comparing Boston, Massachusetts, and Albuquerque, New Mexico, reveals significant differences across various life aspects. The two cities differ in crime rates, weather conditions, cost of living, education, economic opportunities, healthcare facilities, and more. For potential relocators and tourists, understanding these contrasts in detail can provide a helpful guide. Boston's historic culture and thriving job market stand out, while Albuquerque impresses with its pleasant climate and lower living costs. Below is a detailed comparison of the two cities.
Distance between
Boston, MA and
Albuquerque, NM : 1,963.1 miles
Boston's population is larger by 16%. Its population has grown by 65,635 people (11.1%) since 2000. The population of Albuquerque has grown by 113,992 people (25.4%) during that time.
The crime rate in Albuquerque is noticeably higher than that in Boston. Albuquerque struggles with both property and violent crime; it's well above the national average. Boston, while not free from crime, tends to have a lower crime rate, especially in terms of violent crimes. Some neighborhoods in Boston have crime rates below the national average. So, for those prioritizing safety, Boston may be a preferable choice.
City-data.com crime index counts serious crimes and violent crime more heavily. It adjusts for the number of visitors and daily workers commuting into cities. (higher means more crime, U.S. average = 301.1)
City-data.com crime index counts serious crimes and violent crime more heavily. It adjusts for the number of visitors and daily workers commuting into cities. (higher means more crime, U.S. average = 301.1)
Sex Offenders
According to our data, there are 331 registered sex offenders living in Boston and 848 registered sex offenders living in . The ratio of residents to sex offenders in Boston is 2,033 to 1; the ratio in Albuquerque is 660 to 1. The number of registered sex offenders compared to the number of residents is a lot smaller in Boston than in Albuquerque.
Cost of Living
Cost of living is another key distinguishing factor. Boston is considerably more expensive than Albuquerque. Housing is the biggest factor in the cost of living difference, with Boston's housing costs being significantly higher. Goods, services, and healthcare are also more costly in Boston. So, Albuquerque can be more appealing for those seeking a lower cost of living.
Income Tax
Massachusetts has a flat state income tax rate that applies to all income levels, whereas New Mexico applies a progressive tax system with varying rates.
Property Tax
Property taxes in both cities vary based on location, with rates generally higher in Boston than in Albuquerque.
Sales Tax
New Mexico has a higher state sales tax than Massachusetts. Albuquerque also charges a city sales tax on top of the state levy, which Boston does not.
Income
Type
Boston
Albuquerque
Estimated median household income
$79,283
$58,512
Estimated per capita income
$50,337
$35,738
Cost of living index (U.S. average is 100)
143.8
93.6
If you make $50,000 in Albuquerque, you will have to make $76,816 in Boston to maintain the same standard of living.
Geographical Conditions
Boston is a coastal city, known for its waterfront and harbors, while Albuquerque sits in the high desert and is known for its mountainous terrain and the Rio Grande river.
Both cities have public and private schools, with Boston’s education system being more highly ranked. Boston is also home to renowned universities like Harvard and MIT, making it an academic hub. Albuquerque also has respectable educational institutions, including the University of New Mexico.
Boston's economy is stronger and is grounded in sectors including biotechnology, IT, finance, and higher education. Conversely, Albuquerque has a diversified economy with healthcare, retail, and education sectors leading the way. Unemployment rates tend to be lower in Boston.
Biggest Employers
In Boston, some of the biggest employers are Massachusetts General Hospital, Brigham and Women's Hospital, and Boston University. In Albuquerque, Presbyterian Healthcare Services, Sandia National Laboratories, and the University of New Mexico top the list.
There were 53 building permits issued in Boston in 2012 (20 more than in 2011) compared to 773 building permits issued in Albuquerque in 2012 (19 more than in 2011).
In Boston (Suffolk County), 77.4% voted for Democrats and 20.8% for Republicans in 2012 Presidential Election. In Albuquerque (Bernalillo County), 55.8% voted for Democrats and 39.4% for Republicans.
Elections
Type
Democrats
Republicans
Other
Year
Boston
Albuquerque
Boston
Albuquerque
Boston
Albuquerque
2020
80.6%
61.3%
17.5%
36.7%
1.9%
2.0%
2016
78.5%
52.4%
16.1%
34.6%
5.4%
13.0%
2012
77.4%
55.8%
20.8%
39.4%
1.8%
4.9%
2008
76.9%
60.2%
21.2%
38.8%
1.8%
1.0%
2004
75.9%
51.6%
22.8%
47.4%
1.3%
0.9%
2000
71.5%
48.8%
20.5%
46.8%
8.0%
4.4%
1996
73.0%
48.3%
19.9%
43.2%
7.0%
8.5%
Breakdown of population affiliated with a religious congregation
Type
Adherents
Congregations
Religion
Boston
Albuquerque
Boston
Albuquerque
CATHOLIC CHURCH
46.1%
26.5%
12.4%
10.7%
AMERICAN BAPTIST CHURCHES IN THE USA
1.2%
0.1%
8.9%
0.5%
MUSLIM ESTIMATE
1.1%
0.3%
2.4%
0.5%
EPISCOPAL CHURCH
1.0%
0.7%
4.7%
1.9%
SEVENTH DAY ADVENTIST CHURCH
0.7%
0.4%
4.0%
1.9%
SOUTHERN BAPTIST CONVENTION
0.6%
2.6%
6.9%
11.4%
LUTHERAN CHURCH
0.1%
0.3%
0.4%
1.7%
EVANGELICAL LUTHERAN CHURCH IN AMERICA
0.0%
0.4%
0.7%
1.9%
Weather
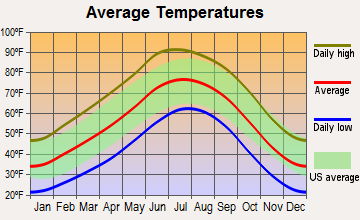
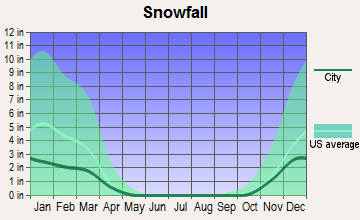
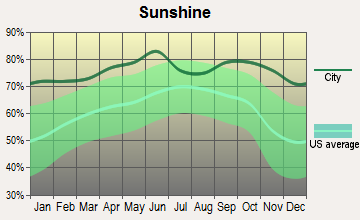
Weather significantly varies between the two cities. Boston experiences a humid continental climate with cold winters and warm, humid summers. It's also known for heavy snowfall. On the other hand, Albuquerque enjoys a semi-arid climate with mild winters and hot summers. The city receives abundant sunshine and less snow, making it a good choice for those who prefer warmer climates.
Weather and climate
Type
Boston
Albuquerque
Temperature - Average
50.6°F
55.6°F
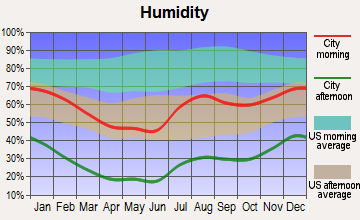
Humidity - Average morning or afternoon humidity
69.9%
44.3%
Humidity - Differences between morning and afternoon humidity
23.1%
46%
Humidity - Maximum monthly morning or afternoon humidity
78%
63%
Humidity - Minimum monthly morning or afternoon humidity
55%
17%
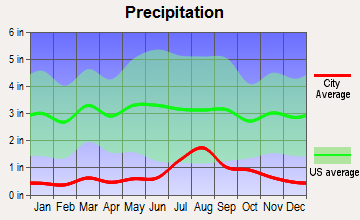
Precipitation - Yearly average
46.3 in
9.4 in
Snowfall - Yearly average
88.3 in
19.2 in
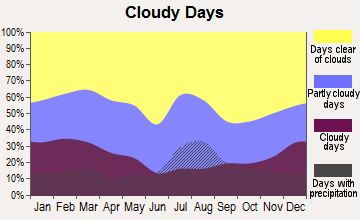
Clouds - Number of days clear of clouds
16.4%
27.8%
Sunshine amount - Average
63.7%
82.7%
Sunshine amount - Differences during a year
20%
9%
Sunshine amount - Maximum monthly
68%
82%
Sunshine amount - Minimum monthly
48%
73%
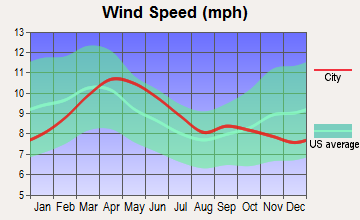
Wind speed - Average
12.5 mph
8.9 mph
Average climate in Boston, Massachusetts
Average climate in Albuquerque, New Mexico
Air pollution
Type
AQI
CO
NO2
OZONE
PB
PM10
PM25
SO2
Year
Boston
Albuquerque
Boston
Albuquerque
Boston
Albuquerque
Boston
Albuquerque
Albuquerque
Albuquerque
Boston
Albuquerque
Boston
Albuquerque
2018
76
95
0.24
0.23
12.3
10.3
26.1
35.3
N/A
N/A
20.3
N/A
9.2
4.3
0.5
0.5
2017
83
82
0.26
0.24
12.5
10.4
26.4
33.5
N/A
N/A
18.4
N/A
8.9
5.7
0.6
0.4
2016
75
86
0.27
0.22
14.1
10.4
24.4
33.2
N/A
N/A
16.0
N/A
7.4
5.3
0.5
0.8
2015
81
84
0.30
0.23
15.7
11.2
23.4
30.8
N/A
N/A
16.0
N/A
8.9
6.1
0.8
0.7
2014
76
89
0.30
0.22
14.0
11.7
24.5
31.8
N/A
N/A
22.0
N/A
9.3
6.1
1.2
0.6
2013
86
91
0.30
0.22
13.5
11.8
26.2
34.1
N/A
N/A
21.8
N/A
9.8
5.7
1.3
0.8
2012
89
116
0.29
0.18
11.8
13.7
23.5
33.6
N/A
N/A
26.6
N/A
9.5
9.3
1.4
0.7
2011
87
130
0.30
0.21
14.8
13.5
24.2
34.0
N/A
N/A
28.6
N/A
10.5
9.9
1.6
0.4
2010
92
92
0.26
0.15
13.8
12.2
25.0
32.1
N/A
N/A
25.1
N/A
10.0
6.8
2.3
N/A
2009
86
81
0.32
0.16
15.3
12.5
23.5
30.4
N/A
N/A
26.2
N/A
9.7
6.9
2.4
N/A
2008
96
91
0.26
0.21
16.6
11.8
22.9
31.5
N/A
N/A
20.8
N/A
12.4
6.5
3.8
N/A
2007
124
112
0.28
0.29
18.5
13.0
19.9
31.4
N/A
N/A
19.7
N/A
13.9
6.7
4.0
N/A
2006
103
103
0.38
0.33
15.8
14.2
20.9
31.8
N/A
N/A
21.1
N/A
12.5
N/A
3.5
N/A
2005
115
85
0.28
0.32
17.0
13.9
22.1
29.7
N/A
N/A
20.0
N/A
12.7
N/A
4.3
N/A
2004
104
89
0.26
0.32
15.6
16.6
22.5
29.8
0.003
N/A
21.5
N/A
13.7
N/A
4.6
N/A
2003
116
115
0.55
0.37
20.1
17.6
22.4
31.9
0.004
N/A
25.1
N/A
14.5
N/A
5.2
N/A
2002
130
91
0.35
0.43
19.8
18.9
21.8
29.1
0.005
N/A
23.1
N/A
13.5
N/A
5.0
N/A
2001
112
81
0.44
0.67
19.9
17.2
20.7
29.4
N/A
N/A
20.9
N/A
13.6
N/A
5.9
N/A
2000
88
95
0.57
0.81
18.8
17.0
19.2
27.9
N/A
N/A
17.7
N/A
10.0
N/A
5.6
N/A
Natural disasters
Type
Boston
Albuquerque
Tornado activity compared to U.S. average
55.3%
6.4%
Earthquake activity compared to U.S. average
26.6%
802.6%
Natural disasters compared to U.S. average
33%
9%
Transportation
Boston's public transit system is more developed than Albuquerque's, with a subway system (the "T") and numerous bus routes. Albuquerque primarily relies on buses for public transportation. Commuting time in Albuquerque is typically less than in Boston.
Transport
Type
Boston
Albuquerque
Amtrak stations
3
1
Amtrak stations nearby
3
1
FAA registered aircraft
224
1
FAA registered aircraft manufacturers and dealers
4
17
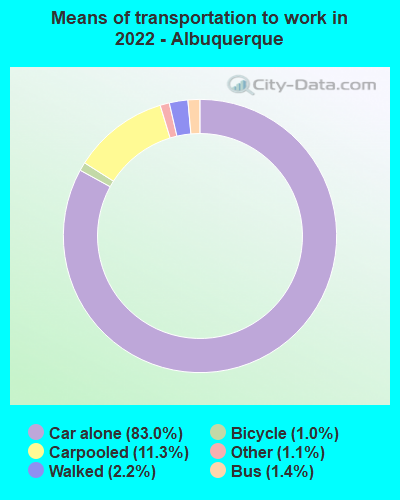
Means of transportation to work
Type
Boston
Albuquerque
Bicycle
1.7%
0.9%
Bus
7.1%
0.8%
Carpooled
6.8%
9.6%
Car alone
54.7%
85.1%
Ferryboat
0.2%
0%
Motorcycle
0.1%
0.2%
Railroad
0.5%
0%
Streetcar
13.5%
0%
Subway
3.2%
0%
Taxicab
0.4%
0%
Walked
10%
2.3%
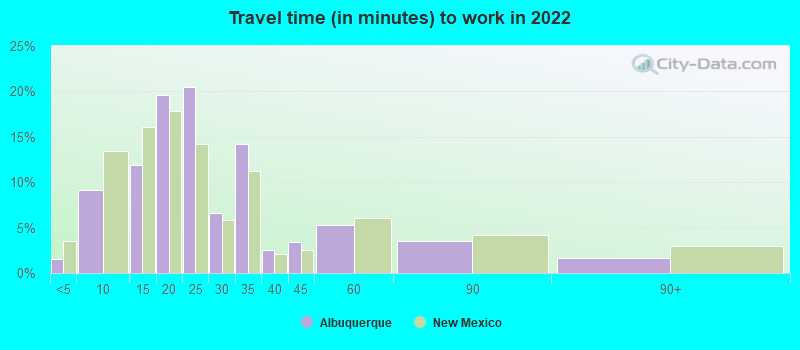
Average travel time to work
Type
Boston
Albuquerque
Average
38.6 min
24.5 min
Other means
26.1 min
20.8 min
Public transportation
38.6 min
37.8 min
Private vehicle occupancy
Type
Boston
Albuquerque
Average
1.2
1.1
Drove alone
87.1%
91.6%
In 2 person carpool
10.1%
6.6%
In 3 person carpool
1.7%
1.2%
In 4 person carpool
0.4%
0.3%
In 5-6 person carpool
0.2%
0.1%
In 7+ person carpool
0.5%
0.2%
How many people usually rode to work in the car, truck or van.
Real Estate
The real estate market in Boston is much hotter but also significantly more expensive than Albuquerque. The median home price in Boston is several times that in Albuquerque. However, both cities offer a range of home styles from historic homes to modern condos.
Neighborhoods
In Boston, upscale neighborhoods like Beacon Hill and Back Bay are known for their historic architecture and attraction. In Albuquerque, neighborhoods like Nob Hill and North Valley offer a mix of old and new, all underlined with a Southwestern flair.
Houses and residents
Type
Boston
Albuquerque
Houses
307,025
256,814
Average household size (people)
2.3
2.4
Median year apartment built
1957
1983
Length of stay in the house since moving in
14.6 years
12.6 years
Houses occupied
271,941 (88.6%)
243,582 (94.8%)
Houses occupied by owners
94,497 (34.7%)
147,964 (60.7%)
Houses occupied by renters
177,444 (65.3%)
95,618 (39.3%)
Median rent asked for vacant for-rent units
$2,632
$893.82
Median monthly housing costs
$1,883
$1,021
Median price asked for vacant for-sale houses and condos
$1,040,328
$171,149
Estimated median house or condo value
$659,700
$251,500
Median numbers of rooms
4.3
5.3
Median number of rooms in apartments
3.9
3.9
Median number of rooms in houses and condos
5.4
6.2
Median house price - detached houses
$683,896
$290,578
Median house price - in 2-unit structures
$639,493
$636,758
Median house price - in 3-to-4-unit structures
$745,440
$274,794
Median house price - in 5 or more unit structures
$986,433
$224,872
Median house price - mobile homes
$117,668
$52,392
Median house price - Townhouses or other attached units
Over $1,000,000
$209,825
Median house price - All housing units
$793,380
$271,083
Median house age
73
38
Renting percentage
66.1%
39.7%
Housing density (houses/condos per square mile)
6,340.1
1,421.7
House value disparities
23.5%
29.8%
Household income disparities
48.2%
45.9%
Median household income for houses/condes with a mortgage
$138,364
$87,851
Median household income for apartments without a mortgage
$97,179
$63,195
Housing units without a mortgage
1,250 (1.8%)
1,631 (1.6%)
Housing units with both a second mortgage and home equity loan
7,686 (11.2%)
3,560 (3.6%)
Housing units with a mortgage
67,144 (98.2%)
97,744 (98.4%)
Housing units with a home equity loan
218 (0.3%)
309 (0.3%)
Housing units with a second mortgage
9,540 (13.9%)
6,864 (6.9%)
House/condo owner moved in on average (years ago)
12
11
House/condo renter moved in on average (years ago)
3
1
Housing units lacking complete kitchen facilities
1.4%
1.1%
Housing units lacking complete plumbing facilities
0.7%
0.3%
Housing units in structures
Housing units in structures
Boston
Albuquerque
One, detached
12.0%
61.4%
One, attached
6.4%
6.6%
Two
11.9%
1.0%
3 or 4
24.1%
6.1%
5 to 9
11.2%
4.7%
10 to 19
7.2%
4.7%
20 to 49
8.0%
4.8%
50 or more
19.0%
6.3%
Mobile homes
0.1%
4.2%
Median real estate property taxes paid for housing units
Self-employed workers in own not incorporated business
11,605
14,060
State government workers
12,810
20,531
Unpaid family workers
303
359
Industries and Occupations
Boston’s main industries include education, health services, and finance. It's a hub for biotechnology and information technology. Albuquerque's economy is more diverse, with retail trade, healthcare, and education being prominent industries.
Boston is renowned globally for its healthcare system with some of the best hospitals in the country. Albuquerque also provides notable healthcare services with top-notch hospitals, but Boston's healthcare facilities stand out.
Health (county statistics)
Type
Boston
Albuquerque
General health status score of residents in this county from 1 (poor) to 5 (excellent)
Both cities have well-developed infrastructures, with Boston boasting historic landmarks and Albuquerque showcasing Southwestern charm. However, Boston's infrastructure is more robust when it comes to public transportation and healthcare facilities.
Infrastructure
Type
Boston
Albuquerque
Hospitals
22
36
TV stations
22
18
Arenas or stadiums
3
1
Bank branches located here
146
137
Bank institutions located here
37
24
Main business address for public companies
60
8
Drinking water stations with no reported violations in the past
2
7
Drinking water stations with reported violations in the past
HMDA - Conventional home purchase loans - Applications denied
Year
Boston
Albuquerque
1999
1,237
2,651
2000
1,140
1,303
2001
947
752
2002
975
693
2003
1,536
1,022
2004
2,273
1,729
2005
3,225
2,199
2006
3,567
2,639
2007
2,652
1,575
2008
1,372
654
2009
910
368
Culture and Food
Boston boasts a rich history that has embedded a deep-rooted culture in the city, reflecting in its food, art, and lifestyle. Albuquerque also has a unique culture, heavily influenced by the Native American and Spanish histories, providing a distinct Southwestern appeal.
Sports Teams
In terms of sports teams, both cities have a lot to offer. Boston is home to several major league sports teams like the Red Sox, Celtics, and Patriots, while Albuquerque hosts minor-league teams and is prominent for hot air ballooning.


 Boston, MA
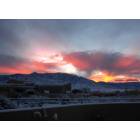
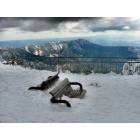
 Albuquerque, NM