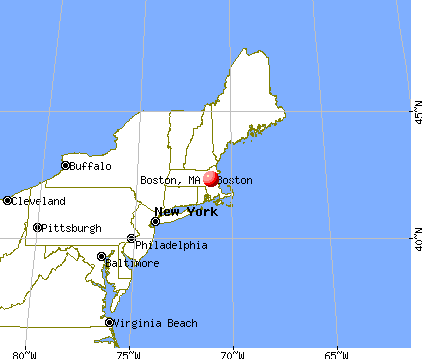
Boston, Massachusetts

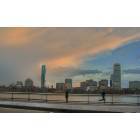
Boston: Boston Sunset
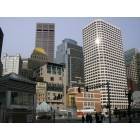
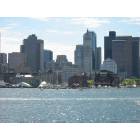
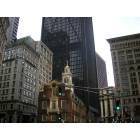
Boston: financial disctric

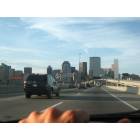
Boston: up close
Boston: Boston
Boston: Boston's Back Bay Skyline 2008
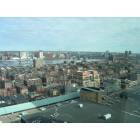
Boston: Boston
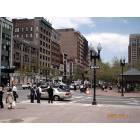
Boston: Copley Square
Boston: Boston
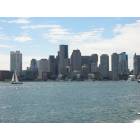
Boston: Boston 1
Boston: Boston Commons
Boston: the old state house
- see
197
more - add
your


Submit your own pictures of this city and show them to the world
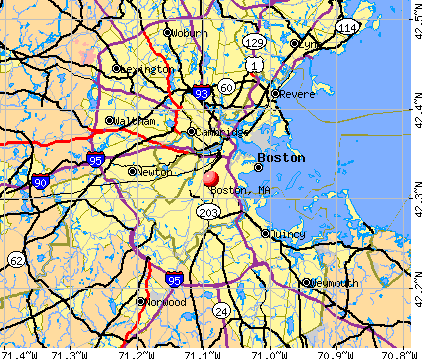
- OSM Map
- General Map
- Google Map
- MSN Map
Population change since 2000: +10.4%
 |
| Males: 315,541 | |
| Females: 335,165 |
| Median resident age: | 33.3 years |
| Massachusetts median age: | 40.3 years |
Zip codes: 02108, 02109, 02110, 02111, 02113, 02114, 02115, 02116, 02118, 02119, 02120, 02121, 02122, 02124, 02125, 02126, 02127, 02128, 02129, 02130, 02131, 02132, 02134, 02135, 02136, 02151, 02152, 02163, 02199, 02203, 02210, 02215, 02467.
Boston Zip Code Map| Boston: | $86,331 |
| MA: | $94,488 |
Estimated per capita income in 2022: $58,125 (it was $23,353 in 2000)
Boston city income, earnings, and wages data
Estimated median house or condo value in 2022: $701,400 (it was $210,100 in 2000)
| Boston: | $701,400 |
| MA: | $534,700 |
Mean prices in 2022: all housing units: over $1,000,000; detached houses: $857,162; townhouses or other attached units: over $1,000,000; in 2-unit structures: $973,439; in 3-to-4-unit structures: $950,518; in 5-or-more-unit structures: over $1,000,000; mobile homes: $228,234
Median gross rent in 2022: $1,970.
(11.9% for White Non-Hispanic residents, 22.0% for Black residents, 25.4% for Hispanic or Latino residents, 22.1% for American Indian residents, 31.3% for Native Hawaiian and other Pacific Islander residents, 20.9% for other race residents, 20.7% for two or more races residents)
Detailed information about poverty and poor residents in Boston, MA


Compare current foreclosures in Boston, MA:
| Photo | Address | Area | Beds / Baths | Price | Details |
|---|---|---|---|---|---|

|
#1
Commonwealth Ave Apt B
Boston, MA 02116
|
- sq. feet
|
1 baths 2 beds |
$684,900
|
show details |

|
#2
Church St
Boston, MA 02122
|
3,663 sq. feet
|
3 baths 6 beds |
show details | |

|
#3
Magnolia St
Boston, MA 02125
|
3,654 sq. feet
|
3 baths 6 beds |
show details | |

|
#4
Bloomfield St
Boston, MA 02124
|
2,667 sq. feet
|
2 baths 6 beds |
show details | |

|
#5
Iroquois St
Boston, MA 02120
|
2,524 sq. feet
|
1 baths 4 beds |
show details | |

|
#6
Marden Ave # 6
Boston, MA 02124
|
1,639 sq. feet
|
1 baths 3 beds |
show details | |

|
#7
Minot St
Boston, MA 02122
|
1,678 sq. feet
|
2 baths 3 beds |
show details | |

|
#8
Bloomfield St
Boston, MA 02124
|
2,667 sq. feet
|
1 baths 5 beds |
show details | |

|
#9
Vera St
Boston, MA 02124
|
2,736 sq. feet
|
2 baths 5 beds |
show details | |

|
#10
Drummond St # 1
Boston, MA 02121
|
1,842 sq. feet
|
2 baths 4 beds |
show details |
| Photo | Address | Area | Beds / Baths | Price | Details |
|---|---|---|---|---|---|

|
#11
Whittier Pl Apt 10a
Boston, MA 02114
|
833 sq. feet
|
1 baths 1 beds |
show details | |

|
#12
Gibson St Apt 203
Boston, MA 02122
|
820 sq. feet
|
1 baths 2 beds |
show details | |

|
#13
Webster St
Boston, MA 02128
|
2,892 sq. feet
|
3 baths 7 beds |
show details | |

|
#14
Wrentham St
Boston, MA 02124
|
1,268 sq. feet
|
1 baths 3 beds |
show details | |

|
#15
Iroquois St
Boston, MA 02120
|
2,342 sq. feet
|
2 baths 4 beds |
show details | |

|
#16
Thane St
Boston, MA 02124
|
2,735 sq. feet
|
2 baths 6 beds |
show details | |

|
#17
Cunard St
Boston, MA 02120
|
3,216 sq. feet
|
3 baths 6 beds |
show details | |

|
#18
Michigan Ave
Boston, MA 02121
|
2,539 sq. feet
|
2 baths 5 beds |
show details | |

|
#19
Boutwell St
Boston, MA 02122
|
2,444 sq. feet
|
2 baths 5 beds |
show details | |

|
#20
Quincy St
Boston, MA 02121
|
1,826 sq. feet
|
3 baths 8 beds |
show details |
| Photo | Address | Area | Beds / Baths | Price | Details |
|---|---|---|---|---|---|

|
#21
Salem St Apt 15
Boston, MA 02113
|
339 sq. feet
|
1 baths 1 beds |
show details | |

|
#22
E 7th St
Boston, MA 02127
|
1,827 sq. feet
|
1 baths 4 beds |
show details | |

|
#23
Sleeper St Apt 506
Boston, MA 02210
|
1,607 sq. feet
|
1 baths 2 beds |
show details | |

|
#24
Washington St
Boston, MA 02124
|
2,206 sq. feet
|
2 baths 3 beds |
show details | |

|
#25
Seaver St # 2
Boston, MA 02121
|
3,603 sq. feet
|
3 baths 6 beds |
show details | |

|
#26
Olney St
Boston, MA 02121
|
1,900 sq. feet
|
1 baths 3 beds |
show details | |

|
#27
Longfellow St
Boston, MA 02122
|
1,231 sq. feet
|
1 baths 3 beds |
show details | |

|
#28
Church St
Boston, MA 02122
|
3,663 sq. feet
|
3 baths 6 beds |
show details | |

|
#29
Adams St
Boston, MA 02122
|
2,446 sq. feet
|
2 baths 6 beds |
show details | |

|
#30
Wilcutt Rd
Boston, MA 02121
|
1,244 sq. feet
|
1 baths 4 beds |
show details |
| Photo | Address | Area | Beds / Baths | Price | Details |
|---|---|---|---|---|---|

|
#31
Baker Ct # 4
Boston, MA 02125
|
966 sq. feet
|
1 baths 3 beds |
show details | |

|
#32
W 7th St # B
Boston, MA 02127
|
946 sq. feet
|
1 baths 2 beds |
show details | |

|
#33
Newcomb St Apt 7
Boston, MA 02118
|
1,177 sq. feet
|
1 baths 1 beds |
show details | |

|
#34
Wayland St
Boston, MA 02125
|
1,498 sq. feet
|
1 baths 3 beds |
show details | |

|
#35
Gannett St
Boston, MA 02121
|
2,608 sq. feet
|
2 baths 7 beds |
show details | |

|
#36
Wensley St
Boston, MA 02120
|
1,407 sq. feet
|
1 baths 3 beds |
show details | |

|
#37
Leyden St
Boston, MA 02128
|
1,761 sq. feet
|
2 baths 5 beds |
show details | |

|
#38
Alexander St
Boston, MA 02125
|
1,408 sq. feet
|
1 baths 3 beds |
show details | |

|
#39
Lindsey St
Boston, MA 02124
|
1,961 sq. feet
|
2 baths 6 beds |
show details | |

|
#40
Millet St
Boston, MA 02124
|
2,433 sq. feet
|
3 baths 5 beds |
show details |
| Photo | Address | Area | Beds / Baths | Price | Details |
|---|---|---|---|---|---|

|
#41
Atlantic Ave Unit 15k
Boston, MA 02210
|
3,385 sq. feet
|
4 baths 2 beds |
show details | |

|
#42
Dorchester Ave Apt 13
Boston, MA 02124
|
720 sq. feet
|
1 baths 2 beds |
show details | |

|
#43
Atherton St
Boston, MA 02119
|
3,238 sq. feet
|
2 baths 6 beds |
show details | |

|
#44
Highland St
Boston, MA 02119
|
2,634 sq. feet
|
2 baths 8 beds |
show details | |

|
#45
Glendale St
Boston, MA 02125
|
2,340 sq. feet
|
2 baths 5 beds |
show details | |

|
#46
Goodwin Pl Apt 2
Boston, MA 02114
|
441 sq. feet
|
1 baths 1 beds |
show details | |

|
#47
Hutchings St # 2
Boston, MA 02121
|
5,240 sq. feet
|
4 baths 4 beds |
show details | |

|
#48
Shawmut Ave Apt 1
Boston, MA 02118
|
610 sq. feet
|
1 baths 1 beds |
show details | |

|
#49
Leyden St
Boston, MA 02128
|
1,244 sq. feet
|
1 baths 3 beds |
show details | |

|
Check over 1 million property listings on Foreclosure.com!
|
browse all offers | |||


- 282,03343.4%White alone
- 130,25020.0%Hispanic
- 128,65619.8%Black alone
- 63,3819.8%Asian alone
- 37,7865.8%Two or more races
- 6,5241.0%Other race alone
- 1,0680.2%American Indian alone
- 700.01%Native Hawaiian and Other
Pacific Islander alone
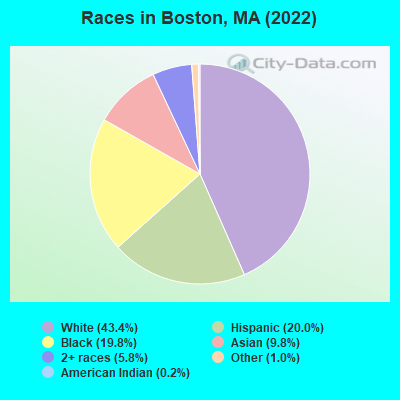
Races in Boston detailed stats: ancestries, foreign born residents, place of birth
According to our research of Massachusetts and other state lists, there were 331 registered sex offenders living in Boston, Massachusetts as of April 25, 2024.
The ratio of all residents to sex offenders in Boston is 2,033 to 1.
The ratio of registered sex offenders to all residents in this city is lower than the state average.
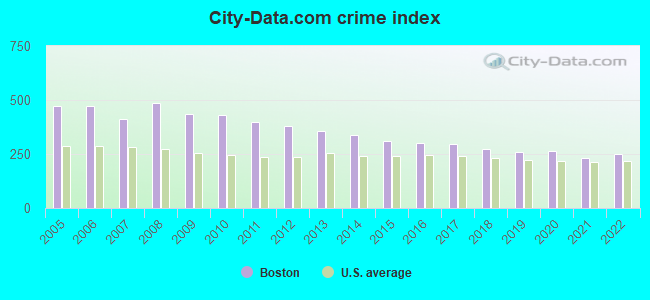
The City-Data.com crime index weighs serious crimes and violent crimes more heavily. Higher means more crime, U.S. average is 246.1. It adjusts for the number of visitors and daily workers commuting into cities.
- means the value is smaller than the state average.- means the value is about the same as the state average.
- means the value is bigger than the state average.
- means the value is much bigger than the state average.
Crime rate in Boston detailed stats: murders, rapes, robberies, assaults, burglaries, thefts, arson
Full-time law enforcement employees in 2021, including police officers: 2,716 (2,184 officers - 1,873 male; 311 female).
| Officers per 1,000 residents here: | 3.10 |
| Massachusetts average: | 2.53 |
 Recent articles from our blog. Our writers, many of them Ph.D. graduates or candidates, create easy-to-read articles on a wide variety of topics.


 | Boston (the city) Has Lost Its Allure for Me (141 replies) |
| Is it time to just give up on Boston? (104 replies) |
| "All-Inclusive Boston" campaiagn (582 replies) |
| Boston Racial Stigma- is it "cool" to hate on Boston? (632 replies) |
| Are renters trapped in Boston? (72 replies) |
| How did Boston's Population Plateau According to the Census? (109 replies) |
Latest news from Boston, MA collected exclusively by city-data.com from local newspapers, TV, and radio stations
Ancestries: Irish (8.6%), Haitian (4.8%), Italian (4.3%), Cape Verdean (3.0%), Jamaican (2.1%), American (1.9%).
Current Local Time: EST time zone
Elevation: 20 feet
Land area: 48.4 square miles.
Population density: 13,437 people per square mile (very high).
191,711 residents are foreign born (13.9% Latin America, 7.5% Asia, 3.1% Europe, 3.1% Africa).
| This city: | 29.5% |
| Massachusetts: | 17.6% |
Median real estate property taxes paid for housing units with mortgages in 2022: $4,111 (0.6%)
Median real estate property taxes paid for housing units with no mortgage in 2022: $4,881 (0.7%)
Nearest city with pop. 1,000,000+: Bronx, NY  (176.5 miles , pop. 1,332,650).
Nearest cities:
Latitude: 42.32 N, Longitude: 71.09 W
Daytime population change due to commuting: +250,426 (+38.5%)
Workers who live and work in this city: 274,607 (75.5%)
Area codes: 617, 857
Property values in Boston, MA
Detailed articles:
- Boston: Introduction
- Boston Basic Facts
- Boston: Communications
- Boston: Convention Facilities
- Boston: Economy
- Boston: Education and Research
- Boston: Geography and Climate
- Boston: Health Care
- Boston: History
- Boston: Municipal Government
- Boston: Population Profile
- Boston: Recreation
- Boston: Transportation
Boston tourist attractions:
- Boston Common: Rural Oasis in the Heart of the Big City of Boston Massachusetts
- Boston Garden: The Only Name For World Class Sports And Events In Boston, Massachussetts
- Shops at Prudential Center - Boston, MA - A number of shops in the Boston area rich in diversity
- Copley Place, Boston, MA
- General Edward Lawrence Logan International Airport - Boston MA General Edward Lawrence Logan International Airport Flights
- The New England Aquarium - Boston, Massachusetts - large aquarium with an IMAX theatre and over 20,000 animals
- XV Beacon - Beacon, MA - a hotel at 15 Beacon Street Boston, MA
- Four Seasons Hotel - Boston, MA - a luxury hotel with a number of amenities in Boston, MA
- Inter Continental Boston Hotel - Boston, MA - a luxury hotel in Boston, MA
- Ritz-Carlton Boston - Common, MA - a luxurious and full-service hotel in Boston
- Liberty Hotel - Boston, MA - a hotel in Boston, MA
- Boston Public Garden - Massachusetts - Large Park in the Heart of Boston
- Castle Island - Boston, Massachusetts - A Large Recreation Area in South Boston
- Charlestown Neighborhood - Boston, Massachusetts - Irish Influence that Still Exists Today
- Chinatown Neighborhood - Boston, Massachusetts - The Most Densely Populated Neighborhood in Boston
- Dorchester Neighborhood - Boston, Massachusetts - A Diverse Neighborhood Rich in Culture, Population and Employment
- Downtown Boston Neighborhood - Boston, Massachusetts - Expansive Neighborhood including Downtown and the Financial District
- East Boston Neighborhood - Boston, Massachusetts - Spectacular Skyline Views with Low Rental Prices
- Fenway Park - Boston, Massachusetts - More than just a Baseball Field
- Fenway/Kenmore Neighborhood - Boston, Massachusetts - Boston Neighborhood with Many Names
- Fort Point Neighborhood - Boston, Massachusetts - Named After a Colonial Times Fort
- Franklin Park Zoo - Boston, Massachusetts - Zoo with Lots of Eateries for its Patrons
- Freedom Trail - Boston, Massachusetts - Short Walking Trail Rich in Historical Significance
- Fugakyu - Boston, Massachusetts - Famous Japanese Restaurant in the heart of Boston
- Harvard Square - Boston, Massachusetts - An Entire Neighborhood that isn't just a Square
- Hyde Park Neighborhood - Boston, Massachusetts - Southern Neighborhood in Boston
- Jamaica Plain Neighborhood - Boston, Massachusetts - Puritan Founded Region Home to College Students
- John F. Kennedy Presidential Museum and Library - Boston, Massachusetts More than Just a Museum
- Leather District Neighborhood - Boston, Massachusetts - Close in Proximity and Culture as the Chinatown District
- Longwood Neighborhood - Boston, Massachusetts - Medical Research, Hospital and Academic Boston Neighborhood
- Allston-Brighton Neighborhood - Boston, Massachusetts - Historic Neighborhood Where Helen Keller Went to School
- Mattapan Neighborhood - Boston, Massachusetts - Historical Neighborhood that has underwent changes
- Mission Hill Neighborhood - Boston, Massachusetts - Historic Neighborhood Rich in Culture and Architecture
- Museum of Fine Arts - Boston, Massachusetts - One of the Best Museums in the United States
- North End Neighborhood - Boston, Massachusetts - Small but Diverse Neighborhood District
- Quabbin Reservoir - Boston, Massachusetts - Largest Body of Water in the Greater Boston Area
- Redbones - Boston, Massachusetts - Southern Style and Down Home Restaurant in Boston
- Roslindale Neighborhood - Boston, Massachusetts - Boston Neighborhood with Plentiful Transportation
- Roxbury Neighborhood - Boston, Massachusetts - One of the First Towns in the Colony
- Samuel Adams Brewery - Boston, Massachusetts - Founded on the Belief that Americans Need Better Beer
- South Boston Neighborhood - Boston, Massachusetts - Densely Populated Neighborhood in South Boston
- Atwood's Tavern - Boston, Massachusetts - Lively Sports Bar in the Heart of Cambridge
- Back Bay Neighborhood - Boston, Massachusetts - Bay with one of the Best Shopping Malls in the Area
- Bay Village Neighborhood - Boston, Massachusetts - Smallest and Least Known Neighborhood in all of Boston
- Beacon Hill Neighborhood - Boston, Massachusetts - Quaint and Desirable Neighborhood Rich in History and Uniqueness
- Boston Duck Tours - Massachusetts - Amphibious Jeep Tours for the Public
- Boston Harbor Islands National Park - Massachusetts - A National Park with 34 Islands and Campground Facilities
- Walter D. Stone Memorial Zoo - Boston, Massachusetts - small public zoo covering 26 acres
Boston, Massachusetts accommodation & food services, waste management - Economy and Business Data
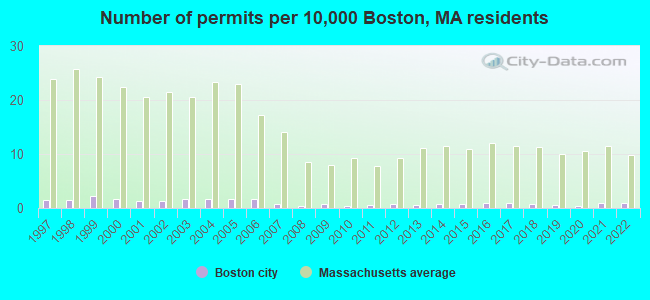
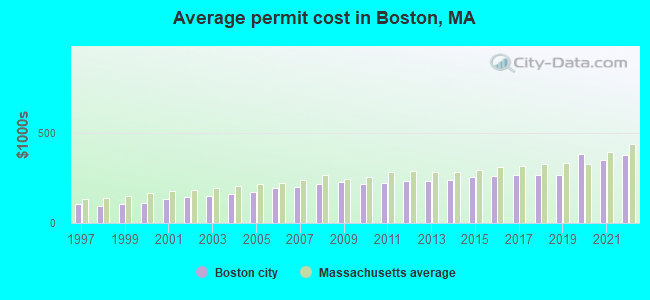
Single-family new house construction building permits:
- 2022: 53 buildings, average cost: $374,100
- 2021: 53 buildings, average cost: $350,000
- 2020: 24 buildings, average cost: $380,500
- 2019: 37 buildings, average cost: $264,000
- 2018: 49 buildings, average cost: $266,500
- 2017: 52 buildings, average cost: $264,200
- 2016: 56 buildings, average cost: $260,900
- 2015: 48 buildings, average cost: $254,600
- 2014: 48 buildings, average cost: $239,900
- 2013: 34 buildings, average cost: $233,000
- 2012: 40 buildings, average cost: $230,500
- 2011: 33 buildings, average cost: $218,700
- 2010: 23 buildings, average cost: $214,700
- 2009: 38 buildings, average cost: $224,400
- 2008: 23 buildings, average cost: $216,200
- 2007: 48 buildings, average cost: $199,900
- 2006: 94 buildings, average cost: $190,600
- 2005: 97 buildings, average cost: $173,400
- 2004: 102 buildings, average cost: $160,600
- 2003: 100 buildings, average cost: $151,900
- 2002: 71 buildings, average cost: $144,700
- 2001: 78 buildings, average cost: $134,300
- 2000: 96 buildings, average cost: $111,900
- 1999: 127 buildings, average cost: $105,800
- 1998: 88 buildings, average cost: $92,600
- 1997: 85 buildings, average cost: $105,700
| Here: | 3.2% |
| Massachusetts: | 3.5% |
Population change in the 1990s: +16,662 (+2.9%).
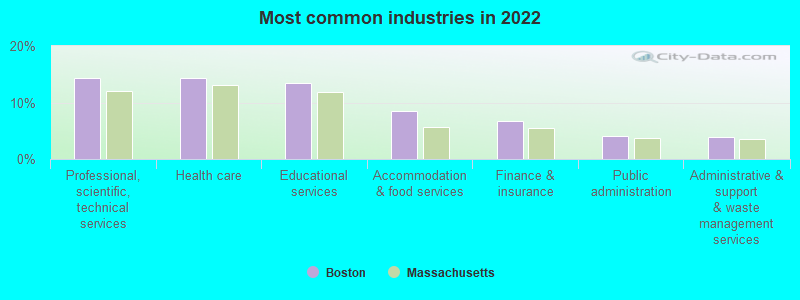
- Professional, scientific, technical services (14.4%)
- Health care (14.3%)
- Educational services (13.5%)
- Accommodation & food services (8.5%)
- Finance & insurance (6.6%)
- Public administration (4.1%)
- Administrative & support & waste management services (3.9%)
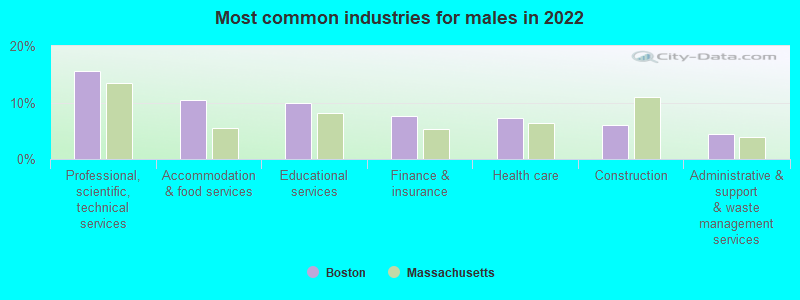
- Professional, scientific, technical services (15.6%)
- Accommodation & food services (10.4%)
- Educational services (10.0%)
- Finance & insurance (7.6%)
- Health care (7.3%)
- Construction (6.1%)
- Administrative & support & waste management services (4.5%)
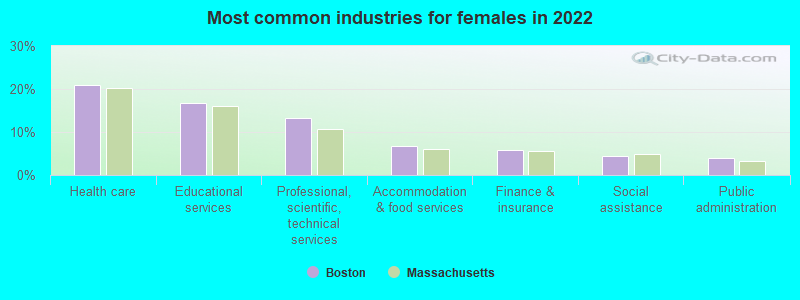
- Health care (21.0%)
- Educational services (16.8%)
- Professional, scientific, technical services (13.3%)
- Accommodation & food services (6.7%)
- Finance & insurance (5.7%)
- Social assistance (4.4%)
- Public administration (4.1%)
- Other management occupations, except farmers and farm managers (7.4%)
- Cooks and food preparation workers (5.5%)
- Computer specialists (3.9%)
- Building and grounds cleaning and maintenance occupations (2.8%)
- Life and physical scientists (2.6%)
- Counselors, social workers, and other community and social service specialists (2.5%)
- Nursing, psychiatric, and home health aides (2.3%)
- Other management occupations, except farmers and farm managers (7.6%)
- Computer specialists (6.0%)
- Cooks and food preparation workers (5.7%)
- Life and physical scientists (2.9%)
- Engineers (2.8%)
- Building and grounds cleaning and maintenance occupations (2.7%)
- Laborers and material movers, hand (2.5%)
- Other management occupations, except farmers and farm managers (7.2%)
- Cooks and food preparation workers (5.2%)
- Nursing, psychiatric, and home health aides (4.1%)
- Counselors, social workers, and other community and social service specialists (3.7%)
- Registered nurses (3.4%)
- Secretaries and administrative assistants (2.9%)
- Building and grounds cleaning and maintenance occupations (2.9%)
Average climate in Boston, Massachusetts
Based on data reported by over 4,000 weather stations


|
|

(lower is better)
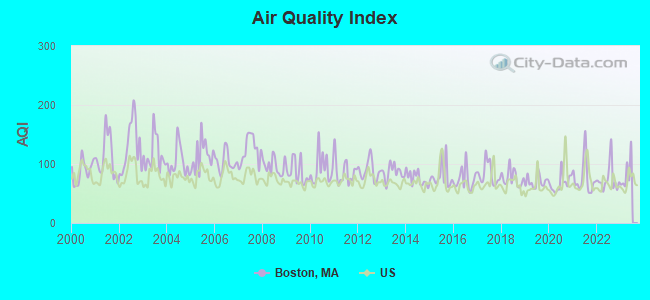
Air Quality Index (AQI) level in 2022 was 74.3. This is about average.
| City: | 74.3 |
| U.S.: | 72.6 |
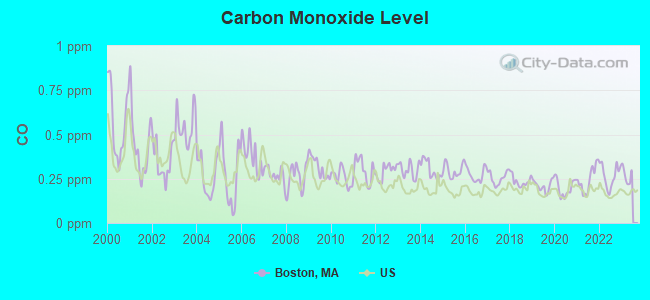
Carbon Monoxide (CO) [ppm] level in 2022 was 0.267. This is about average. Closest monitor was 0.6 miles away from the city center.
| City: | 0.267 |
| U.S.: | 0.251 |
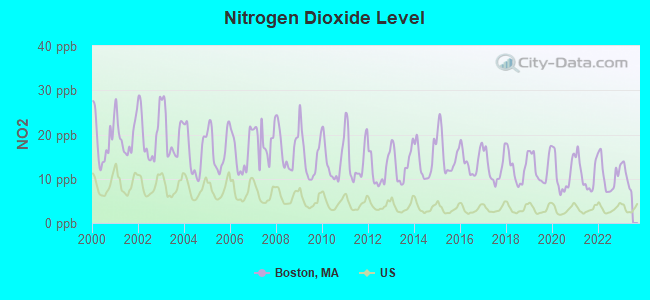
Nitrogen Dioxide (NO2) [ppb] level in 2022 was 10.6. This is significantly worse than average. Closest monitor was 0.6 miles away from the city center.
| City: | 10.6 |
| U.S.: | 5.1 |
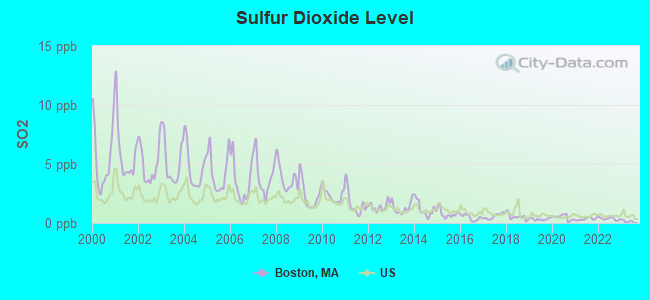
Sulfur Dioxide (SO2) [ppb] level in 2022 was 0.358. This is significantly better than average. Closest monitor was 0.6 miles away from the city center.
| City: | 0.358 |
| U.S.: | 1.515 |
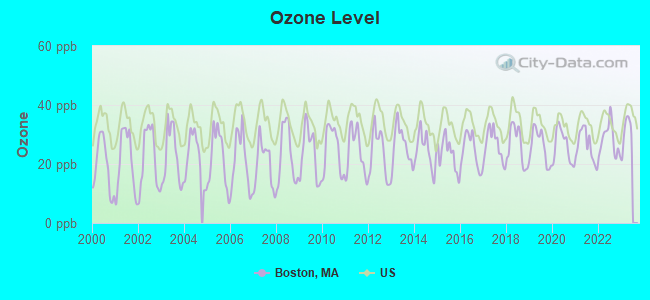
Ozone [ppb] level in 2022 was 28.2. This is about average. Closest monitor was 0.6 miles away from the city center.
| City: | 28.2 |
| U.S.: | 33.3 |
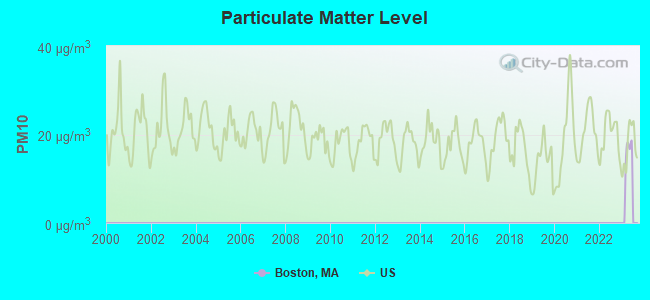
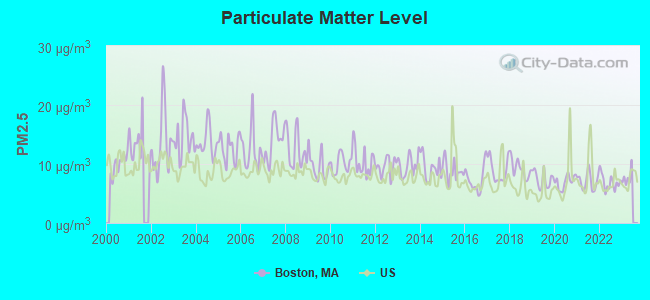
Particulate Matter (PM2.5) [µg/m3] level in 2022 was 6.91. This is about average. Closest monitor was 0.6 miles away from the city center.
| City: | 6.91 |
| U.S.: | 8.11 |
Tornado activity:
Boston-area historical tornado activity is near Massachusetts state average. It is 45% smaller than the overall U.S. average.
On 6/9/1953, a category F4 (max. wind speeds 207-260 mph) tornado 22.1 miles away from the Boston city center killed 90 people and injured 1228 people and caused between $50,000,000 and $500,000,000 in damages.
On 6/9/1953, a category F3 (max. wind speeds 158-206 mph) tornado 19.6 miles away from the city center injured 17 people and caused between $500,000 and $5,000,000 in damages.
Earthquake activity:
Boston-area historical earthquake activity is significantly above Massachusetts state average. It is 73% smaller than the overall U.S. average.On 10/7/1983 at 10:18:46, a magnitude 5.3 (5.1 MB, 5.3 LG, 5.1 ML, Class: Moderate, Intensity: VI - VII) earthquake occurred 199.2 miles away from the city center
On 4/20/2002 at 10:50:47, a magnitude 5.3 (5.3 ML, Depth: 3.0 mi) earthquake occurred 200.3 miles away from the city center
On 1/19/1982 at 00:14:42, a magnitude 4.7 (4.5 MB, 4.7 MD, 4.5 LG, Class: Light, Intensity: IV - V) earthquake occurred 85.5 miles away from the city center
On 10/16/2012 at 23:12:25, a magnitude 4.7 (4.7 ML, Depth: 10.0 mi) earthquake occurred 90.9 miles away from Boston center
On 4/20/2002 at 10:50:47, a magnitude 5.2 (5.2 MB, 4.2 MS, 5.2 MW, 5.0 MW) earthquake occurred 199.7 miles away from Boston center
On 8/22/1992 at 12:20:32, a magnitude 4.8 (4.8 MB, 3.8 MS, 4.7 LG, Depth: 6.2 mi) earthquake occurred 226.0 miles away from Boston center
Magnitude types: regional Lg-wave magnitude (LG), body-wave magnitude (MB), duration magnitude (MD), local magnitude (ML), surface-wave magnitude (MS), moment magnitude (MW)
Natural disasters:
The number of natural disasters in Suffolk County (33) is a lot greater than the US average (15).Major Disasters (Presidential) Declared: 18
Emergencies Declared: 13
Causes of natural disasters: Floods: 11, Storms: 8, Hurricanes: 7, Snowstorms: 6, Winter Storms: 5, Blizzards: 3, Snows: 3, Explosion: 1, Fire: 1, Heavy Rain: 1, Snowfall: 1, Water Main Break: 1, Wind: 1, Other: 1 (Note: some incidents may be assigned to more than one category).
Main business address for: INVESTORS FINANCIAL SERVICES CORP (INVESTMENT ADVICE), STATE STREET CORP (STATE COMMERCIAL BANKS), TERADYNE INC (INSTRUMENTS FOR MEAS & TESTING OF ELECTRICITY & ELEC SIGNALS), HANCOCK JOHN FINANCIAL SERVICES INC (LIFE INSURANCE), BOSTON CAPITAL TAX CREDIT FUND LTD PARTNERSHIP (OPERATORS OF APARTMENT BUILDINGS), CRA INTERNATIONAL, INC. (SERVICES-LEGAL SERVICES), BOSTON CAPITAL TAX CREDIT FUND III L P (OPERATORS OF APARTMENT BUILDINGS), IRON MOUNTAIN INC/PA (PUBLIC WAREHOUSING & STORAGE) and 52 other public companies.
Hospitals in Boston:
- ARBOUR HOSPITAL, THE (provides emergency services, 49 ROBINWOOD AVENUE)
- BETH ISRAEL DEACONESS MEDICAL CENTER (Voluntary non-profit - Private, provides emergency services, 330 BROOKLINE AVENUE)
- BOSTON MED CTR CORP/BOSTON CITY CAMPUS (provides emergency services, 1 BOSTON MEDICAL CENTER PLACE)
- BRIGHAM AND WOMEN'S FAULKNER HOSPITAL (Voluntary non-profit - Private, provides emergency services, 1153 CENTRE STREET)
- CARNEY HOSPITAL (Proprietary, provides emergency services, 2100 DORCHESTER AVENUE)
- ERICH LINDEMANN MENTAL HEALTH CENTER (25 STANIFORD STREET)
- LONG ISLAND HOSP (BOSTON HARBOR)
- MASSACHUSETTS EYE AND EAR INFIRMARY (Voluntary non-profit - Private, provides emergency services, 243 CHARLES STREET)
- MASSACHUSETTS MENTAL HEALTH CENTER (provides emergency services, 74 FENWOOD RD)
- NEW ENGLAND DEACONESS CAMPUS (ONE DEACONESS ROAD)
- TUFTS MEDICAL CENTER (Voluntary non-profit - Private, 800 WASHINGTON STREET)
Airports and heliports located in Boston:
- General Edward Lawrence Logan International Airport (BOS) (Runways: 6, Commercial Ops: 219,230, Air Taxi Ops: 79,030, Itinerant Ops: 26,869)
- Heliports: 6
Amtrak stations:
- BACK BAY (145 DARTMOUTH ST.) . Services: ticket office, partially wheelchair accessible, enclosed waiting area, public restrooms, public payphones, vending machines, ATM, paid short-term parking, paid long-term parking, call for car rental service, taxi stand, public transit connection.
- BOSTON (SO. STA) (ATLANTIC AVE. & SUMMER ST.) . Services: ticket office, fully wheelchair accessible, enclosed waiting area, public restrooms, public payphones, full-service food facilities and snack bar, ATM, paid short-term parking, paid long-term parking, call for car rental service, taxi stand, intercity bus service, public transit connection.
- BOSTON, NORTH STATION (126 CAUSEWAY ST.) . Services: ticket office, enclosed waiting area.
Biggest Colleges/Universities in Boston:
- Boston University (Full-time enrollment: 29,780; Location: One Silber Way; Private, not-for-profit; Website: www.bu.edu; Offers Doctor's degree)
- Northeastern University (Full-time enrollment: 27,758; Location: 360 Huntington Ave; Private, not-for-profit; Website: www.northeastern.edu; Offers Doctor's degree)
- University of Massachusetts-Boston (Full-time enrollment: 12,625; Location: 100 Morrissey Boulevard; Public; Website: www.umb.edu; Offers Doctor's degree)
- Bunker Hill Community College (Full-time enrollment: 8,814; Location: 250 New Rutherford Ave; Public; Website: www.bhcc.mass.edu)
- Suffolk University (Full-time enrollment: 6,982; Location: 8 Ashburton Place; Private, not-for-profit; Website: www.suffolk.edu; Offers Doctor's degree)
- MCPHS University (Full-time enrollment: 5,491; Location: 179 Longwood Ave; Private, not-for-profit; Website: www.mcphs.edu; Offers Doctor's degree)
- Berklee College of Music (Full-time enrollment: 4,726; Location: 1140 Boylston St; Private, not-for-profit; Website: www.berklee.edu; Offers Master's degree)
- Emerson College (Full-time enrollment: 4,657; Location: 120 Boylston Street; Private, not-for-profit; Website: www.emerson.edu; Offers Master's degree)
- Wentworth Institute of Technology (Full-time enrollment: 4,418; Location: 550 Huntington Ave; Private, not-for-profit; Website: WWW.WIT.EDU; Offers Master's degree)
- Simmons College (Full-time enrollment: 4,048; Location: 300 The Fenway; Private, not-for-profit; Website: www.simmons.edu; Offers Doctor's degree)
- Emmanuel College (Full-time enrollment: 2,287; Location: 400 The Fenway; Private, not-for-profit; Website: www.emmanuel.edu; Offers Master's degree)
- Massachusetts College of Art and Design (Full-time enrollment: 1,920; Location: 621 Huntington Ave; Public; Website: www.massart.edu; Offers Master's degree)
- Fisher College (Full-time enrollment: 1,601; Location: 118 Beacon Street; Private, not-for-profit; Website: www.fisher.edu)
- Wheelock College (Full-time enrollment: 1,462; Location: 200 Riverway; Private, not-for-profit; Website: www.wheelock.edu; Offers Master's degree)
- MGH Institute of Health Professions (Full-time enrollment: 1,260; Location: 36 1st Avenue; Private, not-for-profit; Website: www.mghihp.edu; Offers Doctor's degree)
- Bay State College (Full-time enrollment: 1,009; Location: 122 Commonwealth Avenue; Private, for-profit; Website: www.baystate.edu)
- New England College of Business and Finance (Full-time enrollment: 789; Location: 10 High St Ste 204; Private, for-profit; Website: www.necb.edu/; Offers Master's degree)
- The New England Conservatory of Music (Full-time enrollment: 730; Location: 290 Huntington Ave; Private, not-for-profit; Website: necmusic.edu; Offers Doctor's degree)
- School of the Museum of Fine Arts-Boston (Full-time enrollment: 683; Location: 230 The Fenway; Private, not-for-profit; Website: www.smfa.edu; Offers Master's degree)
- Benjamin Franklin Institute of Technology (Full-time enrollment: 559; Location: 41 Berkeley St; Private, not-for-profit; Website: www.bfit.edu/)
Biggest public high schools in Boston:
- BOSTON LATIN (Students: 2,427, Location: 78 AVE LOUIS PASTEUR, Grades: 7-12)
- QUINCY UPPER SCHOOL (Students: 488, Location: 152 ARLINGTON STREET, Grades: 6-12)
- WILLIAM MCKINLEY (Students: 449, Location: 90 WARREN AVENUE, Grades: KG-12)
- BOSTON ARTS ACADEMY (Students: 408, Location: 174 IPSWICH STREET, Grades: 9-12)
- FENWAY HIGH SCHOOL (Students: 295, Location: 174 IPSWICH STREET, Grades: 9-12)
- EDWARD M. KENNEDY ACADEMY FOR HEALTH CAREERS (HORA (Location: 360 HUNTINGTON AVENUE, Grades: 9-12, Charter school)
- MATCH CHARTER PUBLIC SCHOOL (Location: 1001 COMMONWEALTH AVENUE, Grades: PK-12, Charter school)
- CARTER DEVELOPMENTAL CENTER (Location: 396 NORTHAMPTON STREET, Grades: 7-12)
- SNOWDEN INTERNATIONAL SCHOOL AT COPLEY (Location: 150 NEWBURY STREET, Grades: 9-12)
- THE ENGLISH HIGH (Location: 144 MCBRIDE STREET, Grades: 9-12)
Private high schools in Boston:
- WINSOR SCHOOL (Students: 434, Location: 103 PILGRIM RD, Grades: 5-12, Girls only)
- BRITISH SCHOOL OF BOSTON (Students: 336, Location: 416 POND ST, Grades: PK-12)
- CATHEDRAL HIGH SCHOOL (Students: 266, Location: 74 UNION PARK ST, Grades: 7-12)
- THE NEWMAN SCHOOL (Students: 250, Location: 247 MARLBOROUGH ST, Grades: 9-12)
- BOSTON TRINITY ACADEMY (Students: 234, Location: 17 HALE ST, Grades: 6-12)
- MOUNT SAINT JOSEPH ACADEMY (Students: 191, Location: 617 CAMBRIDGE ST, Grades: 9-12, Girls only)
- BOSTON UNIVERSITY ACADEMY (Students: 160, Location: 1 UNIVERSITY RD, Grades: 9-12)
- COMMONWEALTH SCHOOL (Students: 150, Location: 151 COMMONWEALTH AVE, Grades: 9-12)
Public elementary/middle schools in Boston:
- JOSIAH QUINCY (Students: 808, Location: 885 WASHINGTON STREET, Grades: PK-5)
- BLACKSTONE (Students: 596, Location: 380 SHAWMUT AVENUE, Grades: PK-5)
- JOSEPH J HURLEY (Students: 284, Location: 70 WORCESTER STREET, Grades: PK-8)
- HELEN Y. DAVIS LEADERSHIP ACADEMY CHARTER PUBLIC S (Students: 193, Location: 23 LEONARD STREET, Grades: 6-8, Charter school)
- ELIOT ELEMENTARY (Students: 180, Location: 16 CHARTER STREET, Grades: PK-8)
- BROOKE CHARTER SCHOOL MATTAPAN (Location: 150 AMERICAN LEGION HIGHWAY, Grades: KG-8, Charter school)
- KIPP ACADEMY BOSTON CHARTER SCHOOL (Location: 384 WARREN STREET, Grades: KG-7, Charter school)
- DUDLEY STREET NEIGHBORHOOD CHARTER SCHOOL (Location: 6 SHIRLEY STREET, Grades: PK-3, Charter school)
- UP ACADEMY CHARTER SCHOOL OF DORCHESTER (Location: 35 WESTVILLE STREET, Grades: PK-6, Charter school)
Private elementary/middle schools in Boston:
- PARK STREET SCHOOL (Students: 294, Location: 67 BRIMMER ST, Grades: PK-6)
- KINGSLEY MONTESSORI SCHOOL (Students: 249, Location: 30 FAIRFIELD ST, Grades: PK-6)
- THE ADVENT SCHOOL (Students: 213, Location: 15 BRIMMER ST, Grades: PK-6)
- ST JOHN SCHOOL (Students: 206, Location: 9 MOON ST, Grades: PK-8)
- CATHEDRAL GRAMMAR SCHOOL (Students: 142, Location: 595 HARRISON AVE, Grades: PK-6)
- LEARNING PROJECT ELEMENTARY SCHOOL (Students: 117, Location: 107 MARLBOROUGH ST, Grades: KG-6)
- KIDS ARE PEOPLE ELEMENTARY SCHOOL (Students: 80, Location: 530 COMMONWEALTH AVE, Grades: PK-6)
- BOSTON CHILDREN'S SCHOOL (Students: 53, Location: 8 WHITTIER PL, Grades: PK-T1)
Library in Boston:
- BOSTON PUBLIC LIBRARY (Operating income: $39,235,856; Location: 700 BOYLSTON STREET; 8,895,168 books; 12,834 e-books; 75,125 audio materials; 125,338 video materials; 46 local licensed databases; 47 state licensed databases; 4 other licensed databases; 4,673 print serial subscriptions; 140 electronic serial subscriptions)
Points of interest:
Notable locations in Boston: John F Kennedy-University of Massachusetts Station (A), Morton Street Station (B), North Station (C), Readville Station (D), Roslindale Village Station (E), Ruggles Station (F), Bellevue Station (G), Uphams Corner Station (H), West Roxbury Station (I), Yawkey Station (J), Mystic Wharf (K), Hoosac Pier (L), Dry Dock Number One (M), Dry Dock Number Two (N), East Boston Pier Number One (O), Commonwealth Pier (P), Pier Number Four (Q), Pier Number Two (R), Center Plaza (S), Sargents Wharf (T). Display/hide their locations on the map
Shopping Centers: Legion Shopping Center (1), Copley Place Shopping Center (2), Washington Park Shopping Mall (3), Charles River Plaza Shopping Center (4), Fenway Plaza Shopping Center (5), Longwood Galleria Shopping Center (6), The Castle at Park Plaza Shopping Center (7), Bunker Hill Mall Shopping Center (8), Neponset Circle Shopping Center (9). Display/hide their locations on the map
Main business address in Boston include: INVESTORS FINANCIAL SERVICES CORP (A), STATE STREET CORP (B), TERADYNE INC (C), HANCOCK JOHN FINANCIAL SERVICES INC (D), BOSTON CAPITAL TAX CREDIT FUND LTD PARTNERSHIP (E), CRA INTERNATIONAL, INC. (F), BOSTON CAPITAL TAX CREDIT FUND III L P (G), IRON MOUNTAIN INC/PA (H). Display/hide their locations on the map
Churches in Boston include: Church of the Covenant (A), First Baptist Church (B), First Unitarian Church (C), Old South Church (D), Trinity Church (E), Society of the Holy Transfiguration Monastery Incorporated (F), The Annunciation Greek Orthodox Cathedral of New England (G), Dharmadhatu Buddhist Center (H), Saint Pauls Assembly of God Church (I). Display/hide their locations on the map
Cemeteries: Mount Benedict Cemetery (1), Saint Josephs Cemetery (2), Adath Jeshurun Cemetery (3), Saint Marys Cemetery (4), Mount Lebanon Cemetery (5), Gethsemane Cemetery (6), Saint Josephs Cemetery (7). Display/hide their locations on the map
Lakes, reservoirs, and swamps: Storrow Lagoon (A), Chandler Pond (B), Cow Island Pond (C), Back Bay Fens (D), Turtle Pond (E), Welch Pond (F), Sprague Pond (G), Willow Pond (H). Display/hide their locations on the map
Streams, rivers, and creeks: Muddy River (A), Stony Brook (B), Mother Brook (C), Charles River (D), Mystic River (E), Sawmill Brook (F). Display/hide their locations on the map
Parks in Boston include: Harriet Tubman Park (1), Haymarket Square (2), Irish Famine Memorial (3), Rogers Park (4), Gallagher Park (5), Kenmore Square (6), Lederman Field (7), Leif Erickson Statue (8), Liberty Square (9). Display/hide their locations on the map
Beaches: Orient Heights Beach (A), Savin Hill Beach (B), Carson Beach (C), Malibu Beach (D), Tenean Beach (E), L Street Beach (F). Display/hide their locations on the map
Tourist attractions: Boston Fire Museum (344 Congress Street) (1), Cat Fund (Museums; 955 Boylston Street) (2), Archives of American Art Smithsonian Institution (Museums; 87 Mount Vernon Street) (3), Boston History Center & Museum (55 Court Street) (4), Gardner Museum (2 Palace Road) (5), Boston Sparks Association (Museums; 344 Congress Street) (6), The Bostonian Society (Museums; 206 Washington St) (7), Gibson House Museum (137 Beacon Street) (8), Boston Museum of Fine Arts - Restaurant (465 Huntington Avenue) (9). Display/hide their approximate locations on the map
Hotels: Federalist Restaurant (15 Beacon Street) (1), Eco-Logical Solutions (222 Newbury Street) (2), Omni Parker Hotel (60 School Street) (3), Parker's Restaurant (60 School Street) (4), Boston Hotel Buckminster (645 Beacon Street) (5), Bello Mondo (110 Huntington Avenue) (6), Inn the of Ponte Vedra Beach Florida (73 Tremont Street) (7), Club Management of Boston (1 Avery Street) (8), Bostonian Hotel-Seasons Restaurant (North Blackstone) (9). Display/hide their approximate locations on the map
Courts: United States Government - Courts Us- Bankruptcy Court- Clerk's Office (10 Causeway Street) (1), Court Appointed Special Advocates (24 New Chardon Street) (2), Citizenship Training Group Of Boston - Juvenile Court- Girls Unit (105 Chauncy) (3), Mass Commonwealth - Environmental Protection Dept- Headquarters One Winter (1 Winter Street) (4), Interactive Worldwide Boston Court Sq (1 Boston Suite 2100) (5), Mass Commonwealth - Courts- Trial Courts- Suffolk County Probate & Family C (1 Ashburton Place) (6), Mass Commonwealth - Land Court- Tty Only (24 New Chardon) (7), Langham Court Management Ofc (26 Worcester Street) (8), Mass Commonwealth - Courts- Trial Courts- Middlesex County District Courts- Cambridge District C (48 Boylston Street) (9). Display/hide their approximate locations on the map
Birthplace of: Lucianne Goldberg - Literary agent, John McCarthy (computer scientist) - Computer scientist, Jane Alexander - Actress, Brian O'Leary - Astronaut, Jimmy Earl - Musician, Donna Loren - Actor, Stephen Lynch (politician) - Representative, Abbott Lawrence Lowell - University president, Caroline Zhang - Figure skater, Sheldon Adelson - Businessman.
Drinking water stations with addresses in Boston and their reported violations in the past:
HAIG POINT UTILITY CO (0750036) (Address: ATTN: DAUFUSKIE ISLAND UTIL CO , Serves SC, Population served: 598, Groundwater):Past monitoring violations:DAUFUSKIE ISLAND CLUB & RESORT (0750043) (Address: ATTN: DAUFUSKIE ISLAND UTIL CO , Serves SC, Population served: 217, Groundwater):
- Failure Submit IDSE/Subpart V Plan Rpt - In APR-02-2008, Contaminant: DBP STAGE 2. Follow-up actions: St Compliance achieved (FEB-24-2011)
- 3 routine major monitoring violations
Past monitoring violations:WESTBOROUGH STATE HOSPITAL (Address: 1 ASHBURTON PLACE, 15TH FLOOR , Population served: 150, Purch surface water):
- Failure Submit IDSE/Subpart V Plan Rpt - In APR-02-2008, Contaminant: DBP STAGE 2. Follow-up actions: St Compliance achieved (FEB-24-2011)
- Follow-up Or Routine LCR Tap M/R - In JAN-01-2005, Contaminant: Lead and Copper Rule. Follow-up actions: St Public Notif requested (JAN-01-2005), St Violation/Reminder Notice (JAN-01-2005), St Compliance achieved (JUN-14-2005), St Public Notif received (JUL-01-2005)
- Follow-up Or Routine LCR Tap M/R - In JAN-01-2004, Contaminant: Lead and Copper Rule. Follow-up actions: St Violation/Reminder Notice (MAR-11-2004), St Public Notif received (JUL-19-2004), St BCA signed (DEC-13-2004), St Compliance achieved (2 times from JUN-14-2005 to JUN-14-2005)
- Initial Tap Sampling for Pb and Cu - In JUL-01-2003, Contaminant: Lead and Copper Rule. Follow-up actions: St Violation/Reminder Notice (AUG-13-2003), St Public Notif received (JUL-19-2004), St BCA signed (DEC-13-2004), St Compliance achieved (JUN-14-2005)
- 2 routine major monitoring violations
Past health violations:LANCASTER WOODS CONDOMINIUMS (Population served: 120, Groundwater):
- MCL, Monthly (TCR) - In SEP-2013, Contaminant: Coliform. Follow-up actions: St AO (w/o penalty) issued (NOV-08-2013), St Compliance achieved (NOV-08-2013)
- MCL, Monthly (TCR) - In SEP-2012, Contaminant: Coliform. Follow-up actions: St AO (w/o penalty) issued (NOV-16-2012), St Compliance achieved (NOV-16-2012)
- MCL, Monthly (TCR) - In JUL-2005, Contaminant: Coliform. Follow-up actions: St AO (w/o penalty) issued (AUG-29-2005), St Compliance achieved (AUG-29-2005)
- MCL, Monthly (TCR) - In JUN-2005, Contaminant: Coliform. Follow-up actions: St AO (w/o penalty) issued (AUG-29-2005), St Compliance achieved (AUG-29-2005)
Past health violations:CENTURY MILL ESTATES (Population served: 25, Groundwater):Past monitoring violations:
- MCL, Monthly (TCR) - In OCT-2011, Contaminant: Coliform. Follow-up actions: St AO (w/o penalty) issued (FEB-08-2012), St Compliance achieved (FEB-08-2012)
- MCL, Monthly (TCR) - In JUN-2010, Contaminant: Coliform. Follow-up actions: St AO (w/o penalty) issued (AUG-17-2010), St Compliance achieved (AUG-17-2010)
- MCL, Acute (TCR) - In JUN-2010, Contaminant: Coliform. Follow-up actions: St AO (w/o penalty) issued (AUG-17-2010), St Compliance achieved (AUG-17-2010)
- MCL, Average - Between APR-2010 and JUN-2010, Contaminant: Arsenic. Follow-up actions: St AO (w/o penalty) issued (JUL-23-2010), St Compliance achieved (JUL-23-2010)
- MCL, Average - Between JAN-2010 and MAR-2010, Contaminant: Arsenic. Follow-up actions: St AO (w/o penalty) issued (JUN-04-2010), St Compliance achieved (JUL-23-2010)
- MCL, Average - Between OCT-2009 and DEC-2009, Contaminant: Arsenic. Follow-up actions: St AO (w/o penalty) issued (FEB-01-2010), St Compliance achieved (JUL-23-2010)
- 7 other older health violations
- Follow-up Or Routine LCR Tap M/R - In JUL-01-2008, Contaminant: Lead and Copper Rule. Follow-up actions: St AO (w/o penalty) issued (DEC-05-2008), St Compliance achieved (DEC-15-2009)
- Follow-up Or Routine LCR Tap M/R - In OCT-01-2007, Contaminant: Lead and Copper Rule. Follow-up actions: St AO (w/o penalty) issued (NOV-21-2007), St Compliance achieved (DEC-16-2009)
- Follow-up Or Routine LCR Tap M/R - In OCT-01-2006, Contaminant: Lead and Copper Rule. Follow-up actions: St AO (w/o penalty) issued (DEC-12-2006), St Compliance achieved (SEP-22-2009)
- 4 minor monitoring violations
- One regular monitoring violation
Past monitoring violations:
- Follow-up Or Routine LCR Tap M/R - In OCT-01-2013, Contaminant: Lead and Copper Rule. Follow-up actions: St AO (w/o penalty) issued (MAR-03-2014)
Drinking water stations with addresses in Boston that have no violations reported:
| This city: | 2.3 people |
| Massachusetts: | 2.5 people |
| This city: | 46.0% |
| Whole state: | 63.0% |
| This city: | 8.1% |
| Whole state: | 7.0% |
Likely homosexual households (counted as self-reported same-sex unmarried-partner households)
- Lesbian couples: 0.6% of all households
- Gay men: 1.0% of all households
People in group quarters in Boston in 2010:
- 33,377 people in college/university student housing
- 3,280 people in nursing facilities/skilled-nursing facilities
- 2,952 people in emergency and transitional shelters (with sleeping facilities) for people experiencing homelessness
- 2,239 people in local jails and other municipal confinement facilities
- 1,144 people in other noninstitutional facilities
- 815 people in group homes intended for adults
- 642 people in residential treatment centers for adults
- 336 people in mental (psychiatric) hospitals and psychiatric units in other hospitals
- 280 people in military ships
- 253 people in workers' group living quarters and job corps centers
- 218 people in state prisons
- 186 people in hospitals with patients who have no usual home elsewhere
- 165 people in correctional residential facilities
- 111 people in residential treatment centers for juveniles (non-correctional)
- 77 people in group homes for juveniles (non-correctional)
- 77 people in correctional facilities intended for juveniles
- 54 people in military barracks and dormitories (nondisciplinary)
- 8 people in in-patient hospice facilities
People in group quarters in Boston in 2000:
- 20,275 people in college dormitories (includes college quarters off campus)
- 3,930 people in nursing homes
- 2,980 people in other noninstitutional group quarters
- 2,171 people in local jails and other confinement facilities (including police lockups)
- 929 people in hospitals/wards and hospices for chronically ill
- 890 people in homes or halfway houses for drug/alcohol abuse
- 705 people in hospices or homes for chronically ill
- 702 people in other nonhousehold living situations
- 571 people in religious group quarters
- 418 people in mental (psychiatric) hospitals or wards
- 372 people in other group homes
- 326 people in homes for the mentally ill
- 255 people in homes for the mentally retarded
- 224 people in other hospitals or wards for chronically ill
- 209 people in orthopedic wards and institutions for the physically handicapped
- 145 people in halfway houses
- 136 people in training schools for juvenile delinquents
- 115 people in state prisons
- 97 people in military ships
- 94 people in wards in general hospitals for patients who have no usual home elsewhere
- 85 people in unknown juvenile institutions
- 79 people in military barracks, etc.
- 75 people in residential treatment centers for emotionally disturbed children
- 60 people in short-term care, detention or diagnostic centers for delinquent children
- 52 people in other types of correctional institutions
- 32 people in homes for abused, dependent, and neglected children
- 30 people in homes for the physically handicapped
- 17 people in hospitals or wards for drug/alcohol abuse
- 16 people in agriculture workers' dormitories on farms
- 13 people in schools, hospitals, or wards for the intellectually disabled
- 3 people in other workers' dormitories
Banks with most branches in Boston (2011 data):
- Bank of America, National Association: 37 branches. Info updated 2009/11/18: Bank assets: $1,451,969.3 mil, Deposits: $1,077,176.8 mil, headquarters in Charlotte, NC, positive income, 5782 total offices, Holding Company: Bank Of America Corporation
- Sovereign Bank, National Association: 23 branches. Info updated 2012/01/31: Bank assets: $78,146.9 mil, Deposits: $48,042.9 mil, headquarters in Wilmington, DE, positive income, Commercial Lending Specialization, 718 total offices, Holding Company: Banco Santander, S.A.
- RBS Citizens, National Association: 17 branches. Info updated 2007/09/19: Bank assets: $106,940.6 mil, Deposits: $75,690.2 mil, headquarters in Providence, RI, positive income, 1135 total offices, Holding Company: Uk Financial Investments Limited
- Citibank, National Association: 9 branches. Info updated 2012/01/10: Bank assets: $1,288,658.0 mil, Deposits: $882,541.0 mil, headquarters in Sioux Falls, SD, positive income, International Specialization, 1048 total offices, Holding Company: Citigroup Inc.
- East Boston Savings Bank: Bennington Street Branch, Orient Heights Branch, Mt. Washington Bank Branch, at 10 Meridian Street, Roxbury-Highland Branch. Info updated 2011/06/07: Bank assets: $1,946.5 mil, Deposits: $1,609.3 mil, local headquarters, positive income, Commercial Lending Specialization, 24 total offices, Holding Company: Meridian Financial Services, Inc
- Century Bank and Trust Company: Federal Street Branch, Hotel Commonwealth Branch, State Street Boston Branch, Allston/Brighton Branch, North End Branch. Info updated 2010/05/27: Bank assets: $2,740.5 mil, Deposits: $2,148.1 mil, headquarters in Somerville, MA, positive income, Mortgage Lending Specialization, 25 total offices, Holding Company: Century Bancorp, Inc.
- Boston Private Bank & Trust Company: Prudential Center Branch, Back Bay Branch, Seaport Boulevard Branch, at Ten Post Office Square. Info updated 2011/06/08: Bank assets: $5,848.9 mil, Deposits: $4,643.9 mil, local headquarters, positive income, Commercial Lending Specialization, 24 total offices, Holding Company: Boston Private Financial Holdings, Inc.
- TD Bank, National Association: Broad Street Branch, Boylston Street Branch, Boston Winter Street Branch, Boston Branch. Info updated 2010/10/04: Bank assets: $188,912.6 mil, Deposits: $153,149.8 mil, headquarters in Wilmington, DE, positive income, 1314 total offices, Holding Company: Toronto-Dominion Bank, The
- People's United Bank: Post Office Square Branch, Boston Branch, Prudential Mall Branch, Milk Street Branch. Info updated 2012/02/16: Bank assets: $27,319.3 mil, Deposits: $20,835.4 mil, headquarters in Bridgeport, CT, positive income, Commercial Lending Specialization, 374 total offices
- 28 other banks with 38 local branches
For population 15 years and over in Boston:
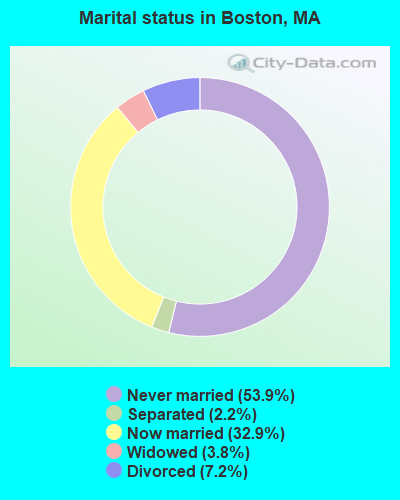
- Never married: 53.9%
- Now married: 32.9%
- Separated: 2.2%
- Widowed: 3.8%
- Divorced: 7.2%
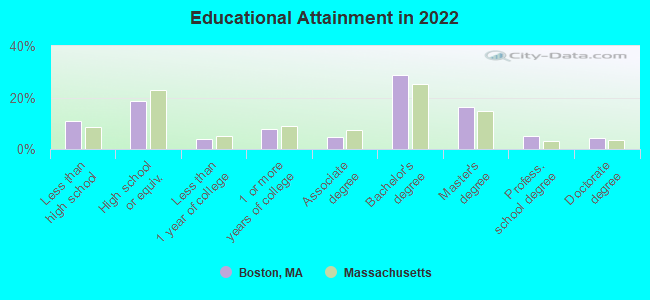
For population 25 years and over in Boston:
- High school or higher: 89.1%
- Bachelor's degree or higher: 54.2%
- Graduate or professional degree: 25.4%
- Unemployed: 4.4%
- Mean travel time to work (commute): 24.1 minutes
| Here: | 14.3 |
| Massachusetts average: | 13.0 |


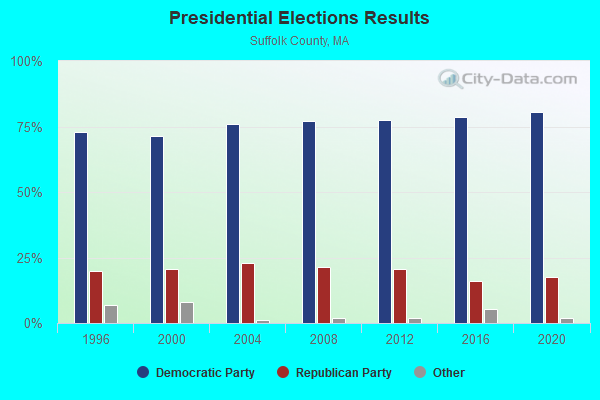
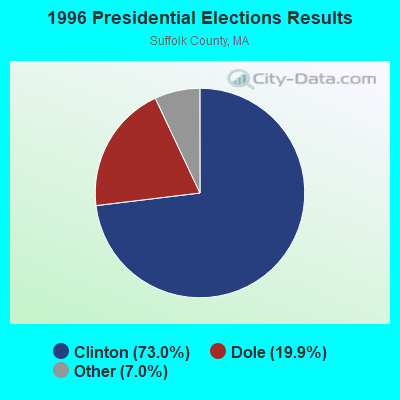
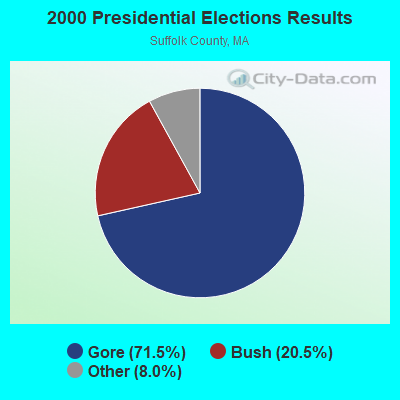
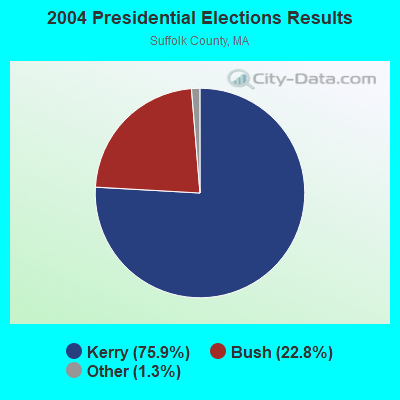
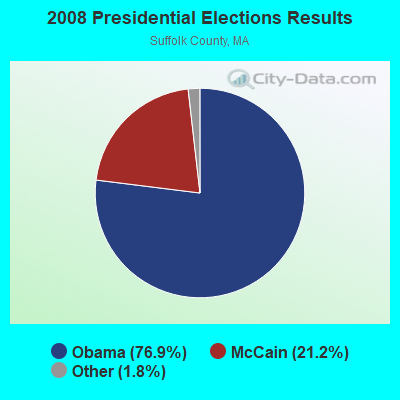
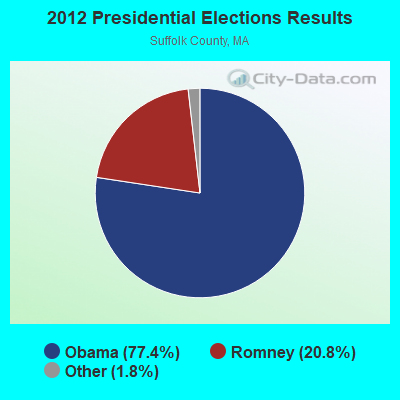
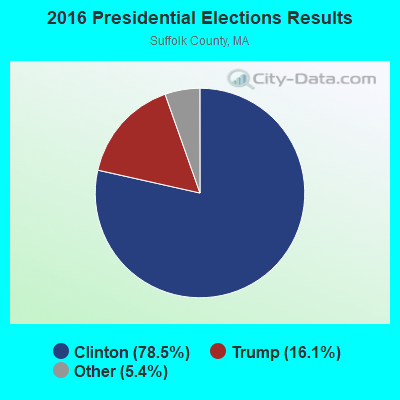
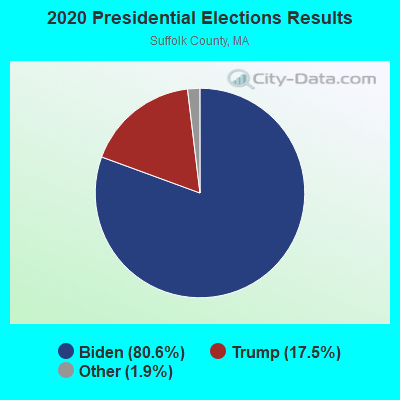
Graphs represent county-level data. Detailed 2008 Election Results
Neighborhoods in Boston:
(Boston, Massachusetts Neighborhood Map)- Airport (Jeffries Point) neighborhood
- Ashmont neighborhood
- Back Bay neighborhood
- Back Of The Hill (RTH) neighborhood
- Beacon Hill neighborhood
- Boston Common neighborhood
- Bowdoin North (Mt Bowdoin) neighborhood
- Brunswick King (Dudley) neighborhood
- Chinatown (Bay Village) neighborhood
- City Point neighborhood
- Codman Sq (East Codman Hill) neighborhood
- Columbia Point (Columbia Pt) neighborhood
- Columbus Park (Andrew Square) neighborhood
- Dorchester neighborhood
- Downtown (West End) neighborhood
- Downtown Crossing neighborhood
- Dudley Square neighborhood
- Eagle Hill neighborhood
- East Boston neighborhood
- East Lower Mills (Cedar Grove) neighborhood
- Fenway (Kenmore Square) neighborhood
- Fields Corner East neighborhood
- Fields Corner West neighborhood
- Financial District neighborhood
- Fort Point neighborhood
- Four Corners neighborhood
- Franklin Field South neighborhood
- Government Center neighborhood
- Harbor Islands neighborhood
- Harbor View (Orient Heights) neighborhood
- Highland Park neighborhood
- Kenmore neighborhood
- Leather District neighborhood
- Longwood (LMA) neighborhood
- Lower Roxbury neighborhood
- Maverick Sq neighborhood
- Medical Center Area neighborhood
- Meeting Housing Hill neighborhood
- Mission Hill neighborhood
- Mission Hill Projects neighborhood
- Neponset (Port Norfolk) neighborhood
- North Dorchester neighborhood
- Point Shirley (Deer Island) neighborhood
- Prudential (The Pru) neighborhood
- Roxbury neighborhood
- Sav-mor neighborhood
- South Boston neighborhood
- South End neighborhood
- St. Marks neighborhood
- Telegraph Hill neighborhood
- Theatre District neighborhood
- Uphams Corner (Jones Hill) neighborhood
- Washington Park neighborhood
- Waterfront (North End) neighborhood
- West Broadway (D Street) neighborhood
- West Fens neighborhood
- West Lower Mills (W. Codman Hill) neighborhood
Religion statistics for Boston, MA (based on Suffolk County data)
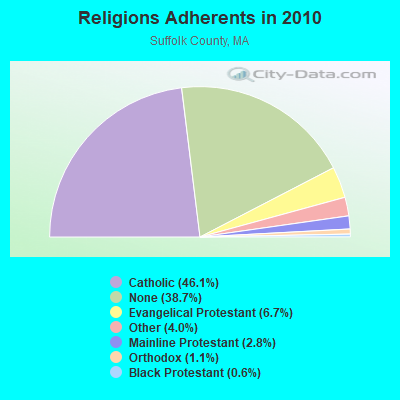
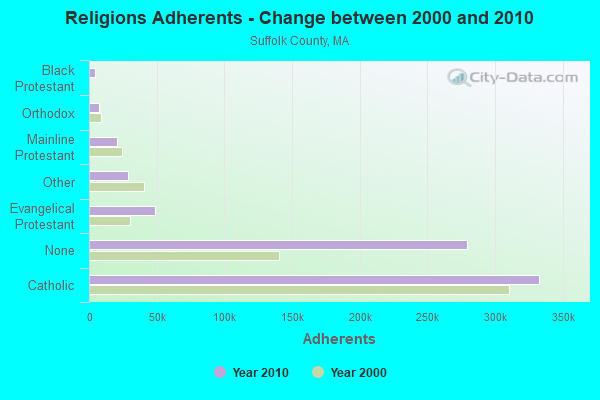
| Religion | Adherents | Congregations |
|---|---|---|
| Catholic | 332,744 | 56 |
| Evangelical Protestant | 48,562 | 180 |
| Other | 29,094 | 71 |
| Mainline Protestant | 20,380 | 103 |
| Orthodox | 7,693 | 17 |
| Black Protestant | 4,176 | 23 |
| None | 279,374 | - |
Food Environment Statistics:
| Here: | 2.47 / 10,000 pop. |
| Massachusetts: | 1.98 / 10,000 pop. |
| Suffolk County: | 3.29 / 10,000 pop. |
| Massachusetts: | 2.22 / 10,000 pop. |
| This county: | 0.74 / 10,000 pop. |
| State: | 1.77 / 10,000 pop. |
| This county: | 10.53 / 10,000 pop. |
| State: | 8.76 / 10,000 pop. |
| Here: | 8.0% |
| State: | 8.1% |
| This county: | 21.4% |
| Massachusetts: | 22.5% |
| Here: | 17.1% |
| State: | 16.5% |
Health and Nutrition:
| Here: | 50.0% |
| State: | 50.5% |
| This city: | 49.0% |
| State: | 48.0% |
| Boston: | 28.3 |
| Massachusetts: | 28.4 |
| Boston: | 18.8% |
| State: | 20.7% |
| Boston: | 11.3% |
| Massachusetts: | 10.4% |
| This city: | 6.8 |
| State: | 6.8 |
| This city: | 31.0% |
| Massachusetts: | 33.4% |
| Boston: | 58.1% |
| Massachusetts: | 57.1% |
| Boston: | 82.4% |
| Massachusetts: | 79.2% |
More about Health and Nutrition of Boston, MA Residents
| Local government employment and payroll (March 2022) | |||||
| Function | Full-time employees | Monthly full-time payroll | Average yearly full-time wage | Part-time employees | Monthly part-time payroll |
|---|---|---|---|---|---|
| Elementary and Secondary - Instruction | 7,762 | $63,232,979 | $97,758 | 803 | $4,166,891 |
| Elementary and Secondary - Other Total | 2,755 | $14,900,836 | $64,904 | 41 | $180,483 |
| Police Protection - Officers | 2,101 | $29,113,805 | $166,285 | 0 | $0 |
| Firefighters | 1,533 | $19,070,000 | $149,276 | 0 | $0 |
| Health | 1,267 | $8,981,017 | $85,061 | 126 | $333,653 |
| Other and Unallocable | 592 | $4,287,092 | $86,901 | 1,039 | $621,346 |
| Police - Other | 536 | $2,965,854 | $66,400 | 167 | $202,581 |
| Parks and Recreation | 517 | $3,106,094 | $72,095 | 25 | $17,073 |
| Streets and Highways | 447 | $2,608,883 | $70,037 | 6 | $9,975 |
| Local Libraries | 395 | $3,506,853 | $106,537 | 34 | $32,236 |
| Housing and Community Development (Local) | 356 | $2,098,635 | $70,741 | 102 | $106,470 |
| Other Government Administration | 335 | $2,253,056 | $80,706 | 18 | $39,140 |
| Financial Administration | 326 | $2,580,839 | $95,000 | 1 | $5,208 |
| Sewerage | 275 | $1,894,338 | $82,662 | 0 | $0 |
| Water Supply | 222 | $1,549,911 | $83,779 | 0 | $0 |
| Solid Waste Management | 175 | $805,356 | $55,224 | 0 | $0 |
| Fire - Other | 152 | $1,536,982 | $121,341 | 0 | $0 |
| Welfare | 73 | $385,994 | $63,451 | 36 | $7,940 |
| Judicial and Legal | 61 | $461,063 | $90,701 | 0 | $0 |
| Totals for Government | 19,880 | $165,339,584 | $99,803 | 2,398 | $5,722,996 |
Boston government finances - Expenditure in 2021 (per resident):
- Construction - General - Other: $113,616,000 ($174.60)
Parks and Recreation: $94,347,000 ($144.99)
Elementary and Secondary Education: $78,438,000 ($120.54)
Regular Highways: $62,452,000 ($95.98)
Health - Other: $26,956,000 ($41.43)
Sewerage: $26,256,000 ($40.35)
Water Utilities: $24,237,000 ($37.25)
Libraries: $20,217,000 ($31.07)
Housing and Community Development: $15,196,000 ($23.35)
General Public Buildings: $9,608,000 ($14.77)
Police Protection: $6,739,000 ($10.36)
- Current Operations - Elementary and Secondary Education: $1,648,789,000 ($2533.85)
General - Other: $441,754,000 ($678.88)
Police Protection: $430,077,000 ($660.94)
Hospitals: $323,504,000 ($497.16)
Local Fire Protection: $268,960,000 ($413.34)
Housing and Community Development: $104,463,000 ($160.54)
Solid Waste Management: $96,003,000 ($147.54)
Financial Administration: $66,356,000 ($101.98)
Regular Highways: $62,645,000 ($96.27)
Libraries: $43,910,000 ($67.48)
Sewerage: $38,624,000 ($59.36)
Water Utilities: $35,653,000 ($54.79)
Parks and Recreation: $35,485,000 ($54.53)
General Public Buildings: $33,834,000 ($52.00)
Central Staff Services: $23,513,000 ($36.13)
Protective Inspection and Regulation - Other: $21,417,000 ($32.91)
Judicial and Legal Services: $7,503,000 ($11.53)
Public Welfare - Other: $5,252,000 ($8.07)
Natural Resources - Other: $3,138,000 ($4.82)
Miscellaneous Commercial Activities - Other: $2,555,000 ($3.93)
Parking Facilities: $2,288,000 ($3.52)
- General - Interest on Debt: $70,270,000 ($107.99)
- Intergovernmental to Local - Other - Elementary and Secondary Education: $5,711,000 ($8.78)
Other - Correctional Institutions: $3,846,000 ($5.91)
Other - Health - Other: $586,000 ($0.90)
Other - Central Staff Services: $372,000 ($0.57)
- Intergovernmental to State - Sewerage: $145,901,000 ($224.22)
Water Utilities: $95,459,000 ($146.70)
Transit Utilities: $93,357,000 ($143.47)
- Other Capital Outlay - General - Other: $77,540,000 ($119.16)
Elementary and Secondary Education: $18,391,000 ($28.26)
Hospitals: $3,138,000 ($4.82)
Police Protection: $1,922,000 ($2.95)
Sewerage: $1,763,000 ($2.71)
Water Utilities: $1,674,000 ($2.57)
Parks and Recreation: $1,441,000 ($2.21)
General Public Building: $1,441,000 ($2.21)
Regular Highways: $437,000 ($0.67)
- Total Salaries and Wages: $871,040,000 ($1338.61)
Boston government finances - Revenue in 2021 (per resident):
- Charges - Sewerage: $212,281,000 ($326.23)
Hospital Public: $37,832,000 ($58.14)
Housing and Community Development: $18,564,000 ($28.53)
Other: $18,068,000 ($27.77)
Elementary and Secondary Education School Lunch: $7,748,000 ($11.91)
Parking Facilities: $1,518,000 ($2.33)
Miscellaneous Commercial Activities: $13,000 ($0.02)
- Federal Intergovernmental - Housing and Community Development: $87,166,000 ($133.96)
Education: $1,559,000 ($2.40)
Sewerage: $998,000 ($1.53)
Water Utilities: $922,000 ($1.42)
- Local Intergovernmental - Education: $2,117,000 ($3.25)
- Miscellaneous - General Revenue - Other: $109,043,000 ($167.58)
Rents: $57,567,000 ($88.47)
Fines and Forfeits: $52,153,000 ($80.15)
Interest Earnings: $32,220,000 ($49.52)
Donations From Private Sources: $23,449,000 ($36.04)
Sale of Property: $10,630,000 ($16.34)
- Revenue - Water Utilities: $156,682,000 ($240.79)
- State Intergovernmental - Education: $365,460,000 ($561.64)
General Local Government Support: $347,906,000 ($534.66)
Other: $133,819,000 ($205.65)
Public Welfare: $88,094,000 ($135.38)
Housing and Community Development: $52,971,000 ($81.41)
Highways: $16,199,000 ($24.89)
Sewerage: $333,000 ($0.51)
Water Utilities: $307,000 ($0.47)
- Tax - Property: $2,740,843,000 ($4212.11)
Other License: $87,765,000 ($134.88)
Other Selective Sales: $40,746,000 ($62.62)
Public Utility License: $5,783,000 ($8.89)
Alcoholic Beverage License: $4,346,000 ($6.68)
Amusements License: $969,000 ($1.49)
Occupation and Business License - Other: $508,000 ($0.78)
Boston government finances - Debt in 2021 (per resident):
- Long Term Debt - Outstanding Unspecified Public Purpose: $1,816,671,000 ($2791.85)
Beginning Outstanding - Unspecified Public Purpose: $1,791,471,000 ($2753.12)
Issue, Unspecified Public Purpose: $279,424,000 ($429.42)
Retired Unspecified Public Purpose: $254,224,000 ($390.69)
- Short Term Debt Outstanding - End of Fiscal Year: $50,000,000 ($76.84)
Beginning: $20,000,000 ($30.74)
Boston government finances - Cash and Securities in 2021 (per resident):
- Bond Funds - Cash and Securities: $154,780,000 ($237.86)
- Other Funds - Cash and Securities: $2,480,211,000 ($3811.57)
- Sinking Funds - Cash and Securities: $252,401,000 ($387.89)
9.75% of this county's 2021 resident taxpayers lived in other counties in 2020 ($100,939 average adjusted gross income)
| Here: | 9.75% |
| Massachusetts average: | 6.35% |
0.01% of residents moved from foreign countries ($81 average AGI)
Suffolk County: 0.01% Massachusetts average: 0.01%
Top counties from which taxpayers relocated into this county between 2020 and 2021:
| from Middlesex County, MA | |
| from Norfolk County, MA | |
| from Essex County, MA |
13.75% of this county's 2020 resident taxpayers moved to other counties in 2021 ($123,761 average adjusted gross income)
| Here: | 13.75% |
| Massachusetts average: | 7.18% |
0.03% of residents moved to foreign countries ($317 average AGI)
Suffolk County: 0.03% Massachusetts average: 0.02%
Top counties to which taxpayers relocated from this county between 2020 and 2021:
| to Middlesex County, MA | |
| to Norfolk County, MA | |
| to Essex County, MA |
| Businesses in Boston, MA | ||||
| Name | Count | Name | Count | |
|---|---|---|---|---|
| 7-Eleven | 20 | JoS. A. Bank | 2 | |
| ALDO | 3 | Jones New York | 5 | |
| AT&T | 3 | Juicy Couture | 1 | |
| Abercrombie & Fitch | 1 | LensCrafters | 1 | |
| Ace Hardware | 1 | Levi Strauss & Co. | 1 | |
| American Eagle Outfitters | 2 | Macy's | 1 | |
| Ann Taylor | 4 | Marriott | 9 | |
| Apple Store | 1 | Marshalls | 2 | |
| Applebee's | 1 | MasterBrand Cabinets | 7 | |
| BMW | 1 | McDonald's | 17 | |
| Bally Total Fitness | 1 | Men's Wearhouse | 2 | |
| Banana Republic | 3 | Motherhood Maternity | 2 | |
| Barnes & Noble | 1 | New Balance | 10 | |
| Bath & Body Works | 2 | Nike | 35 | |
| Bebe | 1 | Old Navy | 1 | |
| Bed Bath & Beyond | 1 | Panda Express | 3 | |
| Ben & Jerry's | 5 | Panera Bread | 3 | |
| Best Western | 3 | Papa John's Pizza | 1 | |
| Blockbuster | 1 | Payless | 1 | |
| Brooks Brothers | 2 | Popeyes | 1 | |
| Brookstone | 3 | Qdoba Mexican Grill | 7 | |
| Burger King | 6 | Quiznos | 3 | |
| CVS | 16 | RadioShack | 6 | |
| Cache | 1 | Ramada | 1 | |
| Chico's | 1 | Rite Aid | 3 | |
| Chipotle | 2 | Ryder Rental & Truck Leasing | 1 | |
| Clarks | 1 | Saks Fifth Avenue | 1 | |
| Cold Stone Creamery | 2 | Sephora | 1 | |
| Comfort Inn | 1 | Shaw's | 3 | |
| Crate & Barrel | 1 | Sheraton | 1 | |
| Curves | 1 | Skechers USA | 1 | |
| DHL | 2 | Sprint Nextel | 4 | |
| Dairy Queen | 1 | Staples | 2 | |
| Decora Cabinetry | 2 | Starbucks | 43 | |
| Domino's Pizza | 3 | Stop & Shop | 1 | |
| Dunkin Donuts | 58 | Subway | 19 | |
| Eddie Bauer | 1 | T-Mobile | 12 | |
| Express | 1 | T.G.I. Driday's | 1 | |
| Famous Footwear | 1 | T.J.Maxx | 1 | |
| FedEx | 87 | Talbots | 1 | |
| Firestone Complete Auto Care | 1 | The Cheesecake Factory | 1 | |
| Foot Locker | 2 | Toyota | 2 | |
| Forever 21 | 1 | Toys"R"Us | 1 | |
| GNC | 4 | Trader Joe's | 1 | |
| GameStop | 2 | True Value | 3 | |
| Gap | 2 | U-Haul | 1 | |
| H&M | 2 | UPS | 104 | |
| H&R Block | 5 | Urban Outfitters | 2 | |
| Haworth | 2 | Vans | 16 | |
| Hilton | 11 | Verizon Wireless | 3 | |
| Holiday Inn | 3 | Victoria's Secret | 2 | |
| Home Depot | 1 | Walgreens | 4 | |
| Honda | 2 | Wendy's | 5 | |
| Howard Johnson | 2 | Westin | 2 | |
| Hyatt | 4 | Wet Seal | 1 | |
| J. Jill | 1 | Whole Foods Market | 2 | |
| J.Crew | 2 | YMCA | 8 | |
| Jamba Juice | 2 | |||
Strongest AM radio stations in Boston:
- WWZN (1510 AM; 50 kW; BOSTON, MA; Owner: ROSE CITY RADIO CORPORATION)
- WEEI (850 AM; 50 kW; BOSTON, MA; Owner: ENTERCOM BOSTON LICENSE, LLC)
- WUNR (1600 AM; 20 kW; BROOKLINE, MA; Owner: CHAMPION BROADCASTING SYSTEMS, INC.)
- WRKO (680 AM; 50 kW; BOSTON, MA; Owner: ENTERCOM BOSTON LICENSE, LLC)
- WBZ (1030 AM; 50 kW; BOSTON, MA; Owner: INFINITY BROADCASTING OPERATIONS, INC.)
- WMKI (1260 AM; 5 kW; BOSTON, MA; Owner: ABC, INC.)
- WRCA (1330 AM; 25 kW; WALTHAM, MA; Owner: WRCA LICENSE, LLC)
- WEZE (590 AM; 5 kW; BOSTON, MA; Owner: NEW ENGLAND CONTINENTAL MEDIA, INC.)
- WKOX (1200 AM; 50 kW; FRAMINGHAM, MA; Owner: CAPSTAR TX LIMITED PARTNERSHIP)
- WBIX (1060 AM; 40 kW; NATICK, MA; Owner: LANGER BROADCASTING CORPORATION)
- WILD (1090 AM; daytime; 5 kW; BOSTON, MA; Owner: RADIO ONE OF BOSTON LICENSES, LLC)
- WXKS (1430 AM; 5 kW; EVERETT, MA; Owner: AMFM RADIO LICENSES, L.L.C.)
- WNTN (1550 AM; 10 kW; NEWTON, MA; Owner: COLT COMMUNICATIONS, LLC)
Strongest FM radio stations in Boston:
- WXKS-FM (107.9 FM; MEDFORD, MA; Owner: AMFM RADIO LICENSES, L.L.C.)
- WMJX (106.7 FM; BOSTON, MA; Owner: GREATER BOSTON RADIO, INC.)
- WBCN (104.1 FM; BOSTON, MA; Owner: HEMISPHERE BROADCASTING CORPORATION)
- WZLX (100.7 FM; BOSTON, MA; Owner: INFINITY BROADCASTING CORPORATION OF BOSTON)
- WERS (88.9 FM; BOSTON, MA; Owner: EMERSON COLLEGE)
- W267AI (101.3 FM; BOSTON, MA; Owner: MCC BROADCASTING COMPANY, INC.)
- WHRB (95.3 FM; CAMBRIDGE, MA; Owner: HARVARD RADIO BROADCASTING CO., INC.)
- WBOS (92.9 FM; BROOKLINE, MA; Owner: GREATER BOSTON RADIO, INC.)
- WBMX (98.5 FM; BOSTON, MA; Owner: INFINITY RADIO OPERATIONS INC.)
- WJMN (94.5 FM; BOSTON, MA; Owner: AMFM RADIO LICENSES, L.L.C.)
- WCRB (102.5 FM; WALTHAM, MA; Owner: CHARLES RIVER BROADCASTING WCRB LICE)
- WTKK (96.9 FM; BOSTON, MA; Owner: GREATER BOSTON RADIO, INC.)
- WROR-FM (105.7 FM; FRAMINGHAM, MA; Owner: GREATER BOSTON RADIO, INC.)
- WMBR (88.1 FM; CAMBRIDGE, MA; Owner: TECHNOLOGY BROADCASTING CORPORATION)
- WBUR-FM (90.9 FM; BOSTON, MA; Owner: TRUSTEES OF BOSTON UNIVERSITY)
- WRBB (104.9 FM; BOSTON, MA; Owner: NORTHEASTERN UNIVERSITY)
- WGBH (89.7 FM; BOSTON, MA; Owner: WGBH EDUCATIONAL FOUNDATION)
- WODS (103.3 FM; BOSTON, MA; Owner: INFINITY BROADCASTING OPERATIONS, INC.)
- WFNX (101.7 FM; LYNN, MA; Owner: MCC BROADCASTING COMPANY, INC.)
- WZBC (90.3 FM; NEWTON, MA; Owner: TRUSTEES OF BOSTON COLLEGE)
TV broadcast stations around Boston:
- WBPX (Channel 68; BOSTON, MA; Owner: PAXSON BOSTON-68 LICENSE, INC.)
- WTMU-LP (Channel 32; BOSTON, MA; Owner: ZGS BOSTON, INC.)
- WCEA-LP (Channel 58; BOSTON, MA; Owner: CHANNEL 19 TV CORPORATION)
- WCVB-TV (Channel 5; BOSTON, MA; Owner: WCVB HEARST-ARGYLE TV, INC.)
- WHDH-TV (Channel 7; BOSTON, MA; Owner: WHDH-TV)
- WGBH-TV (Channel 2; BOSTON, MA; Owner: WGBH EDUCATIONAL FOUNDATION)
- WSBK-TV (Channel 38; BOSTON, MA; Owner: VIACOM INC.)
- WLVI-TV (Channel 56; CAMBRIDGE, MA; Owner: WLVI, INC.)
- WMFP (Channel 62; LAWRENCE, MA; Owner: WSAH LICENSE, INC.)
- WFXT (Channel 25; BOSTON, MA; Owner: FOX TELEVISION STATIONS INC.)
- WBZ-TV (Channel 4; BOSTON, MA; Owner: VIACOM INC.)
- WGBX-TV (Channel 44; BOSTON, MA; Owner: WGBH EDUCATIONAL FOUNDATION)
- W40BO (Channel 40; BOSTON, MA; Owner: PAXSON COMMUNICATIONS LPTV, INC.)
- WUTF (Channel 66; MARLBOROUGH, MA; Owner: TELEFUTURA BOSTON LLC)
- WWDP (Channel 46; NORWELL, MA; Owner: NORWELL TELEVISION, LLC)
- WUNI (Channel 27; WORCESTER, MA; Owner: ENTRAVISION HOLDINGS, LLC)
- WFXZ-CA (Channel 24; BOSTON, MA; Owner: BOSTON BROADCASTING CORP.)
- WLNE-TV (Channel 6; NEW BEDFORD, MA; Owner: FREEDOM BROADCASTING OF SOUTHERN NEW ENGLAND, INC.)
- WPRI-TV (Channel 12; PROVIDENCE, RI; Owner: TVL BROADCASTING OF RHODE ISLAND, LLC)
- WNAC-TV (Channel 64; PROVIDENCE, RI; Owner: WNAC, LLC)
- WJAR (Channel 10; PROVIDENCE, RI; Owner: OUTLET BROADCASTING, INC.)
- WSBE-TV (Channel 36; PROVIDENCE, RI; Owner: RHODE ISLAND PUBLIC TELECOM. AUTHORITY)
Medal of Honor Recipients
Medal of Honor Recipients born in Boston: Alexander Bradley, Anthony J. Carson, Charles W. Turner, Daniel McKlNley, David A. Matthews, David John Scannell, Edward H. Gibson, Francis Kelly, Frank Elmer Smith, Frederick C. Anderson, Frederick C. Murphy, Frederick S. Neilon, Freeman Gill, George F. Phillips, George H. Nee, George Willis, Harry Garland, James Brady, James Horton, James Lowthers, James Seanor, John Andrew Iii Barnes, John H. Brown, John H. James, John Haddoo, John J. Iii McGinty, John McFarland, John Smith, Joseph Francis Scott, Joseph H. De Castro, Joseph Timothy O'Callahan, Levi B. Gaylord, Lewis J. Ingalls, Michael Connolly, Michael Dawson, Michael J. Perkins, Nathaniel M. Allen, Oliver O'Brien, Richard P. Hanley, Thomas G. Kelley, Thomas H. L. Payne, Thomas Harcourt, Thomas Smith, West Funk, William B. Lewis, William B. Turner, William Bond, William Moore, William Osborne, William Parker, William Sadler, William Sweeney, William Troy.
- National Bridge Inventory (NBI) Statistics
- 512Number of bridges
- 17,096ft / 5,211mTotal length
- $5,123,900,000Total costs
- 17,600,901Total average daily traffic
- 1,129,958Total average daily truck traffic
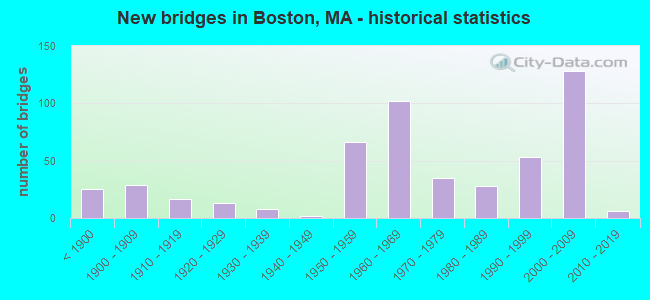
- New bridges - historical statistics
- 25Before 1900
- 291900-1909
- 171910-1919
- 131920-1929
- 81930-1939
- 21940-1949
- 661950-1959
- 1021960-1969
- 351970-1979
- 281980-1989
- 531990-1999
- 1282000-2009
- 62010-2019
FCC Registered Commercial Land Mobile Towers: 27 (See the full list of FCC Registered Commercial Land Mobile Towers in Boston, MA)
FCC Registered Private Land Mobile Towers: 45 (See the full list of FCC Registered Private Land Mobile Towers)
FCC Registered Broadcast Land Mobile Towers: 410 (See the full list of FCC Registered Broadcast Land Mobile Towers)
FCC Registered Microwave Towers: 1,001 (See the full list of FCC Registered Microwave Towers in this town)
FCC Registered Paging Towers: 64 (See the full list of FCC Registered Paging Towers)
FCC Registered Maritime Coast & Aviation Ground Towers: 112 (See the full list of FCC Registered Maritime Coast & Aviation Ground Towers)
FCC Registered Amateur Radio Licenses: 487 (See the full list of FCC Registered Amateur Radio Licenses in Boston)
FAA Registered Aircraft Manufacturers and Dealers: 4 (See the full list of FAA Registered Manufacturers and Dealers in Boston)
FAA Registered Aircraft: 224 (See the full list of FAA Registered Aircraft)
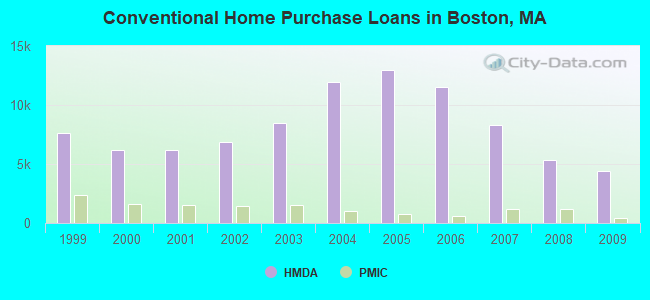
| Home Mortgage Disclosure Act Aggregated Statistics For Year 2009 (Based on 154 full tracts) | ||||||||||||||
| A) FHA, FSA/RHS & VA Home Purchase Loans | B) Conventional Home Purchase Loans | C) Refinancings | D) Home Improvement Loans | E) Loans on Dwellings For 5+ Families | F) Non-occupant Loans on < 5 Family Dwellings (A B C & D) | G) Loans On Manufactured Home Dwelling (A B C & D) | ||||||||
|---|---|---|---|---|---|---|---|---|---|---|---|---|---|---|
| Number | Average Value | Number | Average Value | Number | Average Value | Number | Average Value | Number | Average Value | Number | Average Value | Number | Average Value | |
| LOANS ORIGINATED | 812 | $299,080 | 4,376 | $286,013 | 10,454 | $303,969 | 349 | $138,688 | 117 | $2,133,427 | 1,431 | $311,184 | 1 | $338,000 |
| APPLICATIONS APPROVED, NOT ACCEPTED | 76 | $286,961 | 321 | $296,433 | 767 | $314,270 | 59 | $169,441 | 7 | $904,571 | 128 | $304,500 | 1 | $202,000 |
| APPLICATIONS DENIED | 254 | $282,961 | 910 | $249,410 | 3,302 | $308,990 | 295 | $98,851 | 15 | $2,422,600 | 609 | $286,573 | 4 | $35,750 |
| APPLICATIONS WITHDRAWN | 150 | $285,767 | 673 | $293,348 | 1,934 | $307,150 | 64 | $266,656 | 6 | $1,070,000 | 294 | $300,925 | 1 | $258,000 |
| FILES CLOSED FOR INCOMPLETENESS | 41 | $255,098 | 155 | $264,987 | 634 | $280,546 | 40 | $226,100 | 1 | $40,000 | 76 | $287,882 | 1 | $39,000 |
Detailed mortgage data for all 157 tracts in Boston, MA
| Private Mortgage Insurance Companies Aggregated Statistics For Year 2009 (Based on 134 full tracts) | ||||||
| A) Conventional Home Purchase Loans | B) Refinancings | C) Non-occupant Loans on < 5 Family Dwellings (A & B) | ||||
|---|---|---|---|---|---|---|
| Number | Average Value | Number | Average Value | Number | Average Value | |
| LOANS ORIGINATED | 431 | $300,545 | 258 | $309,767 | 7 | $330,714 |
| APPLICATIONS APPROVED, NOT ACCEPTED | 135 | $292,044 | 93 | $300,108 | 7 | $194,286 |
| APPLICATIONS DENIED | 140 | $302,579 | 125 | $307,080 | 2 | $379,000 |
| APPLICATIONS WITHDRAWN | 29 | $314,345 | 20 | $336,900 | 0 | $0 |
| FILES CLOSED FOR INCOMPLETENESS | 16 | $309,562 | 8 | $314,250 | 2 | $286,500 |
2003 - 2018 National Fire Incident Reporting System (NFIRS) incidents
- Fire incident types reported to NFIRS in Boston, MA
- 56,28869.0%Structure Fires
- 18,21822.3%Outside Fires
- 5,7247.0%Mobile Property/Vehicle Fires
- 1,3281.6%Other
 Based on the data from the years 2003 - 2018 the average number of fire incidents per year is 5097. The highest number of reported fire incidents - 6,058 took place in 2016, and the least - 3,714 in 2003. The data has a rising trend.
 When looking into fire subcategories, the most incidents belonged to: Structure Fires (69.0%), and Outside Fires (22.3%).
Fire-safe hotels and motels in Boston, Massachusetts:
- Hilton Boston Back Bay, 40 Dalton St, Boston, Massachusetts 02115 , Phone: (617) 236-1100, Fax: (617) 867-6081
- The Inn At Longwood Medical, 342 Longwood Ave, Boston, Massachusetts 02115 , Phone: (617) 731-4700, Fax: (617) 731-4870
- Boston Marriott Copley Place, 110 Huntington Ave, Boston, Massachusetts 02116 , Phone: (617) 236-5800, Fax: (617) 236-5885
- Doubletree Guest Suites Boston, 400 Soldiers Field Rd, Boston, Massachusetts 02134 , Phone: (617) 783-0090, Fax: (617) 783-0897
- Langham Hotel, 250 Franklin St, Boston, Massachusetts 02110 , Phone: (617) 451-1900, Fax: (617) 423-2844
- Verb Hotel, 1271 Boylston St, Boston, Massachusetts 02215 , Phone: (617) 267-8300, Fax: (617) 262-6365
- Taj Boston, 15 Arlington St, Boston, Massachusetts 02117 , Phone: (617) 536-5700, Fax: (617) 536-1335
- The Westin Coply Place Boston, 10 Huntington Ave, Boston, Massachusetts 02116 , Phone: (800) 937-8461, Fax: (617) 424-7483
- 47 other hotels and motels
| Most common first names in Boston, MA among deceased individuals | ||
| Name | Count | Lived (average) |
|---|---|---|
| Mary | 5,161 | 80.4 years |
| John | 4,219 | 72.9 years |
| Joseph | 2,435 | 73.0 years |
| William | 2,374 | 72.5 years |
| James | 2,270 | 70.6 years |
| Margaret | 1,953 | 80.2 years |
| Helen | 1,433 | 79.3 years |
| Robert | 1,370 | 65.7 years |
| Anna | 1,333 | 80.9 years |
| Charles | 1,324 | 73.0 years |
| Most common last names in Boston, MA among deceased individuals | ||
| Last name | Count | Lived (average) |
|---|---|---|
| Smith | 727 | 74.0 years |
| Sullivan | 610 | 77.0 years |
| Williams | 580 | 70.7 years |
| Johnson | 566 | 72.5 years |
| Jones | 471 | 71.3 years |
| Murphy | 462 | 76.5 years |
| Brown | 443 | 73.1 years |
| Davis | 342 | 71.4 years |
| Obrien | 337 | 76.0 years |
| Mccarthy | 325 | 76.2 years |
- 69.7%Utility gas
- 15.7%Electricity
- 11.1%Fuel oil, kerosene, etc.
- 2.7%Bottled, tank, or LP gas
- 0.3%Other fuel
- 0.3%No fuel used

- 49.0%Utility gas
- 39.4%Electricity
- 4.6%Fuel oil, kerosene, etc.
- 3.2%Bottled, tank, or LP gas
- 2.9%No fuel used
- 1.0%Other fuel
Boston compared to Massachusetts state average:
- Unemployed percentage significantly below state average.
- Black race population percentage significantly above state average.
- Median age significantly below state average.
- Foreign-born population percentage above state average.
- Renting percentage above state average.
- Length of stay since moving in below state average.
- Number of rooms per house below state average.
- Number of college students above state average.
- Percentage of population with a bachelor's degree or higher above state average.
Boston, MA compared to other similar cities:
Boston on our top lists:
- #5 on the list of "Top 101 cities with the lowest number of arson incidents per 100,000 residents (population 50,000+)"
- #8 on the list of "Top 101 cities with the most people taking subway or elevated to work (population 5,000+)"
- #13 on the list of "Top 101 cities with the largest percentage of likely gay men couples (counted as self-reported male-male unmarried-partner households) (population 50,000+)"
- #14 on the list of "Top 100 cities with old houses but young residents (pop. 50,000+)"
- #14 on the list of "Top 101 cities with the smallest differences between morning and afternoon humidity (population 50,000+)"
- #14 on the list of "Top 101 cities with the smallest humidity differences during a year (population 50,000+)"
- #17 on the list of "Top 101 cities with the least cars per house, population 50,000+"
- #18 on the list of "Top 101 cities with the biggest property tax revenues per resident (population 10,000+)"
- #19 on the list of "Top 101 cities with the lowest percentage of family households, population 100,000+"
- #20 on the list of "Top 101 cities with the largest percentage of likely homosexual households (counted as self-reported same-sex unmarried-partner households) (population 50,000+)"
- #20 on the list of "Top 101 cities with the smallest percentage of one, detached housing units in structures (20,000+ housing units)"
- #21 on the list of "Top 101 cities with the highest average wind speeds (population 50,000+)"
- #22 on the list of "Top 101 cities with the highest number of police officers per 1000 residents (population 50,000+)"
- #26 on the list of "Top 101 cities where the highest percentage of females (15+ years) which never married (with at least 10,000 females in this group)"
- #27 on the list of "Top 100 cities with oldest houses (pop. 50,000+)"
- #27 on the list of "Top 100 cities with highest percentage of renters (pop. 50,000+)"
- #28 on the list of "Top 101 cities with the smallest precipitation differences during a year (population 50,000+)"
- #29 on the list of "Top 100 biggest cities"
- #29 on the list of "Top 101 biggest cities in 2013"
- #29 on the list of "Top 101 cities with largest percentage of males in industries: health care and social assistance (population 50,000+)"
- #7 (02110) on the list of "Top 101 zip codes with the largest percentage of taxpayers reporting net capital gain/loss in 2012 (pop 1,000+)"
- #7 (02110) on the list of "Top 101 zip codes with the most finance and insurance companies in 2005"
- #7 (02121) on the list of "Top 101 zip codes with the lowest 2012 average net capital gain/loss (pop 5,000+)"
- #8 (02132) on the list of "Top 101 zip codes with the largest percentage of Irish first ancestries (pop 5,000+)"
- #12 (02116) on the list of "Top 101 zip codes with the most beauty salons in 2005"
- #16 (02109) on the list of "Top 101 zip codes with the most big companies in 2005 (at least 1000 employees)"
- #19 (02108) on the list of "Top 101 zip codes with the highest 2012 average taxable interest for individuals (pop 1,000+)"
- #22 (02126) on the list of "Top 101 zip codes with the largest percentage of West Indian first ancestries"
- #23 (02108) on the list of "Top 101 zip codes with the highest 2012 average reported profit/loss from business (pop 1,000+)"
- #23 (02116) on the list of "Top 101 zip codes with the highest 2012 average net capital gain/loss (pop 5,000+)"
- #34 (02108) on the list of "Top 101 zip codes with the highest 2012 average Adjusted Gross Income (AGI) for individuals (pop 1,000+)"
- #39 (02110) on the list of "Top 101 zip codes with the most medium-big companies in 2005 (at least 100 employees)"
- #40 (02109) on the list of "Top 101 zip codes with the most offices of lawyers in 2005"
- #46 (02116) on the list of "Top 101 zip codes with the most Internet business establishments in 2005"
- #51 (02114) on the list of "Top 101 zip codes with the most museums in 2005"
- #56 (02116) on the list of "Top 101 zip codes with the most full service restaurants in 2005"
- #60 (02151) on the list of "Top 101 zip codes with the largest percentage of Arab first ancestries (pop 5,000+)"
- #62 (02110) on the list of "Top 101 zip codes with the largest percentage of taxpayers reporting taxable interest in 2012 (pop 1,000+)"
- #68 (02215) on the list of "Top 101 zip codes with the smallest percentage of taxpayers using paid preparers for 2012 taxes (pop 5,000+)"
- #78 (02467) on the list of "Top 101 zip codes with the largest charity contributions deductions as a percentage of AGI in 2012 (pop 5,000+)"
- #5 on the list of "Top 101 counties with the lowest percentage of residents that keep firearms around their homes"
- #9 on the list of "Top 101 counties with the largest decrease in the number of deaths per 1000 residents 2000-2006 to 2007-2013 (pop. 50,000+)"
- #19 on the list of "Top 101 counties with highest percentage of residents voting for Obama (Democrat) in the 2012 Presidential Election (pop. 50,000+)"
- #21 on the list of "Top 101 counties with the most Orthodox congregations"
- #31 on the list of "Top 101 counties with the most Catholic adherents"
State forum archive:

|
|
Total of 10525 patent applications in 2008-2024.


