The comparison between Bronx, NY, and Atlanta, GA, reveals distinct differences and unique conditions each city offers. These include factors like crime and safety, weather, cost of living, education, the economy, infrastructure, industries, real estate, neighborhoods, public transit, taxes, culture, sports, geography, and healthcare. Both cities have their appealing factors depending on individual preferences.
Both Bronx, NY, and Atlanta, GA, have crime rates that are higher than the national average, but it's worth noting that crime statistics can vary widely between neighborhoods in both cities. Bronx, due to its urban density, tends to have concentrated spots of crime. While Atlanta's crime rate is high, ongoing efforts by city and community leaders have led to improvements. Safety can strongly vary by neighborhood in both cities.
Cost of Living
The cost of living in the Bronx is generally higher than in Atlanta. This is particularly seen in areas such as housing, where the median home cost is significantly higher in Bronx compared to Atlanta. Basic services, groceries, and entertainment also tend to be more expensive in the Bronx.
Income Tax
New York State has a progressive income tax system, ranging from 4% to 8.82%, apart from NYC's additional tax of 3.876% at the top rate. Georgia's income tax ranges from 1% to 5.75%, thereby making Atlanta a more tax-friendly place for high-income earners.
Property Tax
In the Bronx, the general tax rate is around 0.90%, but this can vary depending on the property class. Atlanta's property tax rates are somewhat lower, generally around 0.92% for city residents, but can increase with various county and local levies.
Sales Tax
New York City has a combined city and state sales tax rate of 8.875%, including a 4.5% city tax. In contrast, Atlanta has a combined city and state sales tax rate of 8.9%. Both cities have higher rates than the U.S average.
Income
Type
Bronx
Atlanta
Estimated median household income
$43,011
$74,107
Estimated per capita income
$23,354
$55,051
Cost of living index (U.S. average is 100)
172.8
104.3
If you make $50,000 in Atlanta, you will have to make $82,838 in Bronx to maintain the same standard of living.
Geographical Conditions
The Bronx, the northernmost of the five New York City boroughs, is known for its green spaces including the Bronx Zoo and the New York Botanical Gardens. Atlanta is known as the city in the forest due to its lush canopy of trees, and the city is spread over rolling hills.
Geographical information
Type
Bronx
Atlanta
Land area
42 sq. miles
131.7 sq. miles
Population density
32,928 people per sq. mile
3,768.3 people per sq. mile
Elevation
120 feet
1,050 feet
Relative area comparison
Bronx, NY Atlanta, GA
Education
Both cities have robust education systems, although they serve different demographics. Atlanta is home to renowned institutions like Emory University and Georgia Tech, while the Bronx boasts Fordham University and Hostos Community College. Public school systems in both cities are continually improving, but performance can vary widely by neighbourhood.
In terms of unemployment rate, Atlanta fares slightly better. Atlanta's economy is more diverse, with strong sectors in diverse fields such as logistics, professional and business services, media operations, and information technology. The Bronx is deeply integrated into the overall New York City economy, with sectors such as healthcare, education, and retail playing significant roles.
Biggest Employers
In Bronx, the biggest employers are mainly found in the healthcare sector with Montefiore Medical Center and Bronx Lebanon Hospital. Atlanta is home to several corporate headquarters such as Coca-Cola, Home Depot, and Delta Air Lines.
In Bronx (Bronx County), 91.9% voted for Democrats and 8.1% for Republicans in 2012 Presidential Election. In Atlanta (Fulton County), 64.3% voted for Democrats and 34.5% for Republicans.
Elections
Type
Democrats
Republicans
Other
Year
Bronx
Atlanta
Bronx
Atlanta
Bronx
Atlanta
2020
83.7%
72.6%
16.0%
26.2%
0.3%
1.2%
2016
88.6%
67.8%
9.5%
26.9%
2.0%
5.3%
2012
91.9%
64.3%
8.1%
34.5%
0.0%
1.2%
2008
89.0%
67.2%
11.0%
32.2%
0.0%
0.6%
2004
82.9%
59.4%
16.5%
40.0%
0.6%
0.7%
2000
86.5%
57.9%
11.8%
39.9%
1.7%
2.2%
1996
85.8%
58.9%
10.5%
36.9%
3.7%
4.1%
Breakdown of population affiliated with a religious congregation
Type
Adherents
Congregations
Religion
Bronx
Atlanta
Bronx
Atlanta
CATHOLIC CHURCH
25.5%
9.9%
11.5%
2.4%
MUSLIM ESTIMATE
2.8%
1.4%
3.9%
1.7%
AMERICAN BAPTIST CHURCHES IN THE USA
0.7%
0.8%
4.4%
1.1%
SEVENTH DAY ADVENTIST CHURCH
0.7%
1.2%
6.5%
1.5%
EPISCOPAL CHURCH
0.4%
2.1%
3.7%
2.1%
EVANGELICAL LUTHERAN CHURCH IN AMERICA
0.2%
0.6%
2.6%
1.5%
SOUTHERN BAPTIST CONVENTION
0.2%
7.9%
2.4%
14.7%
Weather
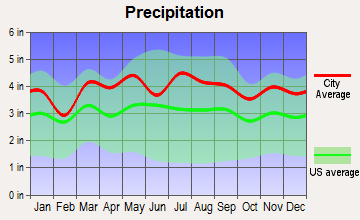
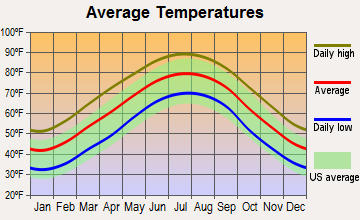
Bronx and Atlanta offer very different climates. Bronx experiences a humid subtropical climate with cold, snowy winters and hot, humid summers. Conversely, Atlanta experiences a subtropical monsoon climate with milder winters and hot, humid summers, and it also gets more rainfall than the national average.
Weather and climate
Type
Bronx
Atlanta
Temperature - Average
54.7°F
61.7°F
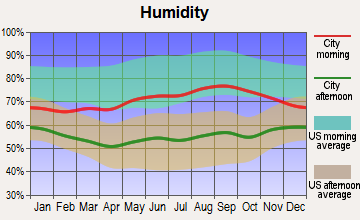
Humidity - Average morning or afternoon humidity
67.2%
73.9%
Humidity - Differences between morning and afternoon humidity
26.4%
38%
Humidity - Maximum monthly morning or afternoon humidity
75.6%
87%
Humidity - Minimum monthly morning or afternoon humidity
49.2%
49%
Precipitation - Yearly average
47 in
51.4 in
Snowfall - Yearly average
54.5 in
4 in
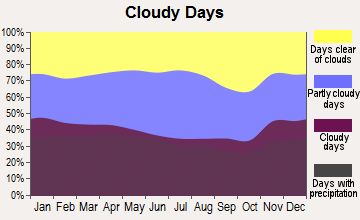
Clouds - Number of days clear of clouds
16.5%
18.3%
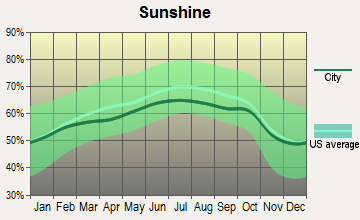
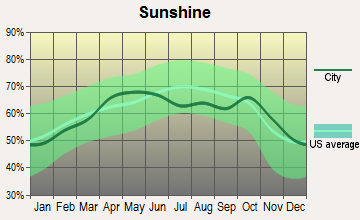
Sunshine amount - Average
60.2%
65.6%
Sunshine amount - Differences during a year
20%
17%
Sunshine amount - Maximum monthly
64%
67%
Sunshine amount - Minimum monthly
44%
50%
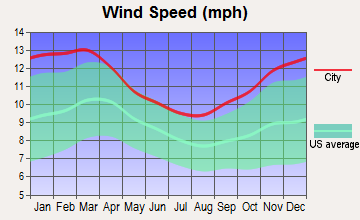
Wind speed - Average
10.7 mph
9 mph
Average climate in Bronx, New York
Average climate in Atlanta, Georgia
Air pollution
Type
AQI
CO
NO2
OZONE
PB
PM10
PM25
SO2
Year
Bronx
Atlanta
Bronx
Atlanta
Bronx
Atlanta
Bronx
Atlanta
Bronx
Atlanta
Bronx
Atlanta
Bronx
Atlanta
Bronx
Atlanta
2018
102
84
0.31
0.27
15.8
N/A
24.4
24.7
N/A
N/A
N/A
17.5
7.4
10.6
0.6
0.8
2017
100
87
0.04
0.31
15.7
N/A
24.6
24.7
N/A
N/A
N/A
17.5
7.0
11.3
0.6
1.2
2016
98
105
0.30
0.31
16.4
N/A
24.6
25.9
N/A
N/A
N/A
17.2
7.2
11.1
0.8
1.0
2015
105
91
0.28
0.31
18.0
N/A
23.6
23.9
N/A
N/A
N/A
17.6
8.6
10.2
1.4
0.9
2014
99
88
0.32
0.31
18.0
N/A
23.6
24.0
N/A
N/A
N/A
18.4
8.4
9.1
1.7
1.1
2013
103
88
0.39
0.30
18.9
N/A
23.5
23.7
N/A
N/A
N/A
18.0
9.3
8.7
2.1
1.0
2012
104
109
0.44
0.33
18.8
N/A
23.9
26.2
N/A
N/A
N/A
19.5
9.7
9.8
3.1
1.1
2011
113
98
0.46
0.33
20.9
N/A
22.1
27.5
N/A
N/A
N/A
21.2
11.6
12.0
4.5
1.7
2010
113
102
0.53
0.35
20.2
N/A
23.7
25.8
N/A
N/A
N/A
18.5
10.8
12.5
4.7
1.9
2009
107
96
0.53
N/A
22.3
N/A
19.5
25.2
N/A
N/A
N/A
18.5
10.8
13.8
5.4
1.7
2008
114
99
0.53
0.53
23.3
15.3
19.9
31.2
0.013
0.003
N/A
22.5
12.1
16.3
5.9
2.5
2007
122
124
0.60
0.45
24.6
17.0
19.1
33.1
0.016
0.003
N/A
29.4
13.2
18.1
7.0
2.7
2006
120
129
0.50
0.58
25.0
17.9
18.9
31.3
0.018
0.003
N/A
22.9
12.8
19.7
7.0
3.4
2005
115
123
0.60
0.55
27.0
17.2
17.8
29.0
N/A
0.005
N/A
25.5
N/A
15.8
9.3
3.2
2004
109
118
0.62
0.54
25.6
16.9
16.7
28.8
0.030
0.004
N/A
22.9
N/A
14.6
8.8
2.8
2003
110
112
0.75
0.56
27.4
16.4
17.1
26.7
0.022
0.004
26.9
22.2
N/A
15.4
8.9
3.0
2002
124
120
0.67
0.60
27.9
19.4
17.4
27.9
0.008
N/A
25.0
23.2
N/A
13.1
8.6
3.0
2001
126
117
0.66
0.69
30.0
23.3
17.8
27.2
0.020
N/A
22.8
27.0
N/A
N/A
10.0
3.1
2000
115
132
0.68
0.50
29.4
22.9
16.0
31.2
0.022
N/A
22.2
28.4
N/A
N/A
10.2
3.2
Natural disasters
Type
Bronx
Atlanta
Tornado activity compared to U.S. average
58.3%
159.5%
Earthquake activity compared to U.S. average
31%
153.4%
Natural disasters compared to U.S. average
14%
15%
Transportation
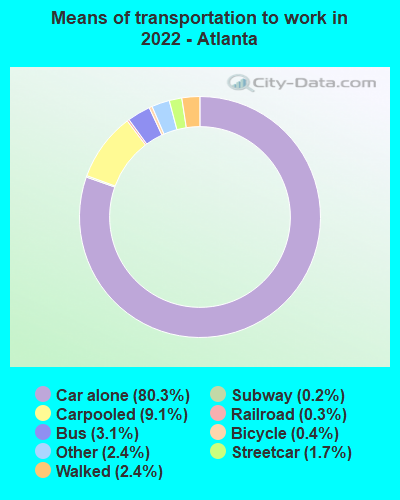
Public transportation is more abundant and essential in the Bronx due to its integration with the massive New York City transit system, which includes buses, subway, and commuter rail options. Atlanta, while offering some public transit with MARTA (bus and rail), is generally more car-dependent with sprawling freeway systems.
Transport
Type
Bronx
Atlanta
Amtrak stations
0
1
Amtrak stations nearby
3
1
FAA registered aircraft
39
1
FAA registered aircraft manufacturers and dealers
0
28
Means of transportation to work
Type
Bronx
Atlanta
Bicycle
0.2%
0.5%
Bus
15.6%
2.1%
Carpooled
9.3%
7.6%
Car alone
27%
84%
Motorcycle
0%
0.1%
Railroad
2%
0.2%
Streetcar
0.2%
1.1%
Subway
34.6%
0.4%
Taxicab
1.3%
0.3%
Walked
7.2%
1.9%
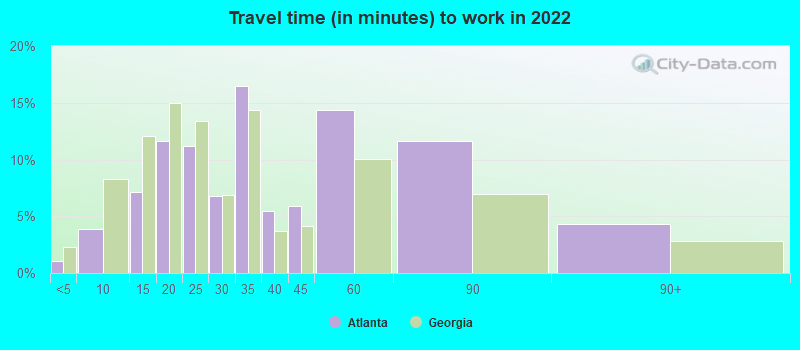
Average travel time to work
Type
Bronx
Atlanta
Average
44.2 min
34.9 min
Real Estate
Real estate in the Bronx typically revolves around apartment rentals, with higher prices reflecting its location within New York City. Atlanta's real estate market offers more diversity, including apartments, condos, townhouses, and single-family homes, typically at more affordable rates than in the Bronx.
Neighborhoods
Bronx neighborhoods vary from working-class areas to affluent enclaves, each with their unique cultures and amenities. Atlanta neighborhoods also vary widely, with diverse options from vibrant urban areas like Midtown to historic areas like Grant Park and the upscale, leafy Buckhead neighborhood.
Houses and residents
Type
Bronx
Atlanta
Houses
490,659
253,355
Average household size (people)
2.8
2.1
Houses occupied
463,212 (94.4%)
232,720 (91.9%)
Houses occupied by owners
90,522 (19.5%)
113,092 (48.6%)
Houses occupied by renters
372,690 (80.5%)
119,628 (51.4%)
Median rent asked for vacant for-rent units
$1,273
$1,226
Median price asked for vacant for-sale houses and condos
$708,992
$325,147
Estimated median house or condo value
$465,000
$375,500
Median number of rooms in apartments
3.7
3.5
Median number of rooms in houses and condos
5.1
6.2
Renting percentage
80.7%
55.1%
Housing density (houses/condos per square mile)
11,675
1,923
Household income disparities
50.2%
47.8%
Housing units without a mortgage
12,021 (34%)
1,022 (1.3%)
Housing units with both a second mortgage and home equity loan
105 (0.3%)
5,566 (7%)
Housing units with a mortgage
23,339 (66%)
78,250 (98.7%)
Housing units with a home equity loan
2,053 (5.8%)
58 (0.1%)
Housing units with a second mortgage
2,159 (6.1%)
7,203 (9.1%)
Housing units lacking complete kitchen facilities
1.4%
2%
Housing units lacking complete plumbing facilities
Self-employed workers in own not incorporated business
16,572
15,892
State government workers
14,515
13,288
Unpaid family workers
1,000
550
Industries and Occupations
Bronx's largest industries include healthcare and social assistance, retail trade, and educational services. Atlanta, on the other hand, has thriving industries such as television production and broadcasting, technology, and healthcare.
Both Atlanta and Bronx have numerous quality healthcare facilities. However, the Bronx has access to a greater number of premier hospitals due to its proximity to Manhattan. Atlanta is also home to several renowned hospitals such as Emory University Hospital and Grady Memorial Hospital.
Health (county statistics)
Type
Bronx
Atlanta
General health status score of residents in this county from 1 (poor) to 5 (excellent)
Both Bronx and Atlanta have well-developed infrastructures. However, Bronx, being part of the larger New York metro area, provides extensive public transit options and a dense built environment, which includes numerous iconic structures. Atlanta's infrastructure supports a sprawling urban and suburban setting, with a focus on highways and heavy car usage.
Infrastructure
Type
Bronx
Atlanta
Hospitals
57
46
TV stations
30
22
Bank branches located here
118
235
Bank institutions located here
24
41
Main business address for public companies
2
85
Drinking water stations with no reported violations in the past
1
5
Drinking water stations with reported violations in the past
4
24
Schools
School facilities
Type
Bronx
Atlanta
Private elementary/middle schools
54
38
Private high schools
20
27
Public elementary/middle schools
285
110
Public high schools
155
39
Colleges/Universities
9
40
Culture and Food
Both cities boast robust cultural scenes and famous food traditions. The Bronx has a great mix of cultures, with a lot of Latin American influence and cuisines like Italian and Irish. Atlanta's deep roots in Southern culture present themselves in its food scene, with soul food, BBQ, and innovative local cuisine.
Sports Teams
The Bronx is home to the legendary New York Yankees. In contrast, Atlanta hosts multiple professional sports teams, including the Braves (baseball), Falcons (football), Hawks (basketball), and Atlanta United (soccer).


 Bronx, NY
 Atlanta, GA