Chandler and Scottsdale are two prominent cities in Arizona. While Chandler is known for its modern innovations, Scottsdale is celebrated for its contemporary vibe combined with historical resonance. Both cities have distinctive features and amenities that meet the needs and interests of residents or visitors. Here, we compare living in Chandler, AZ, to Scottsdale, AZ, considering various factors, including crime and safety, weather, cost of living, education, and more.
Distance between
Chandler, AZ and
Scottsdale, AZ : 20.3 miles
Chandler's population is larger by 15%. Its population has grown by 102,877 people (58.3%) since 2000. The population of Scottsdale has grown by 40,048 people (19.8%) during that time.
Chandler and Scottsdale both benefit from the well-organized law enforcement agencies that ensure the safety of its residents and tourists. Chandler has a slightly higher crime rate compared to the national average but is still lower than the Arizona state average. Scottsdale, on the other hand, has a lower crime rate compared to both the state and national averages, making it slightly safer.
City-data.com crime index counts serious crimes and violent crime more heavily. It adjusts for the number of visitors and daily workers commuting into cities. (higher means more crime, U.S. average = 301.1)
City-data.com crime index counts serious crimes and violent crime more heavily. It adjusts for the number of visitors and daily workers commuting into cities. (higher means more crime, U.S. average = 301.1)
Sex Offenders
According to our data, there are 99 registered sex offenders living in Chandler and 59 registered sex offenders living in . The ratio of residents to sex offenders in Chandler is 2,500 to 1; the ratio in Scottsdale is 4,180 to 1. The number of registered sex offenders compared to the number of residents is larger in Chandler than in Scottsdale.
Cost of Living
Living in Scottsdale is generally more expensive than in Chandler. The higher cost of living in Scottsdale can be attributed to higher real estate prices and general amenities. Grocery prices, health, and transportation costs are also higher in Scottsdale.
Income Tax
Arizona has a progressive state income tax, and it is the same for both Scottsdale and Chandler residents.
Property Tax
Property tax rates in both cities are similar, with Scottsdale residents typically paying somewhat higher due to the higher costs of homes in the city.
Sales Tax
Arizona's state sales tax is the same for both cities at 5.6%. However, Chandler has a combined sales tax rate of 7.8%, slightly lower than Scottsdale's combined rate of 8.05%.
Income
Type
Chandler
Scottsdale
Estimated median household income
$94,613
$99,097
Estimated per capita income
$46,965
$74,952
Cost of living index (U.S. average is 100)
101.2
105
If you make $50,000 in Chandler, you will have to make $51,877 in Scottsdale to maintain the same standard of living.
Geographical Conditions
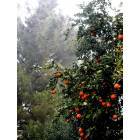
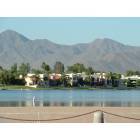
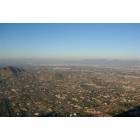
Both cities are located in the Sonoran Desert, which results in similar geographic conditions. However, Scottsdale is closer to mountains and offers more outdoor recreational opportunities.
Scottsdale boasts one of the best school districts in Arizona, which might attract families with kids. Chandler also has reputed schools and is home to a few community colleges, but Scottsdale edges forward with its overall education offerings.
Both cities offer ample job opportunities. Chandler is known for advanced manufacturing, education, and healthcare jobs, while Scottsdale, being a tourist hotspot, primarily thrives on jobs in retail, food and beverage, and hospitality.
Biggest Employers
In Chandler, the biggest employers are Intel and Wells Fargo, representing the city's strong tech and finance industries. In Scottsdale, HonorHealth and Vanguard Group are the largest employers, reflecting the importance of health and finance to the city's economy.
There were 670 building permits issued in Chandler in 2012 (5 more than in 2011) compared to 553 building permits issued in Scottsdale in 2012 (405 more than in 2011).
Weather
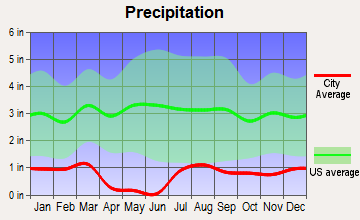
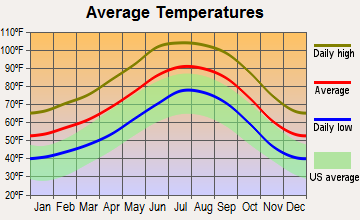
Both cities experience similar climates being situated in Arizona, with hot summers and mild winters. Summers can be quite hot, with temperatures reaching over 100°F. Winters, on the other hand, are generally mild and enjoyable. However, Chandler can be a bit hotter than Scottsdale.
Weather and climate
Type
Chandler
Scottsdale
Temperature - Average
71.8°F
71.6°F
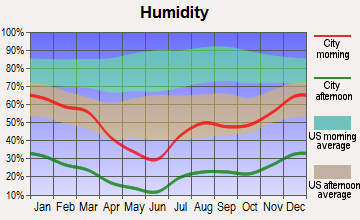
Humidity - Average morning or afternoon humidity
37.5%
37.5%
Humidity - Differences between morning and afternoon humidity
48%
48%
Humidity - Maximum monthly morning or afternoon humidity
60%
60%
Humidity - Minimum monthly morning or afternoon humidity
12%
12%
Precipitation - Yearly average
9.1 in
9.9 in
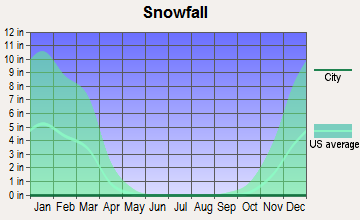
Snowfall - Yearly average
0 in
0 in
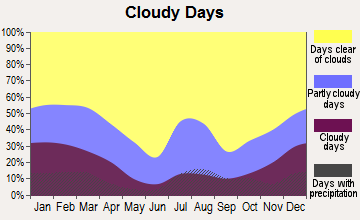
Clouds - Number of days clear of clouds
35.3%
35.3%
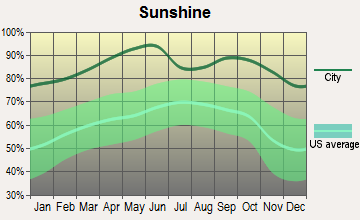
Sunshine amount - Average
92.8%
92.8%
Sunshine amount - Differences during a year
16%
16%
Sunshine amount - Maximum monthly
95%
95%
Sunshine amount - Minimum monthly
79%
79%
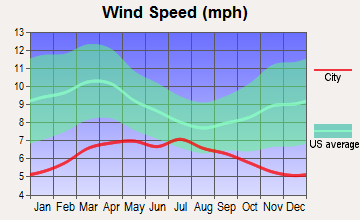
Wind speed - Average
6.6 mph
6.6 mph
Average climate in Chandler, Arizona
Average climate in Scottsdale, Arizona
Air pollution
Type
AQI
CO
NO2
OZONE
PM10
PM25
SO2
Year
Chandler
Scottsdale
Chandler
Scottsdale
Chandler
Scottsdale
Chandler
Scottsdale
Chandler
Scottsdale
Chandler
Scottsdale
Chandler
Scottsdale
2018
206
150
0.29
0.35
15.2
15.0
30.6
31.7
35.5
35.6
7.7
7.8
0.6
0.6
2017
132
116
0.36
0.37
15.9
15.7
31.2
31.9
34.0
33.1
7.8
7.4
1.4
1.4
2016
125
106
0.34
0.35
15.8
15.4
30.2
31.2
30.2
32.1
7.1
7.1
0.4
0.4
2015
173
101
0.39
0.35
17.8
17.2
29.2
29.7
24.2
27.1
7.3
7.3
0.9
0.9
2014
231
116
0.44
0.39
19.9
19.2
27.8
29.8
29.8
35.1
8.6
8.3
1.1
1.1
2013
148
127
0.32
0.35
20.1
19.5
29.8
31.2
28.9
32.0
7.5
7.8
0.9
0.9
2012
165
157
0.36
0.37
21.5
20.8
29.3
31.2
36.8
36.9
8.8
8.8
1.3
1.3
2011
205
204
0.32
0.38
19.1
17.2
30.1
31.3
40.4
38.7
9.5
9.5
0.9
0.9
2010
100
100
0.42
0.38
17.4
13.7
29.8
30.8
23.8
28.6
8.3
8.3
1.2
1.3
2009
109
109
0.40
0.40
17.6
13.9
29.8
30.3
36.1
36.5
N/A
N/A
1.1
0.8
2008
107
106
0.36
0.36
18.6
14.5
29.6
30.6
40.2
38.3
N/A
N/A
1.3
0.8
2007
135
134
0.38
0.42
20.6
16.1
28.5
28.3
50.2
46.5
N/A
N/A
1.9
1.7
2006
138
138
0.46
0.46
23.1
19.3
29.5
29.1
56.3
49.6
N/A
N/A
1.9
1.7
2005
109
109
0.56
0.61
23.6
19.7
26.6
26.6
48.7
42.0
N/A
N/A
1.8
1.5
2004
97
98
0.56
0.62
23.3
19.5
25.9
24.3
33.7
32.9
N/A
N/A
1.4
1.4
2003
100
101
0.58
0.65
24.6
22.1
27.3
25.2
42.6
42.6
N/A
N/A
1.4
1.4
2002
111
111
0.66
0.73
25.5
23.4
27.1
23.4
41.8
41.8
N/A
N/A
1.6
1.6
2001
105
106
0.68
0.73
24.3
21.4
26.3
23.5
37.8
37.8
N/A
N/A
1.5
1.5
2000
117
117
0.69
0.82
29.6
30.2
26.8
26.1
45.6
45.6
N/A
N/A
1.7
1.7
Natural disasters
Type
Chandler
Scottsdale
Tornado activity compared to U.S. average
18.5%
18%
Earthquake activity compared to U.S. average
2,391%
2,492.5%
Natural disasters compared to U.S. average
16%
16%
Transportation
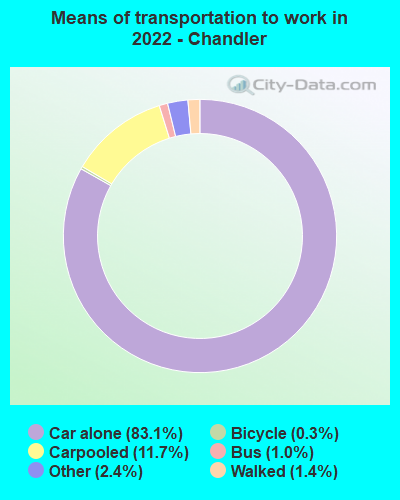
Both cities have a robust public transit system. In both cities, driving is the most common mode of commuting. Scottsdale provides free trolley service in its downtown area, while Chandler offers local bus routes and proximity to major highways for easier commuting.
Transport
Type
Chandler
Scottsdale
Amtrak stations nearby
2
3
FAA registered aircraft
438
726
FAA registered aircraft manufacturers and dealers
5
44
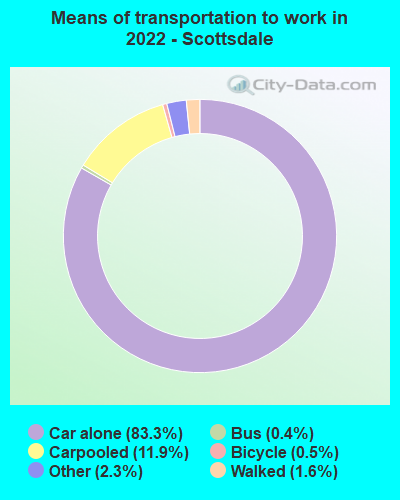
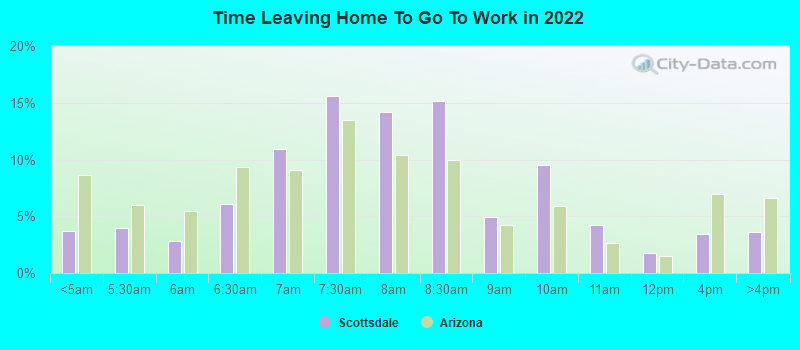
Means of transportation to work
Type
Chandler
Scottsdale
Bicycle
0.4%
0.6%
Bus
0.3%
0.8%
Carpooled
10.6%
9.8%
Car alone
84.8%
85%
Motorcycle
0.5%
0.3%
Taxicab
0%
0.1%
Walked
2.2%
2.1%
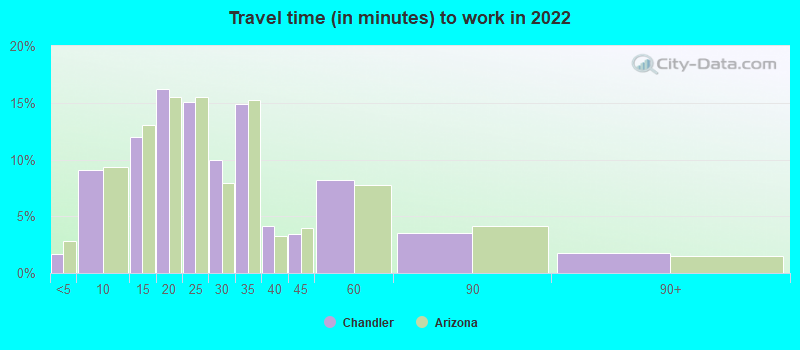
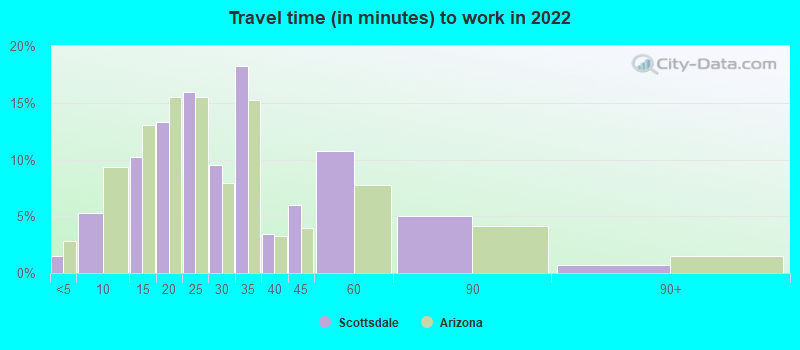
Average travel time to work
Type
Chandler
Scottsdale
Average
25.7 min
27.8 min
Other means
26.3 min
24.9 min
Public transportation
50.1 min
39.7 min
Private vehicle occupancy
Type
Chandler
Scottsdale
Average
1.2
1.1
Drove alone
89.3%
94%
In 2 person carpool
8%
4.9%
In 3 person carpool
1%
0.3%
In 4 person carpool
0.7%
0.3%
In 5-6 person carpool
0.9%
0.5%
In 7+ person carpool
0.1%
0.1%
How many people usually rode to work in the car, truck or van.
Real Estate
Real estate prices in Scottsdale are higher than in Chandler. Scottsdale offers a wide range of properties, from condos to luxury estates, while Chandler is home to more affordable single-family homes and townhouses.
Neighborhoods
Scottsdale's neighborhoods vary from the bustling Downtown to quiet suburban areas. Chandler also offers a similar mix, with its downtown area undergoing significant growth and suburban pockets known for their peaceful atmosphere.
Houses and residents
Type
Chandler
Scottsdale
Houses
112,136
138,984
Average household size (people)
2.7
2.1
Median year apartment built
1997
1990
Median year house/condo built
1997
1990
Length of stay in the house since moving in
10.6 years
11.5 years
Houses occupied
107,668 (96%)
119,122 (85.7%)
Houses occupied by owners
71,036 (66%)
80,132 (67.3%)
Houses occupied by renters
36,632 (34%)
38,990 (32.7%)
Median rent asked for vacant for-rent units
$2,338
$2,198
Median monthly housing costs
$1,573
$1,623
Median price asked for vacant for-sale houses and condos
$461,127
$300,483
Estimated median house or condo value
$435,100
$674,900
Median numbers of rooms
5.5
5.6
Median number of rooms in apartments
4.2
4
Median number of rooms in houses and condos
6.3
6.5
Median house price - detached houses
$493,497
Over $1,000,000
Median house price - in 2-unit structures
$583,625
$590,277
Median house price - in 3-to-4-unit structures
$260,715
$378,674
Median house price - in 5 or more unit structures
$287,805
$394,962
Median house price - mobile homes
$81,606
$86,054
Median house price - Townhouses or other attached units
$316,438
$530,134
Median house price - All housing units
$471,395
$872,565
Median house age
24
31
Renting percentage
33.7%
31.9%
Housing density (houses/condos per square mile)
1,937.2
754.5
House value disparities
22.8%
27.3%
Household income disparities
38.9%
41.8%
Median household income for houses/condes with a mortgage
$122,158
$137,177
Median household income for apartments without a mortgage
$78,975
$87,918
Housing units without a mortgage
907 (1.6%)
658 (1.3%)
Housing units with both a second mortgage and home equity loan
3,763 (6.8%)
6,221 (12.5%)
Housing units with a mortgage
54,712 (98.4%)
49,289 (98.7%)
Housing units with a home equity loan
0 (0%)
188 (0.4%)
Housing units with a second mortgage
4,390 (7.9%)
7,674 (15.4%)
House/condo owner moved in on average (years ago)
8
8
House/condo renter moved in on average (years ago)
1
1
Housing units lacking complete kitchen facilities
1.1%
1.4%
Housing units lacking complete plumbing facilities
0.4%
0.4%
Housing units in structures
Housing units in structures
Chandler
Scottsdale
One, detached
68.7%
53.1%
One, attached
5.5%
13.7%
Two
1.2%
0.6%
3 or 4
4.5%
3.9%
5 to 9
4.7%
5.1%
10 to 19
4.8%
5.6%
20 to 49
1.8%
3.7%
50 or more
7.5%
13.4%
Mobile homes
1.3%
1.0%
Median real estate property taxes paid for housing units
Self-employed workers in own not incorporated business
8,781
8,963
State government workers
4,501
4,079
Unpaid family workers
180
171
Industries and Occupations
Scottsdale's industry is heavily reliant on tourism, followed by finance and insurance sectors. Chandler is notable for its tech sector, with occupations mostly focused in advanced industries like aerospace, data centers, and microelectronics.
Health diagnosing and treating practitioners and other technical occupations
6.2%
8.3%
Personal care and service occupations
5.8%
3.0%
Computer and mathematical occupations
4.3%
5.0%
Healthcare support occupations
3.7%
1.5%
Food preparation and serving related occupations
3.6%
4.8%
Production occupations
2.8%
0.6%
Architecture and engineering occupations
2.3%
1.3%
Community and social service occupations
1.9%
2.6%
Health technologists and technicians
1.8%
1.6%
Arts, design, entertainment, sports, and media occupations
1.8%
2.3%
Building and grounds cleaning and maintenance occupations
1.8%
0.3%
Legal occupations
1.5%
1.8%
Material moving occupations
1.1%
0.7%
Transportation occupations
1.1%
0.3%
Life, physical, and social science occupations
0.7%
1.2%
Health Care
Both cities have excellent health care facilities. Scottsdale is home to Mayo Clinic and Scottsdale Healthcare while Chandler Regional Medical Center dominates in Chandler.
Scottsdale city management maintains high-quality infrastructural standards, including roads, utilities, and public facilities. Chandler, while a smaller city, is well-regarded for its infrastructure and city planning, particularly its growing downtown area.
Infrastructure
Type
Chandler
Scottsdale
Hospitals
2
8
TV stations
20
18
Bank branches located here
59
138
Bank institutions located here
20
42
Main business address for public companies
1
18
Drinking water stations with no reported violations in the past
1
3
Drinking water stations with reported violations in the past
HMDA - Conventional home purchase loans - Applications denied
Year
Chandler
Scottsdale
1999
879
1,109
2000
790
730
2001
513
530
2002
487
532
2003
854
1,056
2004
1,296
1,561
2005
1,916
2,094
2006
1,705
2,107
2007
949
1,334
2008
374
696
2009
249
476
Culture and Food
Scottsdale is known for its vibrant and cosmopolitan culture with a variety of restaurants, arts scene, and nightlife. Chandler, while smaller, offers a growing arts scene and a culinary landscape featuring local and international food.
Sports Teams
Neither city has major league sports teams but being close to Phoenix, residents and visitors can enjoy Phoenix Suns (NBA), Arizona Diamondbacks (MLB), and Arizona Cardinals (NFL) games. Plus, Scottsdale hosts the San Francisco Giants for Spring Training.


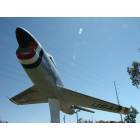

 Chandler, AZ
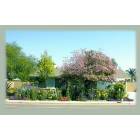
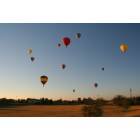
 Scottsdale, AZ