Comparing Charlotte, NC and Fort Lauderdale, FL, one can see stark differences in lifestyle, economic opportunities, tax structures, and other key aspects. Charlotte, as the largest city in North Carolina, is known for its robust economy, low cost of living, and excellent education system, whereas Fort Lauderdale is a sunny and vibrant beach city renowned for its tourism industry and exciting recreational activities.
Distance between
Charlotte, NC and
Fort Lauderdale, FL : 628.1 miles
Charlotte's population is larger by 384%. Its population has grown by 338,881 people (62.7%) since 2000. The population of Fort Lauderdale has grown by 29,271 people (19.2%) during that time.
Crime rates in both Charlotte and Fort Lauderdale are above the national average. According to Protect America, Charlotte's crime rate is 39.6 while Fort Lauderdale's is 54.5; higher numbers indicate higher crimes. However, both cities are investing in a wide range of safety measures to ensure residents and visitors feel safe. In both cities, crime tends to be concentrated in specific areas, with plenty of safe neighborhoods to choose from.
Cost of Living
Overall, the cost of living in Charlotte is lower than in Fort Lauderdale. According to cost-of-living comparison site Nerd Wallet, housing, transportation, and healthcare costs are lower in Charlotte, which can take a significant bite out of a family's budget. However, daily living expenses like groceries and restaurants are comparatively cheaper in Fort Lauderdale.
Income Tax
North Carolina has a flat state income tax of 5.25%, whereas Florida does not have a state income tax, which can be a significant financial advantage for residents of Fort Lauderdale.
Property Tax
Property taxes are significantly higher in Fort Lauderdale, with a rate of around 2%, compared to Charlotte's rate of around 1.1%. This is due to the higher home values found in Fort Lauderdale's desirable coastal locations.
Sales Tax
Sales tax is lower in Charlotte at 7.25%, compared to 7% in Fort Lauderdale, due to Fort Lauderdale's additional local surtax. Both are higher than the national average of around 5.6%.
Income
Type
Charlotte
Fort Lauderdale
Estimated median household income
$70,869
$64,912
Estimated per capita income
$44,593
$51,519
Cost of living index (U.S. average is 100)
93.2
112.2
If you make $50,000 in Charlotte, you will have to make $60,193 in Fort Lauderdale to maintain the same standard of living.
Geographical Conditions
Charlotte, located in the Piedmont region, has a rolling topography. The city is surrounded by beautiful nature, including the Blue Ridge Mountains and the Atlantic Ocean, both within a few hours' drive. Fort Lauderdale is a coastal city with hundreds of miles of beautiful sandy beaches and inland waterways.
Charlotte boasts an excellent education system, with many top-rated schools and universities such as the University of North Carolina at Charlotte and Charlotte Mecklenburg Schools. Fort Lauderdale also offers a solid education system with Broward County Public Schools and many private school options, but the city is better known for its vacation-friendly environment rather than its educational prowess.
Charlotte's economy is diverse, with strong sectors in finance, technology, and healthcare, while Fort Lauderdale has a more targeted economy based mainly on tourism, marine industry, and real estate development. Charlotte's job market scores higher according to U.S. News & World Report, making it an excellent place for finding employment.
Biggest Employers
In Charlotte, some of the biggest employers include Atrium Health, Wells Fargo, Bank of America, and American Airlines. In Fort Lauderdale, major employers are Tenet Healthcare, AutoNation, The Continental Group, and Broward County Public Schools.
In Charlotte (Mecklenburg County), 60.8% voted for Democrats and 38.3% for Republicans in 2012 Presidential Election. In Fort Lauderdale (Broward County), 67.3% voted for Democrats and 32.3% for Republicans.
Elections
Type
Democrats
Republicans
Other
Year
Charlotte
Fort Lauderdale
Charlotte
Fort Lauderdale
Charlotte
Fort Lauderdale
2020
66.8%
64.8%
31.6%
34.9%
1.6%
0.3%
2016
62.3%
66.2%
32.9%
31.2%
4.8%
2.6%
2012
60.8%
67.3%
38.3%
32.3%
0.9%
0.3%
2008
62.0%
67.5%
37.6%
32.5%
0.5%
0.0%
2004
51.7%
64.6%
48.0%
34.8%
0.3%
0.5%
2000
48.4%
67.7%
51.1%
31.1%
0.5%
1.2%
1996
48.6%
63.5%
45.9%
28.3%
5.5%
8.2%
Breakdown of population affiliated with a religious congregation
Type
Adherents
Congregations
Religion
Charlotte
Fort Lauderdale
Charlotte
Fort Lauderdale
SOUTHERN BAPTIST CONVENTION
9.0%
4.2%
19.0%
17.4%
CATHOLIC CHURCH
8.5%
16.0%
1.8%
4.4%
AMERICAN BAPTIST CHURCHES IN THE USA
2.3%
0.7%
1.1%
0.2%
EPISCOPAL CHURCH
1.2%
0.4%
1.3%
1.6%
EVANGELICAL LUTHERAN CHURCH IN AMERICA
0.9%
0.2%
1.8%
1.5%
PRESBYTERIAN CHURCH IN AMERICA
0.6%
0.2%
1.9%
0.9%
SEVENTH DAY ADVENTIST CHURCH
0.5%
0.9%
1.5%
4.6%
MUSLIM ESTIMATE
0.3%
1.0%
1.2%
1.3%
Weather
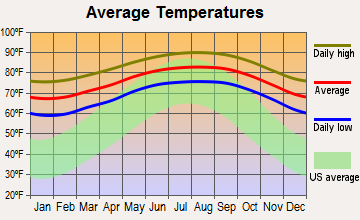
Climate-wise, the two cities could not be more different. Charlotte enjoys a temperate climate with four distinct seasons, making it a delight for those who love seasonal variations. In contrast, Fort Lauderdale has a tropical rainforest climate, with warm temperatures year-round and a highness tendency for rainfall, especially during the summer months.
Weather and climate
Type
Charlotte
Fort Lauderdale
Temperature - Average
61°F
75.9°F
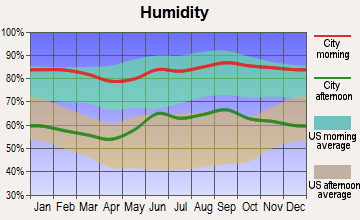
Humidity - Average morning or afternoon humidity
72.3%
77.3%
Humidity - Differences between morning and afternoon humidity
41%
31.1%
Humidity - Maximum monthly morning or afternoon humidity
87%
86%
Humidity - Minimum monthly morning or afternoon humidity
46%
55%
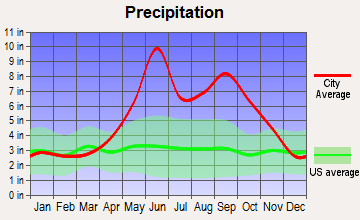
Precipitation - Yearly average
44.5 in
63.7 in
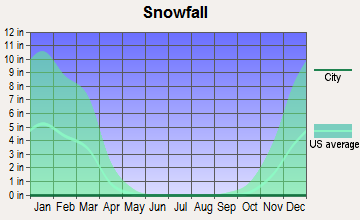
Snowfall - Yearly average
10.2 in
0 in
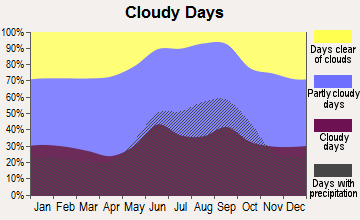
Clouds - Number of days clear of clouds
18.1%
12.4%
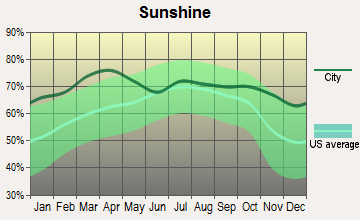
Sunshine amount - Average
69.8%
76.8%
Sunshine amount - Differences during a year
14%
16%
Sunshine amount - Maximum monthly
70%
79%
Sunshine amount - Minimum monthly
56%
63%
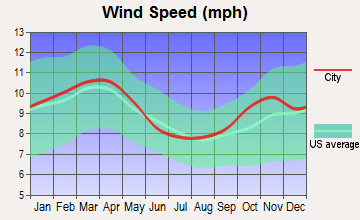
Wind speed - Average
6.9 mph
9.3 mph
Average climate in Charlotte, North Carolina
Average climate in Fort Lauderdale, Florida
Air pollution
Type
AQI
CO
NO2
OZONE
PB
PM10
PM25
SO2
Year
Charlotte
Fort Lauderdale
Charlotte
Fort Lauderdale
Charlotte
Fort Lauderdale
Charlotte
Fort Lauderdale
Charlotte
Charlotte
Fort Lauderdale
Charlotte
Fort Lauderdale
Charlotte
Fort Lauderdale
2018
75
69
0.24
0.48
6.3
13.9
27.8
26.2
N/A
N/A
15.5
15.7
8.2
9.1
0.2
0.1
2017
77
78
0.25
0.51
7.0
14.9
28.0
25.5
N/A
N/A
16.3
N/A
8.8
9.9
0.2
0.1
2016
82
65
0.25
0.50
7.6
15.6
28.7
27.4
N/A
N/A
N/A
N/A
8.4
8.9
0.2
0.0
2015
76
61
0.25
0.40
8.1
6.6
27.6
23.9
N/A
N/A
N/A
N/A
8.6
8.2
0.2
0.0
2014
76
73
0.26
N/A
8.5
6.6
26.3
24.1
N/A
N/A
N/A
N/A
9.3
8.0
0.3
0.0
2013
71
62
0.29
N/A
8.4
4.4
25.5
23.9
N/A
N/A
N/A
N/A
8.6
7.9
0.3
0.0
2012
95
68
0.28
N/A
8.7
5.0
27.3
24.7
N/A
N/A
N/A
N/A
9.7
8.7
0.3
0.0
2011
94
65
0.34
N/A
10.1
5.6
28.9
24.9
N/A
N/A
N/A
N/A
11.2
8.7
0.6
0.0
2010
97
69
0.33
N/A
11.8
7.0
28.0
25.8
N/A
N/A
N/A
N/A
11.6
9.1
1.0
0.0
2009
82
64
0.30
N/A
10.0
6.3
25.4
23.9
N/A
N/A
N/A
N/A
11.1
9.2
0.9
0.0
2008
102
87
0.32
0.42
11.2
5.3
27.6
23.7
N/A
N/A
N/A
19.3
13.0
10.5
2.1
0.0
2007
108
89
0.37
0.39
13.9
6.3
29.1
25.1
0.001
N/A
N/A
19.4
14.5
10.5
3.0
0.0
2006
107
77
0.44
0.54
13.9
7.8
27.3
24.4
0.000
N/A
N/A
21.4
14.8
10.2
3.3
0.0
2005
109
67
0.53
0.73
14.6
7.8
30.6
22.2
0.000
N/A
N/A
18.3
15.2
8.7
2.7
0.0
2004
89
64
0.53
0.51
14.6
7.8
28.9
22.1
0.001
N/A
N/A
18.4
N/A
8.5
2.8
0.3
2003
85
64
0.57
0.49
15.6
8.5
27.6
20.5
0.003
N/A
N/A
N/A
N/A
8.4
3.0
0.4
2002
103
72
0.63
0.41
15.3
7.1
32.6
21.2
0.003
N/A
N/A
N/A
N/A
8.4
2.7
2.1
2001
108
83
0.72
0.56
17.5
8.8
32.3
22.2
0.005
N/A
N/A
N/A
N/A
9.1
3.9
1.5
2000
107
63
0.79
0.51
18.0
9.1
32.6
23.5
0.014
N/A
N/A
N/A
N/A
N/A
4.4
1.3
Natural disasters
Type
Charlotte
Fort Lauderdale
Tornado activity compared to U.S. average
111.5%
73.7%
Earthquake activity compared to U.S. average
79%
1.1%
Natural disasters compared to U.S. average
9%
27%
Transportation
Both cities have robust public transportation systems. Charlotte operates the CATS bus system and the LYNX light rail, while Fort Lauderdale has the BCT bus system and a free downtown trolley service. Traffic can be a concern in both cities, especially during peak commuting hours.
Transport
Type
Charlotte
Fort Lauderdale
Amtrak stations
1
1
Amtrak stations nearby
2
3
FAA registered aircraft
439
777
FAA registered aircraft manufacturers and dealers
12
178
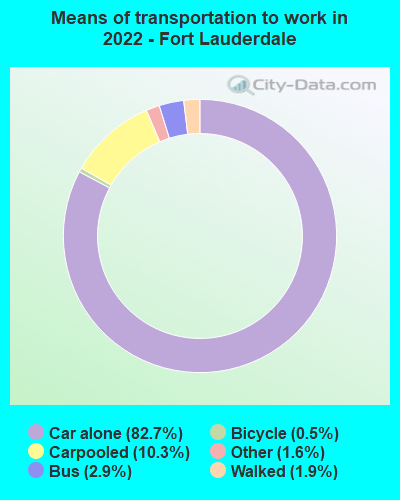
Means of transportation to work
Type
Charlotte
Fort Lauderdale
Bicycle
0.1%
0.7%
Bus
1.2%
2.3%
Carpooled
8.7%
9.4%
Car alone
86.2%
83.9%
Motorcycle
0.1%
0.1%
Railroad
0.4%
0.2%
Taxicab
0.2%
0.3%
Walked
1.5%
1.4%
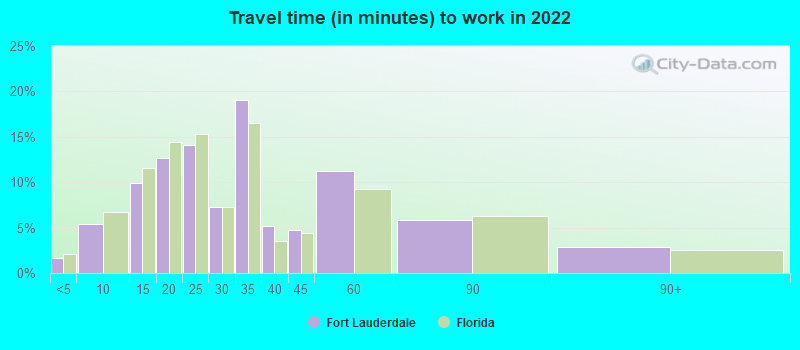
Average travel time to work
Type
Charlotte
Fort Lauderdale
Average
29.6 min
30.6 min
Other means
24.9 min
24.3 min
Public transportation
44.1 min
44.2 min
Private vehicle occupancy
Type
Charlotte
Fort Lauderdale
Average
1.2
1.1
Drove alone
90%
92%
In 2 person carpool
6.9%
4.3%
In 3 person carpool
1.8%
1.5%
In 4 person carpool
0.8%
1.8%
In 5-6 person carpool
0.5%
0.4%
How many people usually rode to work in the car, truck or van.
Real Estate
Real estate is generally more affordable in Charlotte, with a median home price lower than the national average. In contrast, Fort Lauderdale's median home price is significantly higher due to its coastal location and higher demand from buyers looking for vacation homes or rentals.
Neighborhoods
Charlotte features several charming neighborhoods like Uptown, NoDa, and South End, each with their own unique vibe. Fort Lauderdale offers numerous beachfront neighborhoods like Central Beach, Harbor Beach and Rio Vista, making it an ultimate destination for beach lovers.
Houses and residents
Type
Charlotte
Fort Lauderdale
Houses
393,631
102,567
Average household size (people)
2.5
2.2
Median year apartment built
1998
1980
Median year house/condo built
1993
1967
Length of stay in the house since moving in
11.8 years
12.2 years
Houses occupied
365,269 (92.8%)
83,021 (80.9%)
Houses occupied by owners
193,930 (53.1%)
45,636 (55%)
Houses occupied by renters
171,339 (46.9%)
37,385 (45%)
Median rent asked for vacant for-rent units
$1,482
$2,515
Median monthly housing costs
$1,302
$1,596
Median price asked for vacant for-sale houses and condos
$445,491
$748,970
Estimated median house or condo value
$321,400
$395,500
Median numbers of rooms
5.3
4.2
Median number of rooms in apartments
4
3.5
Median number of rooms in houses and condos
6.6
5.3
Median house price - detached houses
$388,029
$647,246
Median house price - in 2-unit structures
$184,325
$472,086
Median house price - in 3-to-4-unit structures
$178,624
$279,116
Median house price - in 5 or more unit structures
$433,957
$452,065
Median house price - mobile homes
$52,977
$11,509
Median house price - Townhouses or other attached units
$296,370
$481,001
Median house price - All housing units
$378,423
$563,930
Median house age
26
48
Renting percentage
42.6%
45.1%
Housing density (houses/condos per square mile)
1,624.8
3,232.6
House value disparities
33.3%
33.8%
Household income disparities
44.1%
47.8%
Median household income for houses/condes with a mortgage
$105,905
$109,017
Median household income for apartments without a mortgage
$70,681
$67,158
Housing units without a mortgage
3,089 (2.1%)
680 (2.6%)
Housing units with both a second mortgage and home equity loan
10,553 (7.2%)
2,034 (7.6%)
Housing units with a mortgage
142,912 (97.9%)
25,967 (97.4%)
Housing units with a home equity loan
171 (0.1%)
43 (0.2%)
Housing units with a second mortgage
13,532 (9.3%)
2,270 (8.5%)
House/condo owner moved in on average (years ago)
9
9
House/condo renter moved in on average (years ago)
1
1
Housing units lacking complete kitchen facilities
0.8%
1%
Housing units lacking complete plumbing facilities
0.2%
0.5%
Housing units in structures
Housing units in structures
Charlotte
Fort Lauderdale
One, detached
52.7%
33.2%
One, attached
9.1%
4.5%
Two
0.9%
4.7%
3 or 4
2.9%
6.9%
5 to 9
7.1%
4.5%
10 to 19
9.5%
5.8%
20 to 49
6.2%
9.2%
50 or more
10.3%
30.3%
Mobile homes
1.4%
1.0%
Median real estate property taxes paid for housing units
Self-employed workers in own not incorporated business
25,780
5,015
State government workers
16,519
2,685
Unpaid family workers
1,214
65
Industries and Occupations
Charlotte is a major financial hub, hosting the headquarters of Bank of America and significant operations for Wells Fargo. Healthcare and retail are also significant employers. In contrast, Fort Lauderdale has a strong tourism and hospitality sector, along with marine industries and healthcare.
Both cities have an excellent healthcare ecosystem. In Charlotte, Atrium Health and Novant Health are the key providers. For Lauderdale, in contrast, Broward Health system and Holy Cross Hospital are major providers. Both cities rank high in terms of medical facilities and patient satisfaction rates.
Health (county statistics)
Type
Charlotte
Fort Lauderdale
General health status score of residents in this county from 1 (poor) to 5 (excellent)
Both cities have substantial infrastructure with international airports, highways, and public transit systems. Charlotte's fast-growing population has led to massive infrastructure development projects. Meanwhile, Fort Lauderdale, with its extensive system of waterways, is known as the "Venice of America."
Infrastructure
Type
Charlotte
Fort Lauderdale
Hospitals
37
13
TV stations
16
27
Bank branches located here
202
107
Bank institutions located here
26
42
Main business address for public companies
33
17
Nuclear power plants nearby
2
0
Drinking water stations with no reported violations in the past
24
0
Drinking water stations with reported violations in the past
HMDA - Conventional home purchase loans - Applications denied
Year
Charlotte
Fort Lauderdale
1999
3,049
876
2000
1,568
752
2001
1,382
645
2002
1,275
540
2003
1,879
827
2004
2,415
1,511
2005
3,078
2,418
2006
3,864
2,642
2007
3,106
1,899
2008
1,287
705
2009
617
372
Culture and Food
The culture in Charlotte is a sophisticated blend of Southern charm and big-city vibes, with a vibrant arts scene and a diverse culinary landscape. In contrast, Fort Lauderdale's culture is heavily influenced by its seaside location and vibrant nightlife, with plenty of fresh seafood, Cuban cuisine, and upscale dining options.
Sports Teams
Charlotte is home to the NFL's Carolina Panthers and the NBA's Charlotte Hornets. Fort Lauderdale, on the other hand, does not have major league teams, but residents have access to Miami's teams, including the NFL's Miami Dolphins and NBA's Miami Heat.


 Charlotte, NC
 Fort Lauderdale, FL