Comparing the lifestyle, living conditions, and attractions between Charlotte, North Carolina, and Miami, Florida, one can observe fascinating contrasts and diversity. Both cities have their individualistic charm, climatic conditions, economic profiles and offer unique experiences, pertinent to both relocating individuals and tourists. Given are the in-depth comparisons on different aspects between the two cities.
Distance between
Charlotte, NC and
Miami, FL : 651.8 miles
Charlotte's population is larger by 100%. Its population has grown by 338,881 people (62.7%) since 2000. The population of Miami has grown by 77,420 people (21.4%) during that time.
Charlotte is relatively safer than Miami. The crime rate in Charlotte is around average for a US city, while Miami has a notably higher crime rate. Both cities have their safe and less safe neighborhoods and residents and visitors are advised to be aware of their surroundings.
Cost of Living
Generally, the cost of living is lower in Charlotte compared to Miami. This difference is primarily noticeable in housing costs. However, Miami offers a wider variety of high-end luxury living options, while Charlotte has more affordable housing opportunities.
Income Tax
One major advantage of living in Miami, Florida is there's no state income tax. In contrast, the state of North Carolina has a flat state income tax rate of 5.25%.
Property Tax
Charlotte has a lower property tax rate than Miami. The average property tax in Charlotte is 0.83% compared to Miami's 1.02%.
Sales Tax
Charlotte, North Carolina, has a combined city and state sales tax rate of 7.25%, while the combined tax rate in Miami, Florida, stands at 7%.
Income
Type
Charlotte
Miami
Estimated median household income
$70,869
$48,789
Estimated per capita income
$44,593
$37,223
Cost of living index (U.S. average is 100)
93.2
110.1
If you make $50,000 in Charlotte, you will have to make $59,067 in Miami to maintain the same standard of living.
Geographical Conditions
Miami is located on the Atlantic coast, offering residents and visitors beautiful beach-front landscapes and proximity to the Florida Keys. Charlotte is further inland and known for its rolling hills. It is close to both the mountains and the coast, offering a broad range of outdoor activities.
Charlotte has a commendable education system. The Charlotte-Mecklenburg Schools, being the second largest in North Carolina, offer quality education. Miami also has a reputable education network, and the Miami-Dade County Public Schools is the 4th largest school district in the nation. Both cities have prestigious universities, offering numerous opportunities for higher education.
Charlotte's economy is robust with strong sectors in banking, motor sports, and healthcare. It is the second largest banking center in the US. Miami has a diverse economy with booming tourism, international trade, finance, and health care sectors. The city is a draw for international business due to its close proximity to Latin America.
Biggest Employers
In Charlotte, some of the biggest employers include Bank of America, Wells Fargo, and Atrium Health. For Miami, large employers include Baptist Health South Florida, University of Miami and Miami-Dade County Public Schools.
In Charlotte (Mecklenburg County), 60.8% voted for Democrats and 38.3% for Republicans in 2012 Presidential Election. In Miami (Miami-Dade County), 61.8% voted for Democrats and 38.0% for Republicans.
Elections
Type
Democrats
Republicans
Other
Year
Charlotte
Miami
Charlotte
Miami
Charlotte
Miami
2020
66.8%
53.5%
31.6%
46.2%
1.6%
0.3%
2016
62.3%
63.4%
32.9%
33.9%
4.8%
2.7%
2012
60.8%
61.8%
38.3%
38.0%
0.9%
0.3%
2008
62.0%
58.1%
37.6%
41.9%
0.5%
0.0%
2004
51.7%
53.0%
48.0%
46.7%
0.3%
0.3%
2000
48.4%
52.7%
51.1%
46.4%
0.5%
0.9%
1996
48.6%
57.3%
45.9%
37.9%
5.5%
4.8%
Breakdown of population affiliated with a religious congregation
Type
Adherents
Congregations
Religion
Charlotte
Miami
Charlotte
Miami
SOUTHERN BAPTIST CONVENTION
9.0%
3.2%
19.0%
21.8%
CATHOLIC CHURCH
8.5%
21.8%
1.8%
4.5%
AMERICAN BAPTIST CHURCHES IN THE USA
2.3%
0.0%
1.1%
0.2%
EPISCOPAL CHURCH
1.2%
0.5%
1.3%
2.1%
EVANGELICAL LUTHERAN CHURCH IN AMERICA
0.9%
0.2%
1.8%
1.3%
PRESBYTERIAN CHURCH IN AMERICA
0.6%
0.1%
1.9%
1.0%
SEVENTH DAY ADVENTIST CHURCH
0.5%
1.1%
1.5%
4.3%
MUSLIM ESTIMATE
0.3%
0.9%
1.2%
1.0%
Weather
When it comes to weather, Miami benefits from a tropical monsoon climate, which means hot, humid summers and short, warm winters. On the other hand, Charlotte experiences a humid subtropical climate, with hot, humid summers and cool winters, including periods of snow. Miami's weather can be a draw for tourists while Charlotte's moderate weather is preferred by some residents.
Weather and climate
Type
Charlotte
Miami
Temperature - Average
61°F
77.3°F
Humidity - Average morning or afternoon humidity
72.3%
77.3%
Humidity - Differences between morning and afternoon humidity
41%
31%
Humidity - Maximum monthly morning or afternoon humidity
87%
86%
Humidity - Minimum monthly morning or afternoon humidity
46%
55%
Precipitation - Yearly average
44.5 in
60 in
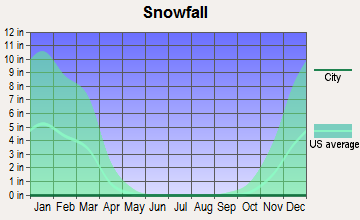
Snowfall - Yearly average
10.2 in
0 in
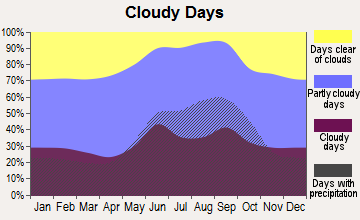
Clouds - Number of days clear of clouds
18.1%
12.3%
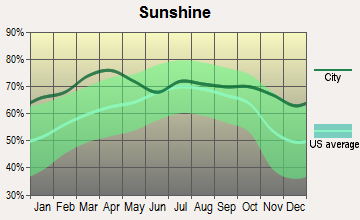
Sunshine amount - Average
69.8%
76.8%
Sunshine amount - Differences during a year
14%
16%
Sunshine amount - Maximum monthly
70%
79%
Sunshine amount - Minimum monthly
56%
63%
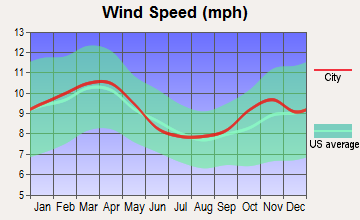
Wind speed - Average
6.9 mph
9.1 mph
Average climate in Charlotte, North Carolina
Average climate in Miami, Florida
Air pollution
Type
AQI
CO
NO2
OZONE
PB
PM10
PM25
SO2
Year
Charlotte
Miami
Charlotte
Miami
Charlotte
Miami
Charlotte
Miami
Charlotte
Charlotte
Miami
Charlotte
Miami
Charlotte
Miami
2018
75
72
0.24
0.24
6.3
2.7
27.8
31.8
N/A
N/A
15.5
15.5
8.2
8.6
0.2
0.3
2017
77
80
0.25
0.27
7.0
3.0
28.0
30.9
N/A
N/A
16.3
N/A
8.8
8.5
0.2
0.4
2016
82
68
0.25
0.30
7.6
2.9
28.7
32.6
N/A
N/A
N/A
N/A
8.4
7.2
0.2
0.0
2015
76
62
0.25
0.23
8.1
2.4
27.6
29.0
N/A
N/A
N/A
N/A
8.6
8.2
0.2
0.0
2014
76
71
0.26
0.21
8.5
3.8
26.3
30.7
N/A
N/A
N/A
N/A
9.3
8.0
0.3
0.0
2013
71
64
0.29
0.22
8.4
3.1
25.5
30.8
N/A
N/A
N/A
N/A
8.6
7.9
0.3
0.0
2012
95
71
0.28
0.19
8.7
2.9
27.3
32.1
N/A
N/A
N/A
N/A
9.7
8.7
0.3
0.0
2011
94
72
0.34
0.16
10.1
3.0
28.9
32.3
N/A
N/A
N/A
N/A
11.2
8.7
0.6
0.0
2010
97
77
0.33
0.31
11.8
4.2
28.0
32.3
N/A
N/A
N/A
N/A
11.6
9.1
1.0
0.0
2009
82
67
0.30
0.53
10.0
3.3
25.4
31.9
N/A
N/A
N/A
N/A
11.1
9.1
0.9
0.0
2008
102
95
0.32
0.55
11.2
3.8
27.6
31.0
N/A
N/A
N/A
18.0
13.0
10.5
2.1
0.0
2007
108
94
0.37
0.59
13.9
5.0
29.1
33.5
0.001
N/A
N/A
21.9
14.5
10.5
3.0
0.0
2006
107
87
0.44
0.48
13.9
5.8
27.3
34.6
0.000
N/A
N/A
22.3
14.8
10.2
3.3
0.0
2005
109
75
0.53
0.55
14.6
6.0
30.6
31.8
0.000
N/A
N/A
18.8
15.2
8.7
2.7
0.0
2004
89
69
0.53
1.02
14.6
5.9
28.9
31.3
0.001
N/A
N/A
19.5
N/A
8.5
2.8
0.3
2003
85
70
0.57
0.99
15.6
6.5
27.6
29.5
0.003
N/A
N/A
N/A
N/A
8.4
3.0
0.4
2002
103
75
0.63
0.71
15.3
6.3
32.6
30.2
0.003
N/A
N/A
N/A
N/A
8.4
2.7
2.1
2001
108
84
0.72
0.80
17.5
5.9
32.3
30.2
0.005
N/A
N/A
N/A
N/A
9.1
3.9
1.5
2000
107
66
0.79
0.89
18.0
6.7
32.6
31.1
0.014
N/A
N/A
N/A
N/A
N/A
4.4
1.3
Natural disasters
Type
Charlotte
Miami
Tornado activity compared to U.S. average
111.5%
63%
Earthquake activity compared to U.S. average
79%
1.1%
Natural disasters compared to U.S. average
9%
10%
Transportation
Miami offers a wide range of public transit options, including buses, Metrorail, and the free Metromover. On the other hand, Charlotte's public transportation includes the LYNX light rail and bus services, but is a city that generally depends more on cars.
Transport
Type
Charlotte
Miami
Amtrak stations
1
2
Amtrak stations nearby
2
3
FAA registered aircraft
439
1
FAA registered aircraft manufacturers and dealers
12
159
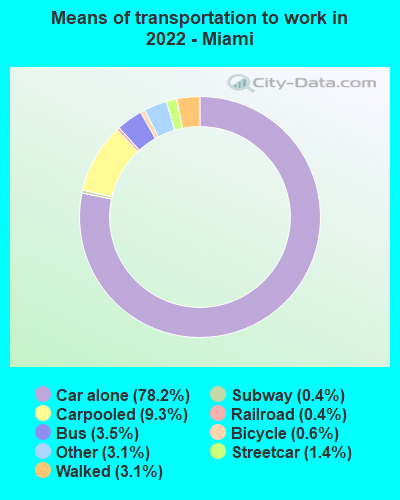
Means of transportation to work
Type
Charlotte
Miami
Bicycle
0.1%
0.8%
Bus
1.2%
3.8%
Carpooled
8.7%
8.5%
Car alone
86.2%
81.1%
Railroad
0.4%
0.2%
Streetcar
0%
0.5%
Subway
0%
0.3%
Taxicab
0.2%
0.2%
Walked
1.5%
2.6%
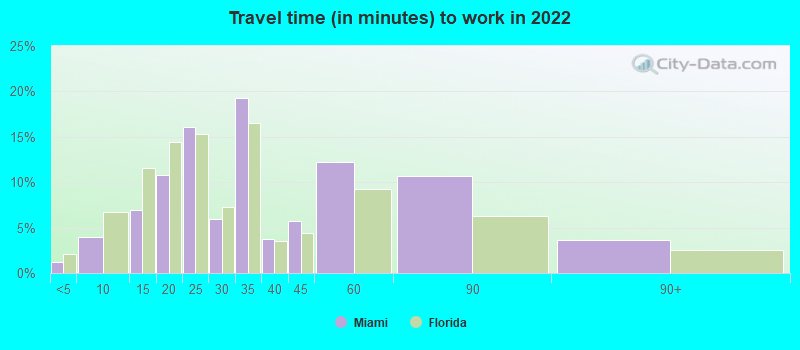
Average travel time to work
Type
Charlotte
Miami
Average
29.6 min
33.7 min
Other means
24.9 min
26.1 min
Public transportation
44.1 min
48.5 min
Private vehicle occupancy
Type
Charlotte
Miami
Average
1.2
1.1
Drove alone
90%
89%
In 2 person carpool
6.9%
9.2%
In 3 person carpool
1.8%
0.9%
In 4 person carpool
0.8%
0.4%
In 5-6 person carpool
0.5%
0.3%
In 7+ person carpool
0.1%
0.2%
How many people usually rode to work in the car, truck or van.
Real Estate
Real estate in Miami is on the higher end thanks to its demand among luxury seekers and the foreign market. In contrast, Charlotte offers more affordable housing options but has been experiencing a housing boom with growing prices in recent years.
Neighborhoods
Miami's neighborhoods offer a blend of vibrant nightlife, stellar dining and ocean views, such as Miami Beach and Coral Gables. Charlotte's neighborhoods, like Dilworth and Myers Park, offer a quieter, more suburban experience, filled with parks and family activities.
Houses and residents
Type
Charlotte
Miami
Houses
393,631
219,775
Average household size (people)
2.5
2.5
Median year apartment built
1998
1981
Median year house/condo built
1993
1968
Length of stay in the house since moving in
11.8 years
13.8 years
Houses occupied
365,269 (92.8%)
192,219 (87.5%)
Houses occupied by owners
193,930 (53.1%)
58,463 (30.4%)
Houses occupied by renters
171,339 (46.9%)
133,756 (69.6%)
Median rent asked for vacant for-rent units
$1,482
$2,006
Median monthly housing costs
$1,302
$1,456
Median price asked for vacant for-sale houses and condos
$445,491
$1,201,540
Estimated median house or condo value
$321,400
$411,300
Median numbers of rooms
5.3
3.8
Median number of rooms in apartments
4
3.4
Median number of rooms in houses and condos
6.6
5
Median house price - detached houses
$388,029
$499,839
Median house price - in 2-unit structures
$184,325
$427,603
Median house price - in 3-to-4-unit structures
$178,624
$107,725
Median house price - in 5 or more unit structures
$433,957
$570,126
Median house price - mobile homes
$52,977
$238,353
Median house price - Townhouses or other attached units
$296,370
$768,446
Median house price - All housing units
$378,423
$550,392
Median house age
26
43
Renting percentage
42.6%
67.7%
Housing density (houses/condos per square mile)
1,624.8
6,160.8
House value disparities
33.3%
31.5%
Household income disparities
44.1%
51.3%
Median household income for houses/condes with a mortgage
$105,905
$92,897
Median household income for apartments without a mortgage
$70,681
$52,201
Housing units without a mortgage
3,089 (2.1%)
686 (2.1%)
Housing units with both a second mortgage and home equity loan
10,553 (7.2%)
1,692 (5.1%)
Housing units with a mortgage
142,912 (97.9%)
32,656 (97.9%)
Housing units with a home equity loan
171 (0.1%)
36 (0.1%)
Housing units with a second mortgage
13,532 (9.3%)
2,892 (8.7%)
House/condo owner moved in on average (years ago)
9
10
House/condo renter moved in on average (years ago)
1
2
Housing units lacking complete kitchen facilities
0.8%
1.6%
Housing units lacking complete plumbing facilities
0.2%
0.8%
Housing units in structures
Housing units in structures
Charlotte
Miami
One, detached
52.7%
22.6%
One, attached
9.1%
9.7%
Two
0.9%
3.3%
3 or 4
2.9%
4.0%
5 to 9
7.1%
5.8%
10 to 19
9.5%
6.9%
20 to 49
6.2%
8.3%
50 or more
10.3%
39.2%
Mobile homes
1.4%
0.2%
Median real estate property taxes paid for housing units
Self-employed workers in own not incorporated business
25,780
26,340
State government workers
16,519
3,509
Unpaid family workers
1,214
695
Industries and Occupations
Charlotte is known for banking and finance, energy, and healthcare sectors. Its top occupations are in management, business, science and arts. Miami, with its vibrant nightlife and tourist industry, has a strong hospitality sector. The most common jobs are in sales, office and administrative support.
Both cities have excellent healthcare facilities. Miami has the renowned University of Miami Health System, and Charlotte has the highly-rated Atrium Health Carolinas Medical Center.
Health (county statistics)
Type
Charlotte
Miami
General health status score of residents in this county from 1 (poor) to 5 (excellent)
Both Charlotte and Miami boast well-developed infrastructures. However, due to its higher population density and tourist influx, Miami has a more extensive public transportation system and more high-rise development. Charlotte, while smaller, has a well-designed city layout and is reputed for its cleanliness.
Infrastructure
Type
Charlotte
Miami
Hospitals
37
47
TV stations
16
26
Arenas or stadiums
3
3
Bank branches located here
202
346
Bank institutions located here
26
53
Main business address for public companies
33
29
Nuclear power plants nearby
2
0
Drinking water stations with no reported violations in the past
24
9
Drinking water stations with reported violations in the past
HMDA - Conventional home purchase loans - Applications denied
Year
Charlotte
Miami
1999
3,049
0
2000
1,568
1,368
2001
1,382
1,354
2002
1,275
1,274
2003
1,879
1,618
2004
2,415
2,862
2005
3,078
4,991
2006
3,864
7,400
2007
3,106
5,318
2008
1,287
3,212
2009
617
888
Culture and Food
Each city rings true to its regional roots when it comes to culture and food. Miami teems with Latin American influences, and you can find cuisines from Cuban to Caribbean. In contrast, Charlotte represents Southern culture and offers classic Southern fare. The city is particularly known for its barbecue.
Sports Teams
Both cities are home to major professional sports teams. Charlotte boasts the NFL's Carolina Panthers and the NBA's Charlotte Hornets, while Miami has the NFL's Miami Dolphins, the NBA's Miami Heat, and MLB's Miami Marlins.


 Charlotte, NC
 Miami, FL