Charlotte and Raleigh, North Carolina, are two outstanding and attractive cities in the United States, each with its unique qualities. Raleigh is known for its research and technology roots and robust school systems, while Charlotte has a more laid-back, cosmopolitan vibe with a rich banking sector. As you consider relocation or just a visit, this comparison between the two based on different facets ranging from crime rates to healthcare will be beneficial.
Distance between
Charlotte, NC and
Raleigh, NC : 129.9 miles
Charlotte's population is larger by 88%. Its population has grown by 338,881 people (62.7%) since 2000. The population of Raleigh has grown by 193,031 people (69.9%) during that time.
Charlotte's crime rate tends to be higher than Raleigh's, with a violent crime rate of 6.66% compared to Raleigh's 3.73%. However, specific neighborhoods in both cities are safer than others, so a thorough assessment of these areas is recommended before settling. Both cities have active police departments, with community-oriented initiatives aimed at ensuring public safety.
Cost of Living
The cost of living in both cities is relatively similar, but Raleigh tends to be less expensive than Charlotte. Housing tends to be the largest factor in the cost of living difference, where Charlotte sees higher median home prices and rent costs. Grocery, health, and transportation costs are fairly comparable in both cities.
Income Tax
North Carolina has a flat income tax rate of 5.25%. So, the income tax for residents in both Charlotte and Raleigh are equal, regardless of earnings.
Property Tax
Raleigh enjoys a lower property tax rate than Charlotte. As of 2021, Raleigh's rate is 0.9964 per $100 of assessed value, while Charlotte's rate is 1.2972 per $100 of assessed value.
Sales Tax
The combined sales tax rate for both cities stands at 7.25%. This rate consists of 4.75% North Carolina state sales tax and 2.5% Charlotte or Raleigh city tax.
Income
Type
Charlotte
Raleigh
Estimated median household income
$70,869
$74,612
Estimated per capita income
$44,593
$44,001
Cost of living index (U.S. average is 100)
93.2
95.1
If you make $50,000 in Charlotte, you will have to make $51,019 in Raleigh to maintain the same standard of living.
Geographical Conditions
Geographically, both cities are located in the Piedmont region, characterized by rolling hills and lush landscapes. Charlotte is closer to the South Carolina border and the mountains, while Raleigh is closer to the North Carolina coast.
Raleigh shines in the education sector with top-ranking public and private schools and home to several universities, including North Carolina State University. Charlotte's school system is also respectable, but Raleigh's concentration of higher education institutions offers more opportunities for college education and postgraduate studies.
Charlotte is recognized as the second-largest banking center in the U.S, after New York, creating abundant job opportunities in finance and banking. Conversely, Raleigh, as part of the Research Triangle, boasts numerous tech, research, and development companies contributing significantly to the city's economy. Both cities have healthy job markets, but the area of focus differs.
Biggest Employers
Charlotte's largest employers include Bank of America, Wells Fargo, and Atrium Health. Raleigh's job market is heavily influenced by the Research Triangle Park nearby, and some of its biggest employers are North Carolina State University, Duke University, and WakeMed Health & Hospitals.
In Charlotte (Mecklenburg County), 60.8% voted for Democrats and 38.3% for Republicans in 2012 Presidential Election. In Raleigh (Wake County), 54.9% voted for Democrats and 43.5% for Republicans.
Elections
Type
Democrats
Republicans
Other
Year
Charlotte
Raleigh
Charlotte
Raleigh
Charlotte
Raleigh
2020
66.8%
62.3%
31.6%
35.9%
1.6%
1.8%
2016
62.3%
57.4%
32.9%
37.2%
4.8%
5.5%
2012
60.8%
54.9%
38.3%
43.5%
0.9%
1.6%
2008
62.0%
56.8%
37.6%
42.3%
0.5%
0.9%
2004
51.7%
48.7%
48.0%
50.9%
0.3%
0.4%
2000
48.4%
46.1%
51.1%
53.2%
0.5%
0.7%
1996
48.6%
45.9%
45.9%
48.2%
5.5%
5.9%
Breakdown of population affiliated with a religious congregation
Type
Adherents
Congregations
Religion
Charlotte
Raleigh
Charlotte
Raleigh
SOUTHERN BAPTIST CONVENTION
9.0%
9.0%
19.0%
22.5%
CATHOLIC CHURCH
8.5%
11.0%
1.8%
2.4%
AMERICAN BAPTIST CHURCHES IN THE USA
2.3%
0.4%
1.1%
0.6%
EPISCOPAL CHURCH
1.2%
1.1%
1.3%
1.8%
EVANGELICAL LUTHERAN CHURCH IN AMERICA
0.9%
0.6%
1.8%
1.1%
PRESBYTERIAN CHURCH IN AMERICA
0.6%
0.2%
1.9%
1.5%
SEVENTH DAY ADVENTIST CHURCH
0.5%
0.2%
1.5%
1.0%
LUTHERAN CHURCH
0.3%
0.4%
0.9%
0.6%
MUSLIM ESTIMATE
0.3%
1.1%
1.2%
1.0%
Weather
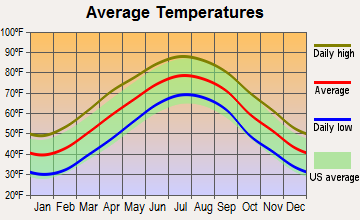
Weather-wise, Charlotte and Raleigh are quite similar. Both cities experience four distinct seasons with mild winters and hot, humid summers. However, Raleigh has slightly cooler winters due to its inland position, whereas Charlotte, on the Catawba River's banks, might have warmer, more humidity.
Weather and climate
Type
Charlotte
Raleigh
Temperature - Average
61°F
59.8°F
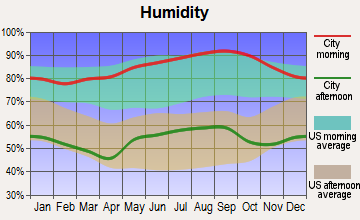
Humidity - Average morning or afternoon humidity
72.3%
73.7%
Humidity - Differences between morning and afternoon humidity
41%
44%
Humidity - Maximum monthly morning or afternoon humidity
87%
90%
Humidity - Minimum monthly morning or afternoon humidity
46%
46%
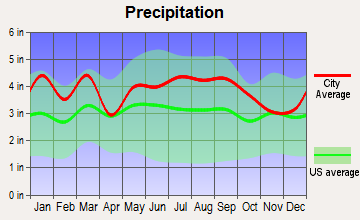
Precipitation - Yearly average
44.5 in
46.2 in
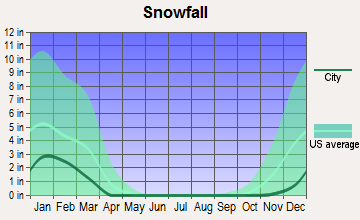
Snowfall - Yearly average
10.2 in
13.4 in
Clouds - Number of days clear of clouds
18.1%
18.5%
Sunshine amount - Average
69.8%
63.9%
Sunshine amount - Differences during a year
14%
13%
Sunshine amount - Maximum monthly
70%
64%
Sunshine amount - Minimum monthly
56%
51%
Wind speed - Average
6.9 mph
7.1 mph
Average climate in Charlotte, North Carolina
Average climate in Raleigh, North Carolina
Air pollution
Type
AQI
CO
NO2
OZONE
PB
PM10
PM25
SO2
Year
Charlotte
Raleigh
Charlotte
Raleigh
Charlotte
Raleigh
Charlotte
Raleigh
Charlotte
Charlotte
Raleigh
Charlotte
Raleigh
Charlotte
Raleigh
2018
75
71
0.24
0.23
6.3
4.9
27.8
27.5
N/A
N/A
15.5
14.6
8.2
9.5
0.2
0.2
2017
77
70
0.25
0.23
7.0
5.5
28.0
25.8
N/A
N/A
16.3
14.7
8.8
9.3
0.2
0.2
2016
82
80
0.25
0.23
7.6
5.6
28.7
26.9
N/A
N/A
N/A
8.7
8.4
10.0
0.2
0.3
2015
76
79
0.25
0.27
8.1
5.7
27.6
28.6
N/A
N/A
N/A
12.4
8.6
11.0
0.2
0.3
2014
76
74
0.26
0.26
8.5
6.0
26.3
29.9
N/A
N/A
N/A
N/A
9.3
11.2
0.3
0.3
2013
71
72
0.29
0.26
8.4
N/A
25.5
26.9
N/A
N/A
N/A
N/A
8.6
10.7
0.3
0.4
2012
95
80
0.28
0.28
8.7
N/A
27.3
29.7
N/A
N/A
N/A
N/A
9.7
9.5
0.3
0.6
2011
94
84
0.34
0.27
10.1
N/A
28.9
32.9
N/A
N/A
N/A
N/A
11.2
10.3
0.6
0.7
2010
97
89
0.33
0.30
11.8
N/A
28.0
32.4
N/A
N/A
N/A
N/A
11.6
10.9
1.0
1.0
2009
82
77
0.30
0.30
10.0
N/A
25.4
27.8
N/A
N/A
N/A
N/A
11.1
10.3
0.9
1.0
2008
102
99
0.32
0.36
11.2
N/A
27.6
32.3
N/A
N/A
N/A
N/A
13.0
12.5
2.1
1.4
2007
108
98
0.37
0.40
13.9
N/A
29.1
35.7
0.001
N/A
N/A
N/A
14.5
13.9
3.0
1.2
2006
107
90
0.44
0.44
13.9
N/A
27.3
31.9
0.000
N/A
N/A
N/A
14.8
13.5
3.3
0.9
2005
109
80
0.53
0.38
14.6
N/A
30.6
33.9
0.000
N/A
N/A
N/A
15.2
N/A
2.7
2.5
2004
89
82
0.53
0.40
14.6
N/A
28.9
28.4
0.001
N/A
N/A
N/A
N/A
N/A
2.8
2.6
2003
85
82
0.57
N/A
15.6
N/A
27.6
29.9
0.003
N/A
N/A
N/A
N/A
N/A
3.0
3.0
2002
103
89
0.63
N/A
15.3
N/A
32.6
36.1
0.003
N/A
N/A
N/A
N/A
N/A
2.7
2.6
2001
108
128
0.72
N/A
17.5
N/A
32.3
34.5
0.005
N/A
N/A
N/A
N/A
N/A
3.9
N/A
2000
107
115
0.79
0.64
18.0
N/A
32.6
34.1
0.014
N/A
N/A
N/A
N/A
N/A
4.4
N/A
Natural disasters
Type
Charlotte
Raleigh
Tornado activity compared to U.S. average
111.5%
95.1%
Earthquake activity compared to U.S. average
79%
52.6%
Natural disasters compared to U.S. average
9%
18%
Transportation
Both cities are car-centric but offer public transportation options. Charlotte's public transit system includes a light rail system, buses, and trolleys, while Raleigh's system primarily consists of buses. Traffic is generally more substantial in Charlotte than Raleigh, which could impact commute times.
Transport
Type
Charlotte
Raleigh
Amtrak stations
1
1
Amtrak stations nearby
2
3
FAA registered aircraft
439
499
FAA registered aircraft manufacturers and dealers
12
12
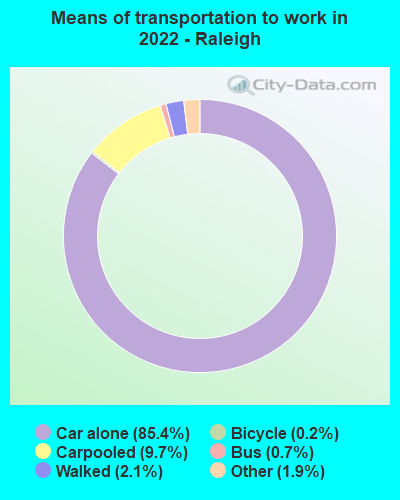
Means of transportation to work
Type
Charlotte
Raleigh
Bicycle
0.1%
0.2%
Bus
1.2%
1.1%
Carpooled
8.7%
8.5%
Car alone
86.2%
87.4%
Motorcycle
0.1%
0.1%
Railroad
0.4%
0%
Taxicab
0.2%
0.3%
Walked
1.5%
1.1%
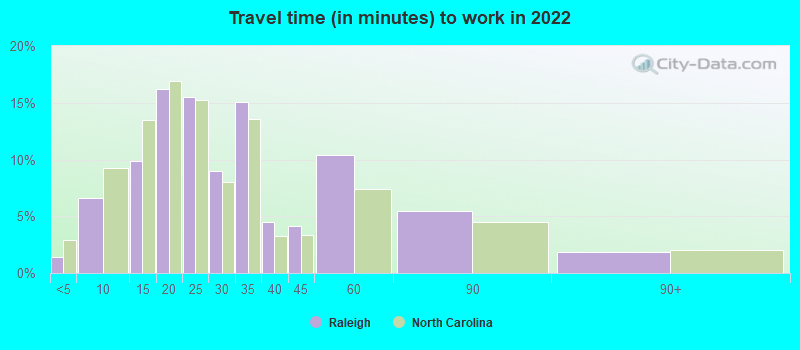
Average travel time to work
Type
Charlotte
Raleigh
Average
29.6 min
29.4 min
Other means
24.9 min
22.5 min
Public transportation
44.1 min
39.9 min
Private vehicle occupancy
Type
Charlotte
Raleigh
Average
1.2
1.1
Drove alone
90%
90.1%
In 2 person carpool
6.9%
7.6%
In 3 person carpool
1.8%
1.4%
In 4 person carpool
0.8%
0.3%
In 5-6 person carpool
0.5%
0.6%
How many people usually rode to work in the car, truck or van.
Real Estate
Charlotte has a more heated real estate market, with higher home values and rents compared to Raleigh. However, both cities offer a variety of rental and owned home options, varying by neighborhood and price range.
Neighborhoods
Both Charlotte and Raleigh have a diverse selection of neighborhoods catering to various lifestyles. In Charlotte, NoDa relishes in its artsy vibe, while Myers Park represents the upscale living. Raleigh's neighborhoods range from the quiet and family-friendly North Raleigh to the funky and vibrant Glenwood South.
Houses and residents
Type
Charlotte
Raleigh
Houses
393,631
217,866
Average household size (people)
2.5
2.4
Median year apartment built
1998
1995
Median year house/condo built
1993
1995
Length of stay in the house since moving in
11.8 years
11.5 years
Houses occupied
365,269 (92.8%)
194,917 (89.5%)
Houses occupied by owners
193,930 (53.1%)
103,367 (53%)
Houses occupied by renters
171,339 (46.9%)
91,550 (47%)
Median rent asked for vacant for-rent units
$1,482
$1,740
Median monthly housing costs
$1,302
$1,298
Median price asked for vacant for-sale houses and condos
$445,491
$302,120
Estimated median house or condo value
$321,400
$340,200
Median numbers of rooms
5.3
5.1
Median number of rooms in apartments
4
3.9
Median number of rooms in houses and condos
6.6
6.7
Median house price - detached houses
$388,029
$446,507
Median house price - in 2-unit structures
$184,325
$403,968
Median house price - in 3-to-4-unit structures
$178,624
$170,635
Median house price - in 5 or more unit structures
$433,957
$306,998
Median house price - mobile homes
$52,977
$31,622
Median house price - Townhouses or other attached units
$296,370
$292,086
Median house price - All housing units
$378,423
$404,828
Median house age
26
26
Renting percentage
42.6%
46.5%
Housing density (houses/condos per square mile)
1,624.8
1,901.1
House value disparities
33.3%
30.8%
Household income disparities
44.1%
45.4%
Median household income for houses/condes with a mortgage
$105,905
$114,680
Median household income for apartments without a mortgage
$70,681
$81,716
Housing units without a mortgage
3,089 (2.1%)
1,689 (2.1%)
Housing units with both a second mortgage and home equity loan
10,553 (7.2%)
6,627 (8.2%)
Housing units with a mortgage
142,912 (97.9%)
78,923 (97.9%)
Housing units with a home equity loan
171 (0.1%)
0 (0%)
Housing units with a second mortgage
13,532 (9.3%)
7,783 (9.7%)
House/condo owner moved in on average (years ago)
9
8
House/condo renter moved in on average (years ago)
1
1
Housing units lacking complete kitchen facilities
0.8%
0.6%
Housing units lacking complete plumbing facilities
0.2%
0.5%
Housing units in structures
Housing units in structures
Charlotte
Raleigh
One, detached
52.7%
45.0%
One, attached
9.1%
14.0%
Two
0.9%
1.2%
3 or 4
2.9%
4.6%
5 to 9
7.1%
6.3%
10 to 19
9.5%
12.4%
20 to 49
6.2%
6.0%
50 or more
10.3%
9.2%
Mobile homes
1.4%
1.2%
Median real estate property taxes paid for housing units
Self-employed workers in own not incorporated business
25,780
12,488
State government workers
16,519
19,792
Unpaid family workers
1,214
523
Industries and Occupations
Charlotte's banking and finance sector dominates its industry landscape, while Raleigh's science and tech industry drives its economy. Aside from banking, Charlotte also has healthcare, retail, and manufacturing industries. Raleigh, on the other hand, boasts sectors like education, healthcare, and government.
Healthcare facilities in both cities are commendable. Charlotte’s Atrium Health Carolinas Medical Center has been nationally recognized for several of its specialties. Meanwhile, Raleigh is close to Durham, home to the renowned Duke University Hospital.
Health (county statistics)
Type
Charlotte
Raleigh
General health status score of residents in this county from 1 (poor) to 5 (excellent)
Both cities boast impressive infrastructures, albeit different in focus. Charlotte offers more in terms of entertainment, with more malls and shops, while Raleigh is more organized around its universities and tech parks. In terms of connectivity, both cities have international airports and good highway access.
Infrastructure
Type
Charlotte
Raleigh
Hospitals
37
19
TV stations
16
20
Arenas or stadiums
3
3
Bank branches located here
202
136
Bank institutions located here
26
27
Main business address for public companies
33
21
Nuclear power plants nearby
2
1
Drinking water stations with no reported violations in the past
24
2
Drinking water stations with reported violations in the past
HMDA - Conventional home purchase loans - Applications denied
Year
Charlotte
Raleigh
1999
3,049
1,618
2000
1,568
890
2001
1,382
557
2002
1,275
510
2003
1,879
564
2004
2,415
700
2005
3,078
1,083
2006
3,864
1,097
2007
3,106
859
2008
1,287
424
2009
617
253
Culture and Food
When it comes to food and culture, both cities shine in their distinctive ways. Charlotte offers a modern, cosmopolitan culture, with a myriad of global cuisines. In contrast, Raleigh harbors a more collegiate atmosphere with a thriving food scene full of farm-to-table dining experiences and craft breweries.
Sports Teams
For sports lovers, Charlotte is home to the NFL's Panthers and the NBA's Hornets. Raleigh, on the other hand, hosts the NHL's Hurricanes and the North Carolina State University athletics.


 Charlotte, NC
 Raleigh, NC