When comparing Charlotte, North Carolina, and Shreveport, Louisiana, it's essential to consider several factors like crime rates, cost of living, education, and economic opportunities. Charlotte, a burgeoning finance hub, is known for economic opportunities and diverse cultural offerings. Whereas Shreveport, nestled near the Texas border, is recognized for lower cost of living and a strong sense of community. Deciding to relocate or visit either city depends on individual priorities, career goals, lifestyle preferences, and budget considerations.
Distance between
Charlotte, NC and
Shreveport, LA : 765.8 miles
Charlotte's population is larger by 378%. Its population has grown by 338,881 people (62.7%) since 2000. The population of Shreveport has decreased by 16,124 people (8.1%) during that time.
In terms of safety, both cities have crime rates higher than the national average, with Shreveport having a slightly higher rate. Charlotte, NC reports a more considerable scale of property crimes than Shreveport, LA. Although both municipalities have been working to reduce crime rates, potential relocators and visitors should stay informed about specific neighborhood crime statistics.
Cost of Living
The cost of living in Shreveport is lower than the national average, making it an affordable option for retirees and budget-conscious families. On the other hand, Charlotte, being a financial hub and economic powerhouse, has a higher cost of living driven primarily by housing costs.
Income Tax
Residents in both Charlotte and Shreveport will pay state income tax. In North Carolina, a flat rate of 5.25% applies, whereas Louisiana uses a progressive tax rate starting at 2% and climbing to 6%.
Property Tax
North Carolina's average effective property tax rate is 0.86%, while Louisiana's, one of the lowest in the country, is 0.52%.
Sales Tax
North Carolina has a state sales tax rate of 4.75%, and Mecklenburg County, where Charlotte is located, has an additional 2.5% for a total of 7.25%. The sales tax in Louisiana is 4.45%, with Caddo Parish, where Shreveport resides, adding 5.35% for a total of 9.8%.
Income
Type
Charlotte
Shreveport
Estimated median household income
$70,869
$42,034
Estimated per capita income
$44,593
$27,828
Cost of living index (U.S. average is 100)
93.2
84.7
If you make $50,000 in Shreveport, you will have to make $55,018 in Charlotte to maintain the same standard of living.
Geographical Conditions
Charlotte is nestled among rolling hills and abundant greenery, offering outdoor enthusiasts a myriad of activities from hiking to boating. Shreveport is in the Red River Valley with a flatter geography, and the city's proximity to lakes and reservoirs caters to boaters and fishermen.
Charlotte has a larger school district and offers more educational opportunities with numerous high-rated public and private schools. On the other hand, Shreveport has a more compact educational system, with fewer schools, but still maintaining a decent education standards.
Charlotte is home to several major corporations (e.g., Bank of America, Lowe's), contributing to the diverse economy focused on banking, healthcare, and professional services. Shreveport leans heavily on the healthcare, retail, and education sectors for employment.
Biggest Employers
Charlotte's largest employers include Atrium Health, Wells Fargo, and Bank of America, symbolizing the city's strong finance and healthcare sectors. While in Shreveport, Willis-Knighton Health System, Caddo Public Schools, and the City of Shreveport are among the biggest employers, reflecting its dependence on healthcare and public services.
In Charlotte (Mecklenburg County), 60.8% voted for Democrats and 38.3% for Republicans in 2012 Presidential Election. In Shreveport (Caddo Parish), 52.2% voted for Democrats and 47.1% for Republicans.
Elections
Type
Democrats
Republicans
Other
Year
Charlotte
Shreveport
Charlotte
Shreveport
Charlotte
Shreveport
2020
66.8%
52.8%
31.6%
46.0%
1.6%
1.3%
2016
62.3%
50.7%
32.9%
46.5%
4.8%
2.8%
2012
60.8%
52.2%
38.3%
47.1%
0.9%
0.7%
2008
62.0%
51.4%
37.6%
48.3%
0.5%
0.3%
2004
51.7%
48.8%
48.0%
51.2%
0.3%
0.0%
2000
48.4%
49.8%
51.1%
49.1%
0.5%
1.1%
1996
48.6%
79.7%
45.9%
17.8%
5.5%
2.5%
Breakdown of population affiliated with a religious congregation
Type
Adherents
Congregations
Religion
Charlotte
Shreveport
Charlotte
Shreveport
SOUTHERN BAPTIST CONVENTION
9.0%
27.7%
19.0%
23.1%
CATHOLIC CHURCH
8.5%
5.6%
1.8%
3.2%
AMERICAN BAPTIST CHURCHES IN THE USA
2.3%
0.0%
1.1%
0.0%
EPISCOPAL CHURCH
1.2%
1.2%
1.3%
1.6%
EVANGELICAL LUTHERAN CHURCH IN AMERICA
0.9%
0.2%
1.8%
0.9%
PRESBYTERIAN CHURCH IN AMERICA
0.6%
0.0%
1.9%
0.3%
SEVENTH DAY ADVENTIST CHURCH
0.5%
0.6%
1.5%
1.9%
MUSLIM ESTIMATE
0.3%
0.2%
1.2%
0.6%
INTERNA PENTECO HOLINESS CHURCH
0.1%
0.4%
0.5%
0.6%
SALVATION ARMY
0.1%
0.4%
0.4%
0.3%
Weather
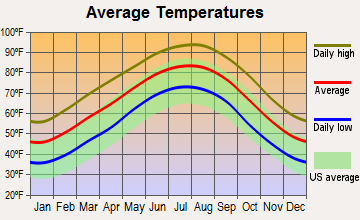
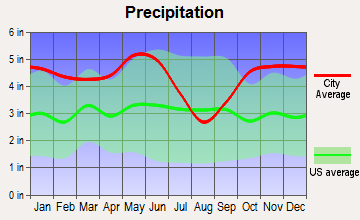
Weather-wise, Charlotte experiences a humid subtropical climate with hot summers and mild, cool winters. On the other hand, Shreveport also endures a humid subtropical climate, but the summers can be hotter. Both cities receive a fair share of rainfall throughout the year. Tourists should prepare according to the seasons they choose to visit.
Weather and climate
Type
Charlotte
Shreveport
Temperature - Average
61°F
65.5°F
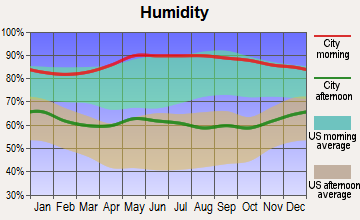
Humidity - Average morning or afternoon humidity
72.3%
78.3%
Humidity - Differences between morning and afternoon humidity
41%
36%
Humidity - Maximum monthly morning or afternoon humidity
87%
90%
Humidity - Minimum monthly morning or afternoon humidity
46%
54%
Precipitation - Yearly average
44.5 in
51.8 in
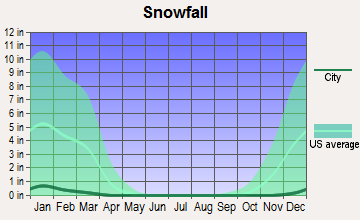
Snowfall - Yearly average
10.2 in
3 in
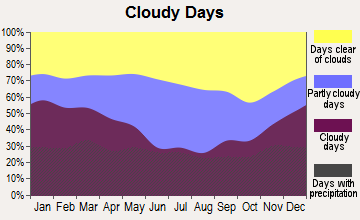
Clouds - Number of days clear of clouds
18.1%
19%
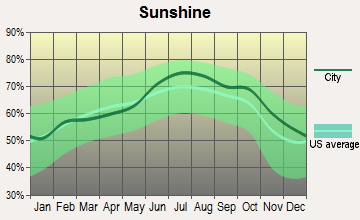
Sunshine amount - Average
69.8%
63.8%
Sunshine amount - Differences during a year
14%
25%
Sunshine amount - Maximum monthly
70%
70%
Sunshine amount - Minimum monthly
56%
45%
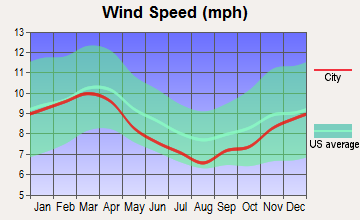
Wind speed - Average
6.9 mph
7.9 mph
Average climate in Charlotte, North Carolina
Average climate in Shreveport, Louisiana
Air pollution
Type
AQI
CO
NO2
OZONE
PB
PM10
PM25
SO2
Year
Charlotte
Shreveport
Charlotte
Charlotte
Charlotte
Shreveport
Charlotte
Charlotte
Shreveport
Charlotte
Shreveport
Charlotte
Shreveport
2018
75
64
0.24
N/A
6.3
N/A
27.8
25.7
N/A
N/A
15.5
18.5
8.2
6.5
0.2
0.8
2017
77
69
0.25
N/A
7.0
N/A
28.0
28.0
N/A
N/A
16.3
15.0
8.8
7.2
0.2
0.7
2016
82
66
0.25
N/A
7.6
N/A
28.7
27.4
N/A
N/A
N/A
17.4
8.4
9.0
0.2
1.5
2015
76
70
0.25
N/A
8.1
N/A
27.6
27.5
N/A
N/A
N/A
15.4
8.6
9.3
0.2
1.2
2014
76
69
0.26
N/A
8.5
N/A
26.3
27.1
N/A
N/A
N/A
15.3
9.3
9.8
0.3
1.1
2013
71
71
0.29
N/A
8.4
N/A
25.5
28.1
N/A
N/A
N/A
19.2
8.6
9.5
0.3
1.4
2012
95
72
0.28
N/A
8.7
N/A
27.3
28.7
N/A
N/A
N/A
21.4
9.7
8.5
0.3
N/A
2011
94
90
0.34
N/A
10.1
N/A
28.9
32.1
N/A
N/A
N/A
21.8
11.2
9.2
0.6
N/A
2010
97
88
0.33
N/A
11.8
N/A
28.0
30.5
N/A
N/A
N/A
20.3
11.6
9.2
1.0
N/A
2009
82
75
0.30
N/A
10.0
N/A
25.4
25.6
N/A
N/A
N/A
N/A
11.1
8.7
0.9
2.1
2008
102
72
0.32
N/A
11.2
N/A
27.6
26.1
N/A
N/A
N/A
N/A
13.0
9.5
2.1
2.3
2007
108
86
0.37
N/A
13.9
N/A
29.1
25.9
0.001
N/A
N/A
N/A
14.5
10.7
3.0
2.4
2006
107
91
0.44
N/A
13.9
N/A
27.3
29.7
0.000
N/A
N/A
N/A
14.8
10.9
3.3
2.7
2005
109
90
0.53
N/A
14.6
N/A
30.6
28.5
0.000
N/A
N/A
N/A
15.2
12.4
2.7
2.3
2004
89
81
0.53
N/A
14.6
N/A
28.9
24.7
0.001
N/A
N/A
N/A
N/A
10.3
2.8
2.5
2003
85
91
0.57
N/A
15.6
N/A
27.6
26.5
0.003
N/A
N/A
N/A
N/A
11.9
3.0
2.1
2002
103
80
0.63
N/A
15.3
N/A
32.6
25.8
0.003
N/A
N/A
N/A
N/A
10.0
2.7
1.3
2001
108
99
0.72
N/A
17.5
N/A
32.3
27.4
0.005
N/A
N/A
N/A
N/A
10.2
3.9
1.4
2000
107
98
0.79
N/A
18.0
N/A
32.6
27.9
0.014
N/A
N/A
N/A
N/A
10.7
4.4
1.1
Natural disasters
Type
Charlotte
Shreveport
Tornado activity compared to U.S. average
111.5%
226.4%
Earthquake activity compared to U.S. average
79%
448.8%
Natural disasters compared to U.S. average
9%
18%
Transportation
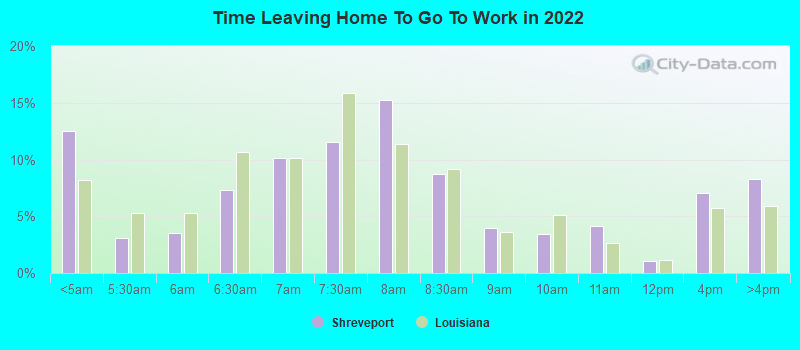
Charlotte boasts a robust public transportation system including light rail, bus services, and bike-share systems, whereas Shreveport has a more limited public transit system leaning heavily on buses. Both cities are car-dependent, but Charlotte has lower commute times.
Transport
Type
Charlotte
Shreveport
Amtrak stations
1
1
Amtrak stations nearby
2
2
FAA registered aircraft
439
334
FAA registered aircraft manufacturers and dealers
12
2
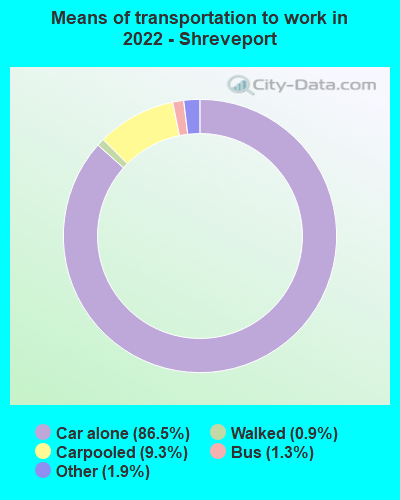
Means of transportation to work
Type
Charlotte
Shreveport
Bicycle
0.1%
0.1%
Bus
1.2%
1.6%
Carpooled
8.7%
8.8%
Car alone
86.2%
87.4%
Motorcycle
0.1%
0.2%
Railroad
0.4%
0%
Taxicab
0.2%
0.2%
Walked
1.5%
0.7%
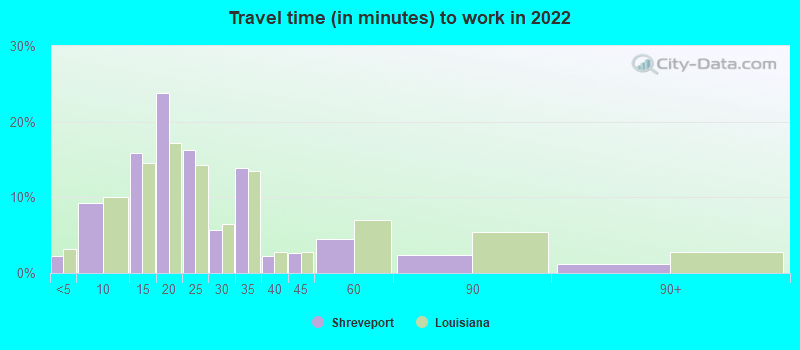
Average travel time to work
Type
Charlotte
Shreveport
Average
29.6 min
26 min
Other means
24.9 min
19.5 min
Public transportation
44.1 min
40 min
Private vehicle occupancy
Type
Charlotte
Shreveport
Average
1.2
1.1
Drove alone
90%
90.6%
In 2 person carpool
6.9%
7.5%
In 3 person carpool
1.8%
1.4%
In 4 person carpool
0.8%
0.2%
In 5-6 person carpool
0.5%
0.1%
In 7+ person carpool
0.1%
0.3%
How many people usually rode to work in the car, truck or van.
Real Estate
Charlotte's real estate market is known for its appreciating property values, with affordable housing in the city's outskirts. In Shreveport, however, real estate prices are lower with properties available across a range of budgets.
Neighborhoods
Charlotte offers diverse neighborhoods, from the upscale Myers Park to artsy Noda. Similarly, Shreveport has distinct neighborhoods like the historic Highland and South Highland areas, offering a blend of old and new houses.
Houses and residents
Type
Charlotte
Shreveport
Houses
393,631
90,211
Average household size (people)
2.5
2.4
Median year apartment built
1998
1975
Median year house/condo built
1993
1972
Length of stay in the house since moving in
11.8 years
14.7 years
Houses occupied
365,269 (92.8%)
76,167 (84.4%)
Houses occupied by owners
193,930 (53.1%)
40,664 (53.4%)
Houses occupied by renters
171,339 (46.9%)
35,503 (46.6%)
Median rent asked for vacant for-rent units
$1,482
$994.20
Median monthly housing costs
$1,302
$853
Median price asked for vacant for-sale houses and condos
$445,491
$46,043
Estimated median house or condo value
$321,400
$161,500
Median numbers of rooms
5.3
5.2
Median number of rooms in apartments
4
4.3
Median number of rooms in houses and condos
6.6
6.3
Median house price - detached houses
$388,029
$227,450
Median house price - in 2-unit structures
$184,325
$194,383
Median house price - in 3-to-4-unit structures
$178,624
$53,983
Median house price - in 5 or more unit structures
$433,957
$113,344
Median house price - mobile homes
$52,977
$70,748
Median house price - Townhouses or other attached units
$296,370
$167,641
Median house price - All housing units
$378,423
$222,391
Median house age
26
49
Renting percentage
42.6%
44.5%
Housing density (houses/condos per square mile)
1,624.8
874.6
House value disparities
33.3%
41.2%
Household income disparities
44.1%
49.7%
Median household income for houses/condes with a mortgage
$105,905
$74,880
Median household income for apartments without a mortgage
$70,681
$42,467
Housing units without a mortgage
3,089 (2.1%)
355 (1.5%)
Housing units with both a second mortgage and home equity loan
10,553 (7.2%)
677 (2.9%)
Housing units with a mortgage
142,912 (97.9%)
22,643 (98.5%)
Housing units with a home equity loan
171 (0.1%)
217 (0.9%)
Housing units with a second mortgage
13,532 (9.3%)
1,247 (5.4%)
House/condo owner moved in on average (years ago)
9
14
House/condo renter moved in on average (years ago)
1
2
Housing units lacking complete kitchen facilities
0.8%
4.1%
Housing units lacking complete plumbing facilities
0.2%
3.1%
Housing units in structures
Housing units in structures
Charlotte
Shreveport
One, detached
52.7%
68.7%
One, attached
9.1%
2.7%
Two
0.9%
2.1%
3 or 4
2.9%
5.8%
5 to 9
7.1%
8.7%
10 to 19
9.5%
4.2%
20 to 49
6.2%
2.9%
50 or more
10.3%
2.9%
Mobile homes
1.4%
2.1%
Median real estate property taxes paid for housing units
Self-employed workers in own not incorporated business
25,780
2,951
State government workers
16,519
5,454
Unpaid family workers
1,214
126
Industries and Occupations
Charlotte's dominant industries are finance, healthcare, and retail, whereas Shreveport's economy relies on healthcare, education, and retail. The workforce in Charlotte is more diversified, ranging from banking professionals to healthcare workers. In contrast, teachers, healthcare staff, and retail sector employees make up a significant proportion of Shreveport's workforce.
Charlotte has some of the country's top-rated hospitals, like the Carolinas Medical Center and Levine Children's Hospital. Shreveport, while smaller, has quality healthcare facilities, including the Willis-Knighton Medical Center and Ochsner LSU Health Hospital.
Health (county statistics)
Type
Charlotte
Shreveport
General health status score of residents in this county from 1 (poor) to 5 (excellent)
Charlotte is equipped with robust infrastructure, including a fast-growing light-rail system, significant freeway improvements, and an international airport. Shreveport's infrastructure isn't as extensive but is majorly serviced by local roads, Shreveport Regional Airport, and a public transit system.
Infrastructure
Type
Charlotte
Shreveport
Hospitals
37
45
TV stations
16
12
Arenas or stadiums
3
1
Bank branches located here
202
74
Bank institutions located here
26
18
Main business address for public companies
33
1
Nuclear power plants nearby
2
0
Drinking water stations with no reported violations in the past
24
1
Drinking water stations with reported violations in the past
HMDA - Conventional home purchase loans - Applications denied
Year
Charlotte
Shreveport
1999
3,049
622
2000
1,568
651
2001
1,382
693
2002
1,275
398
2003
1,879
374
2004
2,415
441
2005
3,078
726
2006
3,864
822
2007
3,106
465
2008
1,287
203
2009
617
105
Culture and Food
Both cities boast rich cultural scenes. Charlotte is known for its thriving arts community, access to regional Southern food, and varied music venues. Shreveport offers Cajun culture, a vibrant music scene, and delicious Creole and Southern cuisine.
Sports Teams
Chasing the thrill of a sports event, Charlotte's got you covered with nationally recognized teams like the Charlotte Hornets (NBA) and the Carolina Panthers (NFL). Shreveport, although lacks major professional teams, is home to the Shreveport Mudbugs, a junior ice hockey club that enjoys local support.


 Charlotte, NC
 Shreveport, LA